Embed Size (px)
Citation preview
Rental Affordability IndexKEY FINDINGS
NOVEMBER 2017 RELEASE
SGS Economics and Planning has taken all due care in the preparation of this report. However, SGS and its associated consultants are not liable to any person or entity for any damage or loss that has occurred, or may occur, in relation to that person or entity taking or not taking action in respect of any representation, statement, opinion or advice referred to herein.
SGS Economics and Planning Pty LtdACN 007 437 729www.sgsep.com.auOffices in Canberra, Hobart, Melbourne and Sydney
1 INTRODUCTION 11.1 Background and aim 1
1.2 Publication information 1
1.3 Acknowledgments 1
1.4 Method 1
Income 2
Median rents 2
Small area analysis 2
State-specific methodological considerations 3
2 NATIONAL TRENDS 42.1 Metropolitan areas 4
2.2 Rest of state areas 5
3 STATE TRENDS 63.1 New South Wales 6
Greater Sydney 6
Rest of NSW 6
3.2 Victoria 8
Greater Melbourne 8
Rest of Victoria 8
3.3 Queensland 10
Greater Brisbane 10
Rest of Queensland 10
3.4 South Australia 12
Greater Adelaide 12
Rest of SA 12
CONTENTS
3.5 Tasmania 14
Greater Hobart 14
Rest of Tasmania 14
3.6 Western Australia 16
Greater Perth 16
Rest of WA 16
3.7 ACT 18
4 SNAPSHOT OF LOWER INCOME HOUSEHOLDS
20
4.1 Introduction 20
4.2 Single pensioner 21
4.3 Pensioner couple 23
4.4 Single person on benefits 25
4.5 Single part-time worker parent on benefits 27
4.6 Single full-time working parents 29
4.7 Single income couple with children 31
4.8 Dual income couple with children 33
4.9 Student sharehouse 35
APPENDIX 1 37Metropolitan and rest of state analysis 37
Australian Capital Territory 37
New South Wales 37
Northern Territory 37
Queensland 37
South Australia 37
Tasmania 38
Victoria 38
Western Australia 38
APPENDIX 2 - REFERENCE LIST 39Reference list for household profiles 39
Rental Affordability Index 1
1.1 BACKGROUND AND AIM
National Shelter, Community Sector Banking and SGS have released the Rental Affordability Index (RAI) on a biannual basis since 2015. The RAI is a price index for housing rental markets. It is an easy to understand indicator of rental affordability relative to household incomes and is applied to geographic areas across Australia.
This report has been prepared in support of the fifth RAI release. To better illustrate the situation for vulnerable groups, this release continues to assess the rental affordability situation for eight Australian household types, with a focus on aged and key worker cohorts.
1.2 PUBLICATION INFORMATION
The RAI covers all states with available data. The Northern Territory does not form part of this release as rental bond data was not available to develop the RAI. The RAI tracks rental affordability relative to income for all households, but focuses specifically on very low and low income households. The indices are provided at metropolitan and balance of state levels. More detailed information is available at the postcode or LGA level across Australia in each quarter, where there is reliable data.
An interactive map of the RAI at the small geographical area level can be found at the following website:
http://www.sgsep.com.au/maps/thirdspace/#map1
This report presents the preliminary findings of the November 2017 release of the RAI. It provides an update of the May 2017 RAI report by providing analysis of data from the two most recent available quarters, March and June 2017. The report relies on rental bond data up to and including the June quarter of 2017.
1.3 ACKNOWLEDGEMENTS
The project partners wish to thank the following government bodies for the provision of data used in this report:
� Access Canberra, ACT Government � Australian Bureau of Statistics � Department of Family and Community Services, NSW � Department of Health and Human Services, Victoria � Department of Justice, Tasmania � Government of Western Australia Housing Authority � Residential Tenancies Authority, Queensland.
1.4 METHOD
It is generally accepted that if housing costs exceed 30 per cent of a low income household’s (lowest 40 per cent of households across all income bands) gross income, the household is experiencing housing stress (30/40 rule). That is, housing is unaffordable and housing costs consume a disproportionately high amount of household income.
The RAI uses the 30 per cent of income rule. Rental affordability is calculated using the following equation:
RAI = (Median income/qualifying income¹)*100
Households paying 30 per cent of income on rent have a RAI score of 100, indicating these households are at the critical threshold level for housing stress.
Households paying close to 30 per cent or more of their income on rent are generally seen to be in housing stress. Under those circumstances the cost of housing is affecting a household’s ability to pay for other primary needs including (but not limited to):
� Food � Power and water � Health services and medication � Travel and transport � Education � Household goods (such as cars, washing machines, fridges, stoves, computers) � Debt repayments.
INTRODUCTION 01
¹Qualifying income refers to the income required to pay rent where rent is 30% of income
2Rental Affordability Index
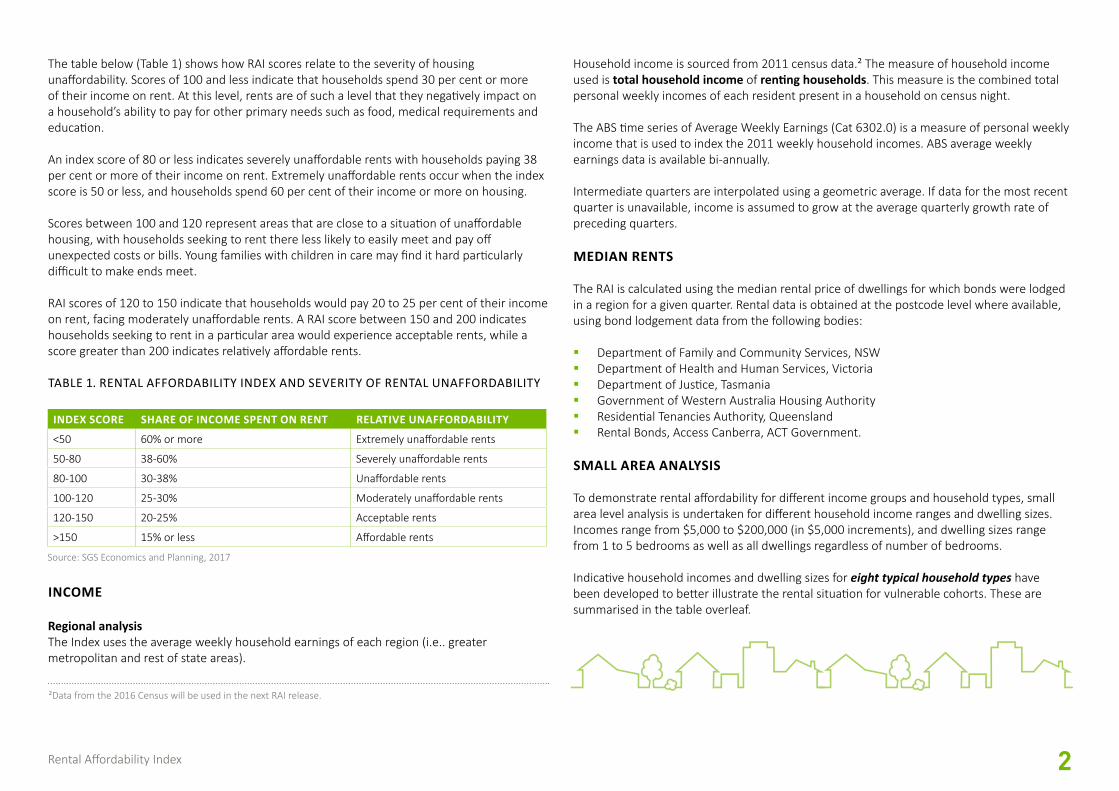
The table below (Table 1) shows how RAI scores relate to the severity of housing unaffordability. Scores of 100 and less indicate that households spend 30 per cent or more of their income on rent. At this level, rents are of such a level that they negatively impact on a household’s ability to pay for other primary needs such as food, medical requirements and education.
An index score of 80 or less indicates severely unaffordable rents with households paying 38 per cent or more of their income on rent. Extremely unaffordable rents occur when the index score is 50 or less, and households spend 60 per cent of their income or more on housing.
Scores between 100 and 120 represent areas that are close to a situation of unaffordable housing, with households seeking to rent there less likely to easily meet and pay off unexpected costs or bills. Young families with children in care may find it hard particularly difficult to make ends meet.
RAI scores of 120 to 150 indicate that households would pay 20 to 25 per cent of their income on rent, facing moderately unaffordable rents. A RAI score between 150 and 200 indicates households seeking to rent in a particular area would experience acceptable rents, while a score greater than 200 indicates relatively affordable rents.
TABLE 1. RENTAL AFFORDABILITY INDEX AND SEVERITY OF RENTAL UNAFFORDABILITY
INDEX SCORE SHARE OF INCOME SPENT ON RENT RELATIVE UNAFFORDABILITY
<50 60% or more Extremely unaffordable rents
50-80 38-60% Severely unaffordable rents
80-100 30-38% Unaffordable rents
100-120 25-30% Moderately unaffordable rents
120-150 20-25% Acceptable rents
>150 15% or less Affordable rents
Source: SGS Economics and Planning, 2017
INCOME
Regional analysisThe Index uses the average weekly household earnings of each region (i.e.. greater metropolitan and rest of state areas).
Household income is sourced from 2011 census data.² The measure of household income used is total household income of renting households. This measure is the combined total personal weekly incomes of each resident present in a household on census night.
The ABS time series of Average Weekly Earnings (Cat 6302.0) is a measure of personal weekly income that is used to index the 2011 weekly household incomes. ABS average weekly earnings data is available bi-annually.
Intermediate quarters are interpolated using a geometric average. If data for the most recent quarter is unavailable, income is assumed to grow at the average quarterly growth rate of preceding quarters.
MEDIAN RENTS
The RAI is calculated using the median rental price of dwellings for which bonds were lodged in a region for a given quarter. Rental data is obtained at the postcode level where available, using bond lodgement data from the following bodies:
� Department of Family and Community Services, NSW � Department of Health and Human Services, Victoria � Department of Justice, Tasmania � Government of Western Australia Housing Authority � Residential Tenancies Authority, Queensland � Rental Bonds, Access Canberra, ACT Government.
SMALL AREA ANALYSIS
To demonstrate rental affordability for different income groups and household types, small area level analysis is undertaken for different household income ranges and dwelling sizes. Incomes range from $5,000 to $200,000 (in $5,000 increments), and dwelling sizes range from 1 to 5 bedrooms as well as all dwellings regardless of number of bedrooms.
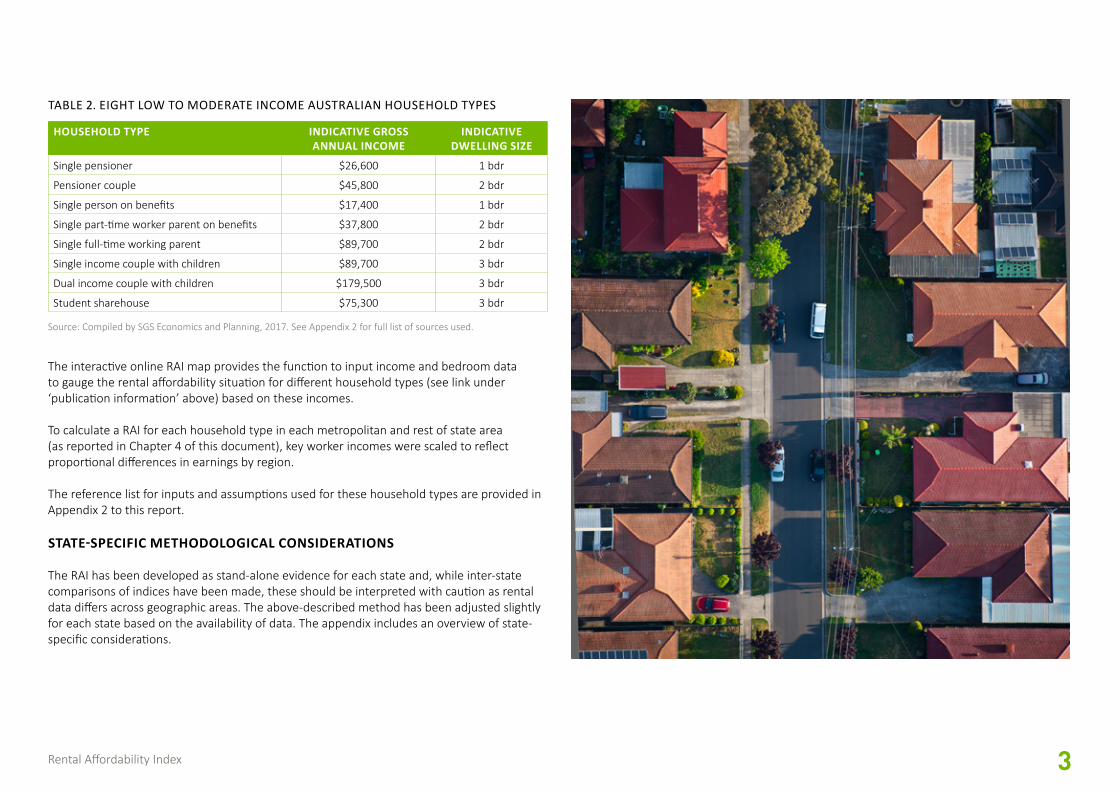
Indicative household incomes and dwelling sizes for eight typical household types have been developed to better illustrate the rental situation for vulnerable cohorts. These are summarised in the table overleaf.
²Data from the 2016 Census will be used in the next RAI release.
3Rental Affordability Index
HOUSEHOLD TYPE INDICATIVE GROSS ANNUAL INCOME
INDICATIVE DWELLING SIZE
Single pensioner $26,600 1 bdr
Pensioner couple $45,800 2 bdr
Single person on benefits $17,400 1 bdr
Single part-time worker parent on benefits $37,800 2 bdr
Single full-time working parent $89,700 2 bdr
Single income couple with children $89,700 3 bdr
Dual income couple with children $179,500 3 bdr
Student sharehouse $75,300 3 bdr
TABLE 2. EIGHT LOW TO MODERATE INCOME AUSTRALIAN HOUSEHOLD TYPES
Source: Compiled by SGS Economics and Planning, 2017. See Appendix 2 for full list of sources used.
The interactive online RAI map provides the function to input income and bedroom data to gauge the rental affordability situation for different household types (see link under ‘publication information’ above) based on these incomes.
To calculate a RAI for each household type in each metropolitan and rest of state area (as reported in Chapter 4 of this document), key worker incomes were scaled to reflect proportional differences in earnings by region.
The reference list for inputs and assumptions used for these household types are provided in Appendix 2 to this report.
STATE-SPECIFIC METHODOLOGICAL CONSIDERATIONS
The RAI has been developed as stand-alone evidence for each state and, while inter-state comparisons of indices have been made, these should be interpreted with caution as rental data differs across geographic areas. The above-described method has been adjusted slightly for each state based on the availability of data. The appendix includes an overview of state-specific considerations.
4Rental Affordability Index
NATIONAL TRENDS 022.1 METROPOLITAN AREAS
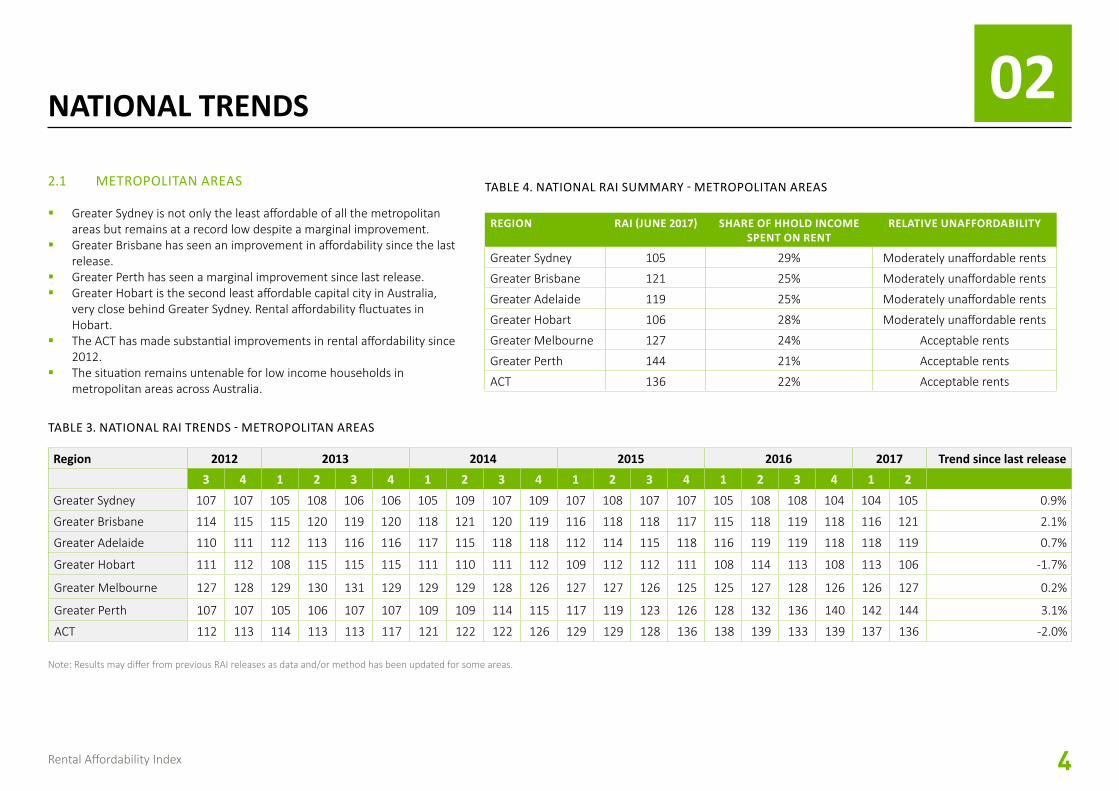
� Greater Sydney is not only the least affordable of all the metropolitan areas but remains at a record low despite a marginal improvement.
� Greater Brisbane has seen an improvement in affordability since the last release.
� Greater Perth has seen a marginal improvement since last release. � Greater Hobart is the second least affordable capital city in Australia,
very close behind Greater Sydney. Rental affordability fluctuates in Hobart.
� The ACT has made substantial improvements in rental affordability since 2012.
� The situation remains untenable for low income households in metropolitan areas across Australia.
TABLE 4. NATIONAL RAI SUMMARY - METROPOLITAN AREAS
TABLE 3. NATIONAL RAI TRENDS - METROPOLITAN AREAS
Note: Results may differ from previous RAI releases as data and/or method has been updated for some areas.
Region 2012 2013 2014 2015 2016 2017 Trend since last release3 4 1 2 3 4 1 2 3 4 1 2 3 4 1 2 3 4 1 2
Greater Sydney 107 107 105 108 106 106 105 109 107 109 107 108 107 107 105 108 108 104 104 105 0.9%
Greater Brisbane 114 115 115 120 119 120 118 121 120 119 116 118 118 117 115 118 119 118 116 121 2.1%
Greater Adelaide 110 111 112 113 116 116 117 115 118 118 112 114 115 118 116 119 119 118 118 119 0.7%
Greater Hobart 111 112 108 115 115 115 111 110 111 112 109 112 112 111 108 114 113 108 113 106 -1.7%
Greater Melbourne 127 128 129 130 131 129 129 129 128 126 127 127 126 125 125 127 128 126 126 127 0.2%
Greater Perth 107 107 105 106 107 107 109 109 114 115 117 119 123 126 128 132 136 140 142 144 3.1%
ACT 112 113 114 113 113 117 121 122 122 126 129 129 128 136 138 139 133 139 137 136 -2.0%
REGION RAI (JUNE 2017) SHARE OF HHOLD INCOME SPENT ON RENT
RELATIVE UNAFFORDABILITY
Greater Sydney 105 29% Moderately unaffordable rents
Greater Brisbane 121 25% Moderately unaffordable rents
Greater Adelaide 119 25% Moderately unaffordable rents
Greater Hobart 106 28% Moderately unaffordable rents
Greater Melbourne 127 24% Acceptable rents
Greater Perth 144 21% Acceptable rents
ACT 136 22% Acceptable rents
5Rental Affordability Index
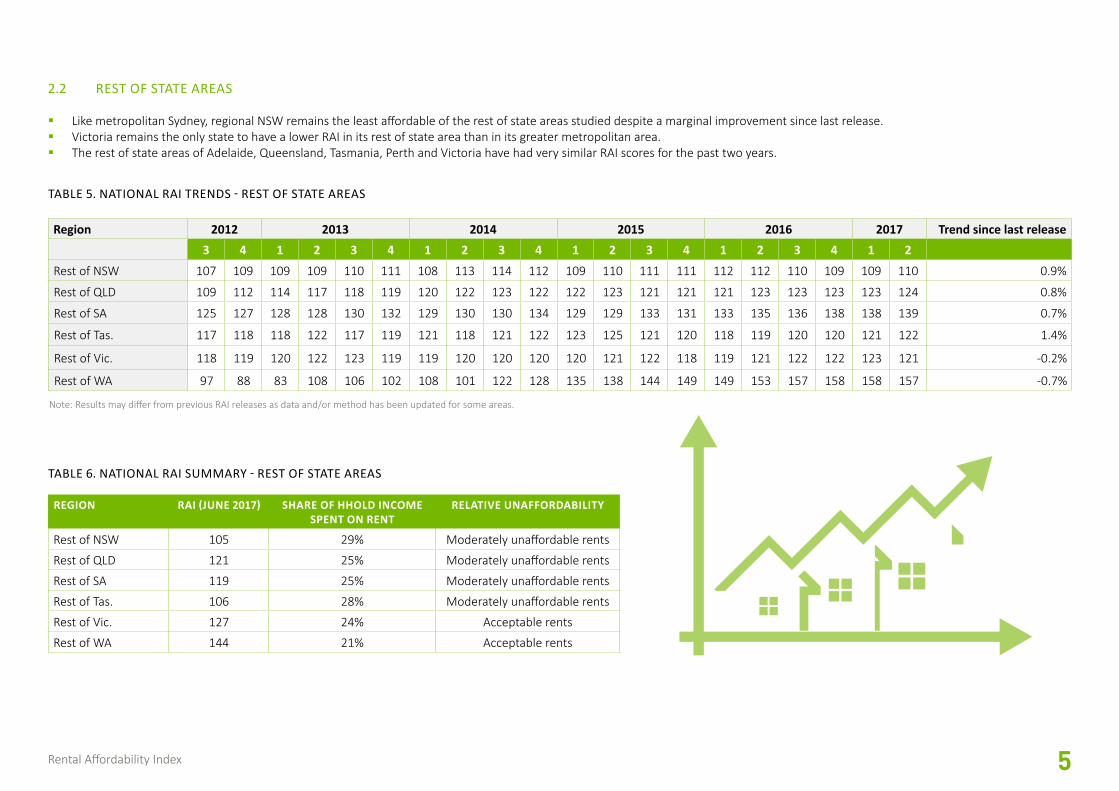
2.2 REST OF STATE AREAS
� Like metropolitan Sydney, regional NSW remains the least affordable of the rest of state areas studied despite a marginal improvement since last release. � Victoria remains the only state to have a lower RAI in its rest of state area than in its greater metropolitan area. � The rest of state areas of Adelaide, Queensland, Tasmania, Perth and Victoria have had very similar RAI scores for the past two years.
TABLE 6. NATIONAL RAI SUMMARY - REST OF STATE AREAS
TABLE 5. NATIONAL RAI TRENDS - REST OF STATE AREAS
Note: Results may differ from previous RAI releases as data and/or method has been updated for some areas.
Region 2012 2013 2014 2015 2016 2017 Trend since last release3 4 1 2 3 4 1 2 3 4 1 2 3 4 1 2 3 4 1 2
Rest of NSW 107 109 109 109 110 111 108 113 114 112 109 110 111 111 112 112 110 109 109 110 0.9%
Rest of QLD 109 112 114 117 118 119 120 122 123 122 122 123 121 121 121 123 123 123 123 124 0.8%
Rest of SA 125 127 128 128 130 132 129 130 130 134 129 129 133 131 133 135 136 138 138 139 0.7%
Rest of Tas. 117 118 118 122 117 119 121 118 121 122 123 125 121 120 118 119 120 120 121 122 1.4%
Rest of Vic. 118 119 120 122 123 119 119 120 120 120 120 121 122 118 119 121 122 122 123 121 -0.2%
Rest of WA 97 88 83 108 106 102 108 101 122 128 135 138 144 149 149 153 157 158 158 157 -0.7%
REGION RAI (JUNE 2017) SHARE OF HHOLD INCOME SPENT ON RENT
RELATIVE UNAFFORDABILITY
Rest of NSW 105 29% Moderately unaffordable rents
Rest of QLD 121 25% Moderately unaffordable rents
Rest of SA 119 25% Moderately unaffordable rents
Rest of Tas. 106 28% Moderately unaffordable rents
Rest of Vic. 127 24% Acceptable rents
Rest of WA 144 21% Acceptable rents
6Rental Affordability Index
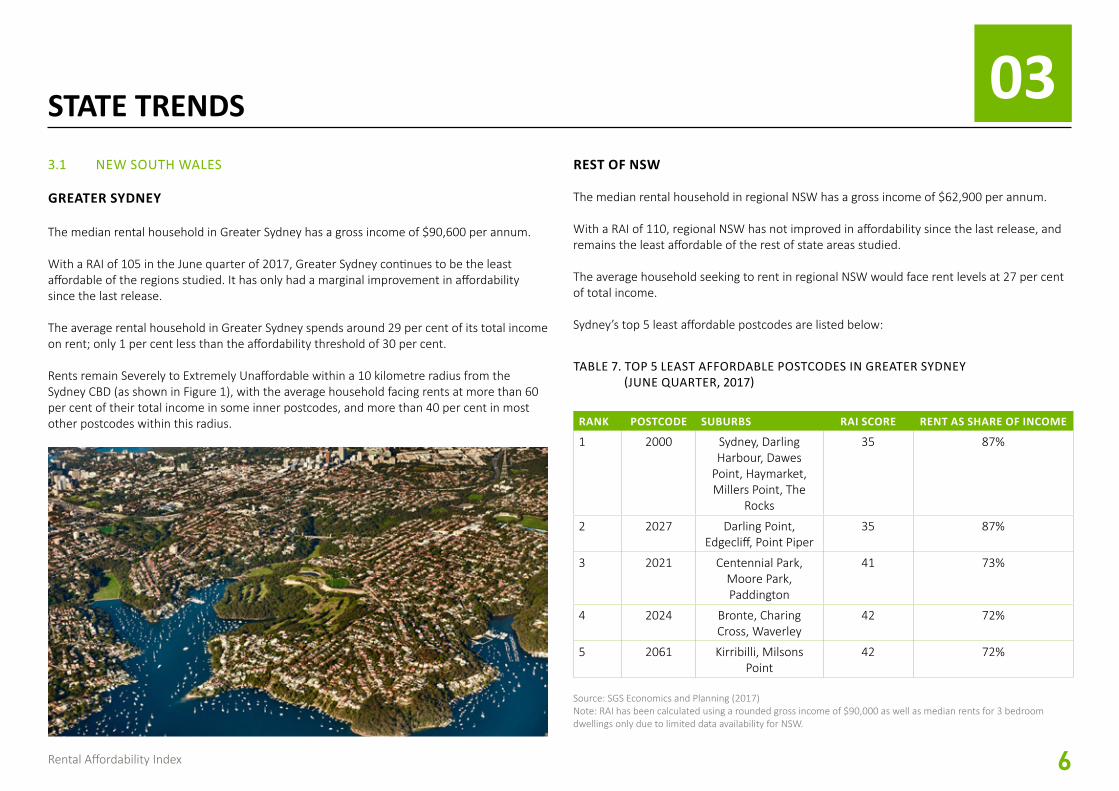
STATE TRENDS 033.1 NEW SOUTH WALES GREATER SYDNEY
The median rental household in Greater Sydney has a gross income of $90,600 per annum.
With a RAI of 105 in the June quarter of 2017, Greater Sydney continues to be the least affordable of the regions studied. It has only had a marginal improvement in affordability since the last release.
The average rental household in Greater Sydney spends around 29 per cent of its total income on rent; only 1 per cent less than the affordability threshold of 30 per cent.
Rents remain Severely to Extremely Unaffordable within a 10 kilometre radius from the Sydney CBD (as shown in Figure 1), with the average household facing rents at more than 60 per cent of their total income in some inner postcodes, and more than 40 per cent in most other postcodes within this radius. RANK POSTCODE SUBURBS RAI SCORE RENT AS SHARE OF INCOME
1 2000 Sydney, Darling Harbour, Dawes
Point, Haymarket, Millers Point, The
Rocks
35 87%
2 2027 Darling Point, Edgecliff, Point Piper
35 87%
3 2021 Centennial Park, Moore Park, Paddington
41 73%
4 2024 Bronte, Charing Cross, Waverley
42 72%
5 2061 Kirribilli, Milsons Point
42 72%
TABLE 7. TOP 5 LEAST AFFORDABLE POSTCODES IN GREATER SYDNEY (JUNE QUARTER, 2017)
Source: SGS Economics and Planning (2017)Note: RAI has been calculated using a rounded gross income of $90,000 as well as median rents for 3 bedroom dwellings only due to limited data availability for NSW.
REST OF NSW
The median rental household in regional NSW has a gross income of $62,900 per annum.
With a RAI of 110, regional NSW has not improved in affordability since the last release, and remains the least affordable of the rest of state areas studied.
The average household seeking to rent in regional NSW would face rent levels at 27 per cent of total income.
Sydney’s top 5 least affordable postcodes are listed below:
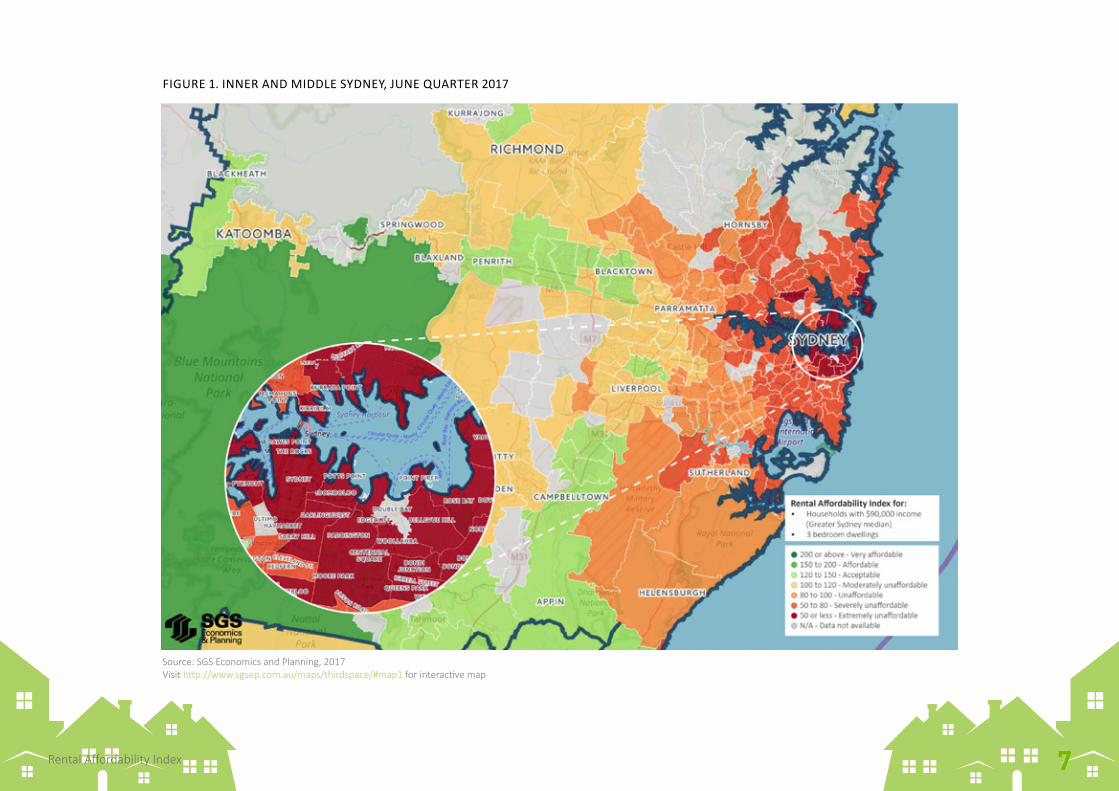
FIGURE 1. INNER AND MIDDLE SYDNEY, JUNE QUARTER 2017
Source: SGS Economics and Planning, 2017Visit http://www.sgsep.com.au/maps/thirdspace/#map1 for interactive map
7Rental Affordability Index
8Rental Affordability Index
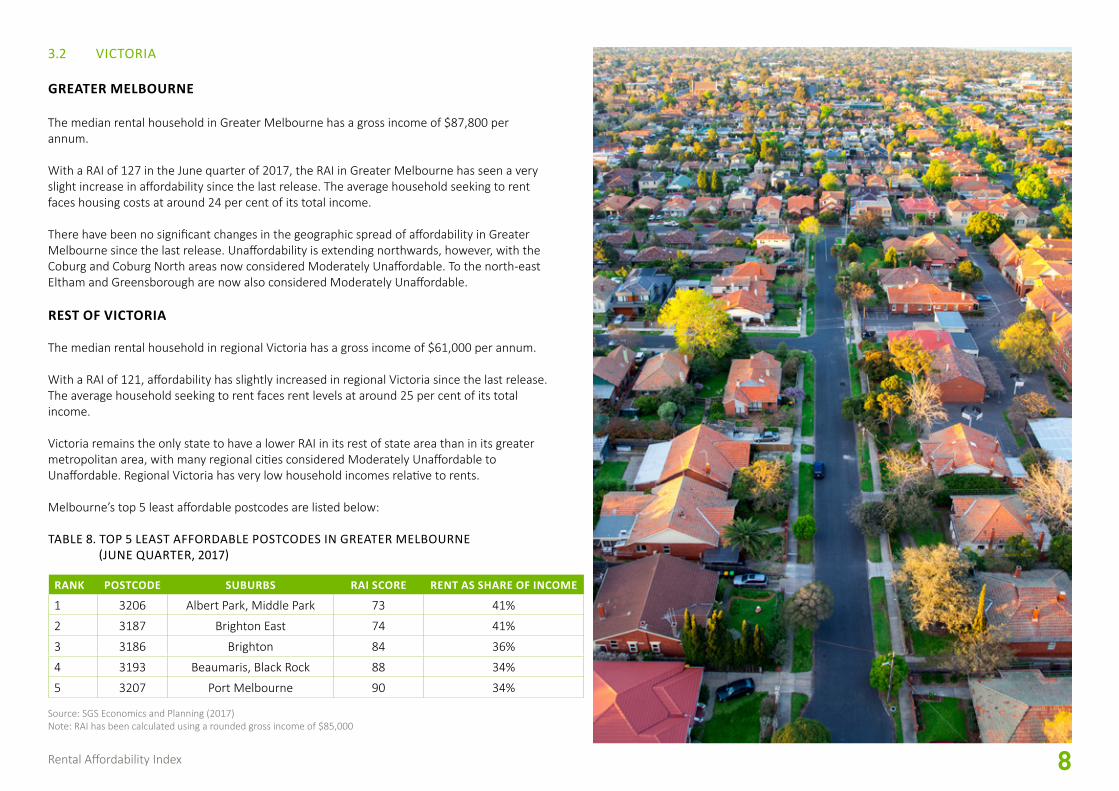
3.2 VICTORIA
GREATER MELBOURNE
The median rental household in Greater Melbourne has a gross income of $87,800 per annum.
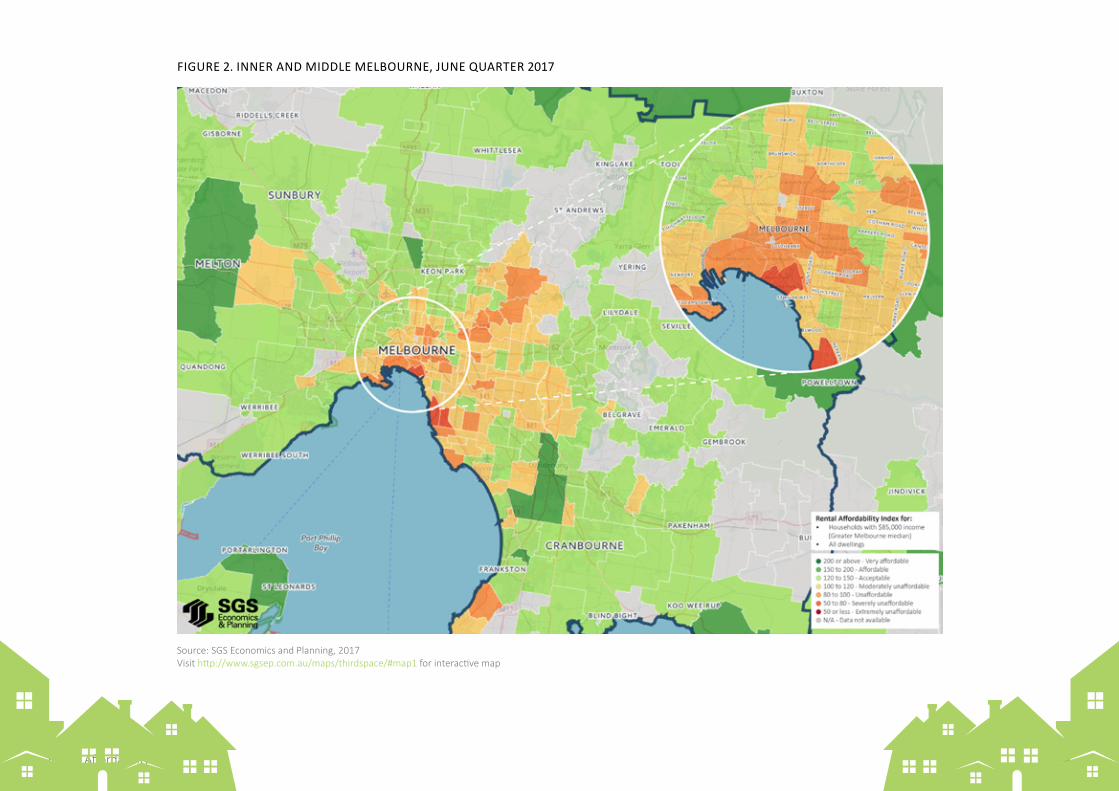
With a RAI of 127 in the June quarter of 2017, the RAI in Greater Melbourne has seen a very slight increase in affordability since the last release. The average household seeking to rent faces housing costs at around 24 per cent of its total income.
There have been no significant changes in the geographic spread of affordability in Greater Melbourne since the last release. Unaffordability is extending northwards, however, with the Coburg and Coburg North areas now considered Moderately Unaffordable. To the north-east Eltham and Greensborough are now also considered Moderately Unaffordable.
REST OF VICTORIA
The median rental household in regional Victoria has a gross income of $61,000 per annum.
With a RAI of 121, affordability has slightly increased in regional Victoria since the last release. The average household seeking to rent faces rent levels at around 25 per cent of its total income.
Victoria remains the only state to have a lower RAI in its rest of state area than in its greater metropolitan area, with many regional cities considered Moderately Unaffordable to Unaffordable. Regional Victoria has very low household incomes relative to rents.
Melbourne’s top 5 least affordable postcodes are listed below:
RANK POSTCODE SUBURBS RAI SCORE RENT AS SHARE OF INCOME
1 3206 Albert Park, Middle Park 73 41%
2 3187 Brighton East 74 41%
3 3186 Brighton 84 36%
4 3193 Beaumaris, Black Rock 88 34%
5 3207 Port Melbourne 90 34%
TABLE 8. TOP 5 LEAST AFFORDABLE POSTCODES IN GREATER MELBOURNE (JUNE QUARTER, 2017)
Source: SGS Economics and Planning (2017)Note: RAI has been calculated using a rounded gross income of $85,000
9Rental Affordability Index
FIGURE 2. INNER AND MIDDLE MELBOURNE, JUNE QUARTER 2017
Source: SGS Economics and Planning, 2017Visit http://www.sgsep.com.au/maps/thirdspace/#map1 for interactive map
10Rental Affordability Index
3.3 QUEENSLAND
GREATER BRISBANE
The median rental household in Greater Brisbane has a gross income of $83,500 per annum.
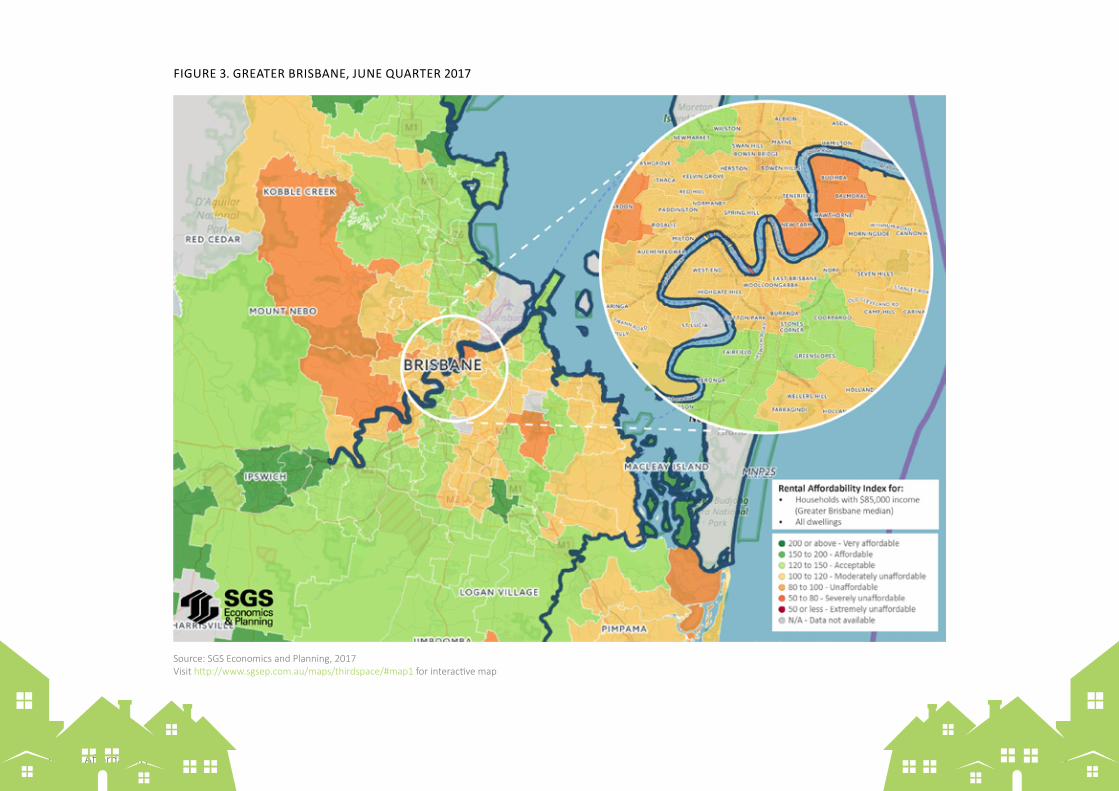
Affordability in Greater Brisbane has improved since the last release, increasing from 118 to 121 in the June quarter of 2017. The average household seeking to rent in Greater Brisbane would be facing rents at 25 per cent of its total income.
Most postcodes in inner to middle Brisbane remain Moderately Unaffordable to Unaffordable.
REST OF QUEENSLAND
The median rental household in regional Queensland has a gross income of $74,900 per annum.
With a current RAI of 124, rental affordability has remained relatively unchanged since the December quarter of 2016. The average rental household seeking a dwelling faces rents at 24 per cent of its total income.
The situation is relatively similar in the Gold Coast area with rents considered Moderately Unaffordable to Unaffordable along the coast out to Tweed Heads.
RANK POSTCODE SUBURBS RAI SCORE RENT AS SHARE OF INCOME
1 4520 Armstrong Creek, Samsonvale, Kobble
Creek
89 34%
2 4037 Eatons Hill 93 32%
3 4069 Pinjarra Hills, Kenmore, Brookfield,
Chapel Hill
93 32%
4 4156 MacKenzie, Burbank 93 32%
5 4171 Bulimba, Balmoral, Hawthorne
94 32%
TABLE 9. TOP 5 LEAST AFFORDABLE POSTCODES IN GREATER BRISBANE (JUNE QUARTER, 2017)
Source: SGS Economics and Planning (2017)Note: RAI has been calculated using a rounded gross income of $85,000
11Rental Affordability Index
FIGURE 3. GREATER BRISBANE, JUNE QUARTER 2017
Source: SGS Economics and Planning, 2017Visit http://www.sgsep.com.au/maps/thirdspace/#map1 for interactive map
12Rental Affordability Index
3.4 SOUTH AUSTRALIA
GREATER ADELAIDE
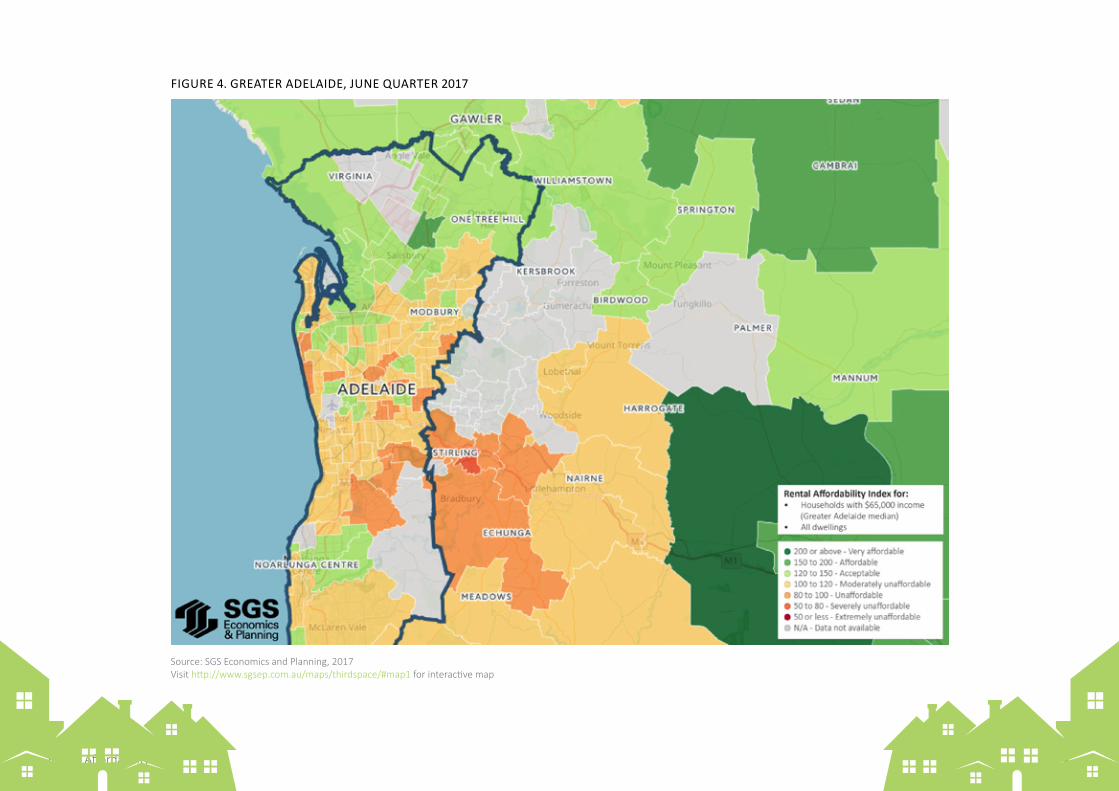
The median rental household in Greater Adelaide has a gross income of $65,900 per annum.
With a RAI of 119, the average household in Greater Adelaide seeking to rent faces rents at around 25 per cent of household income.
There has been some change in the geographic spread of affordability in Greater Adelaide since the last release. The situation in the foothill areas of Belair, Flagstaff Hill out to Happy Valley and Chandlers Hill has worsened since last release and are now considered Unaffordable.
This is also true of the foreshore areas of West Lakes, Tennyson and out to Henley Beach South which have moved from Moderately Unaffordable to Unaffordable.
REST OF SA
The median rental household in regional South Australia has a gross income of $60,100 per annum.
RANK POSTCODE SUBURBS RAI SCORE RENT AS SHARE OF INCOME
1 5152 Stirling, Crafers, Crafers West, Cleland
89 34%
2 5025 Finders Park, Kidman Park
90 33%
3 5153 Echunga, Flaxley, Macclesfield, Jupiter
Creek, Ironbank
91 33%
4 5020 West Lakes Shore 94 32%
5 5052 Belair, Glenalta 94 32%
TABLE 10. TOP 5 LEAST AFFORDABLE POSTCODES IN GREATER ADELAIDE (JUNE QUARTER, 2017)
Source: SGS Economics and Planning (2017)Note: RAI has been calculated using a rounded gross income of $65,000
Regional SA continues to see an upward trend in rental affordability. With a RAI of 139, regional SA is at its most affordable since at least mid-2012 (the RAI extends back to Quarter 3 2012).
The fast-growing outer towns of Mt Barker, Nairne and Strathalbyn have become Moderately Unaffordable. Since the last release the suburb of Echunga has decreased further in affordability, becoming Unaffordable.
13Rental Affordability Index
FIGURE 4. GREATER ADELAIDE, JUNE QUARTER 2017
Source: SGS Economics and Planning, 2017Visit http://www.sgsep.com.au/maps/thirdspace/#map1 for interactive map
14Rental Affordability Index
3.5 TASMANIA
GREATER HOBART The median rental household in Greater Hobart has a gross income of $60,900 per annum.
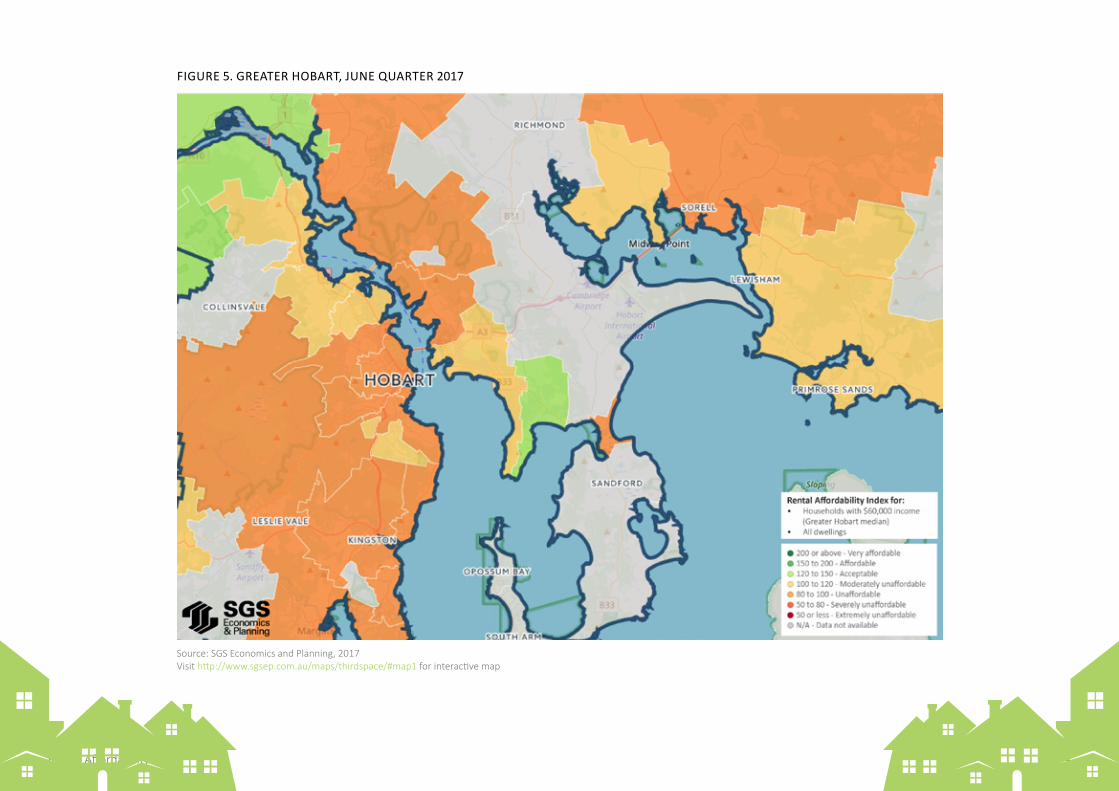
With a RAI of 106, affordability in Greater Hobart has fallen to its lowest level since the September quarter of 2012. The average rental household in Greater Hobart face rents at around 28 per cent of its total income.
The current low affordability is in line with the booming housing market and shortage of rental housing. Greater Hobart remains the second least affordable metropolitan area of those studied and is now close to the level seen in Sydney. Lower incomes and high rental yields are driving factors.
While rental affordability in Hobart tends to fluctuate across quarters, the geographic spread of affordability has remained relatively unchanged. However, since the last release parts of Kingston have shifted from Moderately Unaffordable to Unaffordable.
Due to the low number of new bond lodgements recorded in Greater Hobart, postcode level analysis is limited for this metropolitan region. It is clear, however, that Hobart and much of its surrounds to the south and west are Unaffordable for the average rental household.
RANK POSTCODE SUBURBS RAI SCORE RENT AS SHARE OF INCOME
1 7004 Battery Point 82 36%
2 7005 Dynnyrne, Lower Sandy Bay, Sandy Bay
82 36%
3 7017 Grasstree Hill, Otago, Honeywood, Old Beach
90 33%
4 7053 Taroona, Bonnet Hill 91 33%
5 7000 South Hobart 94 32%
TABLE 11. TOP 5 LEAST AFFORDABLE POSTCODES IN GREATER HOBART (JUNE QUARTER, 2017)
Source: SGS Economics and Planning (2017)Note: RAI has been calculated using a rounded gross income of $60,000
REST OF TASMANIA
The median rental household in regional Tasmania has a gross income of $52,800 per annum.
Regional Tasmania has a RAI of 122, indicating a slight improvement since the last release. The average household seeking to rent would be facing rent levels at around 25 per cent of its income.
15Rental Affordability Index
FIGURE 5. GREATER HOBART, JUNE QUARTER 2017
Source: SGS Economics and Planning, 2017Visit http://www.sgsep.com.au/maps/thirdspace/#map1 for interactive map
16Rental Affordability Index
3.6 WESTERN AUSTRALIA
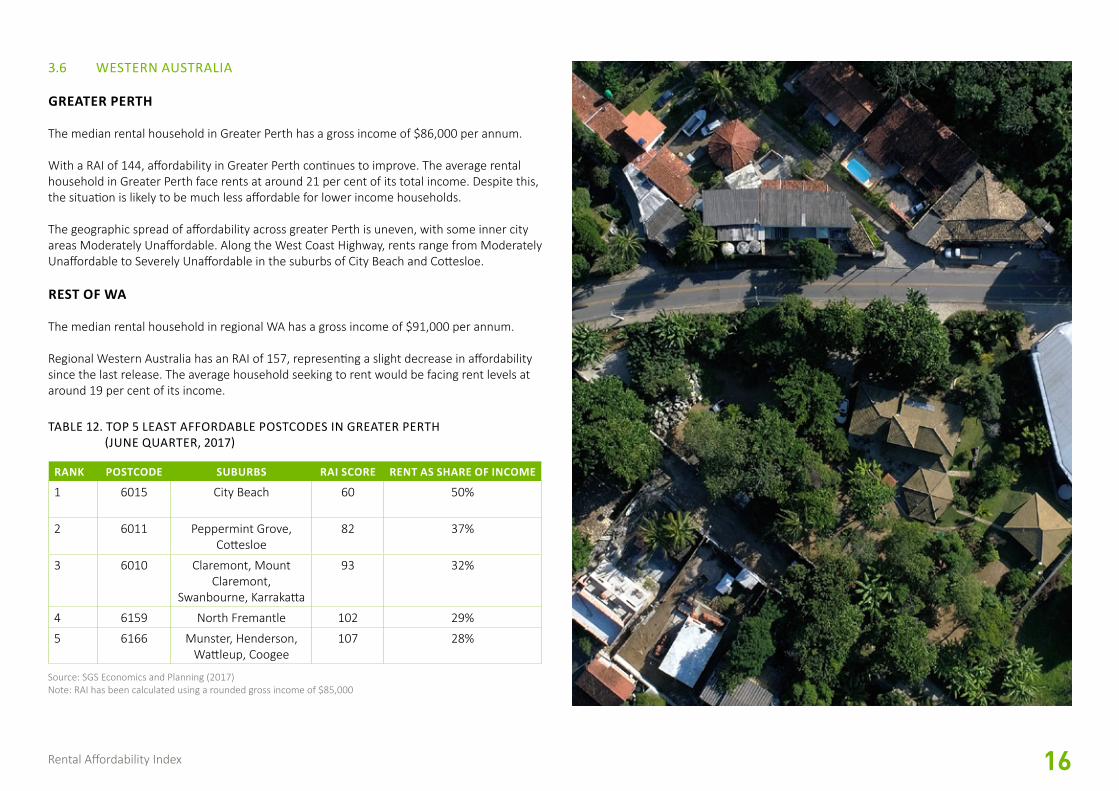
GREATER PERTH
The median rental household in Greater Perth has a gross income of $86,000 per annum.
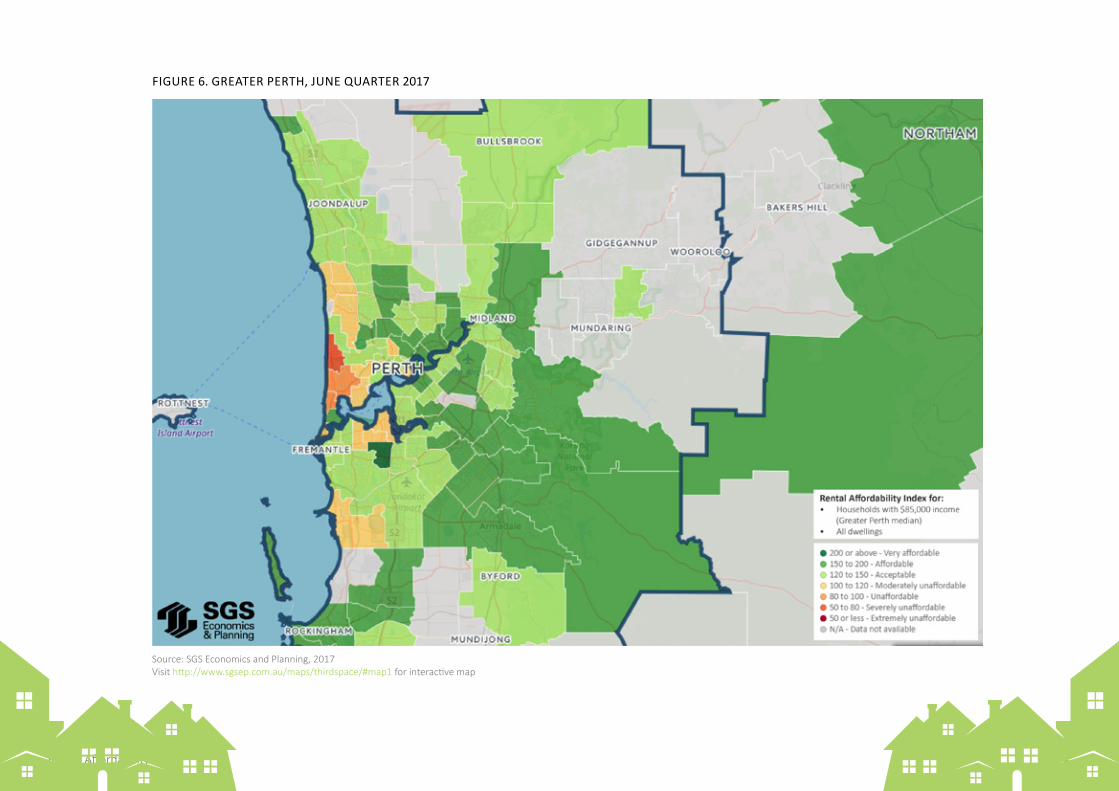
With a RAI of 144, affordability in Greater Perth continues to improve. The average rental household in Greater Perth face rents at around 21 per cent of its total income. Despite this, the situation is likely to be much less affordable for lower income households.
The geographic spread of affordability across greater Perth is uneven, with some inner city areas Moderately Unaffordable. Along the West Coast Highway, rents range from Moderately Unaffordable to Severely Unaffordable in the suburbs of City Beach and Cottesloe.
REST OF WA
The median rental household in regional WA has a gross income of $91,000 per annum.
Regional Western Australia has an RAI of 157, representing a slight decrease in affordability since the last release. The average household seeking to rent would be facing rent levels at around 19 per cent of its income.
RANK POSTCODE SUBURBS RAI SCORE RENT AS SHARE OF INCOME
1 6015 City Beach 60 50%
2 6011 Peppermint Grove, Cottesloe
82 37%
3 6010 Claremont, Mount Claremont,
Swanbourne, Karrakatta
93 32%
4 6159 North Fremantle 102 29%
5 6166 Munster, Henderson, Wattleup, Coogee
107 28%
TABLE 12. TOP 5 LEAST AFFORDABLE POSTCODES IN GREATER PERTH (JUNE QUARTER, 2017)
Source: SGS Economics and Planning (2017)Note: RAI has been calculated using a rounded gross income of $85,000
17Rental Affordability Index
FIGURE 6. GREATER PERTH, JUNE QUARTER 2017
Source: SGS Economics and Planning, 2017Visit http://www.sgsep.com.au/maps/thirdspace/#map1 for interactive map
18Rental Affordability Index
3.7 ACT
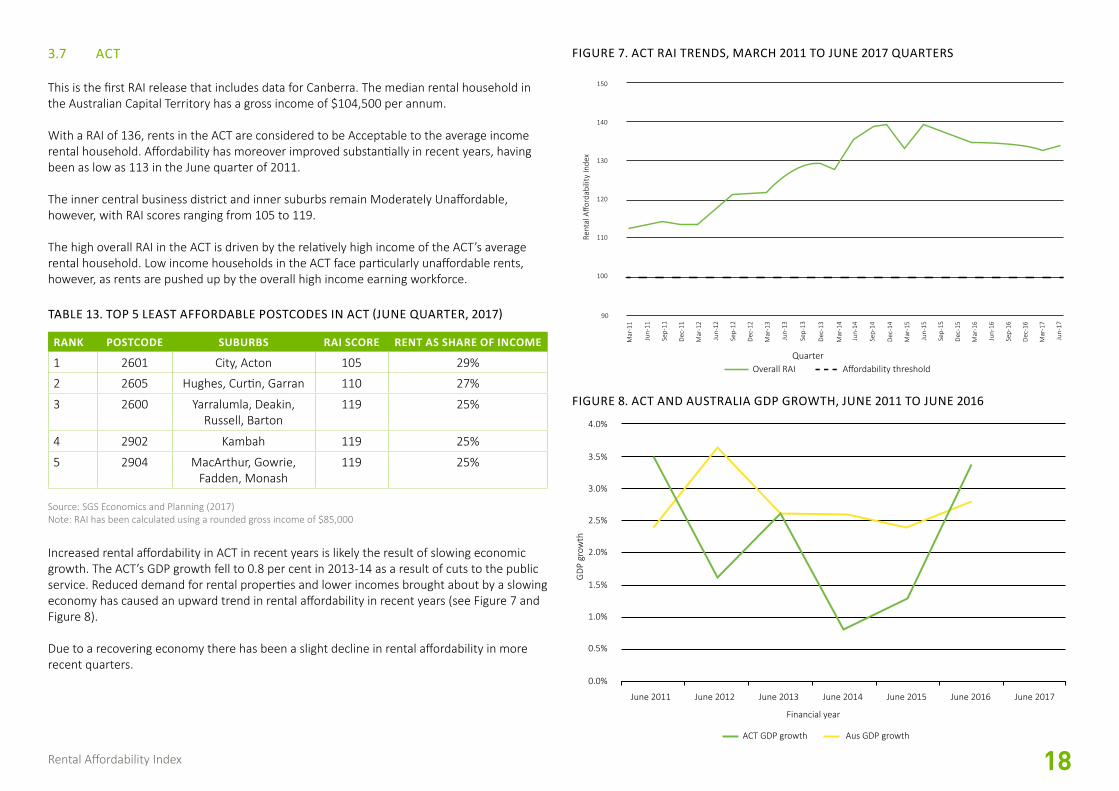
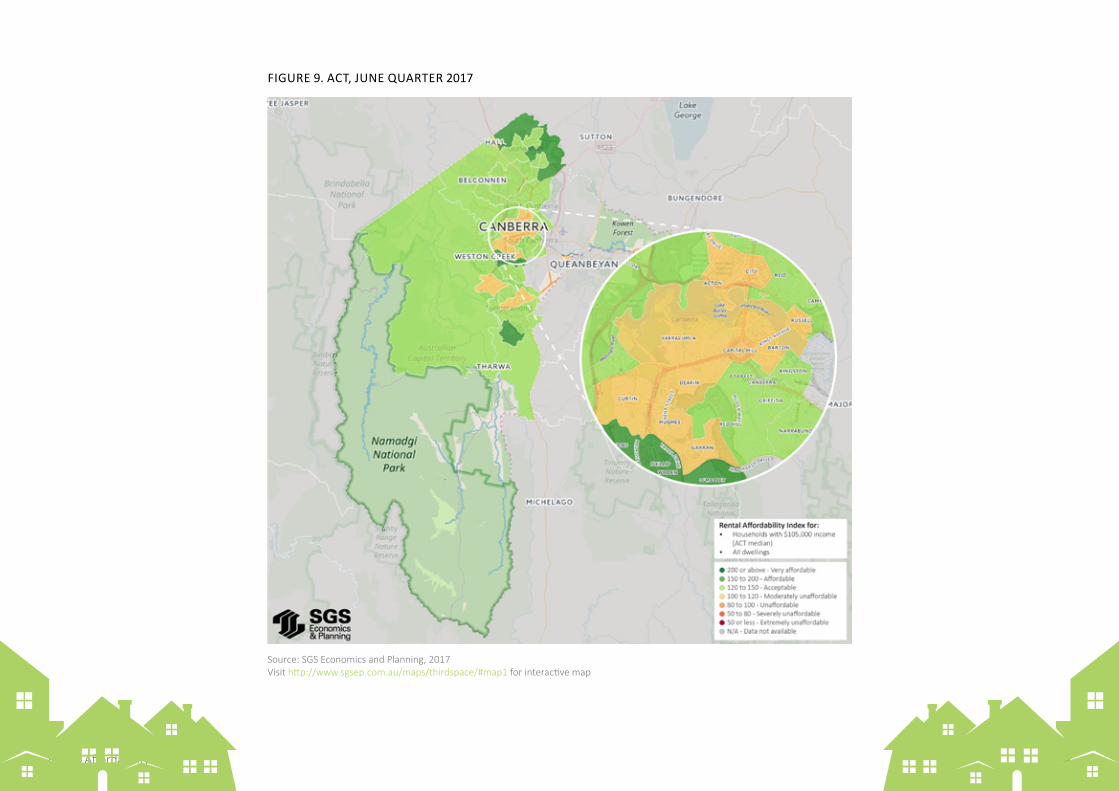
This is the first RAI release that includes data for Canberra. The median rental household in the Australian Capital Territory has a gross income of $104,500 per annum.
With a RAI of 136, rents in the ACT are considered to be Acceptable to the average income rental household. Affordability has moreover improved substantially in recent years, having been as low as 113 in the June quarter of 2011.
The inner central business district and inner suburbs remain Moderately Unaffordable, however, with RAI scores ranging from 105 to 119.
The high overall RAI in the ACT is driven by the relatively high income of the ACT’s average rental household. Low income households in the ACT face particularly unaffordable rents, however, as rents are pushed up by the overall high income earning workforce.
TABLE 13. TOP 5 LEAST AFFORDABLE POSTCODES IN ACT (JUNE QUARTER, 2017)
RANK POSTCODE SUBURBS RAI SCORE RENT AS SHARE OF INCOME
1 2601 City, Acton 105 29%
2 2605 Hughes, Curtin, Garran 110 27%
3 2600 Yarralumla, Deakin, Russell, Barton
119 25%
4 2902 Kambah 119 25%
5 2904 MacArthur, Gowrie, Fadden, Monash
119 25%
Source: SGS Economics and Planning (2017)Note: RAI has been calculated using a rounded gross income of $85,000
Increased rental affordability in ACT in recent years is likely the result of slowing economic growth. The ACT’s GDP growth fell to 0.8 per cent in 2013-14 as a result of cuts to the public service. Reduced demand for rental properties and lower incomes brought about by a slowing economy has caused an upward trend in rental affordability in recent years (see Figure 7 and Figure 8).
Due to a recovering economy there has been a slight decline in rental affordability in more recent quarters.
FIGURE 7. ACT RAI TRENDS, MARCH 2011 TO JUNE 2017 QUARTERS
FIGURE 8. ACT AND AUSTRALIA GDP GROWTH, JUNE 2011 TO JUNE 2016
Rent
al A
fford
abili
ty In
dex
Quarter
90
100
110
120
130
140
150
Overall RAI Affordability threshold
Mar
-11
Jun-
11
Sep-
11
Dec-
11
Mar
-12
Jun-
12
Sep-
12
Dec-
12
Mar
-13
Jun-
13
Sep-
13
Dec-
13
Mar
-14
Jun-
14
Sep-
14
Dec-
14
Mar
-15
Jun-
15
Sep-
15
Dec-
15
Mar
-16
Jun-
16
Sep-
16
Dec-
16
Mar
-17
Jun-
17
ACT GDP growth Aus GDP growth
0.0%
0.5%
1.0%
1.5%
2.0%
2.5%
3.0%
3.5%
4.0%
GDP
gro
wth
June 2011 June 2012 June 2013 June 2014 June 2015 June 2016 June 2017
Financial year
19Rental Affordability Index
FIGURE 9. ACT, JUNE QUARTER 2017
Source: SGS Economics and Planning, 2017Visit http://www.sgsep.com.au/maps/thirdspace/#map1 for interactive map
20Rental Affordability Index
SNAPSHOT OF LOWER INCOME HOUSEHOLDS 044.1 INTRODUCTION This release of the RAI has profiled eight different low to moderate income household types to demonstrate the rental situation for different income groups, age demographics and household composition in Australia.
The selected households range from those dependent on some form of income support, through to dual income key worker couples. The chosen eight households are:
� Single pensioner � Pensioner couple � Single person on benefits � Single part-time worker parent on benefits � Single working parent � Single income couple with children � Dual income couple with children � Student sharehouse.
Affordability has been reported for each household type based on gross, median incomes estimated for a particular household adjusted to its location (i.e.. metropolitan or rest of state area).³
It must be noted that the household types and their typical income level and dwelling size are indicative. They are moreover not representative of all vulnerable and/or lower income household types.
It is also important to note that the RAI only considers the cost of rents against income. Many of these households have, or may have, considerable additional financial pressures placed upon them, including locational and travel costs, childcare costs (this is especially true for single working parents and dual income couple parents), and other day-to-day living costs.
Income support levels are based on the federal Department of Human Services payment rates as at October 2017.
Working households are assumed to rely on key worker incomes. A full-time secondary teacher income was used as the typical key worker income. The income is based on ABS (2016) Average Australian Employee Earnings and Hours data,⁴ scaled up to Greater Sydney levels based on personal weekly income.
Total household income estimates are based on gross income, including Commonwealth Rent Assistance. The eligibility of very low income households to access discounted rents has not been factored into this analysis.
Note: analysis by household type has not been undertaken for WA as rental data is not available by bedroom type.
A reference list for the assumptions used for these household profiles can be found in Appendix 2.
³Note: The household profiles found on the RAI interactive map found at http://www.sgsep.com.au/maps/thirdspace/#map1 use Australia-wide average incomes for each lower income household type.
⁴Data Cube 13: Full Time managerial employees paid at the adult rate. Available online: http://www.abs.gov.au/AUSSTATS/[email protected]/DetailsPage/6306.0May%202016?OpenDocument
21Rental Affordability Index
4.2 SINGLE PENSIONER
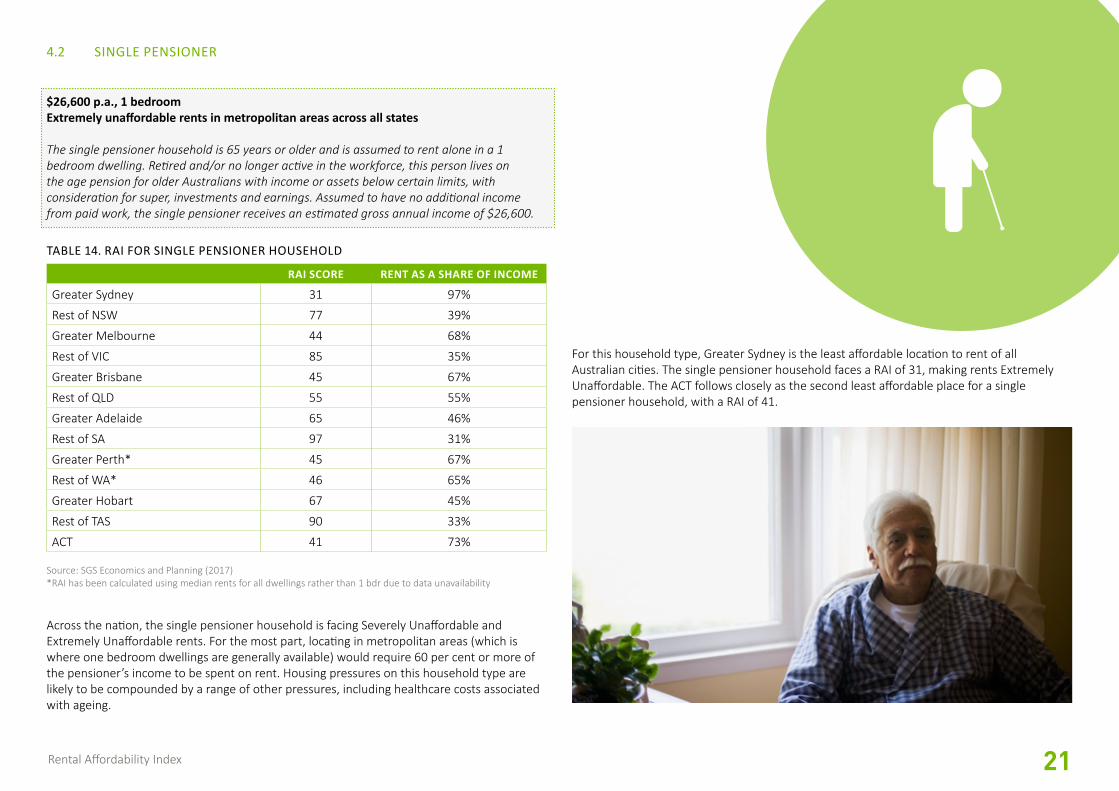
$26,600 p.a., 1 bedroomExtremely unaffordable rents in metropolitan areas across all states
The single pensioner household is 65 years or older and is assumed to rent alone in a 1 bedroom dwelling. Retired and/or no longer active in the workforce, this person lives on the age pension for older Australians with income or assets below certain limits, with consideration for super, investments and earnings. Assumed to have no additional income from paid work, the single pensioner receives an estimated gross annual income of $26,600.
RAI SCORE RENT AS A SHARE OF INCOME
Greater Sydney 31 97%
Rest of NSW 77 39%
Greater Melbourne 44 68%
Rest of VIC 85 35%
Greater Brisbane 45 67%
Rest of QLD 55 55%
Greater Adelaide 65 46%
Rest of SA 97 31%
Greater Perth* 45 67%
Rest of WA* 46 65%
Greater Hobart 67 45%
Rest of TAS 90 33%
ACT 41 73%
TABLE 14. RAI FOR SINGLE PENSIONER HOUSEHOLD
Source: SGS Economics and Planning (2017)*RAI has been calculated using median rents for all dwellings rather than 1 bdr due to data unavailability
Across the nation, the single pensioner household is facing Severely Unaffordable and Extremely Unaffordable rents. For the most part, locating in metropolitan areas (which is where one bedroom dwellings are generally available) would require 60 per cent or more of the pensioner’s income to be spent on rent. Housing pressures on this household type are likely to be compounded by a range of other pressures, including healthcare costs associated with ageing.
For this household type, Greater Sydney is the least affordable location to rent of all Australian cities. The single pensioner household faces a RAI of 31, making rents Extremely Unaffordable. The ACT follows closely as the second least affordable place for a single pensioner household, with a RAI of 41.
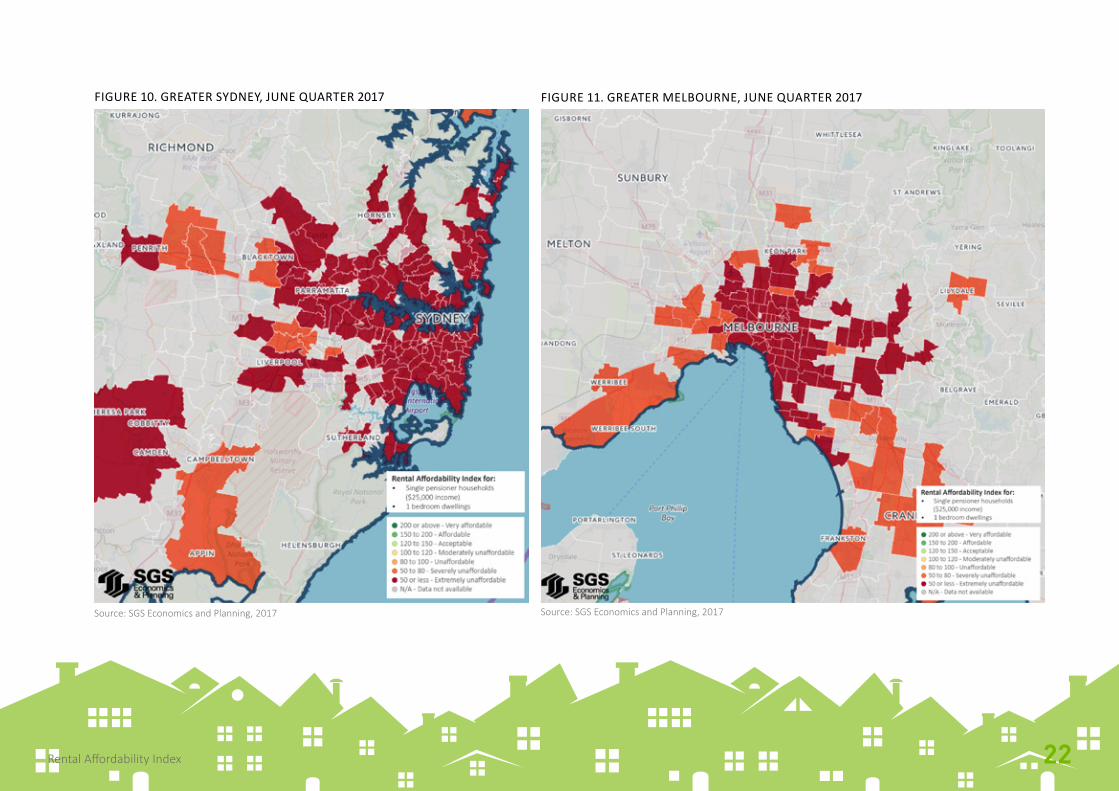
Source: SGS Economics and Planning, 2017 Source: SGS Economics and Planning, 2017
FIGURE 11. GREATER MELBOURNE, JUNE QUARTER 2017FIGURE 10. GREATER SYDNEY, JUNE QUARTER 2017
Rental Affordability Index 22
23Rental Affordability Index
RAI SCORE RENT AS A SHARE OF INCOME
Greater Sydney 51 59%
Rest of NSW 100 30%
Greater Melbourne 63 48%
Rest of VIC 106 28%
Greater Brisbane 68 44%
Rest of QLD 85 35%
Greater Adelaide 89 34%
Rest of SA 133 23%
Greater Perth* 77 39%
Rest of WA* 79 38%
Greater Hobart 85 35%
Rest of TAS 117 26%
ACT 61 49%
TABLE 15. RAI FOR PENSIONER COUPLE HOUSEHOLD
Source: SGS Economics and Planning (2017)*RAI has been calculated using median rents for all dwellings rather than 2 bdr due to data unavailability
4.3 PENSIONER COUPLE
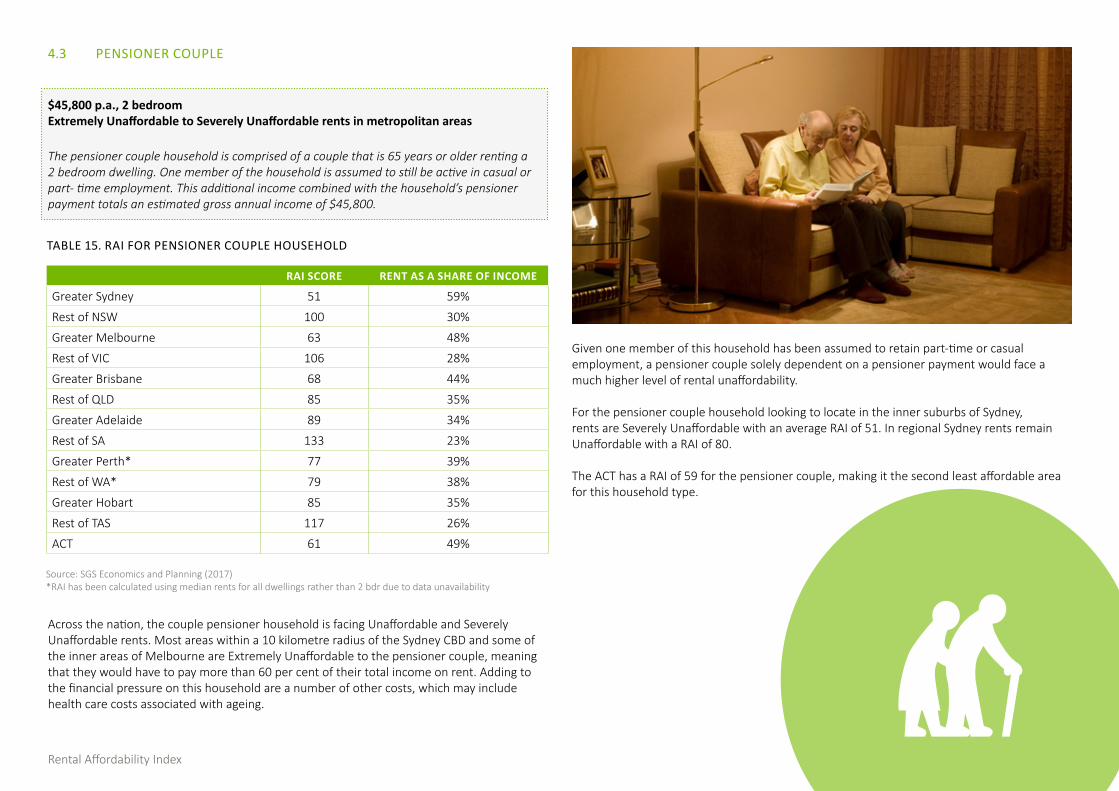
$45,800 p.a., 2 bedroomExtremely Unaffordable to Severely Unaffordable rents in metropolitan areas
The pensioner couple household is comprised of a couple that is 65 years or older renting a 2 bedroom dwelling. One member of the household is assumed to still be active in casual or part- time employment. This additional income combined with the household’s pensioner payment totals an estimated gross annual income of $45,800.
Across the nation, the couple pensioner household is facing Unaffordable and Severely Unaffordable rents. Most areas within a 10 kilometre radius of the Sydney CBD and some of the inner areas of Melbourne are Extremely Unaffordable to the pensioner couple, meaning that they would have to pay more than 60 per cent of their total income on rent. Adding to the financial pressure on this household are a number of other costs, which may include health care costs associated with ageing.
Given one member of this household has been assumed to retain part-time or casual employment, a pensioner couple solely dependent on a pensioner payment would face a much higher level of rental unaffordability.
For the pensioner couple household looking to locate in the inner suburbs of Sydney, rents are Severely Unaffordable with an average RAI of 51. In regional Sydney rents remain Unaffordable with a RAI of 80.
The ACT has a RAI of 59 for the pensioner couple, making it the second least affordable area for this household type.
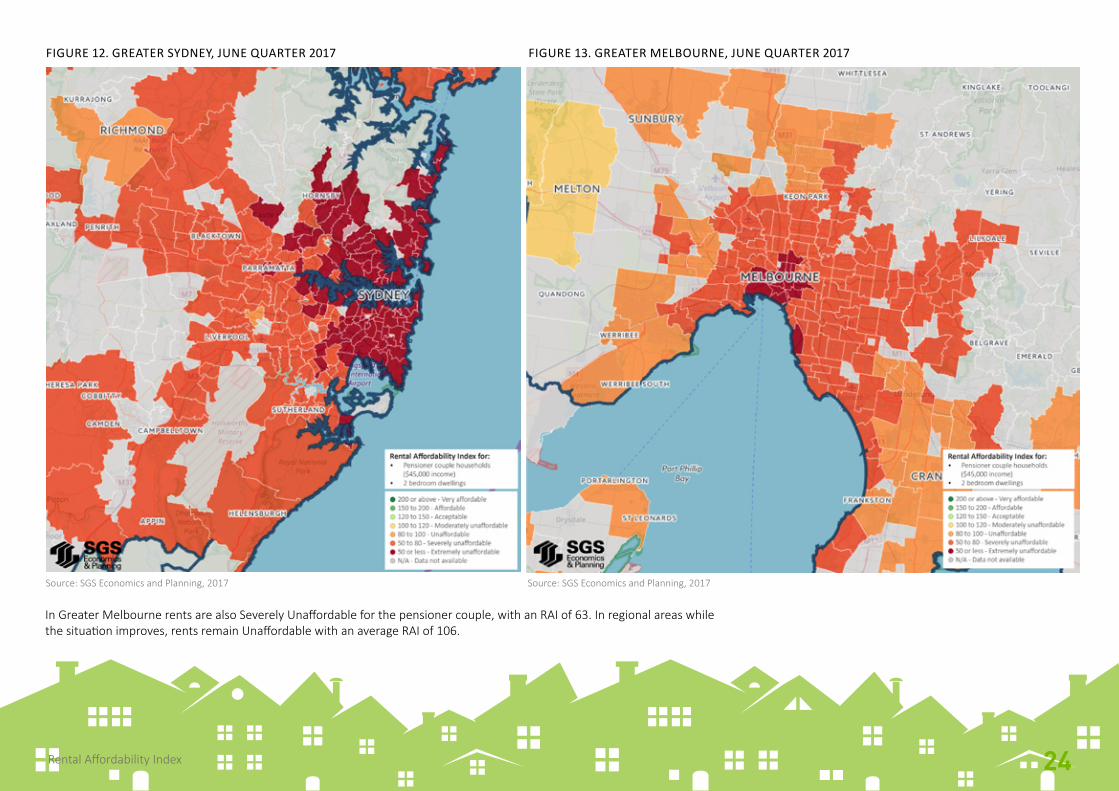
FIGURE 12. GREATER SYDNEY, JUNE QUARTER 2017 FIGURE 13. GREATER MELBOURNE, JUNE QUARTER 2017
Source: SGS Economics and Planning, 2017 Source: SGS Economics and Planning, 2017
In Greater Melbourne rents are also Severely Unaffordable for the pensioner couple, with an RAI of 63. In regional areas while the situation improves, rents remain Unaffordable with an average RAI of 106.
24Rental Affordability Index
25Rental Affordability Index
RAI SCORE RENT AS A SHARE OF INCOME
Greater Sydney 20 150%
Rest of NSW 50 60%
Greater Melbourne 29 103%
Rest of VIC 56 54%
Greater Brisbane 29 103%
Rest of QLD 36 83%
Greater Adelaide 42 71%
Rest of SA 63 48%
Greater Perth* 29 103%
Rest of WA* 30 100%
Greater Hobart 44 68%
Rest of TAS 59 51%
ACT 27 111%
TABLE 16. RAI FOR SINGLE PERSON ON BENEFITS
Source: SGS Economics and Planning (2017)*RAI has been calculated using median rents for all dwellings rather than 1 bdr due to data unavailability
4.4 SINGLE PERSON ON BENEFITS
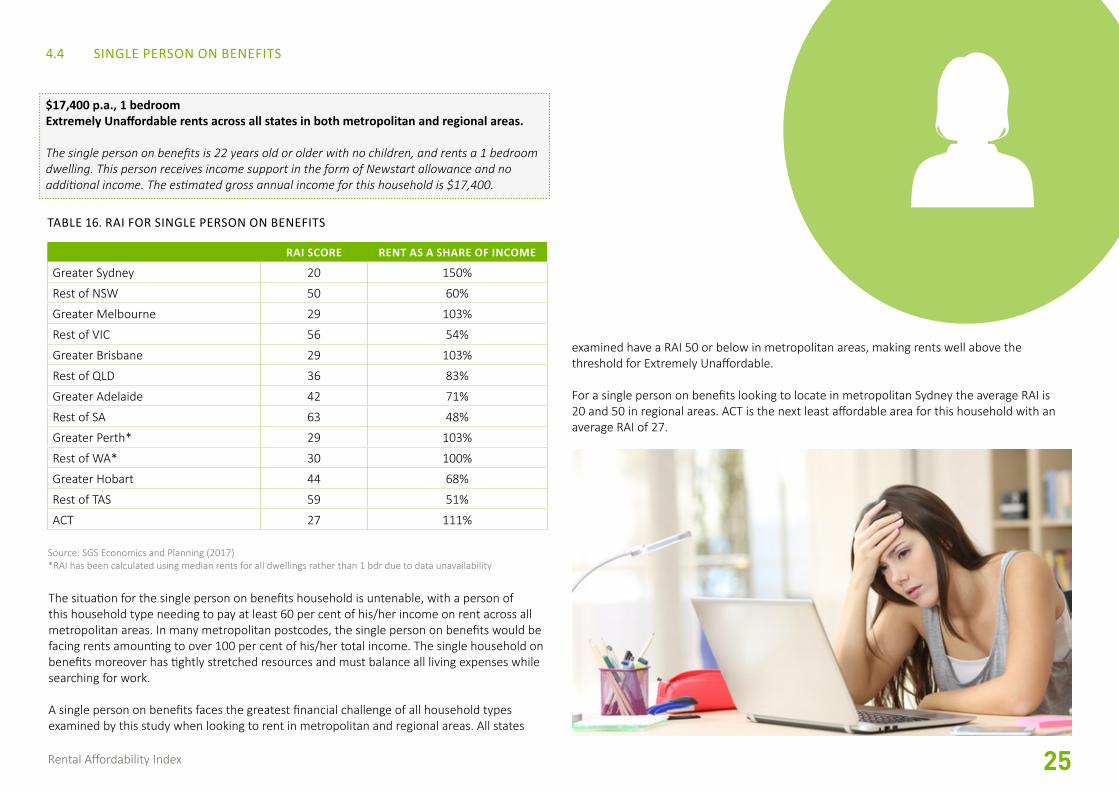
$17,400 p.a., 1 bedroomExtremely Unaffordable rents across all states in both metropolitan and regional areas.
The single person on benefits is 22 years old or older with no children, and rents a 1 bedroom dwelling. This person receives income support in the form of Newstart allowance and no additional income. The estimated gross annual income for this household is $17,400.
The situation for the single person on benefits household is untenable, with a person of this household type needing to pay at least 60 per cent of his/her income on rent across all metropolitan areas. In many metropolitan postcodes, the single person on benefits would be facing rents amounting to over 100 per cent of his/her total income. The single household on benefits moreover has tightly stretched resources and must balance all living expenses while searching for work.
A single person on benefits faces the greatest financial challenge of all household types examined by this study when looking to rent in metropolitan and regional areas. All states
examined have a RAI 50 or below in metropolitan areas, making rents well above the threshold for Extremely Unaffordable.
For a single person on benefits looking to locate in metropolitan Sydney the average RAI is 20 and 50 in regional areas. ACT is the next least affordable area for this household with an average RAI of 27.
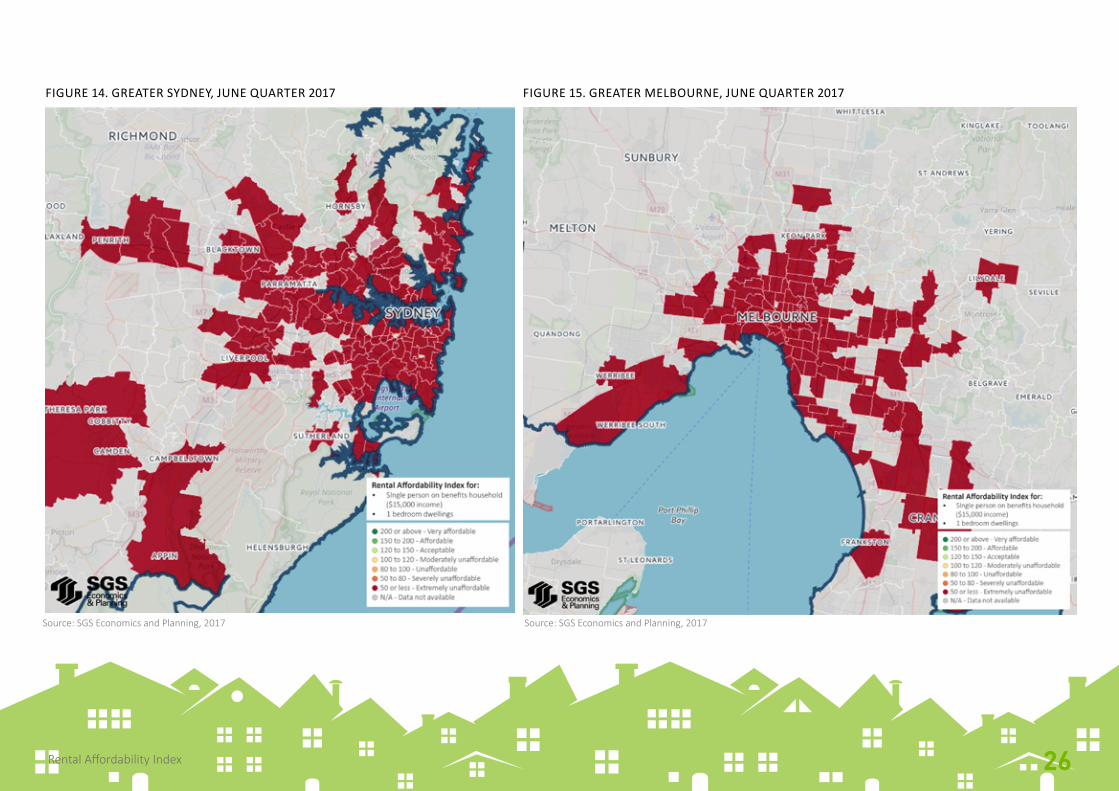
FIGURE 14. GREATER SYDNEY, JUNE QUARTER 2017 FIGURE 15. GREATER MELBOURNE, JUNE QUARTER 2017
Source: SGS Economics and Planning, 2017 Source: SGS Economics and Planning, 2017
26Rental Affordability Index
27Rental Affordability Index
4.5 SINGLE PART-TIME WORKER PARENT ON BENEFITS
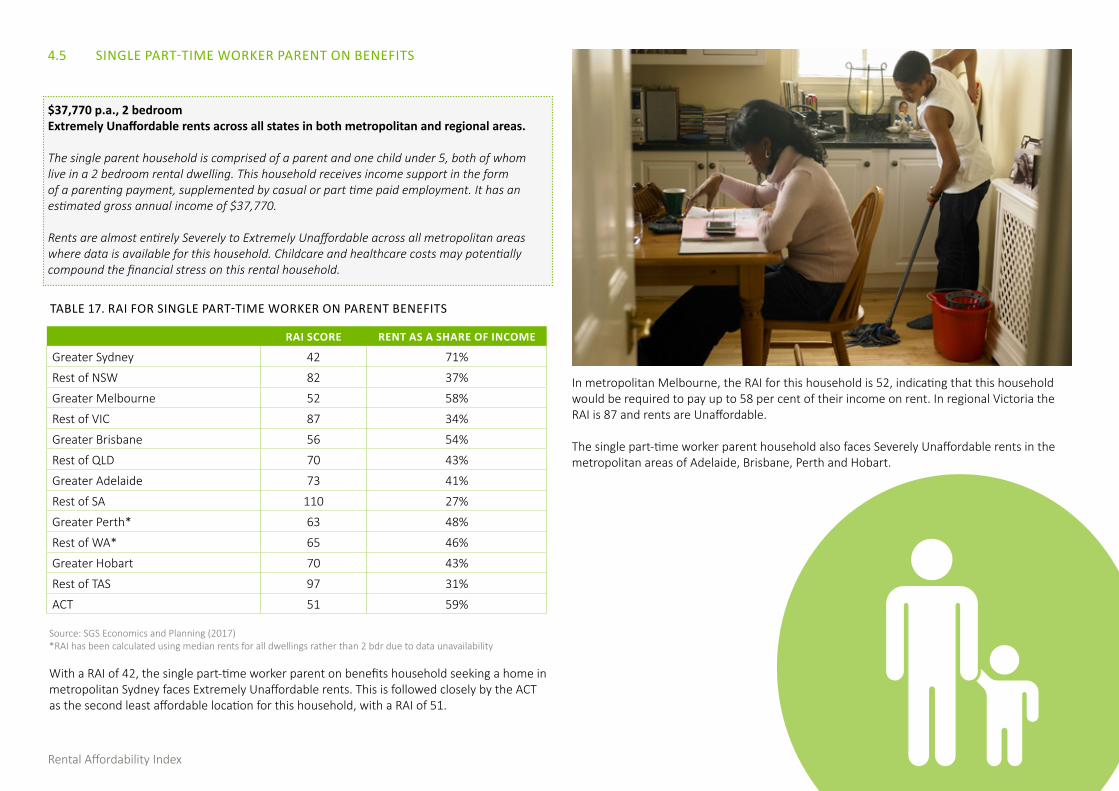
$37,770 p.a., 2 bedroomExtremely Unaffordable rents across all states in both metropolitan and regional areas.
The single parent household is comprised of a parent and one child under 5, both of whom live in a 2 bedroom rental dwelling. This household receives income support in the form of a parenting payment, supplemented by casual or part time paid employment. It has an estimated gross annual income of $37,770.
Rents are almost entirely Severely to Extremely Unaffordable across all metropolitan areas where data is available for this household. Childcare and healthcare costs may potentially compound the financial stress on this rental household.
RAI SCORE RENT AS A SHARE OF INCOME
Greater Sydney 42 71%
Rest of NSW 82 37%
Greater Melbourne 52 58%
Rest of VIC 87 34%
Greater Brisbane 56 54%
Rest of QLD 70 43%
Greater Adelaide 73 41%
Rest of SA 110 27%
Greater Perth* 63 48%
Rest of WA* 65 46%
Greater Hobart 70 43%
Rest of TAS 97 31%
ACT 51 59%
TABLE 17. RAI FOR SINGLE PART-TIME WORKER ON PARENT BENEFITS
Source: SGS Economics and Planning (2017)*RAI has been calculated using median rents for all dwellings rather than 2 bdr due to data unavailability
With a RAI of 42, the single part-time worker parent on benefits household seeking a home in metropolitan Sydney faces Extremely Unaffordable rents. This is followed closely by the ACT as the second least affordable location for this household, with a RAI of 51.
In metropolitan Melbourne, the RAI for this household is 52, indicating that this household would be required to pay up to 58 per cent of their income on rent. In regional Victoria the RAI is 87 and rents are Unaffordable.
The single part-time worker parent household also faces Severely Unaffordable rents in the metropolitan areas of Adelaide, Brisbane, Perth and Hobart.
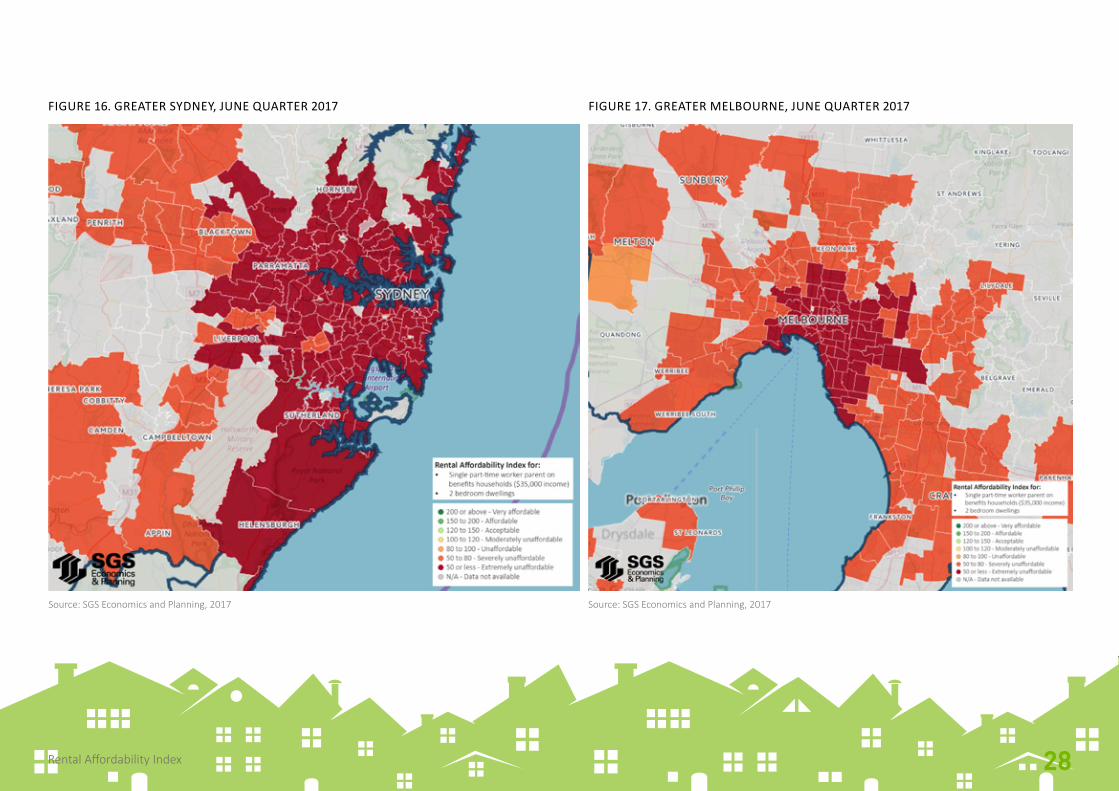
FIGURE 16. GREATER SYDNEY, JUNE QUARTER 2017 FIGURE 17. GREATER MELBOURNE, JUNE QUARTER 2017
Source: SGS Economics and Planning, 2017 Source: SGS Economics and Planning, 2017
28Rental Affordability Index
29Rental Affordability Index
RAI SCORE RENT AS A SHARE OF INCOME
Greater Sydney 100 30%
Rest of NSW 197 15%
Greater Melbourne 113 27%
Rest of VIC 190 16%
Greater Brisbane 127 24%
Rest of QLD 158 19%
Greater Adelaide 170 18%
Rest of SA 250 12%
Greater Perth* 151 20%
Rest of WA* 154 19%
Greater Hobart 167 18%
Rest of TAS 223 13%
ACT 122 25%
TABLE 18. RAI FOR SINGLE FULL-TIME WORKING PARENT
Source: SGS Economics and Planning (2017)*RAI has been calculated using median rents for all dwellings rather than 2 bdr due to data unavailability
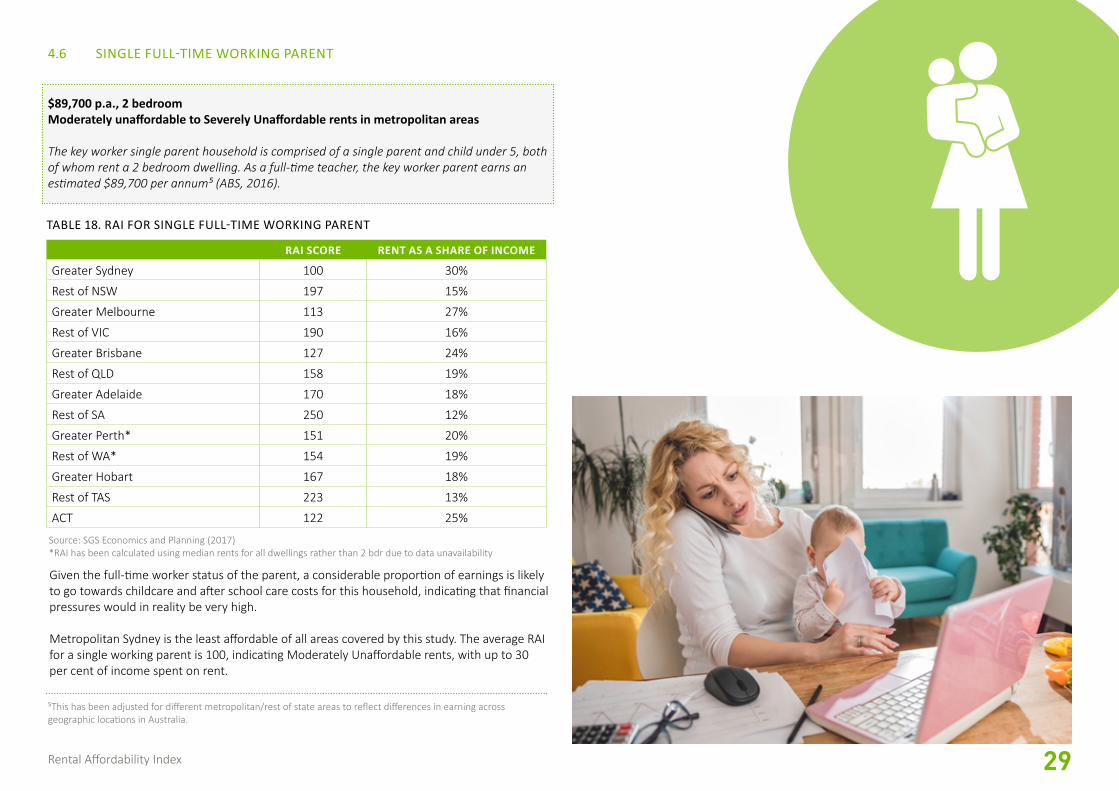
4.6 SINGLE FULL-TIME WORKING PARENT
$89,700 p.a., 2 bedroomModerately unaffordable to Severely Unaffordable rents in metropolitan areas
The key worker single parent household is comprised of a single parent and child under 5, both of whom rent a 2 bedroom dwelling. As a full-time teacher, the key worker parent earns an estimated $89,700 per annum⁵ (ABS, 2016).
Given the full-time worker status of the parent, a considerable proportion of earnings is likely to go towards childcare and after school care costs for this household, indicating that financial pressures would in reality be very high.
Metropolitan Sydney is the least affordable of all areas covered by this study. The average RAI for a single working parent is 100, indicating Moderately Unaffordable rents, with up to 30 per cent of income spent on rent.
⁵This has been adjusted for different metropolitan/rest of state areas to reflect differences in earning across geographic locations in Australia.
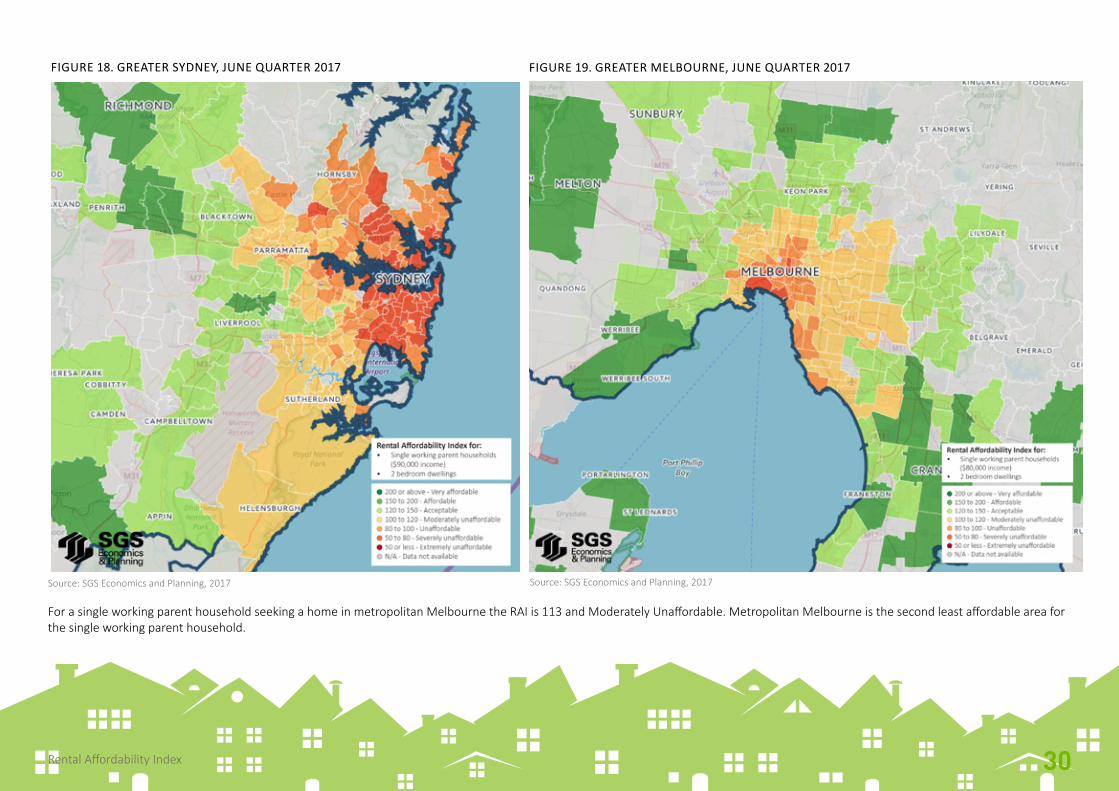
FIGURE 18. GREATER SYDNEY, JUNE QUARTER 2017 FIGURE 19. GREATER MELBOURNE, JUNE QUARTER 2017
Source: SGS Economics and Planning, 2017 Source: SGS Economics and Planning, 2017
For a single working parent household seeking a home in metropolitan Melbourne the RAI is 113 and Moderately Unaffordable. Metropolitan Melbourne is the second least affordable area for the single working parent household.
30Rental Affordability Index
31Rental Affordability Index
RAI SCORE RENT AS A SHARE OF INCOME
Greater Sydney 104 29%
Rest of NSW 158 19%
Greater Melbourne 119 25%
Rest of VIC 158 19%
Greater Brisbane 124 24%
Rest of QLD 139 22%
Greater Adelaide 148 20%
Rest of SA 196 15%
Greater Perth* 151 20%
Rest of WA* 154 19%
Greater Hobart 143 21%
Rest of TAS 186 16%
ACT 110 27%
TABLE 19. RAI FOR SINGLE INCOME COUPLE WITH CHILDREN
Source: SGS Economics and Planning (2017)*RAI has been calculated using median rents for all dwellings rather than 2 bdr due to data unavailability
⁶ This has been adjusted for different metropolitan/rest of state areas to reflect differences in earning across geographic locations in Australia.
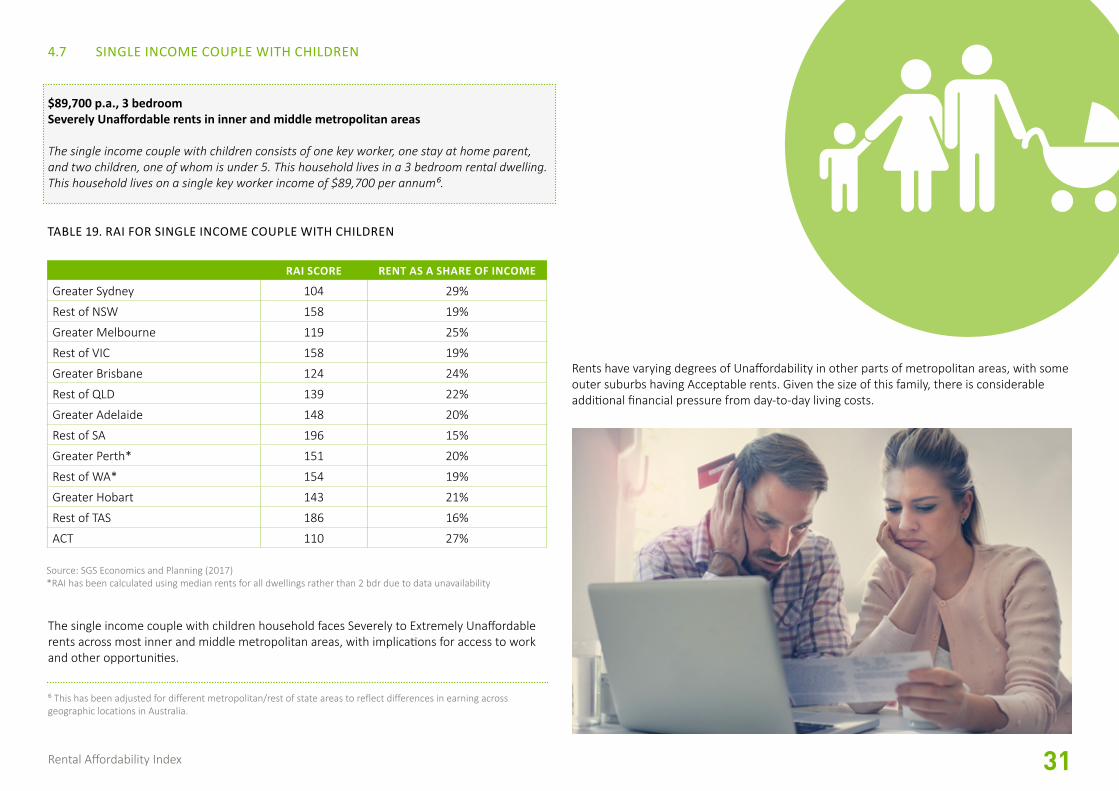
4.7 SINGLE INCOME COUPLE WITH CHILDREN
$89,700 p.a., 3 bedroomSeverely Unaffordable rents in inner and middle metropolitan areas
The single income couple with children consists of one key worker, one stay at home parent, and two children, one of whom is under 5. This household lives in a 3 bedroom rental dwelling. This household lives on a single key worker income of $89,700 per annum⁶.
The single income couple with children household faces Severely to Extremely Unaffordable rents across most inner and middle metropolitan areas, with implications for access to work and other opportunities.
Rents have varying degrees of Unaffordability in other parts of metropolitan areas, with some outer suburbs having Acceptable rents. Given the size of this family, there is considerable additional financial pressure from day-to-day living costs.
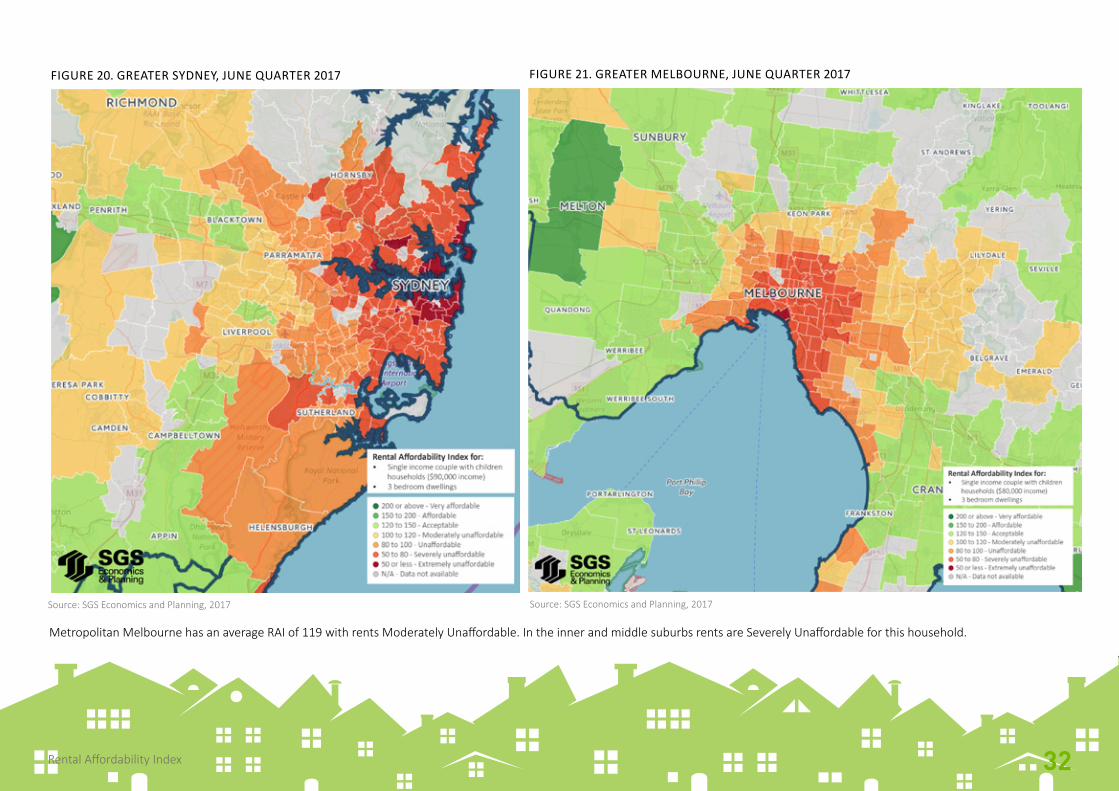
FIGURE 20. GREATER SYDNEY, JUNE QUARTER 2017 FIGURE 21. GREATER MELBOURNE, JUNE QUARTER 2017
Source: SGS Economics and Planning, 2017 Source: SGS Economics and Planning, 2017
Metropolitan Melbourne has an average RAI of 119 with rents Moderately Unaffordable. In the inner and middle suburbs rents are Severely Unaffordable for this household.
32Rental Affordability Index
33Rental Affordability Index
RAI SCORE RENT AS A SHARE OF INCOME
Greater Sydney 207 14%
Rest of NSW 316 9%
Greater Melbourne 238 13%
Rest of VIC 317 9%
Greater Brisbane 248 12%
Rest of QLD 277 11%
Greater Adelaide 296 10%
Rest of SA 393 8%
Greater Perth* 301 10%
Rest of WA* 308 10%
Greater Hobart 285 11%
Rest of TAS 371 8%
ACT 221 14%
TABLE 20. RAI FOR DUAL INCOME COUPLE WITH CHILDREN
Source: SGS Economics and Planning (2017)*RAI has been calculated using median rents for all dwellings rather than 3 bdr due to data unavailability
⁷ This has been adjusted for different metropolitan/rest of state areas to reflect differences in earning across geographic locations in Australia.
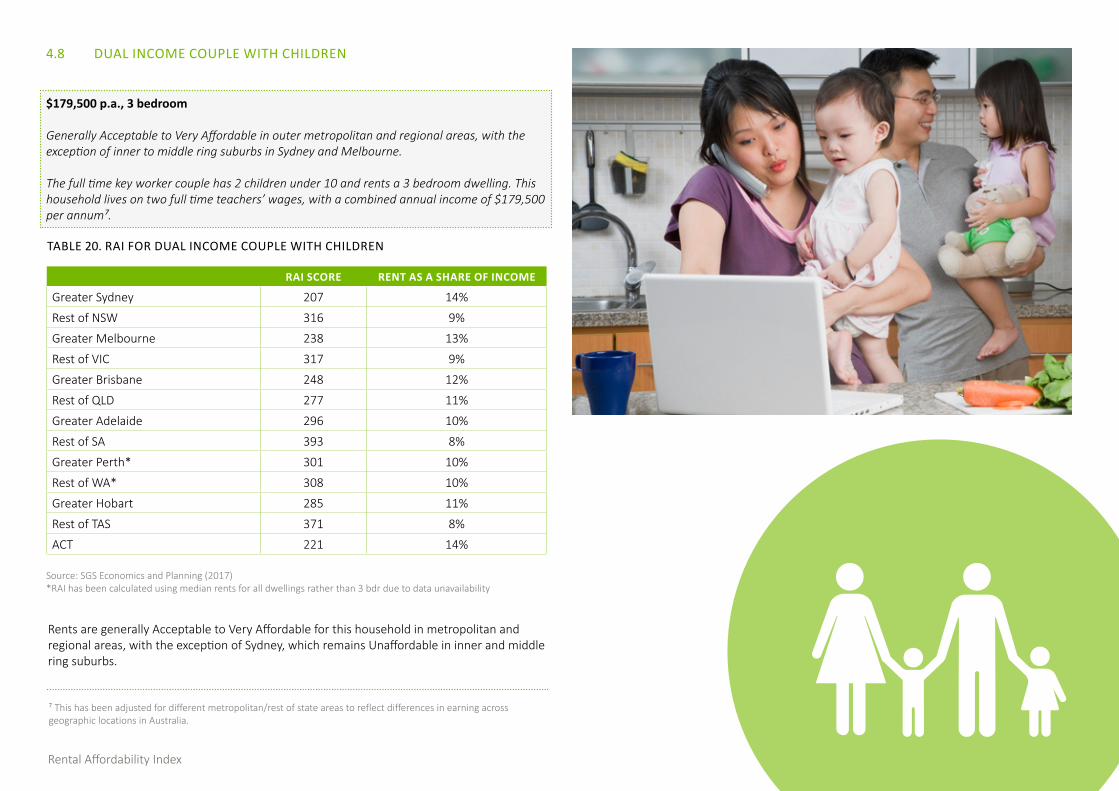
4.8 DUAL INCOME COUPLE WITH CHILDREN
$179,500 p.a., 3 bedroom
Generally Acceptable to Very Affordable in outer metropolitan and regional areas, with the exception of inner to middle ring suburbs in Sydney and Melbourne.
The full time key worker couple has 2 children under 10 and rents a 3 bedroom dwelling. This household lives on two full time teachers’ wages, with a combined annual income of $179,500 per annum⁷.
Rents are generally Acceptable to Very Affordable for this household in metropolitan and regional areas, with the exception of Sydney, which remains Unaffordable in inner and middle ring suburbs.
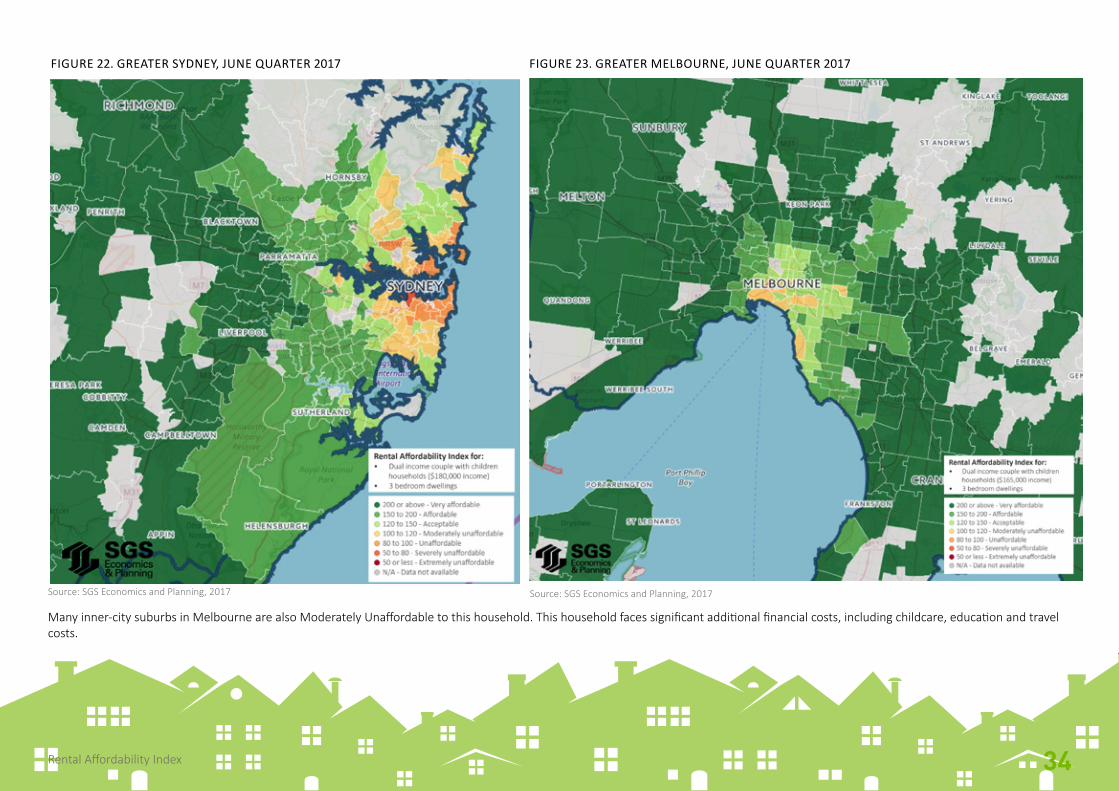
FIGURE 22. GREATER SYDNEY, JUNE QUARTER 2017 FIGURE 23. GREATER MELBOURNE, JUNE QUARTER 2017
Source: SGS Economics and Planning, 2017 Source: SGS Economics and Planning, 2017
Many inner-city suburbs in Melbourne are also Moderately Unaffordable to this household. This household faces significant additional financial costs, including childcare, education and travel costs.
34Rental Affordability Index
35Rental Affordability Index
RAI SCORE RENT AS A SHARE OF INCOME
Greater Sydney 87 34%
Rest of NSW 132 23%
Greater Melbourne 109 28%
Rest of VIC 145 21%
Greater Brisbane 109 28%
Rest of QLD 122 25%
Greater Adelaide 127 24%
Rest of SA 172 17%
Greater Perth* 301 10%
Rest of WA* 308 10%
Greater Hobart 120 25%
Rest of TAS 161 19%
ACT 91 33%
TABLE 21. RAI FOR STUDENT SHAREHOUSE
Source: SGS Economics and Planning (2017)*RAI has been calculated using median rents for all dwellings rather than 3 bdr due to data unavailability
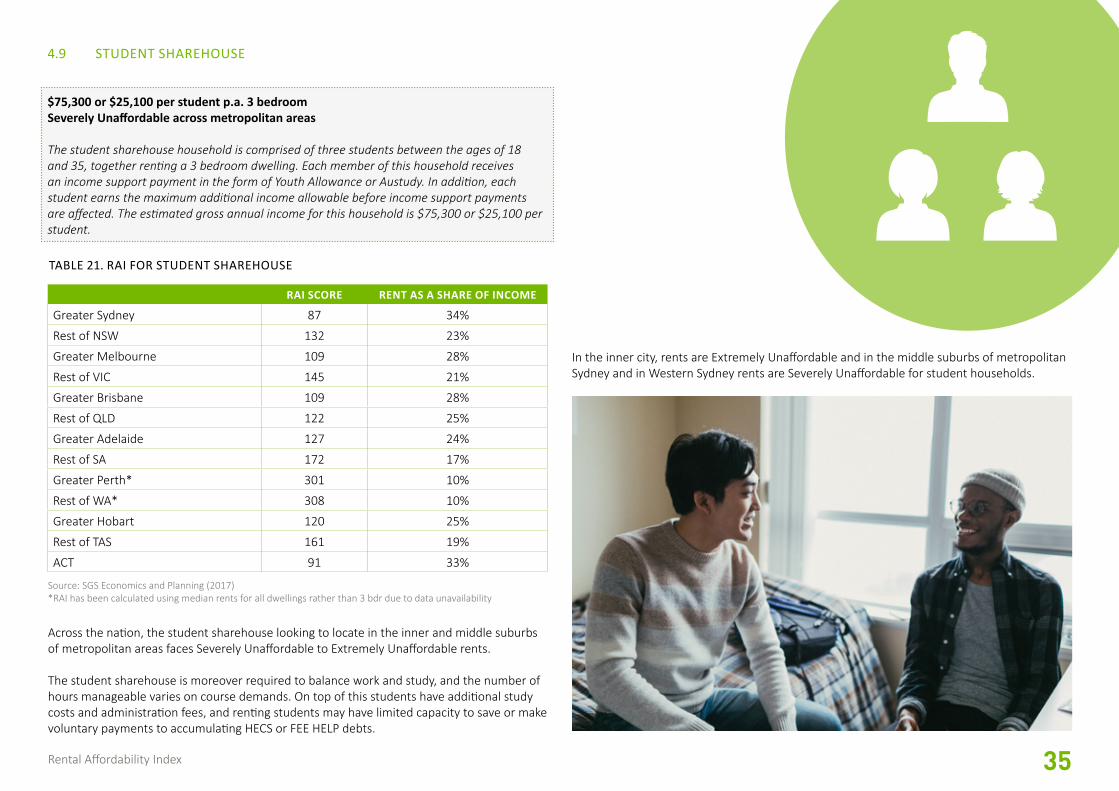
4.9 STUDENT SHAREHOUSE
$75,300 or $25,100 per student p.a. 3 bedroomSeverely Unaffordable across metropolitan areas
The student sharehouse household is comprised of three students between the ages of 18 and 35, together renting a 3 bedroom dwelling. Each member of this household receives an income support payment in the form of Youth Allowance or Austudy. In addition, each student earns the maximum additional income allowable before income support payments are affected. The estimated gross annual income for this household is $75,300 or $25,100 per student.
Across the nation, the student sharehouse looking to locate in the inner and middle suburbs of metropolitan areas faces Severely Unaffordable to Extremely Unaffordable rents.
The student sharehouse is moreover required to balance work and study, and the number of hours manageable varies on course demands. On top of this students have additional study costs and administration fees, and renting students may have limited capacity to save or make voluntary payments to accumulating HECS or FEE HELP debts.
In the inner city, rents are Extremely Unaffordable and in the middle suburbs of metropolitan Sydney and in Western Sydney rents are Severely Unaffordable for student households.
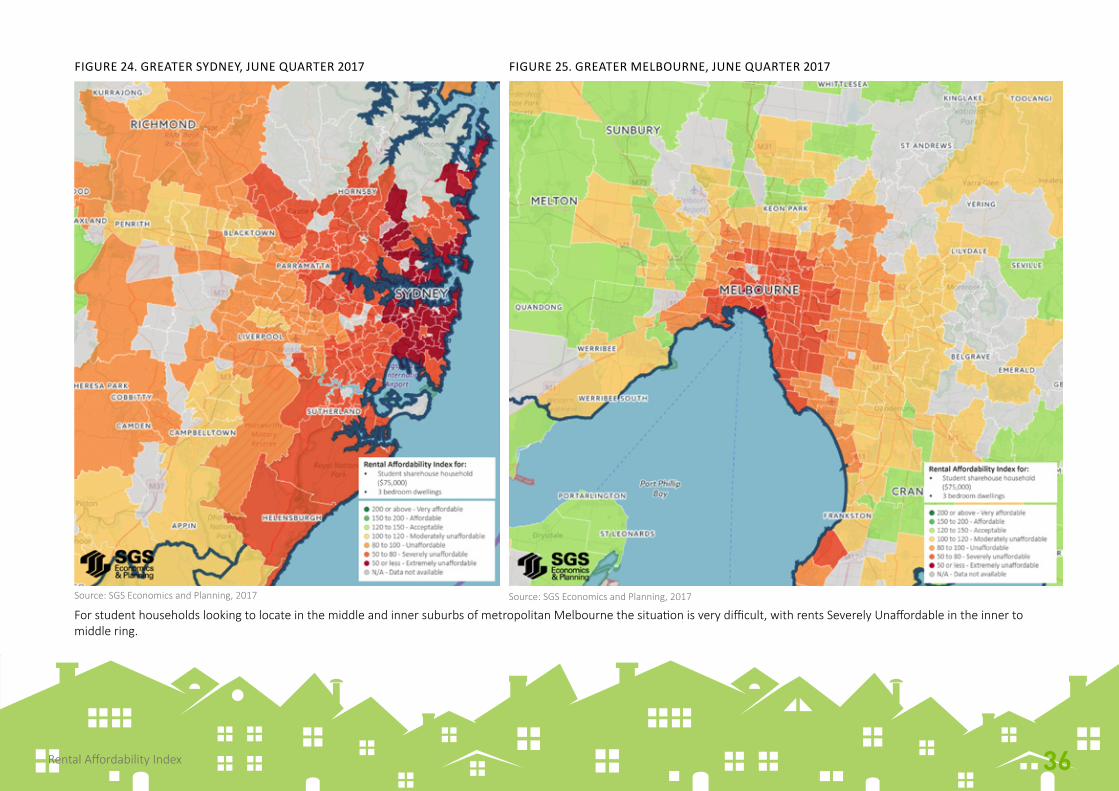
FIGURE 24. GREATER SYDNEY, JUNE QUARTER 2017 FIGURE 25. GREATER MELBOURNE, JUNE QUARTER 2017
Source: SGS Economics and Planning, 2017 Source: SGS Economics and Planning, 2017
For student households looking to locate in the middle and inner suburbs of metropolitan Melbourne the situation is very difficult, with rents Severely Unaffordable in the inner to middle ring.
Rental Affordability Index 36
37Rental Affordability Index
APPENDIX 1
The following provides information on state and territory specific methodological considerations, including exclusion parameters used to exclude outliers and erroneous data. Across all states, where no valid data was available, a RAI was not calculated.⁸
METROPOLITAN AND REST OF STATE ANALYSIS
AUSTRALIAN CAPITAL TERRITORY
� Metro and regional rents are calculated as true medians as unit records are available. � The overall RAI uses the median of all 1-10 bedroom dwellings. � All observations with fewer than 10 listings were excluded from the analysis.
NEW SOUTH WALES
� Regional level analysis uses the median rent of the Greater Metropolitan Region (GMR), as defined by Housing NSW. That is, the combined areas of: – Greater Sydney, and – The LGAs of Cessnock, Kiama, Lake Macquarie, Maitland, Newcastle, Port Stephens,
Shellharbour and Wollongong. � The average household incomes of the GMR is assumed to be equal to those in ‘Greater
Sydney’, as defined by the Australia Bureau of Statistics (GCCSA). � Data availability requires the overall RAI of Sydney and Rest of NSW to use the median
rental price of 3 bedroom dwellings rather than the median of ‘all dwellings.’ � Data for Metropolitan Sydney is available by postcode; for the Balance of NSW, data is
only available at LGA level. � Data was not available for areas with fewer than 10 listings; as such, this data was not
included in the analysis.
NORTHERN TERRITORY
� At this stage, adequate rental data has not been sourced to develop indices for the Northern Territory.
QUEENSLAND
� At this stage, rental data has been unavailable for all of Queensland. As a result indices for Queensland incorporate the following regions only: – Greater Brisbane (Brisbane City, Moreton Bay Regional, Logan City, Redland City and
Ipswich City Councils); – Sunshine Coast (Sunshine Coast Regional Council); – Gold Coast (Gold Coast City and Scenic Rim Regional Councils); – Darling Downs (Toowoomba Regional, Goondiwindi Regional, Western Downs
Regional and Southern Downs Regional Councils); – Central Queensland (Gympie Regional, Fraser Coast Regional, Bundaberg Regional,
Gladstone Regional, Rockhampton Regional, Livingstone Shire and Central Highlands Regional Councils); and
– North Queensland (Cairns Regional, Douglas Shire, Townsville City, Mackay Regional, Isaac regional, Whitsunday Regional, Mareeba Shire, Tablelands Regional, Burdekin Shire Councils).
� Medians for bedroom categories are computed as the weighted average of the medians from the constituent categories. E.g. the median rent of a 3 bedroom dwelling is estimated as the weighted average of the rents of 3 bedroom flats, 3 bedroom townhouses and 3 bedroom houses.
� The median rental price of ‘all dwellings’ is calculated as the weighted average of all 1-3 bedroom categories (this applies for overall RAI).
� Metro and regional median rents are not included in available data. They are calculated as the weighted average of postcode medians.
� Observations were excluded if there were fewer than 10 listings for that postcode.
SOUTH AUSTRALIA
� Medians for bedroom categories are computed as the weighted average of the medians from the constituent categories.
� Metro and regional median rents reflect true medians as they were supplied in the available data.
� As available data was separated into dwelling types, these medians were aggregated (using weighted averages) to estimate median rents for 2 and 3 bedroom dwellings.
� In the calculation of the RAI for average households across the state (i.e.. all dwellings), observations with fewer than 10 listings were excluded from the analysis.
⁸ Where a RAI could not be calculated, an ‘n/a’ is shown on the online map.
38Rental Affordability Index
TASMANIA
� Metro and regional rents are calculated as true medians as unit records are available. � The overall RAI uses the median of all 1-10 bedroom dwellings. � All observations with fewer than 10 listings were excluded from the analysis.
VICTORIA
� Metro and regional rents are calculated as true medians as unit records are available. � The overall RAI uses the median of all dwellings. � All observations with fewer than 10 listings were excluded from the analysis.
WESTERN AUSTRALIA
� Data was not reported if the median was based on fewer than 10 listings. � Metro and regional median rents are not included in available data. They are calculated
as the weighted average of postcode medians. � Data only includes median prices of ‘all dwellings’ by postcode (i.e. bedroom breakdown
isn’t available).

39Rental Affordability Index
APPENDIX 2 - REFERENCE LIST
REFERENCE LIST FOR HOUSEHOLD PROFILES
Australian Bureau of Statistics (ABS) Census Data. Average Weekly Warnings, Australia, November 2016.
Available online: http://www.abs.gov.au/ausstats/[email protected]/mf/6302.0
Australian Government Department of Social Services, Age Pension (2017).
Available online: https://www.dss.gov.au/seniors/benefits-payments/age-pension
Centrelink, Australian Government Department of Human Services (2017).
Available online: https://www.humanservices.gov.au/customer/dhs/centrelink
CANBERRALevel 2, 28-36 Ainslie AvenueCanberra ACT 2601+61 2 6257 [email protected]
HOBARTPO Box 123Franklin TAS 7113+61 421 372 [email protected]
MELBOURNELevel 14, 222 Exhibition StreetMelbourne VIC 3000+61 3 8616 [email protected]
SYDNEY209/50 Holt StreetSurry Hills NSW 2010+61 2 8307 [email protected]
Contact us