Embed Size (px)
Citation preview

Renovating Sewage Effluent by Ground-Water Recharge
Item Type text; Proceedings
Authors Bouwer, Herman; Lance, J. C.; Rice, R. C.
Publisher Arizona-Nevada Academy of Science
Journal Hydrology and Water Resources in Arizona and the Southwest
Rights Copyright ©, where appropriate, is held by the author.
Download date 21/05/2018 07:02:50
Link to Item http://hdl.handle.net/10150/300119

RENOVATING SEWAGE EFFLUENT BY GROUND -WATER RECHARGE
Herman Bouwer, J. C. Lance, and R. C. Rice
U. S. Water Conservation Laboratory, Soil and Water Conservation ResearchDivision, Agricultural Research Service, U. S. Department of Agriculture,
Phoenix, Arizona 85040
INTRODUCTION
Sewage effluent is commonly used for irrigation [Wilson and Beckett, 1968].
It contains enough nutrients (Table 1) to meet the fertilizer requirements of a
number of crops if the sewage supplies all or most of the water for the crop.
The most critical use of sewage effluent from a public health standpoint would be
sprinkler irrigation of lettuce and other crops that are consumed raw. This
requires a well treated effluent, usually consistent with the quality obtainable
by secondary treatment and disinfection, to yield total coliform densities of
less than 5000 per 100 ml and fecal coliform densities of less than 1000 per 100
ml [Water Quality Criteria, 1968; Wilson and Beckett, 1968]. In some cases,
however, the requirements are much stricter. The State of California, for
example, requires filtration of coagulated waste water through natural soil or
filter media and disinfection to obtain total coliform concentration not
exceeding 2.2 per 100 ml before the effluent can be used for sprinkler irrigation
of produce. Less stringent requirements are generally used for effluent that is
used for irrigation of nonedible crops or crops that are processed before they
are consumed [Calif. Standards, 1968].
If more sewage water is applied than needed for crop growth, the excess
water will move deeper into the ground to become "renovated" water, which can
225

be allowed to move naturally to streams or lakes, or can be collected with wells
or drains for rather unrestricted reuse. Sometimes, waste water renovation is
the major objective of land disposal, and agricultural use of the disposal
fields is of secondary importance, particularly if permeable soils are available
so that large land areas are not required. Another objective of land disposal
systems could be to keep the waste water out of streams or lakes, to reduce
pollution of surface water.
Because of the increasing need for using sewage effluent for purposes with
a higher economic return than irrigation of nonedible crops, interest in land
application as a form of tertiary treatment is rapidly increasing. The waste
water would then be used for ground -water recharge, employing basins, furrows,
or sprinklers to infiltrate the water into the soil, and drains or wells to
collect the renovated water for unrestricted irrigation, recreation, and indus-
trial and municipal uses.
The performance of a system for renovating waste water by ground -water
recharge depends on the local conditions of climate, soil, and ground water.
An experimental project is, therefore, frequently desirable to obtain design
information for the operational system so that renovated water with the desired
quality can be obtained at minimum cost. An example of such a pilot facility
is the Flushing Meadows Project near Phoenix, Arizona, which will be discussed
in the following sections.
REUSE OF SEWAGE EFFLUENT IN THE SALT RIVER VALLEY
Most of the sewage effluent of the cities in the Salt River Valley is
treated by the 91st Avenue Plant, which is an activated sludge plant handling
sewage from Phoenix, Tempe, Scottsdale, Mesa, and Glendale. The plant discharges
226

some 50 mgd of secondary effluent which may increase to about 250 mgd (about
300,000 acre -feet per year) by the year 2000. At 4.5 feet average annual water
use, this could irrigate about 70,000 acres, which may be more than the agricul-
tural land remaining in the Salt River Project at that time. The urban waste
water would thus be sufficient to meet all agricultural demands in the not too
distant future while leaving some for recreation and other purposes.
Because of the varied agriculture and the use of canal water for irrigation
of parks, playgrounds, private yards, and for recreational lakes, large scale
return of sewage effluent to the canal system requires that the effluent be
given tertiary treatment. Since the hydrogeological conditions in the Salt River
bed are favorable for ground -water recharge, the most economical way for renova-
ting the sewage effluent could be by ground -water recharge with infiltration
basins in the river bed. This bed is normally dry below Granite Reef dam (a
diversion structure 25 miles east of Phoenix) and it attains a width of about
one -half mile in the western part of the valley. The movement of the effluent
water through the sands and gravels of the river bed could be expected to remove
essentially all biodegradable materials and microorganisms, and to reduce the
concentration of other substances in the effluent. This would yield a renovated
water suitable for unrestricted irrigation, primary- contact recreation, and
other purposes.
To study the feasibility of renovating sewage effluent by ground -water
recharge, an experimental project, called the Flushing Meadows Project, was
installed in 1967. The project is located in the Salt River bed about 1 1/2
miles west of 91st Avenue. It is a cooperative effort between the U. S. Water
Conservation Laboratory of the U. S. Department of Agriculture and the Salt
227

River Project, and it was partially supported by a grant from the Federal Water
Quality Administration.
FLUSHING MEADOWS PROJECT
Description of System.
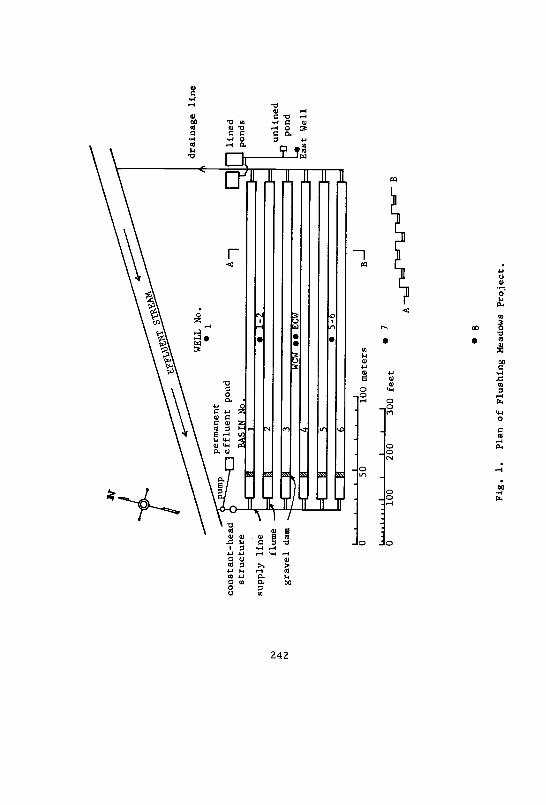
The project contains six parallel recharge basins, 20 x 700 ft each and
spaced 20 ft apart (Fig. 1). Secondary effluent is pumped from the discharge
channel of the 91st Avenue treatment plant into the basins at one end where the
flow is controlled by an alfalfa valve and measured with a triangular, critical
depth flume [Replogle, 1969]. The water depth in each basin is controlled by an
overflow structure at the other end, where the outflow is measured with another
flume. Water depths of 0.5 and 1 ft have been used. The infiltration rate for
each basin is calculated from the difference between the inflow and the outflow
rates.
The soil beneath the basins consists of about 3 ft of fine, loamy sand
underlain by a succession of coarse sand and gravel layers to a depth of 240 ft
where a clay deposit begins. The original saturated hydraulic conductivity of
the fine, loamy sand top layer was about 4 ft /day. The underlying sand and
gravel layers, which have been described in detail [Bouwer, 1970], can be con-
sidered as one anisotropic medium. The hydraulic conductivity of this medium is
282 ft /day horizontally and 17.6 ft /day vertically. These values were obtained
by electrical analog analysis and confirmed by permeability tests on the obser-
vation wells in the project area [Bouwer, 1970]. The static ground -water table
is at a depth of about 10 ft. Observation wells consisting of 6 -inch diameter
cased holes open at the bottom were installed at various locations in the project
area (Fig. 1). These wells, which range from 20 to 100 ft deep, are used to
228
obtain samples of the reclaimed water for chemical and bacteriological analyses
and to measure the response of the ground -water level to ground -water recharge.
In conformance with the theory of ground -water -mound formation below infil-
tration basins [Bouwer, 1962], the ground -water level rises rapidly after the
start of a new inundation period, but reaches a pseudo -equilibrium level in a few
days. When a dry -up period is started, the ground -water levels recede and reach
their original levels in a few days. Because of the high hydraulic conductivity
in horizontal direction of the aquifer, the height of the ground -water mound
during recharge is relatively low, i.e., 1.09 ft per 1 ft /day infiltration rate.
Infiltration Rates.
To evaluate the effect of surface condition of the basins on infiltration
rate, one basin was covered with a gravel layer, another was left in bare soil,
and the four remaining basins were planted with bermudagrass in 1968. Inundation
schedules ranged from 2 days wet and 3 days dry to 3 weeks wet and 3 weeks dry
(periodic drying of the basins is necessary to restore infiltration rates and to
allow oxygen to enter the soil). The infiltration rates were generally between
1 and 4 ft /day, depending on the water depth, the suspended solids content of
the effluent, and the length of the inundation and dry -up periods. During
inundation, the infiltration rate usually decreased almost linearly with time.
Tensiometer measurements in the soil beneath the basins and measurements of the
effect of water depth in the basins on the infiltration rate indicated that the
decrease in infiltration during inundation was mostly caused by clogging at the
soil surface.
After accounting for the soil variability between the basins, the infiltra-
tion in the grass basins was about 20% higher, and in the gravel- covered basin
229
50% lower, than in the bare soil basin [Bouwer, 1970]. The higher infiltration
rates in the grass basins were attributed mainly to the prevention of algal
growth on the bottom of the basins. The low infiltration rate in the gravel
basin was probably caused by poor drying of the soil beneath the gravel with
consequent slow recovery of the infiltration rate.
Maximum hydraulic loading or long -term infiltration was obtained with
inundation periods of about 2 weeks and dry -up periods of about 10 days in the
summer and 20 days in the winter. With this schedule, the average accumulated
infiltration for the year 1970 was 400 ft. Thus, one acre of recharge basin
can renovate 400 acre -feet per year, or 0.36 mgd.
Quality Improvement of Water.
The East Center Well (ECW, Fig. 1) is 30 ft deep. Water pumped from this
well has traveled vertically about 8 ft from the basin bottom to the ground
water table, and 22 ft from the water table to the bottom of the well. Since
the well is located midway between basins 3 and 4, the water has also traveled
about 10 ft horizontally. The time required for this travel ranged from 1 to
2 weeks, depending on the infiltration rate. Quality parameters of the water
from this well, which receives reclaimed sewage water that has infiltrated in
basins 3 and -4, and of the reclaimed water from the 20 -ft -deep wells 1 and 7
outside the basin area (Fig. 1) are shown in Table 2 in relation to the quality
of the sewage effluent (see also [Bouwer, 1970]).
Oxygen Demand. The data in Table 2 show that the 5 -day BOD of the reclaimed
water is essentially zero. The chemical oxygen demand (COD) is reduced from
50 to 17 ppm, which is about the same as the COD of the native ground water.
230

Nitrogen. The nitrogen in the effluent is almost all in the ammonium form.
This is mostly converted to nitrate in the reclaimed water if sequences of
short inundation periods (2 days wet - 3 days dry) are used. With longer
inundation periods (2 weeks wet - 2 weeks dry), nitrate nitrogen concentrations
in the reclaimed water are much lower (Table 2), with those below the grass
basins being lower than those below the nonvegetated basins. In 1968, for
example, the NO3 -N concentration in ECW -water during sequences of long inunda-
tion periods dropped from about 10 ppm to about 0.2 ppm after the bermudagrass
had reached maturity in basins 3 and 4, but the NO3 -N concentrations in the
water from well 1 -2, which had infiltrated in the nonvegetated basins 1 and 2,
remained in the 5- to 10 -ppm range.
The dependence of the NO3 -N concentration in the reclaimed water on the
length of the inundation period is illustrated in Fig. 2, which shows that
for the short inundation periods in July and August 1968 the NO3 N concentration
was about 21 ppm. For the long inundation periods for the rest of the year and
with full grass cover in basins 3 and 4, NO3 N concentrations were close to
zero after the passage of a NO3 -peak. This peak, which always occurred a few
days after the start of a new inundation period when sequences of long inunda-
tions were held, is due to the arrival of nitrified sewage water that was held
as capillary water in the soil during the preceding dry -up period. Also,
nitrate may have been formed by nitrification of ammonium held by the exchange
complex in the soil. The NO3 -peak arrived in ECW from 5 to 11 days after the
start of an inundation period, depending on the infiltration rate in the basins.
Thus, the underground detention time of the water pumped from ECW is in the
231

5- to 11 -day range. At greater distances from the recharge basins, the peaks
become less distinct.
The NH4 -N content of the reclaimed water usually ranges from 5 to 15 ppm
and apparently is not much affected by the length of the inundation periods used
at the Flushing Meadows Project. Thus, before and after the passage of the NO3-
peak, the total nitrogen in the reclaimed water during long inundation periods
in the vegetated basins is about 40 to 80% less than that in effluent.
The nitrogen behavior in the renovated water is probably due to adsorption
of ammonium by the clay and organic matter in the soil, which could begin after
the start of an inundation period when oxygen for nitrification is no longer
available. Before the adsorption capacity for ammonium is reached, the basins
should be dried. The presence of oxygen in the soil will then cause nitrifi-
cation of the adsorbed ammonium. Part of the nitrates formed in this process
can subsequently be denitrified, either during dry -up or during the next
inundation, with the nitrogen gas escaping to the atmosphere or moving out as
dissolved nitrogen with the downward moving water. Storage of nitrogen in the
soil was small and could not account for the amounts of nitrogen removed from
the sewage water.
Phosphates. Phosphorus, which occurs mainly in the form of orthophosphates in
the effluent, is reduced from about 13 ppm P in the effluent to about 5 ppm P
in the reclaimed water from ECW (Table 2). Further reductions in P- content
occur with additional lateral movement of the reclaimed water below the water
table (see P- contents for wells 1 and 7 in Table 2). Extrapolation of the
P- removal in relation to distance of underground travel shows that at a distance
232

of about 100 to 200 ft from the recharge basins, very small P concentrations
can be expected.
In the sandy and gravelly materials of the Flushing Meadows Project, P
probably is removed by precipitation of calcium -phosphate complexes such as
apatite. Assuming that all P is precipitated as apatite in a soil volume 30 ft
deep and 4 times as wide as the width of the recharge area, the apatite would
occupy 0.5% of the total volume after a period of 200 years. Assuming a porosity
of 20 %, the apatite would thus take up about 2.5% of the pore space. This is
small and will likely not have a significant effect on the hydraulic conductivity
of the aquifer. If the soil is rich in iron and aluminum oxides, high rates of
P- removal can be expected over shallow depths of soil [Kardos, 1967; Taylor, 1967].
Fluorides. The removal of fluorides also continues as the water moves laterally
below the water table, as indicated by the lower F- concentrations in wells 1 and
7 than in ECW, which in turn contains about half as much fluorides as the efflu-
ent (Table 2). Fluorides may be adsorbed on clay minerals [Bower and Hatcher,
1967] or be precipitated as fluor -apatites or calcium fluoride.
Boron. The boron concentration is about 0.7 ppm and remains unchanged as the
water moves downward through the soil and laterally below the water table (Table
2). Thus the sands and gravels appear to contain few aluminum and iron oxides,
which are effective in removing boron [Sims and Bingham, 1968]. Boron concentra-
tions above 0.5 ppm in irrigation water can be damaging to some of the more
sensitive crops such as citrus, stone and pome fruits.
Salts and pH. The average salt concentration of the reclaimed water is 1060
ppm, which is about 4% higher than that of the sewage effluent (Table 2). This
can be attributed to evaporation from the water in the recharge basins (average
233

annual evaporation from a free water surface in the Phoenix area is about 6 ft).
The pH of the reclaimed water is somewhat lower than that of the sewage effluent
(Table 1), probably because of CO2 production by the soil bacteria.
Coliform Density. The total coliform density in the reclaimed water from ECW,
determined weekly with the multiple -tube fermentation technique, was higher
during sequences of inundation periods of 2 -3 weeks than during inundation
periods of 2 -3 days, i.e., median MPN- values were about 200 per 100 ml for the
long periods and 5 per 100 ml for the short periods.
The fecal coliform density in the reclaimed water was very low and often
zero (Table 2). The number of fecal coliforms tended to increase somewhat
after the start of a new inundation period when newly infiltrated water had
arrived at the bottom of the well. The same trend was true for the presumptive
MPN of coliforms, which sometimes reached a value of several hundred per 100 ml.
After the end of an inundation period, the presumptive MPN of coliforms in the
ECW water generally decreased and reached a value of close to zero in about
3 weeks. Therefore, it is concluded that an additional underground detention
time of about 1 month should be sufficient for essentially complete removal of
all coliform organisms. Regrowth of nonfecal coliforms, such as Aerobacter
aerogenes in sewage water as it moves through the ground has sometimes been
observed [McMichael and McKee, 1965].
Economic Aspects and Large -Scale System.
The cost of reclaiming water from sewage effluent or other liquid waste by
soil percolation and ground -water recharge depends on the climate and on the
topographic and hydrogeologic conditions. On flat land, the effluent may be
applied by basins or furrows. On sloping land, contour furrows or sprinkler
234

systems may be used. Where the infiltration rates are low, large land areas may
be required and it may be more economical to combine the recharge system with
agricultural utilization of the land [Bouwer, 1968; Kardos, 1967; and references
therein].
The design of ground-water recharge systems for waste -water reclamation
should be based on three criteria: (a) avoiding a rise of the ground -water
table below the recharge basins above a certain maximum elevation, (b) locating
the facilities for collecting the reclaimed water (wells, drains, or trenches)
a certain distance from the recharge areas to allow sufficient time and distance
of underground travel for the reclaimed water, and (c) minimizing the spread of
reclaimed water into the aquifer outside the recharge system. For a more
detailed discussion of the design of recharge systems for renovating waste water
and of techniques for evaluating hydraulic properties of aquifers and predicting
water table positions and underground detention times, reference is made to
[Bouwer, 1970].
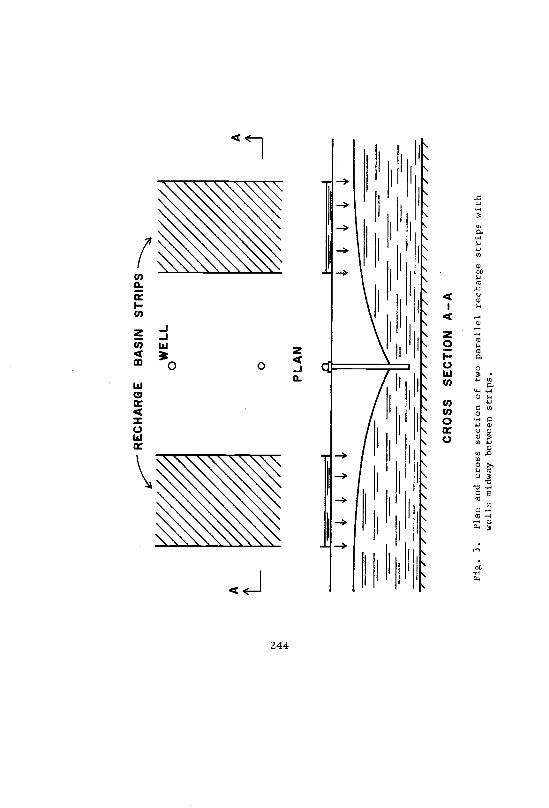
For the Salt River bed, recharge basins could be located on both sides of
the river bed (Fig. 3). The distance between the two recharge strips would be
about 1000 ft. Wells for pumping the reclaimed water could be placed in the
center of the river bed, thus insuring a minimum underground travel distance of
about 500 ft for the renovated water. With an annual infiltration of about 330
ft in the basins, about 900 acres of recharge basins would be required to
renovate the annual volume of 300,000 acre -feet of sewage water expected by the
year 2000. The cost of reclaiming the sewage water in this manner is expected
to be about $5 per acre -foot, including amortization of capital investment and
operating and pumping costs. The cost of in -plant tertiary treatment to obtain
235

reclaimed water of similar quality would be at least ten times as much [Bouwer,
1968, and references therein].
SUMMARY
Due to continued population growth in the Salt River Valley, Arizona, reuse
of municipal waste water becomes essential. A pilot project was installed in
1967 to determine if the tertiary treatment necessary to permit large -scale
reuse of sewage water for irrigation and recreation could be obtained effectively
and economically by ground -water recharge with infiltration basins in the
normally dry Salt River bed. The hydrogeological conditions of the Salt River
bed, i.e., about 3 ft of fine, loamy sand underlain by sand and gravel layers
to great depth and a ground -water table at about 10 ft depth, are favorable for
high -rate waste water reclamation by ground -water recharge. Results so far
indicate that the infiltration rate in grass- covered basins is 25% higher, and
in a gravel- covered basin 50% lower, than in a bare soil basin. Alternating
2 -week inundation periods with 10 -day dry -up periods (17 days in winter) yields
an annual infiltration rate of about 400 ft.
Reclaimed water, pumped from 30 ft depth in the center of the recharge
area, has a biochemical oxygen demand of about 0.5 mg /liter (BOD of the sewage
effluent is about 15 mg /liter) and a median fecal coliform density of 10 per
100 ml. Nitrogen, which is almost all in the ammonium form at a concentration
of 25 ppm N in the sewage effluent, is essentially all converted to the nitrate
form in the reclaimed water if sequences of short inundation periods (3 days or
less) are held. With inundation periods of 2 to 3 weeks, the reclaimed water
has about 40 to 80 percent less nitrogen than the sewage effluent, except for
a short period occurring 1 to 2 weeks after the start of a new inundation, when
236

a nitrate peak occurs in the reclaimed water. This peak is due to the arrival
of nitrified effluent water held as capillary water in the soil during the
preceding dry -up period. The nitrogen removal is probably mostly due to denitri-
fication and adsorption of ammonium in the soil. More nitrogen was removed
under vegetated infiltration basins than under nonvegetated basins.
Phosphate concentrations in the reclaimed water pumped from 30 -ft depth in
the center of the recharge area are around 5 ppm P, as compared to 13 ppm in the
effluent. Further horizontal movement of the reclaimed water below the water
table gives additional reduction in the phosphate content, as indicated by the
concentration of 1.5 ppm P in the water pumped at 100 ft distance from the infil-
tration basins. Fluorides are reduced from 4.5 ppm in the effluent to 2.5 ppm
at 3 -ft depth in the center of the area and to 1.9 ppm at 100 ft from the
basins. Boron removal does not take place because the sands and gravels contain
little or no iron or aluminum oxides. The boron concentration is around 0.7 ppm,
however, which is slightly above the level where the yield of the more sensitive
crops will be affected when the water is used for irrigation.
To reclaim the sewage flow of about 300,000 acre -feet per year that is
expected in the Phoenix area by the year 2000, about 900 acres of infiltration
basins would be required. These basins could be located on both sides of the
Salt River bed. The reclaimed water would be pumped up by wells in the center
of the river bed. The minimum underground travel distance and detention time
would be about 500 ft and 1 month, respectively. Cost of reclaiming water in
this manner would be about $5 per acre -foot, which is less than one -tenth the
cost of equivalent, in -plant tertiary treatment.
237
REFERENCES
Bouwer, Herman, "Analyzing Ground -Water Mounds by Resistance Network," Journal,
Irrigation and Drainage Division, American Society of Civil Engineers,
88(IR 3), 1962, pp. 15 -36.
Bouwer, Herman, "Returning Wastes to the Land -- A New Role for Agriculture,"
Journal, Soil and Water Conservation, 23, 1968, pp. 164 -168.
Bouwer, Herman, "Ground -Water Recharge Design for Renovating Waste Water,"
Journal, Sanitary Engineering Division, Proceedings, American Society of
Civil Engineers, 96(SA 1), 1970, pp. 59 -74.
Bouwer, Herman, "Water Quality Aspects of Intermittent Systems Using Secondary
Sewage Effluent," Paper No. 8, Artificial Ground -Water Recharge Conference,
University of Reading, England, sponsored by Water Research Association,
21 -24 September 1970.
Bower, C. A., and Hatcher, J. R., "Adsorption of Fluoride by Soil and Minerals,"
Soil Science, 103, 1967, pp. 151 -154.
California Department of Water Resources, "Feasibility of Reclamation of Water
from Wastes in the Los Angeles Metropolitan Area," Bul. 80, California
Department of Water Resources, Sacramento, 1961.
California Statewide Standards for Safe Direct Use of Reclaimed Waste Water for
Irrigation and Recreational Impoundments. Calif. Adm. Code, Title 17,
Chapter 5, 1968.
Kardos, L. T., "Waste Water Renovation by the Land - A Living Filter," In
Agriculture and the Quality of our Environment, N. C. Brady, editor,
Publication 85, American Association for the Advancement of Science,
Washington, D. C., 1967.
238
McMichael, F. C., and McKee, J. E., "Research on Waste Water Reclamation at
Whittier Narrows," W. M. Keck Laboratory of Environmental Health Engineering,
California Institute of Technology, Pasadena, 1965.
Replogle, J. A., "Flow Measurement with Critical Depth Flumes," International
Commission on Irrigation and Drainage, Proceedings, 7th Congress, Mexico
City, Question 24, R15, 1969, pp. 215 -235.
Sims, J. R., and Bingham, F. T., "Retention of Boron by Layer Silicates,
Sesquioxides, and Soil Materials: II. Sesquioxides," Proceedings,
Soil Science Society of America, 32, 1968, pp. 364 -369.
Taylor, A. W., "Phosphorus and Water Pollution," Journal, Soil and Water
Conservation, 22, 1967, pp. 228 -242.
Water Quality Criteria. Report of Nat. Techn. Adv. Comm. to Secretary of
Interior. Federal Water Quality Administration, April 1, 1968, Washington,
D. C.
Wilson, C. W., and Beckett, F. E., Edtrs., Municipal Sewage Effluent for
Irrigation. Louisiana Polytechnic Institute, Ruston, July, 1968.
239
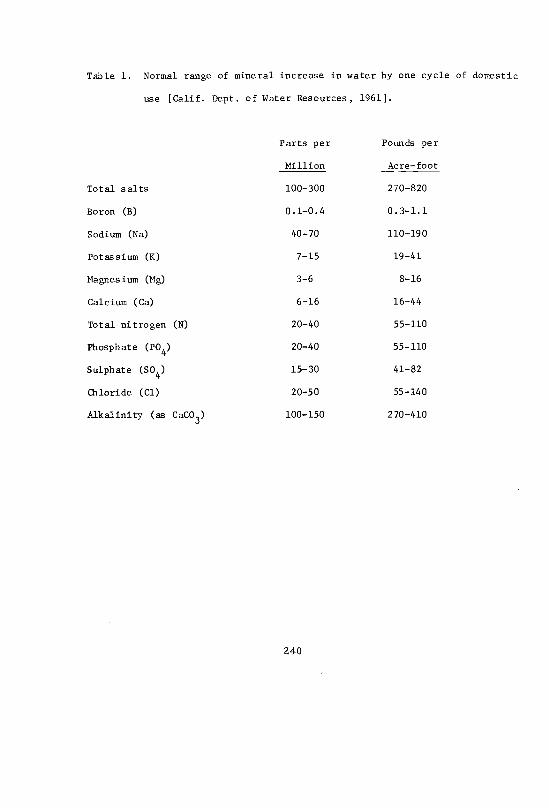
Table 1. Normal range of mineral increase in water by one cycle of domestic
use [Calif. Dept. of Water Resources, 1961].
Total salts
Boron (B)
Sodium (Na)
Parts per
Million
Pounds per
Acre -foot
100 -300
0.1 -0.4
40 -70
270 -820
0.3 -1.1
110 -190
Potassium (K) 7 -15 19 -41
Magnesium (Mg) 3 -6 8 -16
Calcium (Ca) 6 -16 16 -44
Total nitrogen (N) 20 -40 55 -110
Phosphate (PO4) 20 -40 55 -110
Sulphate (SO4) 15 -30 41 -82
Chloride (C1) 20 -50 55 -140
Alkalinity (as CaCO3) 100 -150 270 -410
240
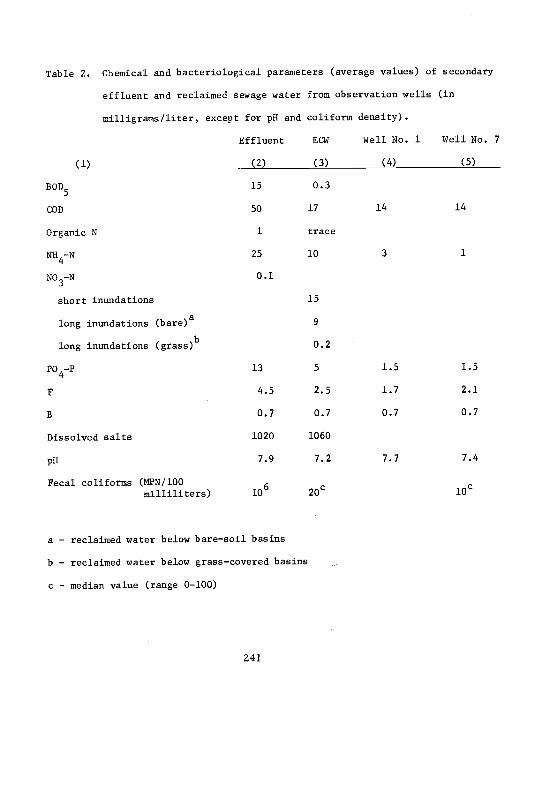
Table 2. Chemical and bacteriological parameters (average values) of secondary
effluent and reclaimed sewage water from observation wells (in
milligrams /liter, except for pH and coliform density).
Effluent ECW Well No. 1 Well No.
(1) (2) (3) (4) (5)
BOD5 15 0.3
COD 50 17 14 14
Organic N 1 trace
NH4 -N 25 10 3 1
NO3 N 0.1
short inundations 15
long inundations (bare)8 9
long inundations (grass)b 0.2
PO4 P 13 5 1.5 1.5
F 4.5 2.5 1.7 2.1
B 0.7 0.7 0.7 0.7
Dissolved salts 1020 1060
pH 7.9 7.2 7.7 7.4
Fecal coliforms (MPN /100milliliters) 106 20c lot
a - reclaimed water below bare -soil basins
b - reclaimed water below grass- covered basins
c - median value (range 0 -100)
241
7
drainage line
constant -head
structure
supply line
ivflume
íßv
gravel dam
I 0
lined
ponds
unlined
pond
East Well
1.
50
100 meters
1..
i
0100
200
300 feet
7 B
B
A
Fig. 1.
Plan of Flushing Meadows Project.

40 302 a a w
20C
D O I- z
10
1.
1.
1
11
11
.1
1f
11
III
I
INU
ND
AT
ION
PE
RIO
DS
.
1968
.. ,
.
*ti
,!
, - -
l'I
l'l'
1
11
I
TO
TA
L E
FF
LUE
NT
NIT
RO
GE
NN
ITR
AT
E N
OF
EC
W
AM
MO
NIU
M N
OF
EC
W11
y1
II
I
OI
.
I1
I 6',4
401(
I.1
JULY
AU
G.
SE
PT
.O
CT
.
tYV
-a Y
/N
OV
.D
EC
.
Fig. 2.
Total nitrogen in sewage effluent and nitrate and ammonium nitrogen in
reclaimed water from East Center Well in relation to inundation
schedule (July- December 196b).
RE
CH
AR
GE
BA
SIN
ST
RIP
S -
WE
LL
o
PLA
N
yy
A
CR
OS
S S
EC
TIO
N A
-A
Fig. 3.
Plan and cross section of two parallel recharge strips with
wells midway between strips.