Embed Size (px)
Citation preview
The Energy Reality
Regulatory Disclosures and policy on the dissemination of research: last page or at www.altacorpcapital.com.
Renewables vs. Hydrocarbons
The Energy Reality
The Energy Reality
The Energy Reality APRIL 2011 pg 1
Table of Contents
Executive Summary ...................................................................................................... 2
What Are Our Sources of Energy Now?....................................................................... 8
What Can Replace Hydrocarbons? ............................................................................ 10
Economic Reality – An “Apples to Apples” Comparison ............................................ 11
Cost of Capital ............................................................................................................ 20
Sensitivity Analysis – What Will Drive Variability in Cost Estimates? ........................ 23
Economic Reality – Subsidies Required .................................................................... 35
Tragedy of the Hydrocarbons ..................................................................................... 39
Practical Reality – An Integrated System View .......................................................... 40
Practical Reality – What Would it Take to Replace Hydrocarbons? .......................... 49
Practical Reality – Replacing U.S. Coal-Fired Electricity ........................................... 55
Practical Reality – Replacing Global Coal-Fired Electricity ........................................ 58
Scenarios for Energy Growth and Conversion to Alternatives ................................... 59
The Critical Role of Oil & Gas in a Long-Term Energy Strategy ................................ 67
Suggestions / Recommendations ............................................................................... 68
Conclusion .................................................................................................................. 72
Table of Figures .......................................................................................................... 74
Sources ...................................................................................................................... 75
Glossary of Terms ...................................................................................................... 78
John Mawdsley, P.Geol.
Managing Director, Institutional Research
403 539 8606 Direct
Craig Espey, MBA
April 2011
The Energy Reality
The Energy Reality APRIL 2011 pg 2
Executive Summary
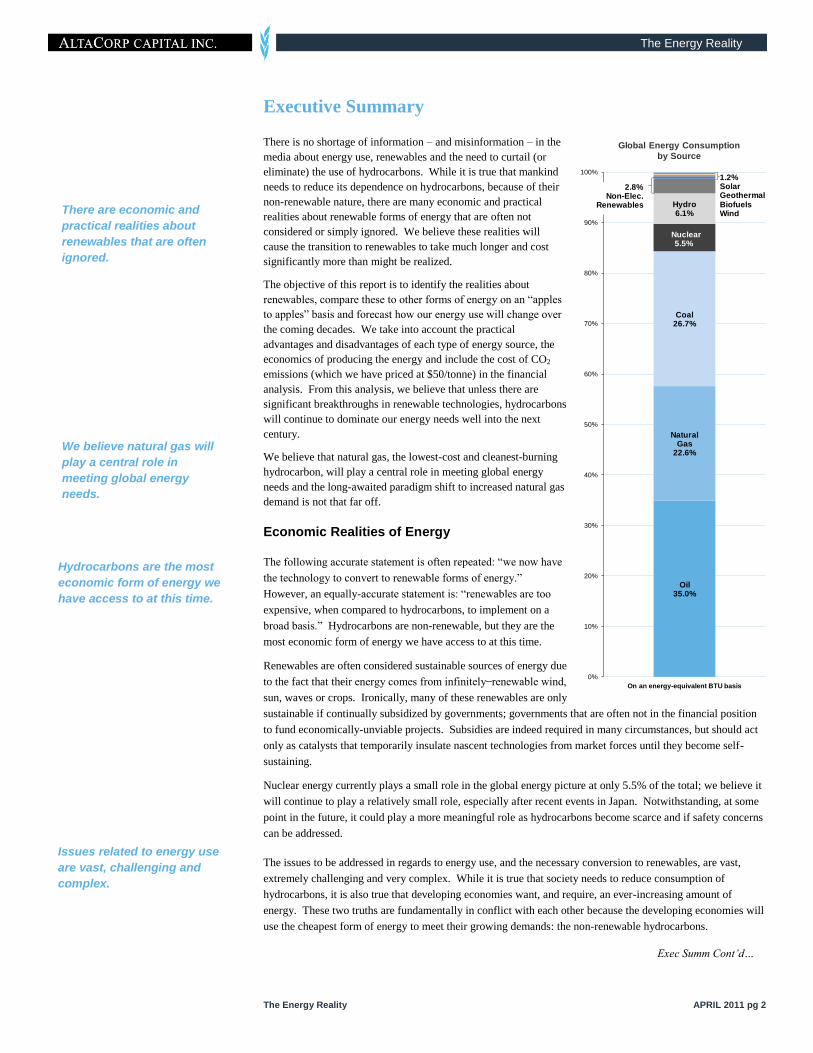
There is no shortage of information – and misinformation – in the
media about energy use, renewables and the need to curtail (or
eliminate) the use of hydrocarbons. While it is true that mankind
needs to reduce its dependence on hydrocarbons, because of their
non-renewable nature, there are many economic and practical
realities about renewable forms of energy that are often not
considered or simply ignored. We believe these realities will
cause the transition to renewables to take much longer and cost
significantly more than might be realized.
The objective of this report is to identify the realities about
renewables, compare these to other forms of energy on an “apples
to apples” basis and forecast how our energy use will change over
the coming decades. We take into account the practical
advantages and disadvantages of each type of energy source, the
economics of producing the energy and include the cost of CO2
emissions (which we have priced at $50/tonne) in the financial
analysis. From this analysis, we believe that unless there are
significant breakthroughs in renewable technologies, hydrocarbons
will continue to dominate our energy needs well into the next
century.
We believe that natural gas, the lowest-cost and cleanest-burning
hydrocarbon, will play a central role in meeting global energy
needs and the long-awaited paradigm shift to increased natural gas
demand is not that far off.
Economic Realities of Energy
The following accurate statement is often repeated: “we now have
the technology to convert to renewable forms of energy.”
However, an equally-accurate statement is: “renewables are too
expensive, when compared to hydrocarbons, to implement on a
broad basis.” Hydrocarbons are non-renewable, but they are the
most economic form of energy we have access to at this time.
Renewables are often considered sustainable sources of energy due
to the fact that their energy comes from infinitely renewable wind,
sun, waves or crops. Ironically, many of these renewables are only
sustainable if continually subsidized by governments; governments that are often not in the financial position
to fund economically-unviable projects. Subsidies are indeed required in many circumstances, but should act
only as catalysts that temporarily insulate nascent technologies from market forces until they become self-
sustaining.
Nuclear energy currently plays a small role in the global energy picture at only 5.5% of the total; we believe it
will continue to play a relatively small role, especially after recent events in Japan. Notwithstanding, at some
point in the future, it could play a more meaningful role as hydrocarbons become scarce and if safety concerns
can be addressed.
The issues to be addressed in regards to energy use, and the necessary conversion to renewables, are vast,
extremely challenging and very complex. While it is true that society needs to reduce consumption of
hydrocarbons, it is also true that developing economies want, and require, an ever-increasing amount of
energy. These two truths are fundamentally in conflict with each other because the developing economies will
use the cheapest form of energy to meet their growing demands: the non-renewable hydrocarbons.
There are economic and
practical realities about
renewables that are often
ignored.
Hydrocarbons are the most
economic form of energy we
have access to at this time.
We believe natural gas will
play a central role in
meeting global energy
needs.
Issues related to energy use
are vast, challenging and
complex.
Exec Summ Cont’d…
Oil 35.0%
Natural Gas
22.6%
Coal 26.7%
Nuclear 5.5%
Hydro 6.1%
0%
10%
20%
30%
40%
50%
60%
70%
80%
90%
100%
On an energy-equivalent BTU basis
Global Energy Consumption
by Source
1.2%SolarGeothermalBiofuels Wind
2.8%Non-Elec.
Renewables
The Energy Reality
The Energy Reality APRIL 2011 pg 3
An Energy-Equivalent Economic Analysis
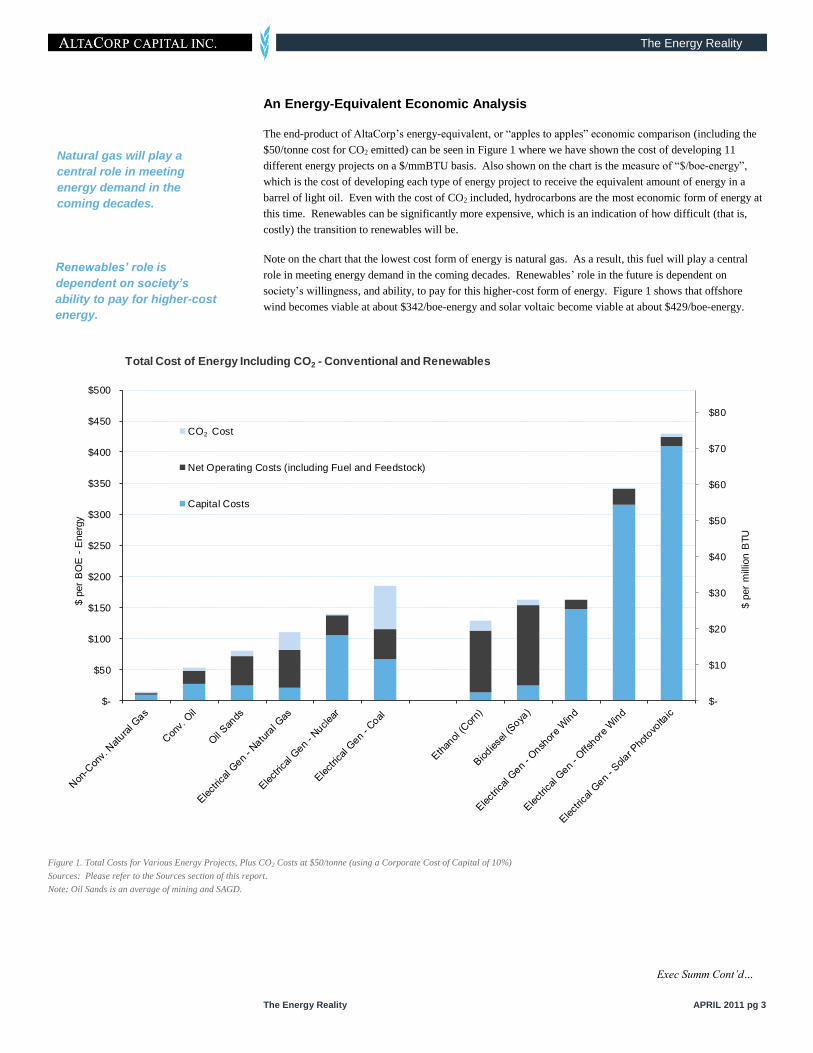
The end-product of AltaCorp‟s energy-equivalent, or “apples to apples” economic comparison (including the
$50/tonne cost for CO2 emitted) can be seen in Figure 1 where we have shown the cost of developing 11
different energy projects on a $/mmBTU basis. Also shown on the chart is the measure of “$/boe-energy”,
which is the cost of developing each type of energy project to receive the equivalent amount of energy in a
barrel of light oil. Even with the cost of CO2 included, hydrocarbons are the most economic form of energy at
this time. Renewables can be significantly more expensive, which is an indication of how difficult (that is,
costly) the transition to renewables will be.
Note on the chart that the lowest cost form of energy is natural gas. As a result, this fuel will play a central
role in meeting energy demand in the coming decades. Renewables‟ role in the future is dependent on
society‟s willingness, and ability, to pay for this higher-cost form of energy. Figure 1 shows that offshore
wind becomes viable at about $342/boe-energy and solar voltaic become viable at about $429/boe-energy.
Figure 1. Total Costs for Various Energy Projects, Plus CO2 Costs at $50/tonne (using a Corporate Cost of Capital of 10%)
Sources: Please refer to the Sources section of this report.
Note: Oil Sands is an average of mining and SAGD.
Natural gas will play a
central role in meeting
energy demand in the
coming decades.
Renewables’ role is
dependent on society’s
ability to pay for higher-cost
energy.
Exec Summ Cont’d…
$-
$10
$20
$30
$40
$50
$60
$70
$80
$-
$50
$100
$150
$200
$250
$300
$350
$400
$450
$500
$ p
er
mill
ion B
TU
$ p
er
BO
E -
Energ
y
Total Cost of Energy Including CO2 - Conventional and Renewables
CO2 Cost
Net Operating Costs (including Fuel and Feedstock)
Capital Costs
2
The Energy Reality
The Energy Reality APRIL 2011 pg 4
Practical Realities of Energy
Over 84% of global energy now comes from hydrocarbons; replacing these will not be easy.
Limited arable land (suitable for crops) is available for growing biofuel feedstocks and there are
serious ethical issues related to using food crops for fuel in an over-populated and under-fed world.
Although there are some small applications for the storage of electricity such as electric cars, there
are no utility-scale technologies to store energy created by solar and wind.
Many renewables create electricity, which is impractical in most transportation applications.
Individuals in developing economies want (or expect) higher standards of living, and higher per
capita energy use is central in that objective. Compounding this is the ongoing natural growth in
world population.
There is a realization that we – as a global society – need to move to renewable sources of energy. This is not
in dispute, because hydrocarbons are a depleting resource. Although we do have the technological capability
to implement renewable energy such as wind, solar and biofuels, there are many practical limitations to their
eventual replacement of hydrocarbons. For instance, solar power is only generated when the sun shines, wind
energy is only generated when the wind blows and there is no practical way to store the electrical energy to
balance a broad-based electrical grid. Biofuel production is increasing, but the energy derived from food-
based crops could be used to feed millions of people.
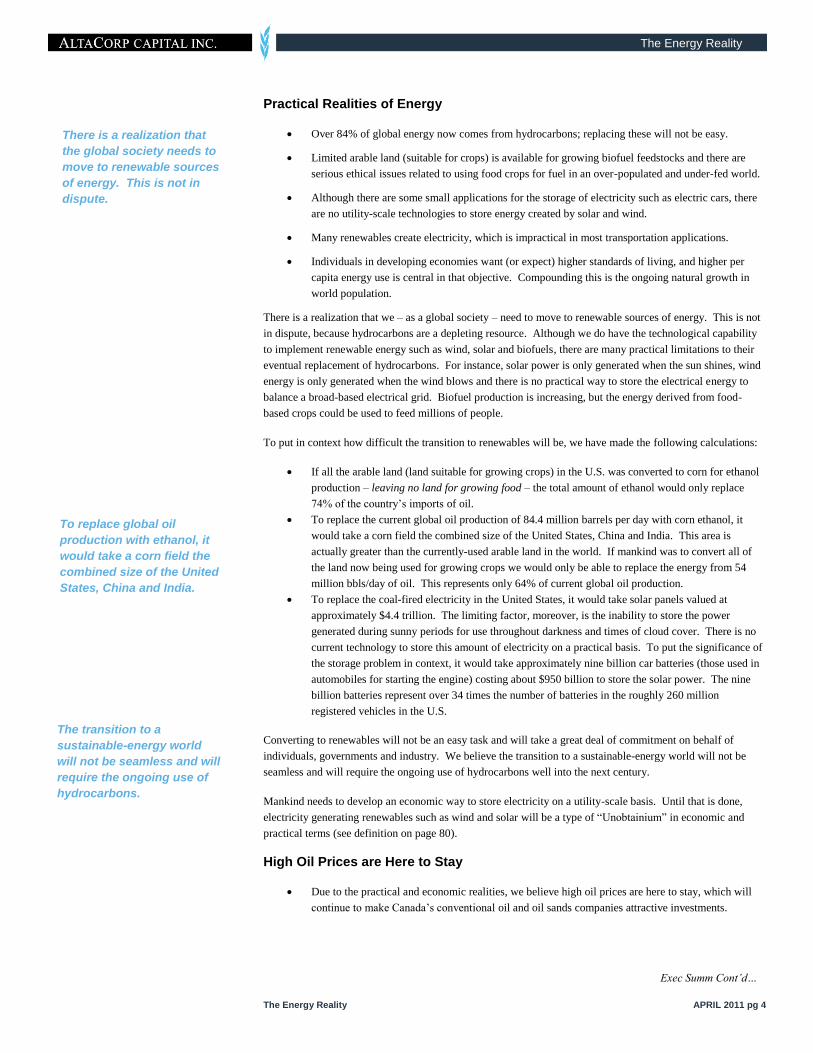
To put in context how difficult the transition to renewables will be, we have made the following calculations:
If all the arable land (land suitable for growing crops) in the U.S. was converted to corn for ethanol
production – leaving no land for growing food – the total amount of ethanol would only replace
74% of the country‟s imports of oil.
To replace the current global oil production of 84.4 million barrels per day with corn ethanol, it
would take a corn field the combined size of the United States, China and India. This area is
actually greater than the currently-used arable land in the world. If mankind was to convert all of
the land now being used for growing crops we would only be able to replace the energy from 54
million bbls/day of oil. This represents only 64% of current global oil production.
To replace the coal-fired electricity in the United States, it would take solar panels valued at
approximately $4.4 trillion. The limiting factor, moreover, is the inability to store the power
generated during sunny periods for use throughout darkness and times of cloud cover. There is no
current technology to store this amount of electricity on a practical basis. To put the significance of
the storage problem in context, it would take approximately nine billion car batteries (those used in
automobiles for starting the engine) costing about $950 billion to store the solar power. The nine
billion batteries represent over 34 times the number of batteries in the roughly 260 million
registered vehicles in the U.S.
Converting to renewables will not be an easy task and will take a great deal of commitment on behalf of
individuals, governments and industry. We believe the transition to a sustainable-energy world will not be
seamless and will require the ongoing use of hydrocarbons well into the next century.
Mankind needs to develop an economic way to store electricity on a utility-scale basis. Until that is done,
electricity generating renewables such as wind and solar will be a type of “Unobtainium” in economic and
practical terms (see definition on page 80).
High Oil Prices are Here to Stay
Due to the practical and economic realities, we believe high oil prices are here to stay, which will
continue to make Canada‟s conventional oil and oil sands companies attractive investments.
There is a realization that
the global society needs to
move to renewable sources
of energy. This is not in
dispute.
To replace global oil
production with ethanol, it
would take a corn field the
combined size of the United
States, China and India.
The transition to a
sustainable-energy world
will not be seamless and will
require the ongoing use of
hydrocarbons.
Exec Summ Cont’d…
The Energy Reality
The Energy Reality APRIL 2011 pg 5
Natural Gas Will Play a Central Role
Natural gas is the lowest cost source of energy and it is also the most environmentally-friendly
when compared with other hydrocarbons.
In the move towards increasing use of renewables, natural gas will play a much bigger role than just
a “bridge fuel”; we believe it will become the largest source of energy on the planet.
We expect companies levered to natural gas, especially those with long-term unconventional
resources, will see significant share price appreciation as natural gas demand increases.
Oilfield service companies, which are central to the development of unconventional gas, will be
clear winners in this global trend towards more natural gas use.
Infrastructure companies are also central players in this paradigm shift towards greater natural gas
use. In addition to pipeline companies, these will include companies that can provide technologies
to allow additional uses of natural gas, technologies such as gas to liquids (GTL), liquefied natural
gas (LNG), compressed natural gas (CNG) and electrical generation fired by natural gas.
Note the increase in natural gas use in our forecasts in Figure 2, this is an increase of almost 80%
over current levels.
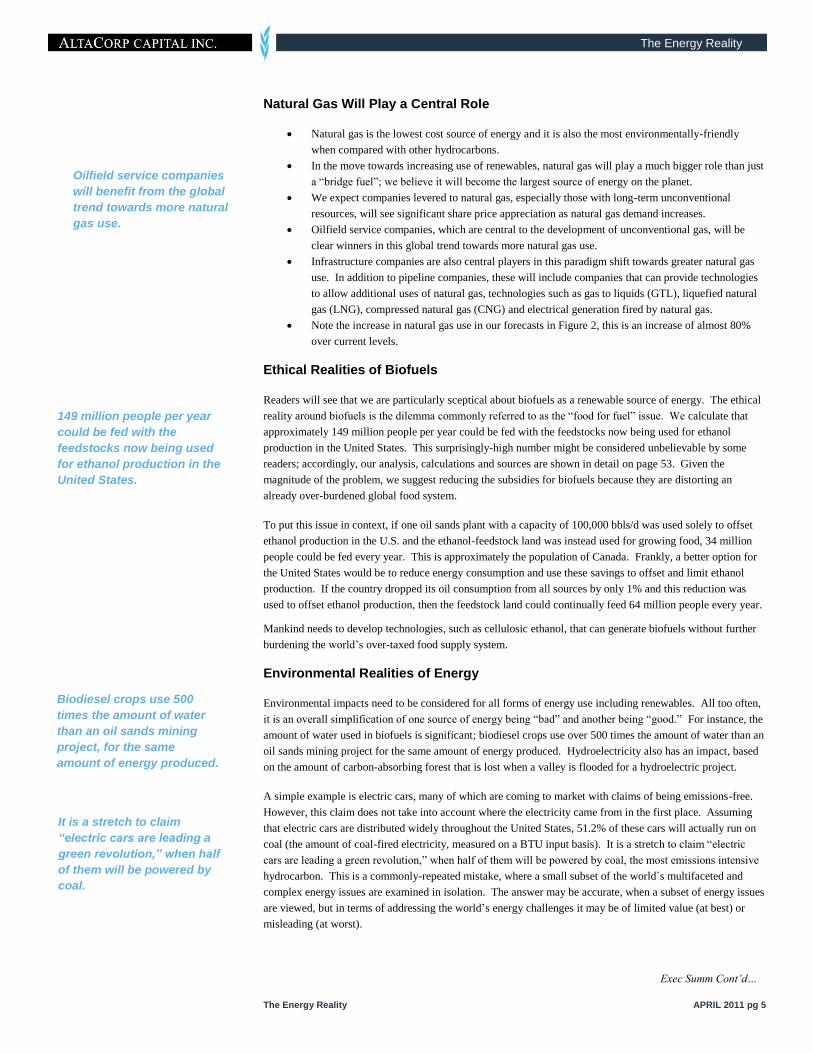
Ethical Realities of Biofuels
Readers will see that we are particularly sceptical about biofuels as a renewable source of energy. The ethical
reality around biofuels is the dilemma commonly referred to as the “food for fuel” issue. We calculate that
approximately 149 million people per year could be fed with the feedstocks now being used for ethanol
production in the United States. This surprisingly-high number might be considered unbelievable by some
readers; accordingly, our analysis, calculations and sources are shown in detail on page 53. Given the
magnitude of the problem, we suggest reducing the subsidies for biofuels because they are distorting an
already over-burdened global food system.
To put this issue in context, if one oil sands plant with a capacity of 100,000 bbls/d was used solely to offset
ethanol production in the U.S. and the ethanol-feedstock land was instead used for growing food, 34 million
people could be fed every year. This is approximately the population of Canada. Frankly, a better option for
the United States would be to reduce energy consumption and use these savings to offset and limit ethanol
production. If the country dropped its oil consumption from all sources by only 1% and this reduction was
used to offset ethanol production, then the feedstock land could continually feed 64 million people every year.
Mankind needs to develop technologies, such as cellulosic ethanol, that can generate biofuels without further
burdening the world‟s over-taxed food supply system.
Environmental Realities of Energy
Environmental impacts need to be considered for all forms of energy use including renewables. All too often,
it is an overall simplification of one source of energy being “bad” and another being “good.” For instance, the
amount of water used in biofuels is significant; biodiesel crops use over 500 times the amount of water than an
oil sands mining project for the same amount of energy produced. Hydroelectricity also has an impact, based
on the amount of carbon-absorbing forest that is lost when a valley is flooded for a hydroelectric project.
A simple example is electric cars, many of which are coming to market with claims of being emissions-free.
However, this claim does not take into account where the electricity came from in the first place. Assuming
that electric cars are distributed widely throughout the United States, 51.2% of these cars will actually run on
coal (the amount of coal-fired electricity, measured on a BTU input basis). It is a stretch to claim “electric
cars are leading a green revolution,” when half of them will be powered by coal, the most emissions intensive
hydrocarbon. This is a commonly-repeated mistake, where a small subset of the world`s multifaceted and
complex energy issues are examined in isolation. The answer may be accurate, when a subset of energy issues
are viewed, but in terms of addressing the world‟s energy challenges it may be of limited value (at best) or
misleading (at worst).
149 million people per year
could be fed with the
feedstocks now being used
for ethanol production in the
United States.
Biodiesel crops use 500
times the amount of water
than an oil sands mining
project, for the same
amount of energy produced.
It is a stretch to claim
“electric cars are leading a
green revolution,” when half
of them will be powered by
coal.
Exec Summ Cont’d…
Oilfield service companies
will benefit from the global
trend towards more natural
gas use.
The Energy Reality
The Energy Reality APRIL 2011 pg 6
Hydrocarbon-producing companies are often accused of “greenwashing” (that is, trying to make themselves
look environmentally friendly with minimal effort), however some “green” energy producers or supporters
might be accused of this as well, by failing to point out all environmental effects. In this report, we
deliberately do not apply the word “green” to renewable energy because we feel the reality is much more
complex.
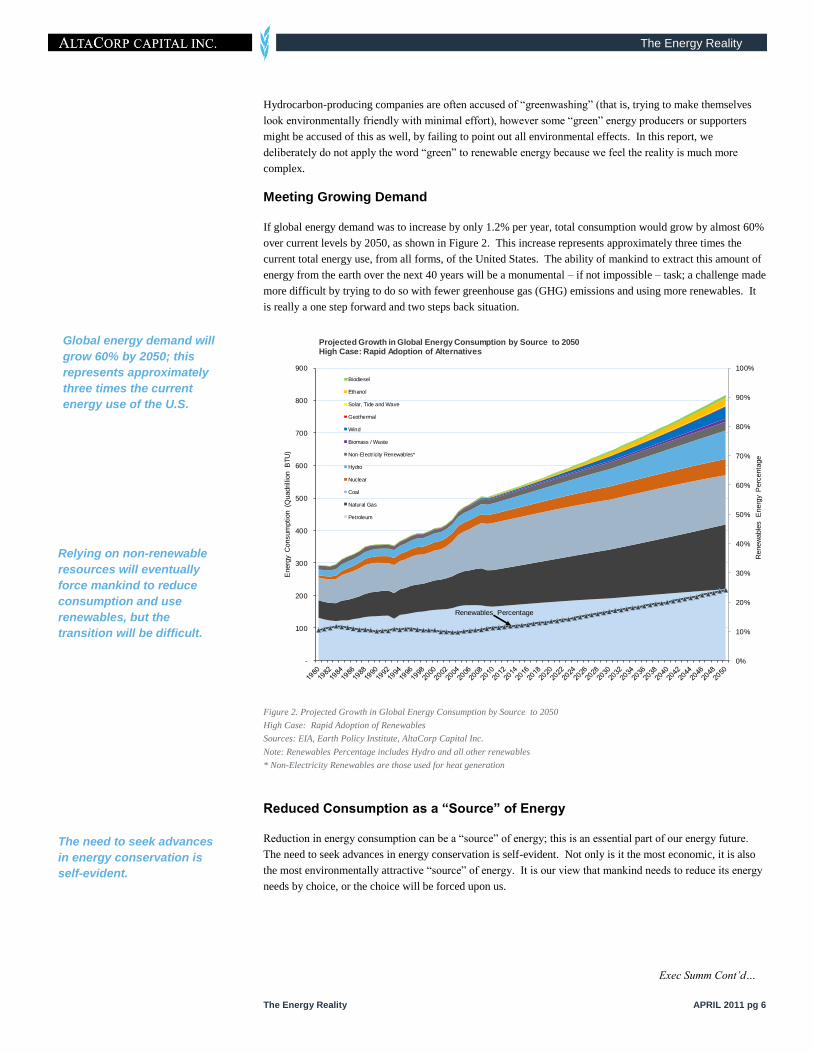
Meeting Growing Demand
If global energy demand was to increase by only 1.2% per year, total consumption would grow by almost 60%
over current levels by 2050, as shown in Figure 2. This increase represents approximately three times the
current total energy use, from all forms, of the United States. The ability of mankind to extract this amount of
energy from the earth over the next 40 years will be a monumental – if not impossible – task; a challenge made
more difficult by trying to do so with fewer greenhouse gas (GHG) emissions and using more renewables. It
is really a one step forward and two steps back situation.
Figure 2. Projected Growth in Global Energy Consumption by Source to 2050
High Case: Rapid Adoption of Renewables
Sources: EIA, Earth Policy Institute, AltaCorp Capital Inc.
Note: Renewables Percentage includes Hydro and all other renewables
* Non-Electricity Renewables are those used for heat generation
Reduced Consumption as a “Source” of Energy
Reduction in energy consumption can be a “source” of energy; this is an essential part of our energy future.
The need to seek advances in energy conservation is self-evident. Not only is it the most economic, it is also
the most environmentally attractive “source” of energy. It is our view that mankind needs to reduce its energy
needs by choice, or the choice will be forced upon us.
0%
10%
20%
30%
40%
50%
60%
70%
80%
90%
100%
-
100
200
300
400
500
600
700
800
900
Renew
able
s E
nerg
y P
erc
enta
ge
Energ
y C
onsum
ption (
Quadrilli
on B
TU
)
Projected Growth in Global Energy Consumption by Source to 2050 High Case: Rapid Adoption of Alternatives
Biodiesel
Ethanol
Solar, Tide and Wave
Geothermal
Wind
Biomass / Waste
Non-Electricity Renewables*
Hydro
Nuclear
Coal
Natural Gas
Petroleum
Renewables Percentage
Global energy demand will
grow 60% by 2050; this
represents approximately
three times the current
energy use of the U.S.
Relying on non-renewable
resources will eventually
force mankind to reduce
consumption and use
renewables, but the
transition will be difficult.
Exec Summ Cont’d…
The need to seek advances
in energy conservation is
self-evident.

The Energy Reality
The Energy Reality APRIL 2011 pg 7
Tragedy of the Hydrocarbons
Mankind has a preference for hydrocarbons, because of their convenience and low cost, but there is a tragedy
developing related to our ongoing use of these non-renewable resources. We call this The Tragedy of the
Hydrocarbons, which is related to Garrett Hardin‟s The Tragedy of the Commons. In the Tragedy of the
Hydrocarbons, individuals will choose to consume hydrocarbons because they are the most economic form of
energy available and the most convenient. Because of their non-renewable nature, our ongoing use of
hydrocarbons is slowly “emptying the tank.” Even the huge natural gas resources now being exploited with
new drilling and completion techniques will eventually run out (albeit many years from now).
The tragedy lies in the reality that people will continue to use and deplete the non-renewable hydrocarbons,
even though it is not in the best long-term interest of the individual, society, mankind or the planet for this to
continue. Relying on a non-renewable resource will eventually force us to reduce consumption and use
renewable forms of energy, but the transition will (in the Tragedy of the Hydrocarbons context) be difficult
and painful. Mankind could have a relatively seamless transition to renewables but, because hydrocarbons
continue to be the most economic and practical forms of energy, individuals will use these until forced to make
a transition. A transition forced upon us will not be simple or problem-free. We discuss this tragedy in more
detail on page 39.
Our ongoing use of
hydrocarbons is slowly
“emptying the tank.”
Individuals will use
hydrocarbons until forced to
make a transition.
The Energy Reality
The Energy Reality APRIL 2011 pg 8
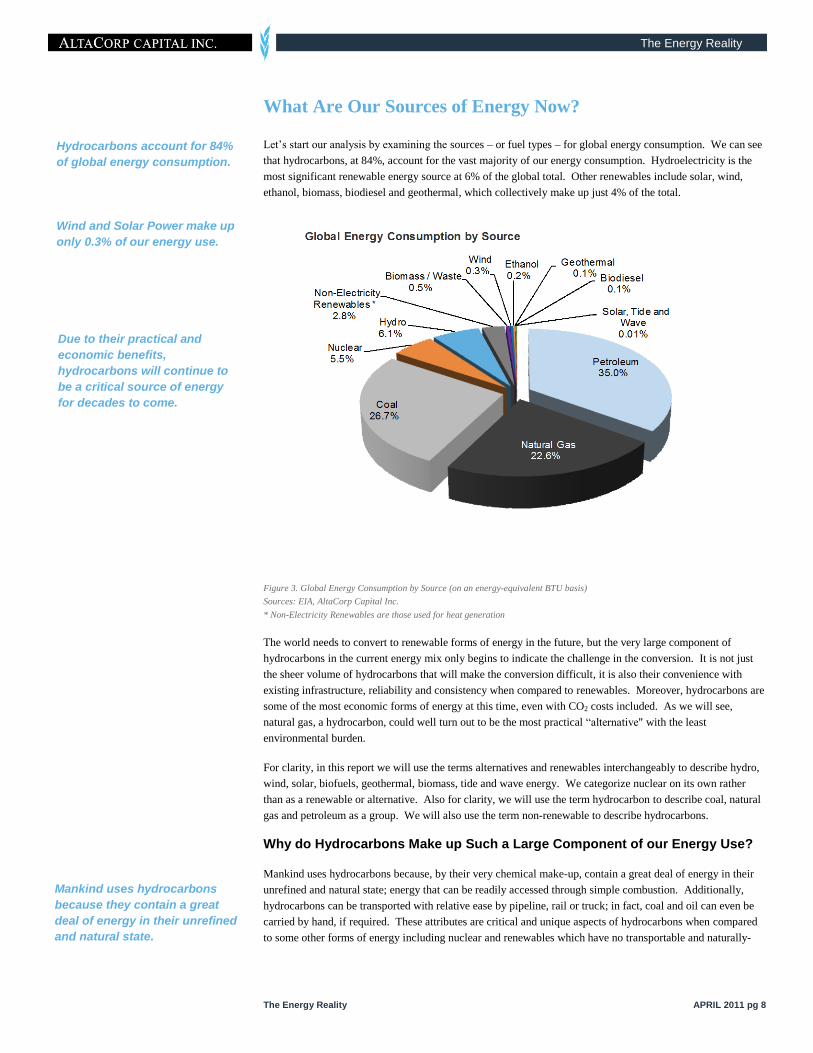
What Are Our Sources of Energy Now?
Let‟s start our analysis by examining the sources – or fuel types – for global energy consumption. We can see
that hydrocarbons, at 84%, account for the vast majority of our energy consumption. Hydroelectricity is the
most significant renewable energy source at 6% of the global total. Other renewables include solar, wind,
ethanol, biomass, biodiesel and geothermal, which collectively make up just 4% of the total.
Figure 3. Global Energy Consumption by Source (on an energy-equivalent BTU basis)
Sources: EIA, AltaCorp Capital Inc.
* Non-Electricity Renewables are those used for heat generation
The world needs to convert to renewable forms of energy in the future, but the very large component of
hydrocarbons in the current energy mix only begins to indicate the challenge in the conversion. It is not just
the sheer volume of hydrocarbons that will make the conversion difficult, it is also their convenience with
existing infrastructure, reliability and consistency when compared to renewables. Moreover, hydrocarbons are
some of the most economic forms of energy at this time, even with CO2 costs included. As we will see,
natural gas, a hydrocarbon, could well turn out to be the most practical “alternative" with the least
environmental burden.
For clarity, in this report we will use the terms alternatives and renewables interchangeably to describe hydro,
wind, solar, biofuels, geothermal, biomass, tide and wave energy. We categorize nuclear on its own rather
than as a renewable or alternative. Also for clarity, we will use the term hydrocarbon to describe coal, natural
gas and petroleum as a group. We will also use the term non-renewable to describe hydrocarbons.
Why do Hydrocarbons Make up Such a Large Component of our Energy Use?
Mankind uses hydrocarbons because, by their very chemical make-up, contain a great deal of energy in their
unrefined and natural state; energy that can be readily accessed through simple combustion. Additionally,
hydrocarbons can be transported with relative ease by pipeline, rail or truck; in fact, coal and oil can even be
carried by hand, if required. These attributes are critical and unique aspects of hydrocarbons when compared
to some other forms of energy including nuclear and renewables which have no transportable and naturally-
Due to their practical and
economic benefits,
hydrocarbons will continue to
be a critical source of energy
for decades to come.
Hydrocarbons account for 84%
of global energy consumption.
Wind and Solar Power make up
only 0.3% of our energy use.
Mankind uses hydrocarbons
because they contain a great
deal of energy in their unrefined
and natural state.

The Energy Reality
The Energy Reality APRIL 2011 pg 9
occurring energy in them. The challenge we now face with hydrocarbons is that they are becoming
increasingly difficult and expensive to extract, as compared to several decades ago when conventional oil was
easy to find.
It is important to note that all forms of energy including nuclear power plants, hydroelectric projects and all
alternative forms of energy require inputs from hydrocarbons in the form of heavy equipment, machinery,
electrical power (used in manufacturing components) and materials from petrochemicals. Hydrocarbons
themselves are no different; they also require inputs from hydrocarbons to be converted into a useful form.
The oil sands of Canada are a good example where natural gas, diesel and coal or natural gas-derived
electricity are used to extract the resource. Biofuels such as ethanol and biodiesel also require inputs from
hydrocarbons, in the form of fuel, for farm machinery and fertilizer created from natural gas. Energy from the
sun through photovoltaic solar panels is free, however, building the solar panels is expensive. There are
components within the solar panels made out of glass, plastics, copper and aluminum that require various
inputs from hydrocarbons.
We believe that natural gas will grow in its importance in global energy use over the coming decades.
The Future for Natural Gas
There is an abundance of unconventional natural gas within Canada and the U.S. which will help the transition
away from the more carbon-intensive coal resources. We see natural gas demand increasing over the long
term, especially in the following applications:
Gas to Liquids (GTL) – This is the chemical process that converts natural gas to gasoline, jet fuel or
diesel. When natural gas prices are low and oil prices high, the economics of these capital intensive
projects make sense. In a long-term development plan, Talisman joined forces with Sasol Ltd. to
assess a large gas-to-liquids (GTL) facility in Western Canada. This type of facility would provide
another option to LNG for accessing offshore markets.
Liquefied Natural Gas (LNG) – LNG is a way that inexpensive and export-limited natural gas
could be shipped overseas. This could be a large area of growth for North American natural gas. In
mid-March, Encana announced that it was acquiring 30% interest in the proposed Kitimat facility, a
natural gas liquefaction and export facility in British Columbia. The Kitimat facility will enable
producers to export natural gas to overseas markets, with an associated pipeline. This facility and
pipeline have a proposed capacity of 700 mmcf/d of natural gas to come to the market.
Power Generation – Natural gas electrical generation has far lower GHG and other emissions than
coal-fired power generation. There are new power generation facilities in both Ontario and Alberta.
The Ontario Power Authority is currently operating 6,967 MW of natural gas-fired energy contracts,
and the closing of coal-powered plants will create a greater demand on natural gas-fired
replacements. With the current concerns around nuclear energy, we see an ongoing increase in
natural gas for power generation.
Transportation – Compressed Natural Gas (CNG) can be used as a transportation fuel and is
currently being used in vehicles such as buses, trains, pick-up trucks and taxi cabs. It is more
common in Asia, South American, Middle East, and Europe as well increasingly for industry uses
North American. There are some diesel trains which have been successfully converted to CNG in
North America and Peru. The advantages to CNG include less CO2 emissions than gasoline, diesel
or propane. The limitation in broader application is the extended time required in refuelling and the
need for heavy duty and expensive fuel tanks.
Hydrocarbons will continue to be a critical source of energy for many decades to come. The reasons for this
are their inherent and readily-usable energy, existing infrastructure, attractive economics and increasing
demand for inexpensive fuels in developing economies. We will show what role hydrocarbons have played in
the past and how we believe they will be used in the future – along with alternatives – but first, let‟s review
what those alternatives are.
All forms of energy, including
alternatives, require inputs from
hydrocarbons.
There are many new or
expanding applications for
natural gas.
Hydrocarbons will continue to
be a critical source of energy
for many decades to come.
The Energy Reality
The Energy Reality APRIL 2011 pg 10
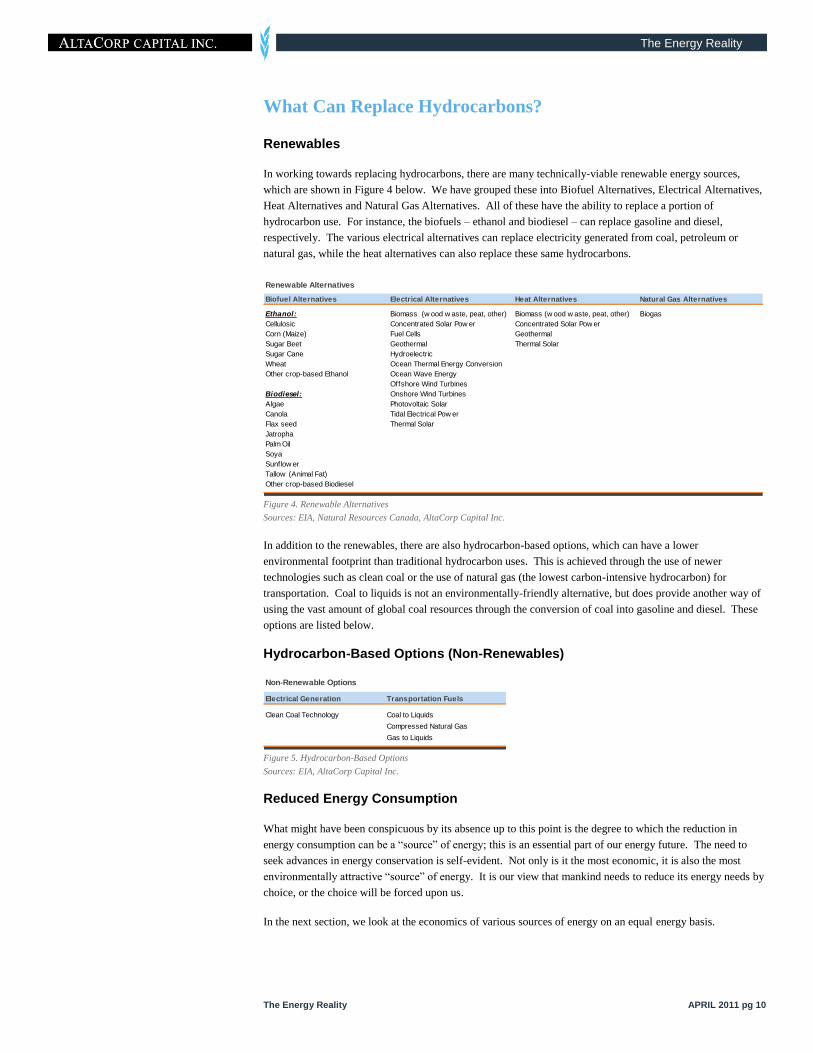
What Can Replace Hydrocarbons?
Renewables
In working towards replacing hydrocarbons, there are many technically-viable renewable energy sources,
which are shown in Figure 4 below. We have grouped these into Biofuel Alternatives, Electrical Alternatives,
Heat Alternatives and Natural Gas Alternatives. All of these have the ability to replace a portion of
hydrocarbon use. For instance, the biofuels – ethanol and biodiesel – can replace gasoline and diesel,
respectively. The various electrical alternatives can replace electricity generated from coal, petroleum or
natural gas, while the heat alternatives can also replace these same hydrocarbons.
Figure 4. Renewable Alternatives
Sources: EIA, Natural Resources Canada, AltaCorp Capital Inc.
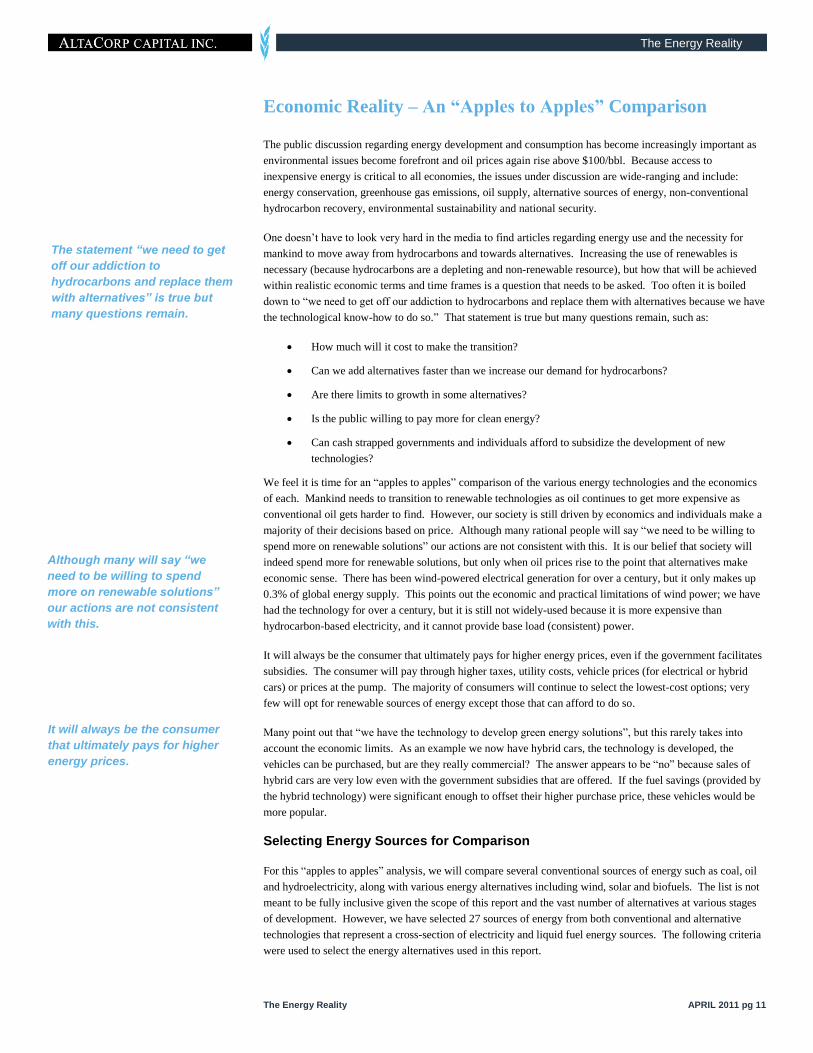
In addition to the renewables, there are also hydrocarbon-based options, which can have a lower
environmental footprint than traditional hydrocarbon uses. This is achieved through the use of newer
technologies such as clean coal or the use of natural gas (the lowest carbon-intensive hydrocarbon) for
transportation. Coal to liquids is not an environmentally-friendly alternative, but does provide another way of
using the vast amount of global coal resources through the conversion of coal into gasoline and diesel. These
options are listed below.
Hydrocarbon-Based Options (Non-Renewables)
Figure 5. Hydrocarbon-Based Options
Sources: EIA, AltaCorp Capital Inc.
Reduced Energy Consumption
What might have been conspicuous by its absence up to this point is the degree to which the reduction in
energy consumption can be a “source” of energy; this is an essential part of our energy future. The need to
seek advances in energy conservation is self-evident. Not only is it the most economic, it is also the most
environmentally attractive “source” of energy. It is our view that mankind needs to reduce its energy needs by
choice, or the choice will be forced upon us.
In the next section, we look at the economics of various sources of energy on an equal energy basis.
Renewable Alternatives
Biofuel Alternatives Electrical Alternatives Heat Alternatives Natural Gas Alternatives
Ethanol: Biomass (w ood w aste, peat, other) Biomass (w ood w aste, peat, other) Biogas
Cellulosic Concentrated Solar Pow er Concentrated Solar Pow er
Corn (Maize) Fuel Cells Geothermal
Sugar Beet Geothermal Thermal Solar
Sugar Cane Hydroelectric
Wheat Ocean Thermal Energy Conversion
Other crop-based Ethanol Ocean Wave Energy
Offshore Wind Turbines
Biodiesel: Onshore Wind Turbines
Algae Photovoltaic Solar
Canola Tidal Electrical Pow er
Flax seed Thermal Solar
Jatropha
Palm Oil
Soya
Sunflow er
Tallow (Animal Fat)
Other crop-based Biodiesel
Non-Renewable Options
Electrical Generation Transportation Fuels
Clean Coal Technology Coal to Liquids
Compressed Natural Gas
Gas to Liquids
The Energy Reality
The Energy Reality APRIL 2011 pg 11
Economic Reality – An “Apples to Apples” Comparison
The public discussion regarding energy development and consumption has become increasingly important as
environmental issues become forefront and oil prices again rise above $100/bbl. Because access to
inexpensive energy is critical to all economies, the issues under discussion are wide-ranging and include:
energy conservation, greenhouse gas emissions, oil supply, alternative sources of energy, non-conventional
hydrocarbon recovery, environmental sustainability and national security.
One doesn‟t have to look very hard in the media to find articles regarding energy use and the necessity for
mankind to move away from hydrocarbons and towards alternatives. Increasing the use of renewables is
necessary (because hydrocarbons are a depleting and non-renewable resource), but how that will be achieved
within realistic economic terms and time frames is a question that needs to be asked. Too often it is boiled
down to “we need to get off our addiction to hydrocarbons and replace them with alternatives because we have
the technological know-how to do so.” That statement is true but many questions remain, such as:
How much will it cost to make the transition?
Can we add alternatives faster than we increase our demand for hydrocarbons?
Are there limits to growth in some alternatives?
Is the public willing to pay more for clean energy?
Can cash strapped governments and individuals afford to subsidize the development of new
technologies?
We feel it is time for an “apples to apples” comparison of the various energy technologies and the economics
of each. Mankind needs to transition to renewable technologies as oil continues to get more expensive as
conventional oil gets harder to find. However, our society is still driven by economics and individuals make a
majority of their decisions based on price. Although many rational people will say “we need to be willing to
spend more on renewable solutions” our actions are not consistent with this. It is our belief that society will
indeed spend more for renewable solutions, but only when oil prices rise to the point that alternatives make
economic sense. There has been wind-powered electrical generation for over a century, but it only makes up
0.3% of global energy supply. This points out the economic and practical limitations of wind power; we have
had the technology for over a century, but it is still not widely-used because it is more expensive than
hydrocarbon-based electricity, and it cannot provide base load (consistent) power.
It will always be the consumer that ultimately pays for higher energy prices, even if the government facilitates
subsidies. The consumer will pay through higher taxes, utility costs, vehicle prices (for electrical or hybrid
cars) or prices at the pump. The majority of consumers will continue to select the lowest-cost options; very
few will opt for renewable sources of energy except those that can afford to do so.
Many point out that “we have the technology to develop green energy solutions”, but this rarely takes into
account the economic limits. As an example we now have hybrid cars, the technology is developed, the
vehicles can be purchased, but are they really commercial? The answer appears to be “no” because sales of
hybrid cars are very low even with the government subsidies that are offered. If the fuel savings (provided by
the hybrid technology) were significant enough to offset their higher purchase price, these vehicles would be
more popular.
Selecting Energy Sources for Comparison
For this “apples to apples” analysis, we will compare several conventional sources of energy such as coal, oil
and hydroelectricity, along with various energy alternatives including wind, solar and biofuels. The list is not
meant to be fully inclusive given the scope of this report and the vast number of alternatives at various stages
of development. However, we have selected 27 sources of energy from both conventional and alternative
technologies that represent a cross-section of electricity and liquid fuel energy sources. The following criteria
were used to select the energy alternatives used in this report.
It will always be the consumer
that ultimately pays for higher
energy prices.
The statement “we need to get
off our addiction to
hydrocarbons and replace them
with alternatives” is true but
many questions remain.
Although many will say “we
need to be willing to spend
more on renewable solutions”
our actions are not consistent
with this.
The Energy Reality
The Energy Reality APRIL 2011 pg 12
1. Commercialized technology exists to leverage the underlying resource. For example, we have not
included algae-based biofuels as we feel the technology has not been demonstrated at a sufficient
scale to determine its long-term economic viability.
2. The alternative must be a source of energy itself, not just a mode of converting energy from one
form to another. For instance, fuel cells are not evaluated here because they are not actually a
source of energy; they convert energy from one format to another.
3. Capital and operating expense information is available from public sources with sufficient detail to
model the cost behaviour under a number of different assumptions/scenarios.
The BTU – A Common Measure for all Energy
In order to compare a diverse set of energy projects on a level playing field, we have taken the straightforward
step of converting the output energy of the underlying resource – be it electricity, oil, natural gas, ethanol,
biodiesel or other – into British Thermal Units (BTUs) as a common unit of measure. In this report, the
following conversion factors were used:
Electricity – 1 MWh = 3,412,000 BTU
Light / Medium Oil – 1 Barrel = 5,800,000 BTU
Natural Gas – 1 mcf = 1,027,000 BTU
Ethanol – 1 Barrel = 3,563,00 BTU
Biodiesel – 1 Barrel = 5,359,000 BTU
As part of evaluating projects on an equal measure, we also consider the project life span (how long it will
produce energy) and its capacity factor (what % of the time it produces and at what average rate). This gives
the total energy output (measured in BTUs) over the project‟s life. It is important to note that in our analysis
we identified that some projects have much longer lives than others. Hydroelectricity projects have very long
lives, but solar panels and wind turbines require replacement and we have assumed 30-year lives for these
projects.
Capacity factor can dramatically reduce what the nameplate output is, for instance an average solar panel will
only produce 22% of its full capacity given the limited number of hours of sunshine daily and annually. We
assume an onshore wind project has a capacity factor of 34% and an offshore project has a capacity factor of
39%. Our analysis assumes energy output using current technology. Over time there will most likely be an
increase in output from the various technologies, but we have not attempted to make predictions in this regard.
Capital Costs and Operating Costs
For estimated capital costs for the various projects we have used several sources including: the U.S. Energy
Information Administration (EIA), U.S. Department of Agriculture (USDA), company reports and other
energy research publications. To address the cost of capital required by investors in any allocation of funds,
we assume that the total capital costs include both principal and interest paid over the life of the project at a
10% interest rate, the “corporate cost of capital”. We address cost of capital in more detail in the next section
where we evaluate a „social cost of capital‟ and a zero cost of capital, which may be more appropriate for some
projects and taking into account longer-term environmental issues. In addition to capital, we then add annual
operating and maintenance costs. The sum of these costs in combination with the total output energy (in
BTUs) allows us to examine energy investment on an equal economic and energy basis.
In all cases we look at the costs involved in preparing the source of energy ready for the end-use consumer.
For instance, the non-conventional natural gas costs include drilling, production and transportation costs to
allow the gas to get to the burner tip. The natural gas electrical generation is quite a bit more expensive than
natural gas used for heating/cooking purposes because it includes all the natural gas costs plus the capital,
maintenance costs, operating costs and operating efficiency related to an electrical generation plant. Similarly,
In this report, we use British
Thermal Units (BTUs) as a
common unit of measure.
An average solar panel will
produce only 22% of its
capacity given the limited
amount of daily sunshine.
For capital costs, we have used
several sources including the
EIA, USDA and company
reports.

The Energy Reality
The Energy Reality APRIL 2011 pg 13
all the liquid projects including conventional oil, oil sands, ethanol and biodiesel include any production,
upgrading and refining costs required to get the product ready to be used in a transportation application.
Here is an example of our methodology for ethanol and wind:
Ethanol – For feedstock like sugarcane, fermentation/distillation technologies are required to
convert the sugars to ethanol. Given that these plants use the simplest and least number of
technologies, the capital costs tend to be the lowest. For grains like corn and wheat, additional
processing steps (and thus additional capital and operating costs) are required to convert the raw
grains to sugar. However, unlike sugar-based feedstock, the increased processing also creates
usable by-products, in the form of distiller‟s dried grains and solubles, which are sold as animal feed
to improve the overall economics of the process. For cellulosic feedstock like wheat straw, more
complex biochemical or thermochemical processing steps are used in order to breakdown the fibres
into sugar. These increased processing requirements are reflected in the higher capital requirements
for cellulosic projects.
Wind – In wind-powered projects, the turbine is a key technology used to harness the power of wind
and convert it into electricity. Equally as important are the forecasting techniques and models used
to predict the short-term and longer-term wind resource at a project site. These forecasts are
important to determining project economics because although the capital costs are relatively well
known, the production, in terms of kWh actually produced, is not. One of the key benefits of wind
turbines is the minimal variable costs of operation, however, the upfront costs of implementing a
wind power project can be significant.
Of course economics alone aren‟t going to answer all questions, nor should they; there are many other factors
to consider. For instance, can one form of hydrocarbon energy be simply replaced by an alternative, or are
there logistical or practical limitations? What about the long-term environmental effects?
Economics alone aren’t going
to answer all questions, nor
should they.
The Energy Reality
The Energy Reality APRIL 2011 pg 14
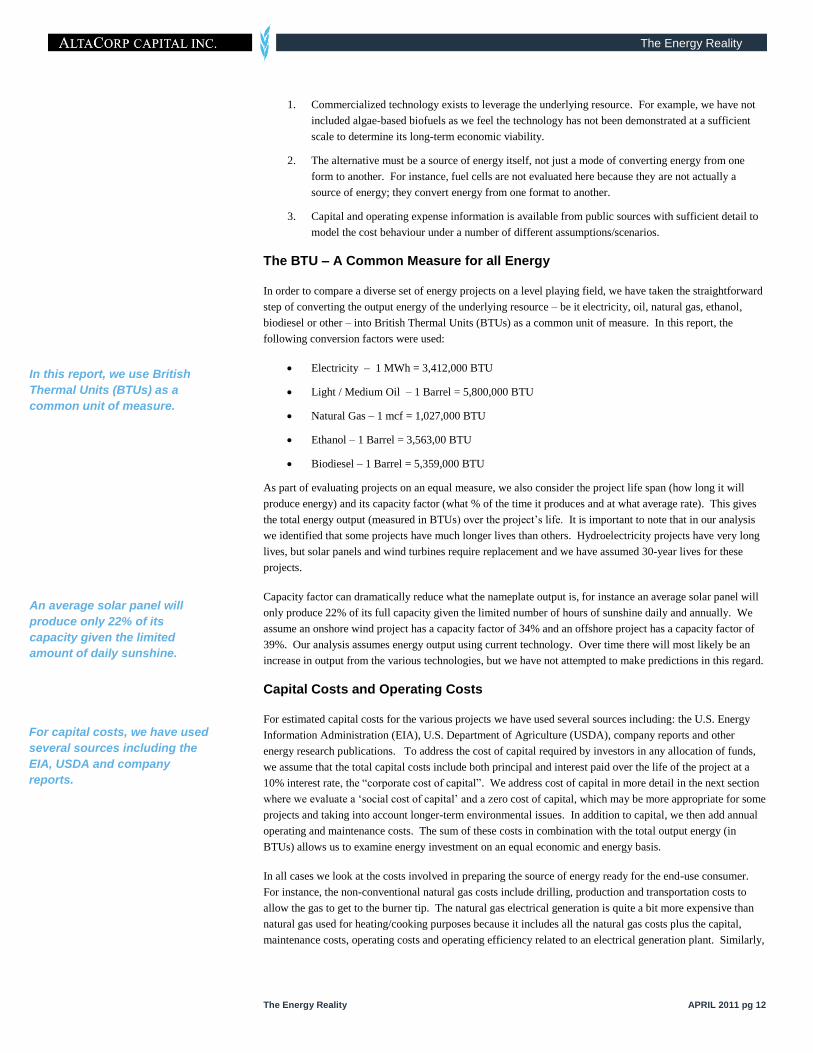
The results of our cost per BTU analysis are shown in Figure 6, for our 27 conventional and renewable energy
projects. We have created four groups, the first group (seven on the left) being various oil and natural gas
production projects, followed by seven liquid fuel alternatives including ethanol and biodiesel projects. The
third group consists of six traditional electrical generation projects including coal, natural gas and nuclear
while the last group includes seven electrical renewables including hydro, wind, solar and geothermal
(including the biomass, geothermal and solar thermal technologies) which can also be a source of heat, but we
have only considered the electrical projects here.
Figure 6. Cost of Energy Comparison ($/mmBTU) (using a Corporate Cost of Capital of 10%)
Source: Please refer to the Sources section of this report.
Note: CC – Combined Cycle; CCS – Carbon Capture and Sequestration; IGCC – Integrated Gasification Combined Cycle
For the ethanol and biodiesel projects, the operating costs are net of the revenue received for the meal by-
products. For instance, the costs of $27.00/mmBTU for soya-based biodiesel calculated in the model includes
the benefit of the sale of the soymeal, which in the model we have calculated as a benefit of $34.00/mmBTU.
If this was not included, the resultant total costs would be misleading at $61.00/mmBTU.
In addition to capital and operating costs, a central issue at this time are the environmental costs – specifically
CO2 emissions – of various sources of energy. We discuss, and add-in, these costs next.
$-
$10
$20
$30
$40
$50
$60
$70
$80
$ p
er m
illio
n B
TU
Total Cost of Energy (BTU) - Conventional and Alternative
Net Operating Costs (including Fuel and Feedstock)
Capital Costs
The Energy Reality
The Energy Reality APRIL 2011 pg 15
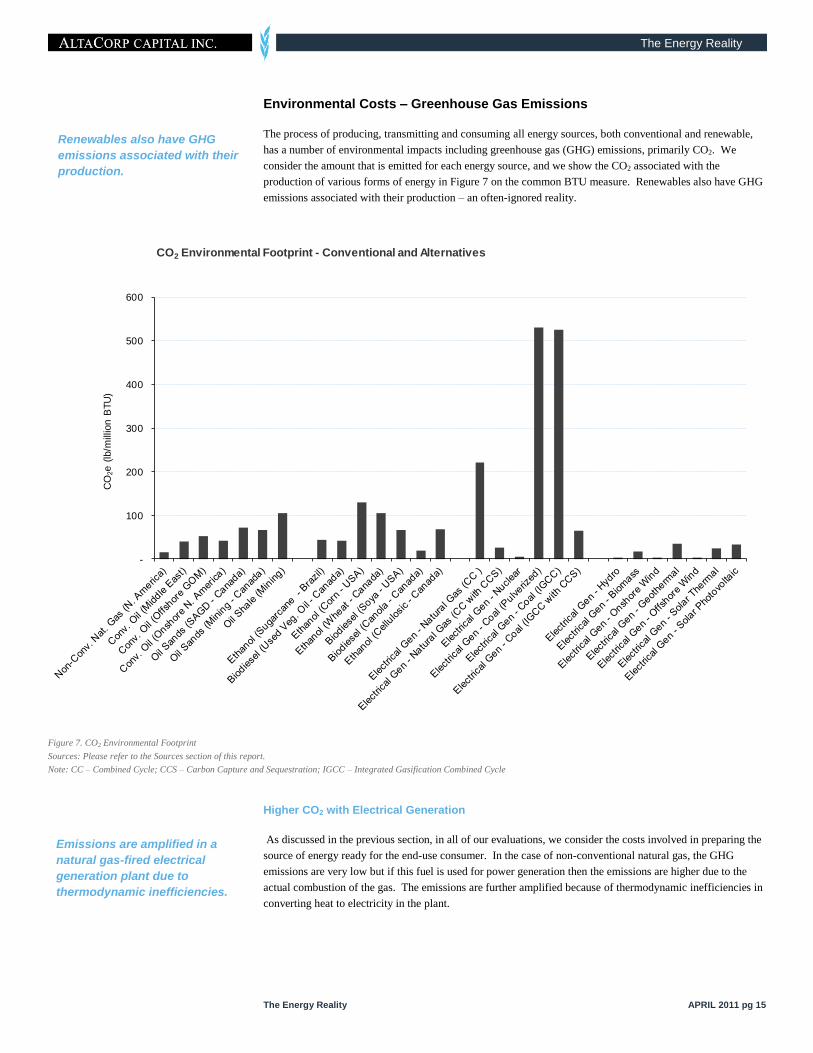
Environmental Costs – Greenhouse Gas Emissions
The process of producing, transmitting and consuming all energy sources, both conventional and renewable,
has a number of environmental impacts including greenhouse gas (GHG) emissions, primarily CO2. We
consider the amount that is emitted for each energy source, and we show the CO2 associated with the
production of various forms of energy in Figure 7 on the common BTU measure. Renewables also have GHG
emissions associated with their production – an often-ignored reality.
Figure 7. CO2 Environmental Footprint
Sources: Please refer to the Sources section of this report.
Note: CC – Combined Cycle; CCS – Carbon Capture and Sequestration; IGCC – Integrated Gasification Combined Cycle
Higher CO2 with Electrical Generation
As discussed in the previous section, in all of our evaluations, we consider the costs involved in preparing the
source of energy ready for the end-use consumer. In the case of non-conventional natural gas, the GHG
emissions are very low but if this fuel is used for power generation then the emissions are higher due to the
actual combustion of the gas. The emissions are further amplified because of thermodynamic inefficiencies in
converting heat to electricity in the plant.
Renewables also have GHG
emissions associated with their
production.
Emissions are amplified in a
natural gas-fired electrical
generation plant due to
thermodynamic inefficiencies.
-
100
200
300
400
500
600
CO
2e (
lb/m
illio
n B
TU
)
CO2 Environmental Footprint - Conventional and Alternatives

The Energy Reality
The Energy Reality APRIL 2011 pg 16
Sources of CO2 from Various Energy Projects:
Oil – The process of extracting conventional oil has quite low CO2 emissions, but the conversion
into refined products and the ultimate combustion by the end-user is where most of the emissions
occur. Unconventional oil such as the oil sands have greater CO2 emissions during the extraction
process due to the more energy-intensive nature of the resource.
Natural Gas – Natural gas electrical generation plants tend to produce about half the CO2 emissions
compared to coal plants. This makes them an attractive option in the transition towards more
environmentally friendly electricity.
Biodiesel and Ethanol – Most of the GHG emissions for biofuels are created during three
processes: 1) growing/harvesting the feedstock including the production of fertilizers which is a
highly energy-intensive process; 2) producing the biofuel; and 3) transporting the biofuels to
market. Most of the CO2 released during combustion processes was originally sequestered from the
atmosphere during the growth of the feedstock. We discuss this offset in the next section.
Coal – Conventional coal-fired electrical plants are large emitters of CO2 (averaging around 530
lbs/mmBTU in our model). However, continued advancements in technology such as super-critical
steam plants will mean more power produced per tonne of coal burned, improving energy efficiency
and reducing emissions on a per BTU basis. Other technologies in different stages of research and
development, including Carbon Capture and Sequestration (CCS) and hydrogen separation, could
become standard in coal-fired plants of the future.
Nuclear – This is one of the cleaner forms of energy from this perspective because a nuclear
reaction has no CO2 emissions. The CO2 related to this type of power comes during the mining of
the uranium ore and the construction of the plant.
Hydro – The process of harnessing the potential energy of water to drive turbines does not create
CO2 emissions. However, the destruction of carbon-absorbing forests, which are carbon sinks, due
to the required flooding behind the dam, does have an impact on climate change. There is also CO2
emitted during construction process.
Geothermal – Although geothermal power plants burn no hydrocarbons, the geothermal fluids
contain dissolved gases such as CO2 and H2S, in some cases in excess of those produced by
conventional power plants. The specific amounts, however, will vary with the resource.
Solar Photovoltaic – Solar PV cells create no CO2 emissions during their operation, but CO2 is
emitted during their construction, installation and eventual disposal.
Solar Thermal – Similar to Solar PV, the majority of CO2 emissions for solar thermal plants occur
during their construction and dismantling. The levels of CO2 also vary depending on the specific
type of solar thermal technology implemented.
Biomass – The majority of GHG for biomass plants is created during the operation of the plant and
some emissions associated with the construction and dismantling of the plants. However, the
combustion process of biomass releases a lot of CO2 that was originally sequestered from the
atmosphere during the growth of the biomass feedstock. It is important to note that burning
biomass can introduce other emission challenges, especially for particulates, CO and NOx.
Onshore and Offshore Wind – The main component of GHG emissions for wind farms is the
construction process (and to a lesser degree the dismantling process). The main contributor to the
construction emissions is the large requirements for steel.
Natural gas plants tend to
produce about half the CO2
emissions compared to coal
power plants.
With hydroelectricity, the
destruction of carbon-
absorbing forests has an impact
on climate change.
The Energy Reality
The Energy Reality APRIL 2011 pg 17
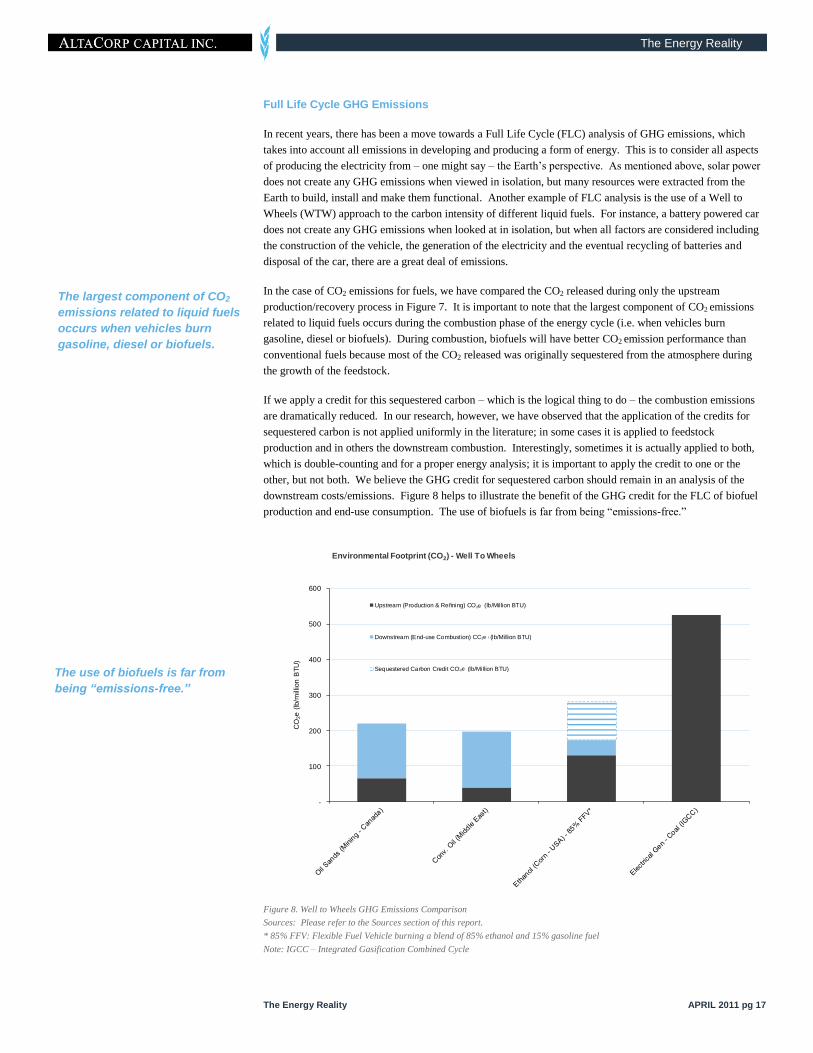
Full Life Cycle GHG Emissions
In recent years, there has been a move towards a Full Life Cycle (FLC) analysis of GHG emissions, which
takes into account all emissions in developing and producing a form of energy. This is to consider all aspects
of producing the electricity from – one might say – the Earth‟s perspective. As mentioned above, solar power
does not create any GHG emissions when viewed in isolation, but many resources were extracted from the
Earth to build, install and make them functional. Another example of FLC analysis is the use of a Well to
Wheels (WTW) approach to the carbon intensity of different liquid fuels. For instance, a battery powered car
does not create any GHG emissions when looked at in isolation, but when all factors are considered including
the construction of the vehicle, the generation of the electricity and the eventual recycling of batteries and
disposal of the car, there are a great deal of emissions.
In the case of CO2 emissions for fuels, we have compared the CO2 released during only the upstream
production/recovery process in Figure 7. It is important to note that the largest component of CO2 emissions
related to liquid fuels occurs during the combustion phase of the energy cycle (i.e. when vehicles burn
gasoline, diesel or biofuels). During combustion, biofuels will have better CO2 emission performance than
conventional fuels because most of the CO2 released was originally sequestered from the atmosphere during
the growth of the feedstock.
If we apply a credit for this sequestered carbon – which is the logical thing to do – the combustion emissions
are dramatically reduced. In our research, however, we have observed that the application of the credits for
sequestered carbon is not applied uniformly in the literature; in some cases it is applied to feedstock
production and in others the downstream combustion. Interestingly, sometimes it is actually applied to both,
which is double-counting and for a proper energy analysis; it is important to apply the credit to one or the
other, but not both. We believe the GHG credit for sequestered carbon should remain in an analysis of the
downstream costs/emissions. Figure 8 helps to illustrate the benefit of the GHG credit for the FLC of biofuel
production and end-use consumption. The use of biofuels is far from being “emissions-free.”
Figure 8. Well to Wheels GHG Emissions Comparison
Sources: Please refer to the Sources section of this report.
* 85% FFV: Flexible Fuel Vehicle burning a blend of 85% ethanol and 15% gasoline fuel
Note: IGCC – Integrated Gasification Combined Cycle
The largest component of CO2
emissions related to liquid fuels
occurs when vehicles burn
gasoline, diesel or biofuels.
The use of biofuels is far from
being “emissions-free.”
-
100
200
300
400
500
600
CO
2e (
lb/m
illio
n B
TU
)
Environmental Footprint (CO2) - Well To Wheels
Upstream (Production & Refining) CO2e (lb/Million BTU)
Downstream (End-use Combustion) CO2e (lb/Million BTU)
Sequestered Carbon Credit CO2e (lb/Million BTU)
2e
2e
2e

The Energy Reality
The Energy Reality APRIL 2011 pg 18
A $/Barrel-Equivalent Measure
For those more familiar with oil pricing than BTU values, we have compared costs on an oil equivalent basis
and added this measure to Figure 9. For clarity, in addition to calculating the cost to produce energy on a BTU
basis, we can also compute the cost to produce the amount of energy in a barrel of light oil and we use the
nomenclature “boe-energy” to describe this. Having already done the analysis on a $/BTU basis, the
conversion is elementary using the light oil energy equivalent of 1 Barrel = 5,800,000 BTU (or 5.8 mmBTU)
to get the $/boe-energy. For instance, ethanol from corn in the U.S., as calculated in our model, costs
$22.00/mmBTU and to convert that to a $/boe-energy we simply multiply by the 5.8 mmBTU in a barrel of oil
to get $129.00/boe-energy of ethanol. This is an energy equivalency (which is unrelated to volume) $129.00 is
the amount you would have to pay in capital, operating and maintenance costs to get an equivalent amount of
energy in a barrel of oil. Going forward in this report, we will show both the $/boe-energy and the $/BTU
wherever appropriate and possible.
The significance of the $/boe-energy measure cannot be overstated. This puts into context the cost of various
energy projects in the widely-understood $/bbl value, and directly indicates at what oil price these
technologies become economic on a BTU to BTU basis.
For instance, the ethanol from U.S. corn in Figure 9 becomes economic at energy prices of $129.00/boe-
energy basis. Another example is sugarcane ethanol from Brazil, which is economic at energy prices of
$72.00/boe-energy. Oil from the oil sands is more expensive to extract than conventional light oil and these
projects are economic, using this analysis, at energy prices of $76.00/boe-energy in the case of a SAGD
operation and $84.00/boe-energy in the case of a mining operation. The analysis shows that biodiesel is quite
a bit more expensive, being economic at $163.00/boe-energy for soya biodiesel in the U.S. market and
$185.00/boe-energy for canola biodiesel in the Canadian market. Onshore wind turbines, offshore wind
turbines and solar photovoltaic electricity are economic at much higher prices ($163.00/boe-energy,
$342.00/boe-energy and $429.00/boe-energy, respectively) than oil projects.
We compute the cost to
produce the amount of energy
in a barrel of light oil, and use
the term “boe-energy”.
Biodiesel is quite a bit more
expensive, becoming economic
at $163.00/boe-energy for soya
biodiesel in the U.S.
Offshore wind turbines and
photovoltaic solar electricity are
economic at $342.00/boe-energy
and $429.00/boe-energy,
respectively.
The Energy Reality
The Energy Reality APRIL 2011 pg 19
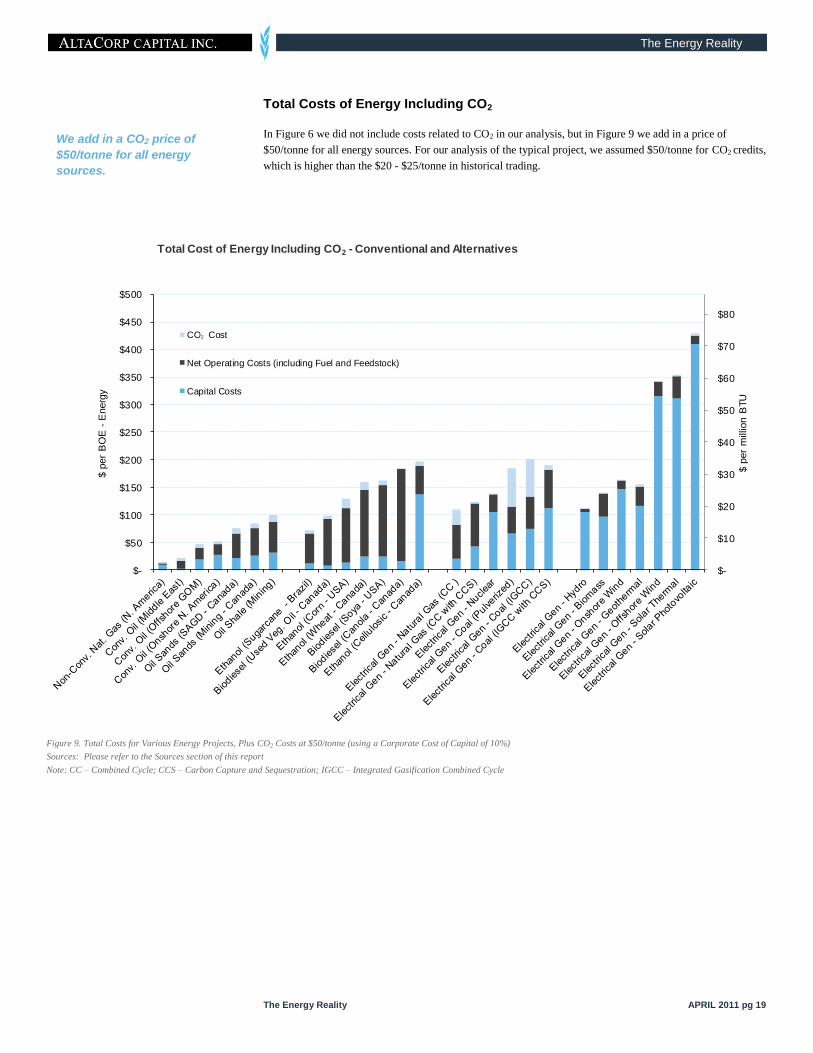
Total Costs of Energy Including CO2
In Figure 6 we did not include costs related to CO2 in our analysis, but in Figure 9 we add in a price of
$50/tonne for all energy sources. For our analysis of the typical project, we assumed $50/tonne for CO2 credits,
which is higher than the $20 - $25/tonne in historical trading.
Figure 9. Total Costs for Various Energy Projects, Plus CO2 Costs at $50/tonne (using a Corporate Cost of Capital of 10%)
Sources: Please refer to the Sources section of this report
Note: CC – Combined Cycle; CCS – Carbon Capture and Sequestration; IGCC – Integrated Gasification Combined Cycle
We add in a CO2 price of
$50/tonne for all energy
sources.
$-
$10
$20
$30
$40
$50
$60
$70
$80
$-
$50
$100
$150
$200
$250
$300
$350
$400
$450
$500
$ p
er
mill
ion B
TU
$ p
er
BO
E -
Energ
y
Total Cost of Energy Including CO2 - Conventional and Alternatives
CO2 Cost
Net Operating Costs (including Fuel and Feedstock)
Capital Costs
2
The Energy Reality
The Energy Reality APRIL 2011 pg 20
Cost of Capital
The capital intensive nature of many large-scale energy projects, particularly alternatives, can lead to a debate
about an appropriate cost of capital to apply in the calculation of energy costs. In our analysis, we have
assumed a corporate cost of capital of 10%, which is in the range of what many corporations might use in
major capital investment decisions. However, as accurately indicated by many in the energy debate, we need
to consider future generations‟ access to reasonably priced energy and to a conserved environment. It is
important to note that cost of capital – or expected rate of return by an investor – is fundamentally in conflict
with future generations because it, by its nature, gives lower value to cash received in the future.
The higher the cost of capital and the further away in time, the lower the value in today‟s dollar. For instance,
at a cost of capital of 10%, a dollar received in 10 years is worth $0.35 today and if received in 20 years it is
worth only $0.12 today. The implication here is that it is better to receive the dollar in 10 years rather than in
20 years because it is many times more valuable at the earlier date. The goal in business – in a free market
society – is to maximize the net present value (NPV) of assets and the higher the cost of capital, the lower the
amount of value that is attributed to future years. This is more than just a way of doing business, it is a
fundamental decision-making tool for all individuals.
To take this to the extreme, it would make the most economic sense for an owner of an energy resource to
produce all the energy today, not next week or even tomorrow; producing it today will maximize their return
on capital, but takes no consideration to future generations. To take the opposite extreme, the owner could
produce no energy for 30 years and then produce it all in one day in 2041. In this case the energy would have
no value to the owner today, but may be of great value to his or her beneficiaries. However, it would have
been better for everyone – at least from the economic point of view – if the owner had produced all the energy
today and then reinvested the proceeds over the 30 years. These examples assume that energy prices stay flat.
All of this discussion is to point out the fundamental problem we are facing in our society in that we are driven
by maximizing value in today‟s dollar and this is forcing us to use the cheapest forms of energy. The result is
we will use inexpensive hydrocarbons initially, and the more expensive alternatives are being left until they
become economically viable or hydrocarbons become too expensive.
Note that the higher the cost of capital, the lower the value we assign to the future, at least in economic terms.
Now layer on environmental considerations to this, that is, how do we take into account long-term
environmental issues when economics are telling us to focus on the short-term? This is where the short-term
economic advantages of hydrocarbons are in conflict with the necessary long-term environmental
considerations. If society only looked at things from the cost of capital point of view, everything would be
done to maximize value in the present, with little to no consideration of the future. To include environmental
and other longer-term issues, a broader perspective is required. To address (but not resolve) this cost of capital
problem, we compared the total cost of energy, on an energy-equivalent basis, using three different discount
rates:
Corporate Cost of Capital – This is the 10% rate of return we used in Figures 1, 6 and 9 that might
be expected by private or corporate investors. This number will range due to the required rate of
return for various companies, but 10% is reasonable in the current environment.
Social Cost of Capital – This is the rate of return that would be used by governments and
economists to determine the value of investing in social projects like energy.
No Cost of Capital – This approach assumes a zero cost of capital over time and can arguably be
used in the analysis of the cost of energy and the related environmental issues.
Of these three values, the use and calculation of a social cost of capital has prompted the most debate. There is
no consensus on the best approach to determining a social discount rate, but there is a general agreement that
for longer term projects, with intergenerational and environmental effects, lower discount rates should be used
so that a significant weight is applied to the costs/benefits incurred by future generations. As an example, the
Society is driven to maximizing
value in today’s dollar, forcing
us to use the cheapest forms of
energy – hydrocarbons.
Cost of capital is in conflict with
future generations because it
gives lower value to cash
received in the future.
The higher the cost of capital,
the lower the value we assign to
the future, clearly a problem
with environmental issues.

The Energy Reality
The Energy Reality APRIL 2011 pg 21
authors of a Pembina Institute (a Canadian not-for-profit sustainable energy think tank) study titled: Natural
Credit – Estimating the Value of Natural Capital in the Credit River Watershed, note that “Uncertainty, risk,
intergenerational equity and potential irreversibility of policy decisions imply that the social discount rate
should be lower than interest rates set by traditional capital markets”. We agree with this assessment and have
calculated a social cost of capital, as discussed below.
Calculating a Social Cost of Capital
Some economists have argued that a good approximation of the social cost of capital is the real pre-tax rate of
return on riskless private investments. AltaCorp‟s estimate of the social cost of capital was developed based
on the historical average of Moody‟s AAA long-term bond yield of 5.9%. This value was then adjusted to
account for taxes and inflation, and then adjusted downwards by a factor of 2% to account for the inter-
generational nature of most energy projects based on a review of discount rates used by several countries and
international agencies. The resulting cost of capital was determined to be 3.5%. In comparison, governments
around the world have used values between 0.5% and 8% as the social cost of capital for long-term projects.
For comparison, the Pembina report performed valuations based on both a 2% and 5% discount rate.
In the next two figures, we show the same 27 energy projects, and applied the three costs of capital. The
liquids projects are shown in Figure 10 and the electrical projects are shown in Figure 11.
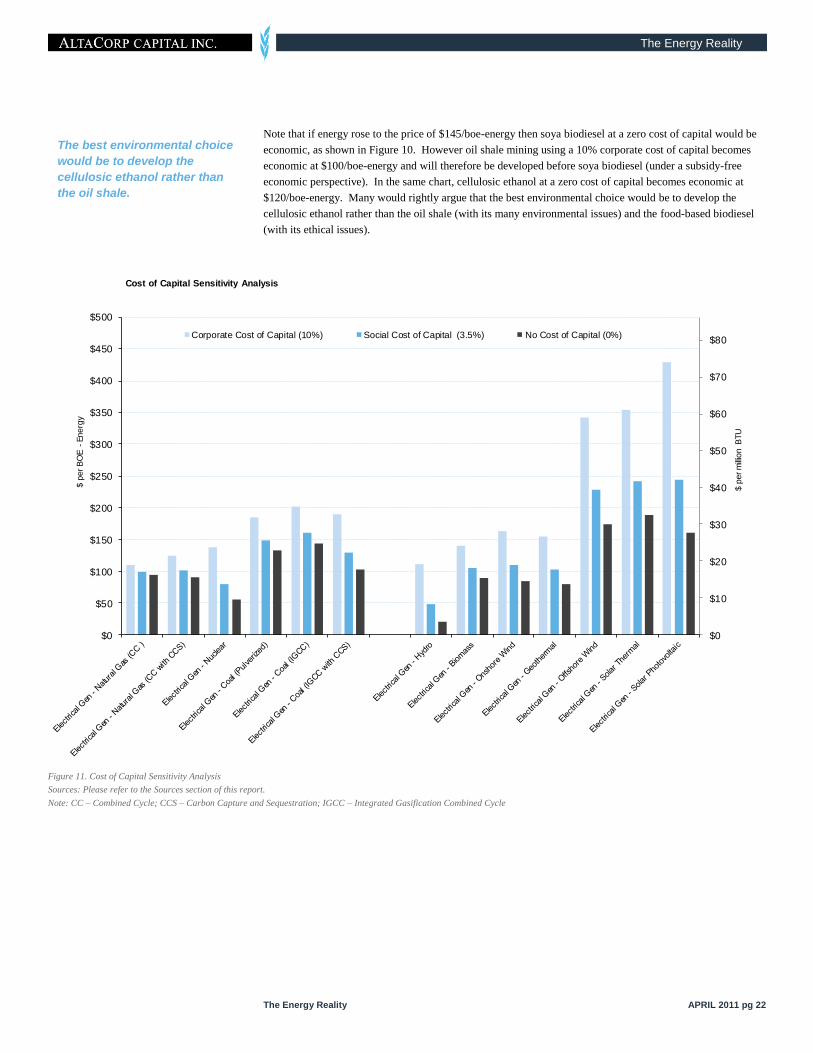
Figure 10. Cost of Capital Sensitivity Analysis
Sources: Please refer to the Sources section of this report.
We have applied the three costs
of capital to the 27 energy
projects.
$0
$10
$20
$30
$40
$50
$60
$70
$80
$0
$50
$100
$150
$200
$250
$300
$350
$400
$450
$500
$ p
er m
illio
n B
TU
$ p
er B
OE -
Energ
y
Cost of Capital Sensitivity Analysis
Corporate Cost of Capital (10%) Social Cost of Capital (3.5%) No Cost of Capital (0%)
The Energy Reality
The Energy Reality APRIL 2011 pg 22
Note that if energy rose to the price of $145/boe-energy then soya biodiesel at a zero cost of capital would be
economic, as shown in Figure 10. However oil shale mining using a 10% corporate cost of capital becomes
economic at $100/boe-energy and will therefore be developed before soya biodiesel (under a subsidy-free
economic perspective). In the same chart, cellulosic ethanol at a zero cost of capital becomes economic at
$120/boe-energy. Many would rightly argue that the best environmental choice would be to develop the
cellulosic ethanol rather than the oil shale (with its many environmental issues) and the food-based biodiesel
(with its ethical issues).
Figure 11. Cost of Capital Sensitivity Analysis
Sources: Please refer to the Sources section of this report.
Note: CC – Combined Cycle; CCS – Carbon Capture and Sequestration; IGCC – Integrated Gasification Combined Cycle
The best environmental choice
would be to develop the
cellulosic ethanol rather than
the oil shale.
$0
$10
$20
$30
$40
$50
$60
$70
$80
$0
$50
$100
$150
$200
$250
$300
$350
$400
$450
$500
$ p
er m
illio
n B
TU
$ p
er B
OE -
Energ
y
Cost of Capital Sensitivity Analysis
Corporate Cost of Capital (10%) Social Cost of Capital (3.5%) No Cost of Capital (0%)

The Energy Reality
The Energy Reality APRIL 2011 pg 23
Sensitivity Analysis – What Will Drive Variability in Cost
Estimates?
As a quick review, in Figure 9 we compared the cost of energy for a “typical” project under a specific set of
assumptions and in Figures 10 and 11 we evaluated the same costs under three different costs of capital. We
do not believe that the estimates in those figures are final and indisputable; there are many factors that will
cause these results to vary significantly including fuel prices, feedstock costs, carbon credit pricing, capacity
factors and heat rates. As a result, there will be a wide range of total costs per BTU (and per boe-energy)
when various projects are evaluated; some will have lower costs than our typical project and some will have
higher costs. Therefore, to better understand the dynamic behaviour of total energy costs under different
scenarios we have performed a sensitivity analysis; the drivers of variability are discussed over the next
several pages with the final results shown graphically in Figures 24 and 25.
Capacity Factor
In the case of several renewable resources, the capacity factor is a key driver of the total cost of energy that is
produced. The capacity factor is a ratio comparing the average energy produced over a period of time to the
energy that could have been produced at continuous full power operation during the same period (the latter
often referred to as a nameplate rating). The capacity factors used in our comparison of “typical” electricity
generation projects are shown in Figure 12.
Figure 12. Average Capacity Factors (Renewables and Conventional)
Sources: EIA, AltaCorp Capital Inc.
Note: CC – Combined Cycle; CCS – Carbon Capture and Sequestration; IGCC – Integrated Gasification Combined Cycle
We can see that most conventional power plants like nuclear, coal and natural gas operate at relatively high
capacity factors, indicating that the nameplate capacity of the plant is a relatively accurate indication of the
actual amount of energy produced over the economic life of the project. In contrast, the capacity factor for
several renewable alternatives is relatively low. For example, our analysis of solar photovoltaic (solar PV)
cells is based on a capacity factor of 22%. Therefore, a solar PV cell with a theoretical or nameplate rating of
100 watts will only generate an average of 22 watts of power over its life, in this case because of the limited
availability of its underlying resource (sunshine) throughout the day and night.
There are many factors that will
cause expected costs to vary
significantly.
Capacity Factor Comparison
Project Capacity Factor
Electrical Gen - Nuclear 90%
Electrical Gen - Natural Gas (CC ) 87%
Electrical Gen - Natural Gas (CC w ith CCS) 87%
Electrical Gen - Coal (Pulverized) 85%
Electrical Gen - Coal (IGCC) 85%
Electrical Gen - Coal (IGCC w ith CCS) 85%
Electrical Gen - Geothermal 90%
Electrical Gen - Biomass 83%
Electrical Gen - Hydro 51%
Electrical Gen - Offshore Wind 39%
Electrical Gen - Onshore Wind 34%
Electrical Gen - Solar Thermal 31%
Electrical Gen - Solar Photovoltaic 22%
The Energy Reality
The Energy Reality APRIL 2011 pg 24
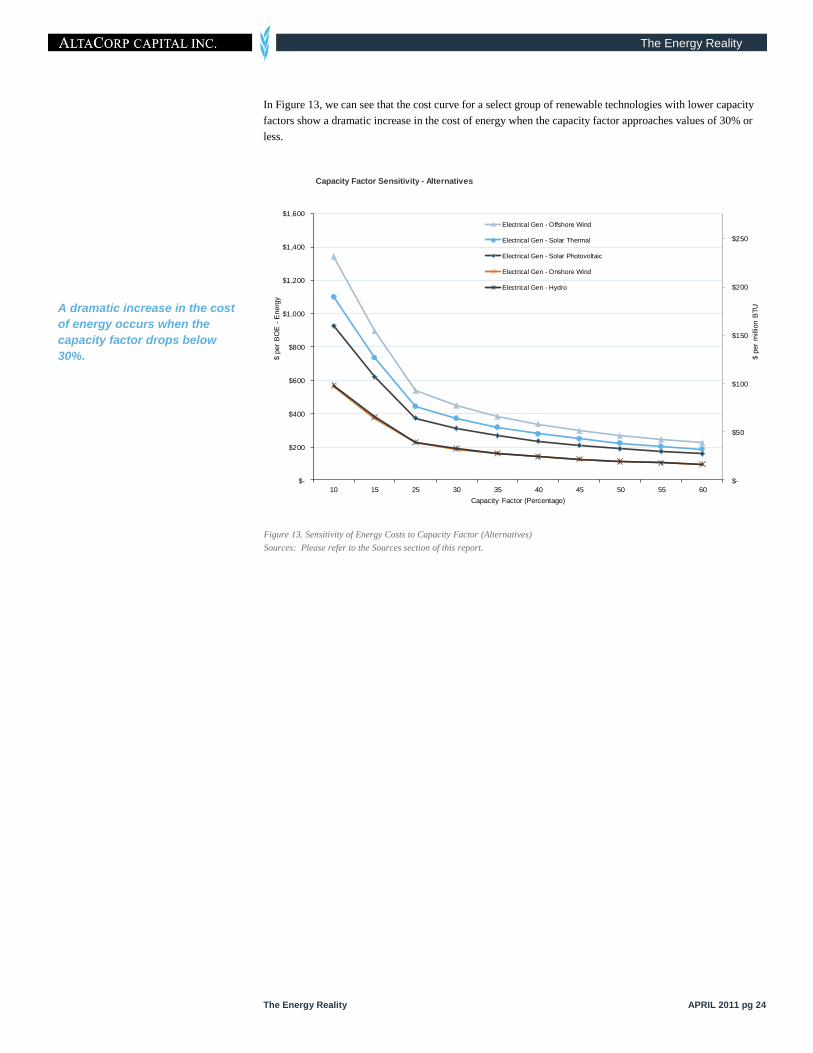
In Figure 13, we can see that the cost curve for a select group of renewable technologies with lower capacity
factors show a dramatic increase in the cost of energy when the capacity factor approaches values of 30% or
less.
Figure 13. Sensitivity of Energy Costs to Capacity Factor (Alternatives)
Sources: Please refer to the Sources section of this report.
A dramatic increase in the cost
of energy occurs when the
capacity factor drops below
30%.
$-
$50
$100
$150
$200
$250
$-
$200
$400
$600
$800
$1,000
$1,200
$1,400
$1,600
10 15 25 30 35 40 45 50 55 60
$ p
er
mill
ion B
TU
$ p
er
BO
E -
Energ
y
Capacity Factor (Percentage)
Capacity Factor Sensitivity - Alternatives
Electrical Gen - Offshore Wind
Electrical Gen - Solar Thermal
Electrical Gen - Solar Photovoltaic
Electrical Gen - Onshore Wind
Electrical Gen - Hydro
The Energy Reality
The Energy Reality APRIL 2011 pg 25
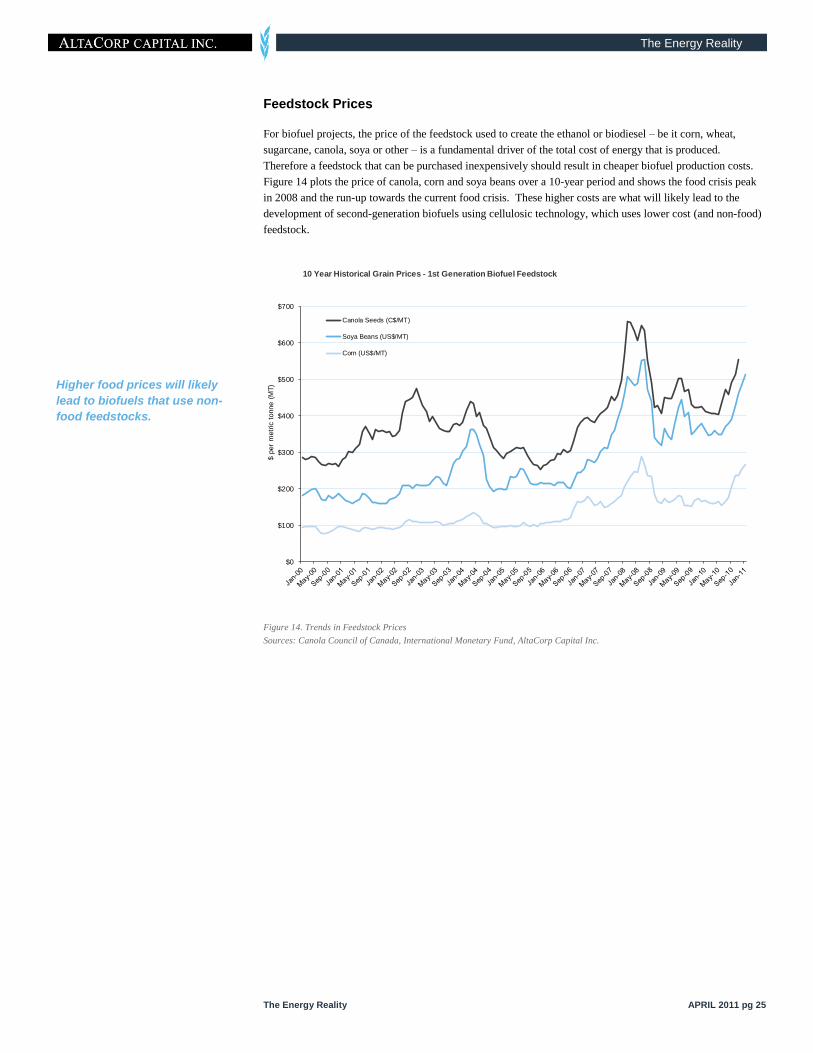
Feedstock Prices
For biofuel projects, the price of the feedstock used to create the ethanol or biodiesel – be it corn, wheat,
sugarcane, canola, soya or other – is a fundamental driver of the total cost of energy that is produced.
Therefore a feedstock that can be purchased inexpensively should result in cheaper biofuel production costs.
Figure 14 plots the price of canola, corn and soya beans over a 10-year period and shows the food crisis peak
in 2008 and the run-up towards the current food crisis. These higher costs are what will likely lead to the
development of second-generation biofuels using cellulosic technology, which uses lower cost (and non-food)
feedstock.
Figure 14. Trends in Feedstock Prices
Sources: Canola Council of Canada, International Monetary Fund, AltaCorp Capital Inc.
Higher food prices will likely
lead to biofuels that use non-
food feedstocks.
$0
$100
$200
$300
$400
$500
$600
$700
$ p
er
metr
ic t
onne (
MT)
10 Year Historical Grain Prices - 1st Generation Biofuel Feedstock
Canola Seeds (C$/MT)
Soya Beans (US$/MT)
Corn (US$/MT)

The Energy Reality
The Energy Reality APRIL 2011 pg 26
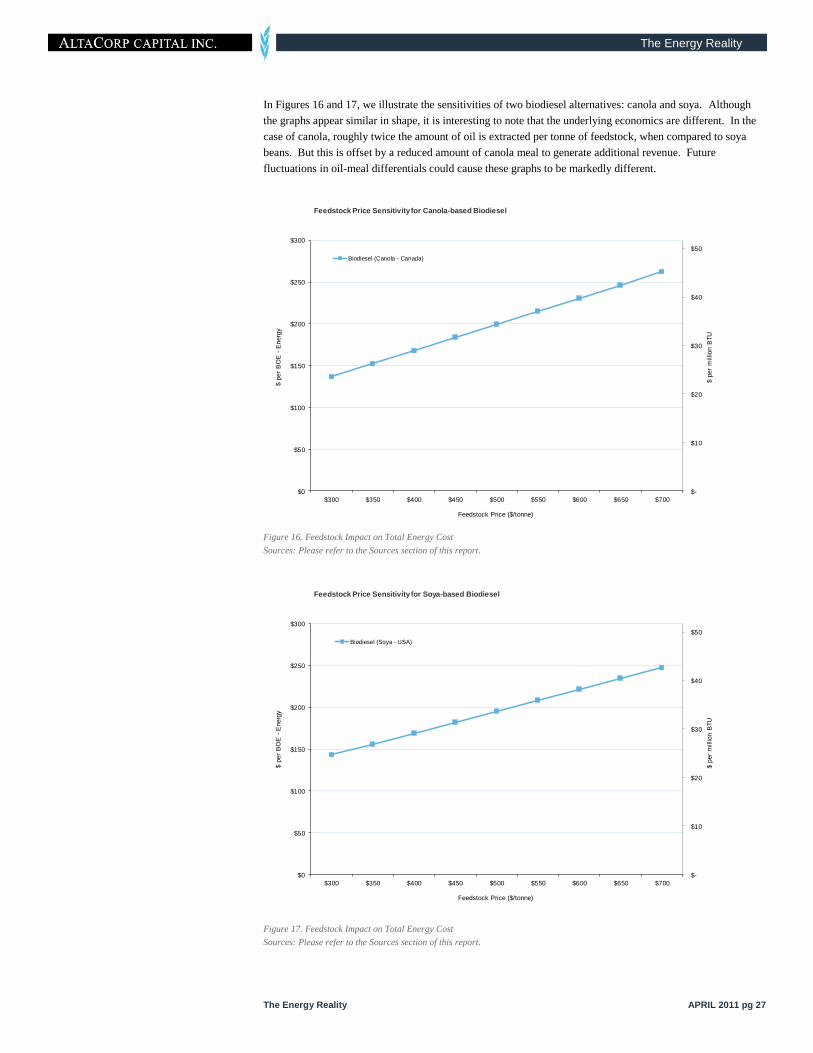
In Figures 15, 16 and 17, we compare the cost of feedstock (shown in $/tonne) used in our model and its
impact on the overall cost (shown on a $/boe-energy and BTU basis). The economic feasibility of these and
other biofuels is highly dependent on the revenue generated from the sale of by-products resulting from the
seed crushing process (in these cases soya and corn meal). Feedstock price alone is not the only driver of
biofuel cost; there is the benefit received from the by-products which is turned into meal for animal feed.
Figure 15. Feedstock Impact on Total Energy Cost
Sources: Please refer to the Sources section of this report.
Biofuels are highly dependent
on the revenue generated from
the sale of by-products.
$0
$10
$20
$30
$40
$50
$0
$50
$100
$150
$200
$250
$300
$100 $150 $200 $250 $300 $350 $400
$ p
er
mill
ion B
TU
$ p
er
BO
E -
Energ
y
Feedstock Price ($/tonne)
Feedstock Price Sensitivity for Corn-based Ethanol
Ethanol (Corn - USA)
The Energy Reality
The Energy Reality APRIL 2011 pg 27
In Figures 16 and 17, we illustrate the sensitivities of two biodiesel alternatives: canola and soya. Although
the graphs appear similar in shape, it is interesting to note that the underlying economics are different. In the
case of canola, roughly twice the amount of oil is extracted per tonne of feedstock, when compared to soya
beans. But this is offset by a reduced amount of canola meal to generate additional revenue. Future
fluctuations in oil-meal differentials could cause these graphs to be markedly different.
Figure 16. Feedstock Impact on Total Energy Cost
Sources: Please refer to the Sources section of this report.
Figure 17. Feedstock Impact on Total Energy Cost
Sources: Please refer to the Sources section of this report.
$-
$10
$20
$30
$40
$50
$0
$50
$100
$150
$200
$250
$300
$300 $350 $400 $450 $500 $550 $600 $650 $700
$ p
er
mill
ion B
TU
$ p
er
BO
E -
Energ
y
Feedstock Price ($/tonne)
Feedstock Price Sensitivity for Canola-based Biodiesel
Biodiesel (Canola - Canada)
$-
$10
$20
$30
$40
$50
$0
$50
$100
$150
$200
$250
$300
$300 $350 $400 $450 $500 $550 $600 $650 $700
$ p
er
mill
ion B
TU
$ p
er
BO
E -
Energ
y
Feedstock Price ($/tonne)
Feedstock Price Sensitivity for Soya-based Biodiesel
Biodiesel (Soya - USA)
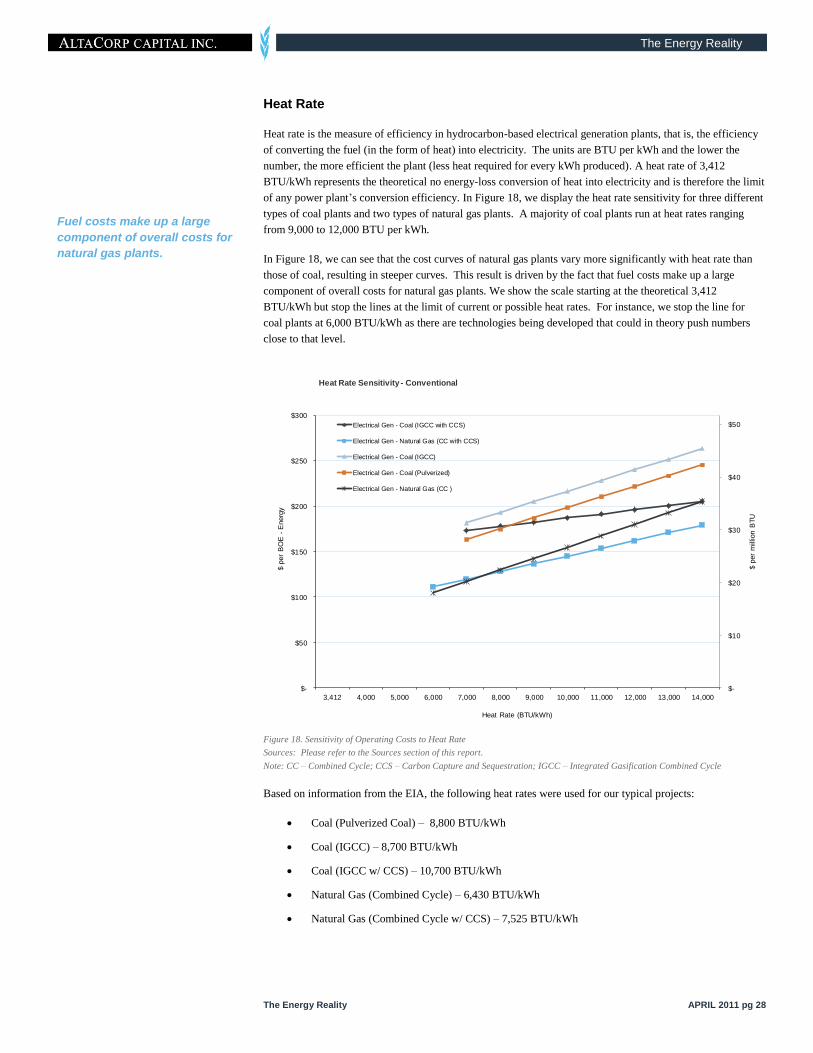
The Energy Reality
The Energy Reality APRIL 2011 pg 28
Heat Rate
Heat rate is the measure of efficiency in hydrocarbon-based electrical generation plants, that is, the efficiency
of converting the fuel (in the form of heat) into electricity. The units are BTU per kWh and the lower the
number, the more efficient the plant (less heat required for every kWh produced). A heat rate of 3,412
BTU/kWh represents the theoretical no energy-loss conversion of heat into electricity and is therefore the limit
of any power plant‟s conversion efficiency. In Figure 18, we display the heat rate sensitivity for three different
types of coal plants and two types of natural gas plants. A majority of coal plants run at heat rates ranging
from 9,000 to 12,000 BTU per kWh.
In Figure 18, we can see that the cost curves of natural gas plants vary more significantly with heat rate than
those of coal, resulting in steeper curves. This result is driven by the fact that fuel costs make up a large
component of overall costs for natural gas plants. We show the scale starting at the theoretical 3,412
BTU/kWh but stop the lines at the limit of current or possible heat rates. For instance, we stop the line for
coal plants at 6,000 BTU/kWh as there are technologies being developed that could in theory push numbers
close to that level.
Figure 18. Sensitivity of Operating Costs to Heat Rate
Sources: Please refer to the Sources section of this report.
Note: CC – Combined Cycle; CCS – Carbon Capture and Sequestration; IGCC – Integrated Gasification Combined Cycle
Based on information from the EIA, the following heat rates were used for our typical projects:
Coal (Pulverized Coal) – 8,800 BTU/kWh
Coal (IGCC) – 8,700 BTU/kWh
Coal (IGCC w/ CCS) – 10,700 BTU/kWh
Natural Gas (Combined Cycle) – 6,430 BTU/kWh
Natural Gas (Combined Cycle w/ CCS) – 7,525 BTU/kWh
Fuel costs make up a large
component of overall costs for
natural gas plants.
$-
$10
$20
$30
$40
$50
$-
$50
$100
$150
$200
$250
$300
3,412 4,000 5,000 6,000 7,000 8,000 9,000 10,000 11,000 12,000 13,000 14,000
$ p
er
mill
ion B
TU
$ p
er
BO
E -
Energ
y
Heat Rate (BTU/kWh)
Heat Rate Sensitivity - Conventional
Electrical Gen - Coal (IGCC with CCS)
Electrical Gen - Natural Gas (CC with CCS)
Electrical Gen - Coal (IGCC)
Electrical Gen - Coal (Pulverized)
Electrical Gen - Natural Gas (CC )
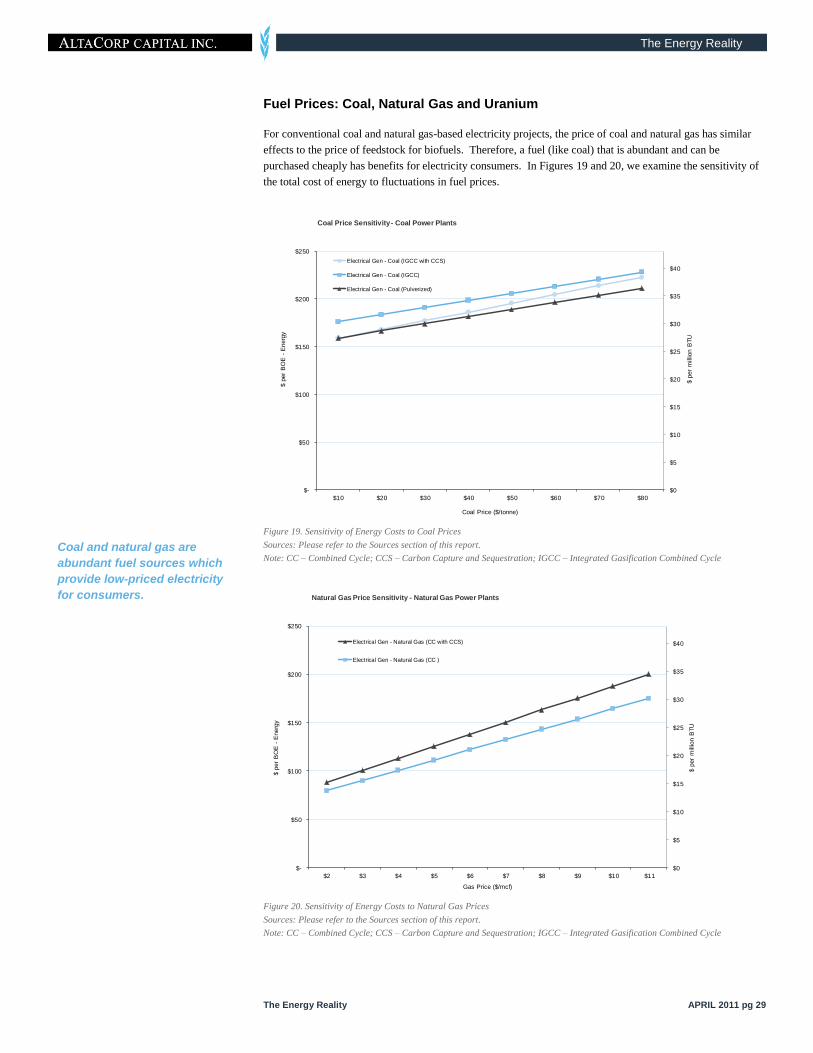
The Energy Reality
The Energy Reality APRIL 2011 pg 29
Fuel Prices: Coal, Natural Gas and Uranium
For conventional coal and natural gas-based electricity projects, the price of coal and natural gas has similar
effects to the price of feedstock for biofuels. Therefore, a fuel (like coal) that is abundant and can be
purchased cheaply has benefits for electricity consumers. In Figures 19 and 20, we examine the sensitivity of
the total cost of energy to fluctuations in fuel prices.
Figure 19. Sensitivity of Energy Costs to Coal Prices
Sources: Please refer to the Sources section of this report.
Note: CC – Combined Cycle; CCS – Carbon Capture and Sequestration; IGCC – Integrated Gasification Combined Cycle
Figure 20. Sensitivity of Energy Costs to Natural Gas Prices
Sources: Please refer to the Sources section of this report.
Note: CC – Combined Cycle; CCS – Carbon Capture and Sequestration; IGCC – Integrated Gasification Combined Cycle
Coal and natural gas are
abundant fuel sources which
provide low-priced electricity
for consumers.
$0
$5
$10
$15
$20
$25
$30
$35
$40
$-
$50
$100
$150
$200
$250
$10 $20 $30 $40 $50 $60 $70 $80
$ p
er
mill
ion B
TU
$ p
er
BO
E -
Energ
y
Coal Price ($/tonne)
Coal Price Sensitivity - Coal Power Plants
Electrical Gen - Coal (IGCC with CCS)
Electrical Gen - Coal (IGCC)
Electrical Gen - Coal (Pulverized)
$0
$5
$10
$15
$20
$25
$30
$35
$40
$-
$50
$100
$150
$200
$250
$2 $3 $4 $5 $6 $7 $8 $9 $10 $11
$ p
er
mill
ion B
TU
$ p
er
BO
E -
Energ
y
Gas Price ($/mcf)
Natural Gas Price Sensitivity - Natural Gas Power Plants
Electrical Gen - Natural Gas (CC with CCS)
Electrical Gen - Natural Gas (CC )

The Energy Reality
The Energy Reality APRIL 2011 pg 30
In the case of nuclear, we can see that the total cost of energy is relatively insensitive to fluctuation in the price
of the primary fuel.
Figure 21. Sensitivity of Energy Costs to Uranium (plus Enrichment) Prices
Sources: Please refer to the Sources section of this report.
$0
$5
$10
$15
$20
$25
$-
$20
$40
$60
$80
$100
$120
$140
$160
$60 $70 $80 $90 $100 $110 $120 $130 $140 $150
$ p
er
mill
ion B
TU
$ p
er
BO
E -
Energ
y
Uranium Price (including Enrichment) ($/lb)
Uranium Price Sensitivity - Nuclear Power Plants
Electrical Gen - Nuclear
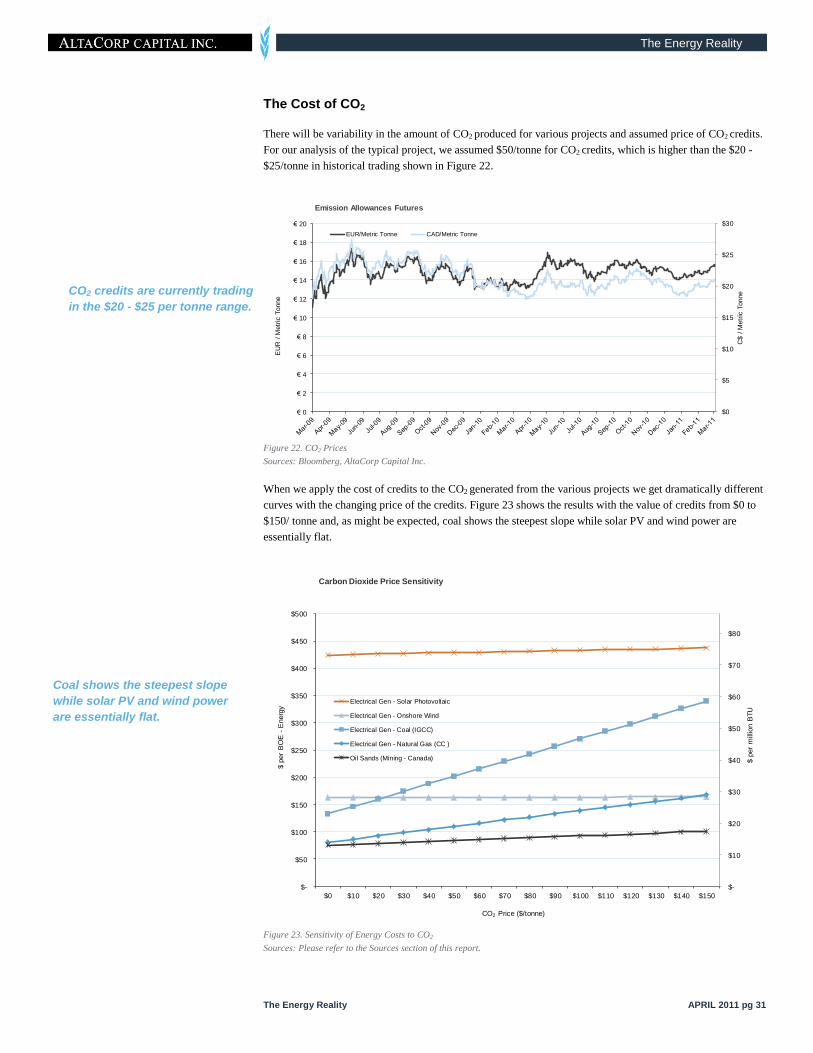
The Energy Reality
The Energy Reality APRIL 2011 pg 31
The Cost of CO2
There will be variability in the amount of CO2 produced for various projects and assumed price of CO2 credits.
For our analysis of the typical project, we assumed $50/tonne for CO2 credits, which is higher than the $20 -
$25/tonne in historical trading shown in Figure 22.
Figure 22. CO2 Prices
Sources: Bloomberg, AltaCorp Capital Inc.
When we apply the cost of credits to the CO2 generated from the various projects we get dramatically different
curves with the changing price of the credits. Figure 23 shows the results with the value of credits from $0 to
$150/ tonne and, as might be expected, coal shows the steepest slope while solar PV and wind power are
essentially flat.
Figure 23. Sensitivity of Energy Costs to CO2
Sources: Please refer to the Sources section of this report.
Coal shows the steepest slope
while solar PV and wind power
are essentially flat.
CO2 credits are currently trading
in the $20 - $25 per tonne range.
$0
$5
$10
$15
$20
$25
$30
€ 0
€ 2
€ 4
€ 6
€ 8
€ 10
€ 12
€ 14
€ 16
€ 18
€ 20
C$ /
Metr
ic T
onne
EU
R /
Metr
ic T
onne
Emission Allowances Futures
EUR/Metric Tonne CAD/Metric Tonne
$-
$10
$20
$30
$40
$50
$60
$70
$80
$-
$50
$100
$150
$200
$250
$300
$350
$400
$450
$500
$0 $10 $20 $30 $40 $50 $60 $70 $80 $90 $100 $110 $120 $130 $140 $150
$ p
er
mill
ion B
TU
$ p
er
BO
E -
Energ
y
CO2 Price ($/tonne)
Carbon Dioxide Price Sensitivity
Electrical Gen - Solar Photovoltaic
Electrical Gen - Onshore Wind
Electrical Gen - Coal (IGCC)
Electrical Gen - Natural Gas (CC )
Oil Sands (Mining - Canada)
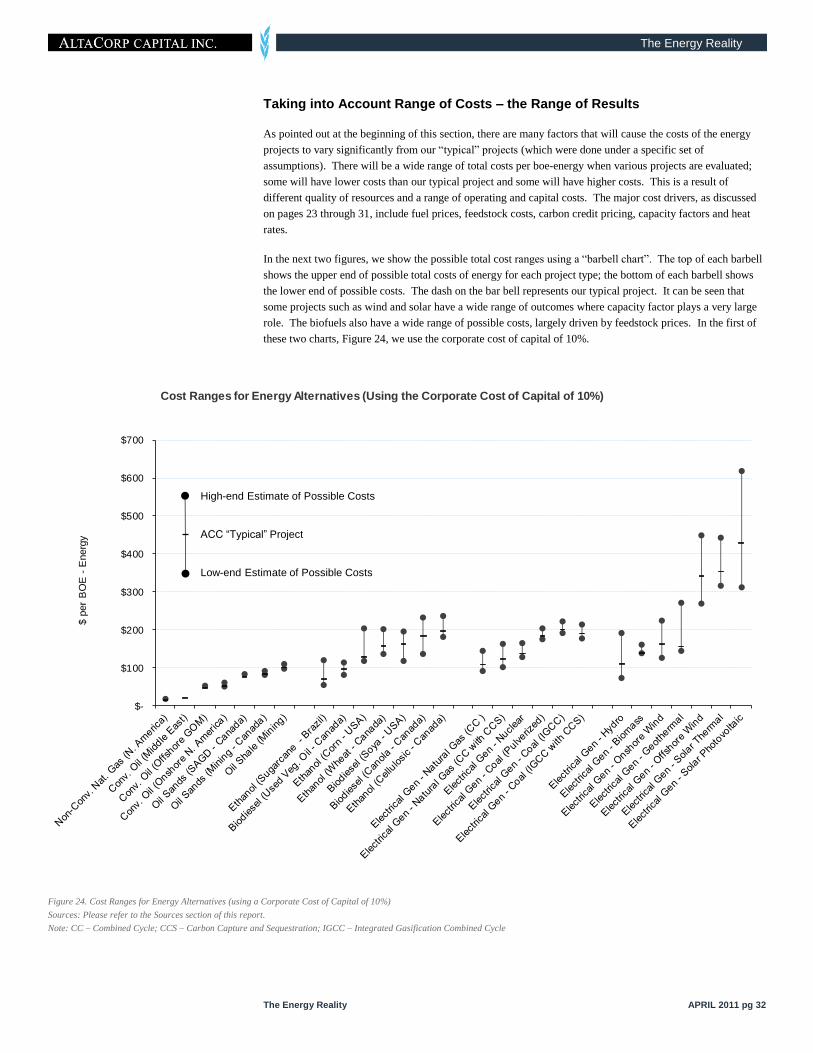
The Energy Reality
The Energy Reality APRIL 2011 pg 32
Taking into Account Range of Costs – the Range of Results
As pointed out at the beginning of this section, there are many factors that will cause the costs of the energy
projects to vary significantly from our “typical” projects (which were done under a specific set of
assumptions). There will be a wide range of total costs per boe-energy when various projects are evaluated;
some will have lower costs than our typical project and some will have higher costs. This is a result of
different quality of resources and a range of operating and capital costs. The major cost drivers, as discussed
on pages 23 through 31, include fuel prices, feedstock costs, carbon credit pricing, capacity factors and heat
rates.
In the next two figures, we show the possible total cost ranges using a “barbell chart”. The top of each barbell
shows the upper end of possible total costs of energy for each project type; the bottom of each barbell shows
the lower end of possible costs. The dash on the bar bell represents our typical project. It can be seen that
some projects such as wind and solar have a wide range of outcomes where capacity factor plays a very large
role. The biofuels also have a wide range of possible costs, largely driven by feedstock prices. In the first of
these two charts, Figure 24, we use the corporate cost of capital of 10%.
Figure 24. Cost Ranges for Energy Alternatives (using a Corporate Cost of Capital of 10%)
Sources: Please refer to the Sources section of this report.
Note: CC – Combined Cycle; CCS – Carbon Capture and Sequestration; IGCC – Integrated Gasification Combined Cycle
$-
$100
$200
$300
$400
$500
$600
$700
$ p
er
BO
E -
Energ
y
Cost Ranges for Energy Alternatives (Using the Corporate Cost of Capital of 10%)
High-end Estimate of Possible Costs
ACC “Typical” Project
Low-end Estimate of Possible Costs
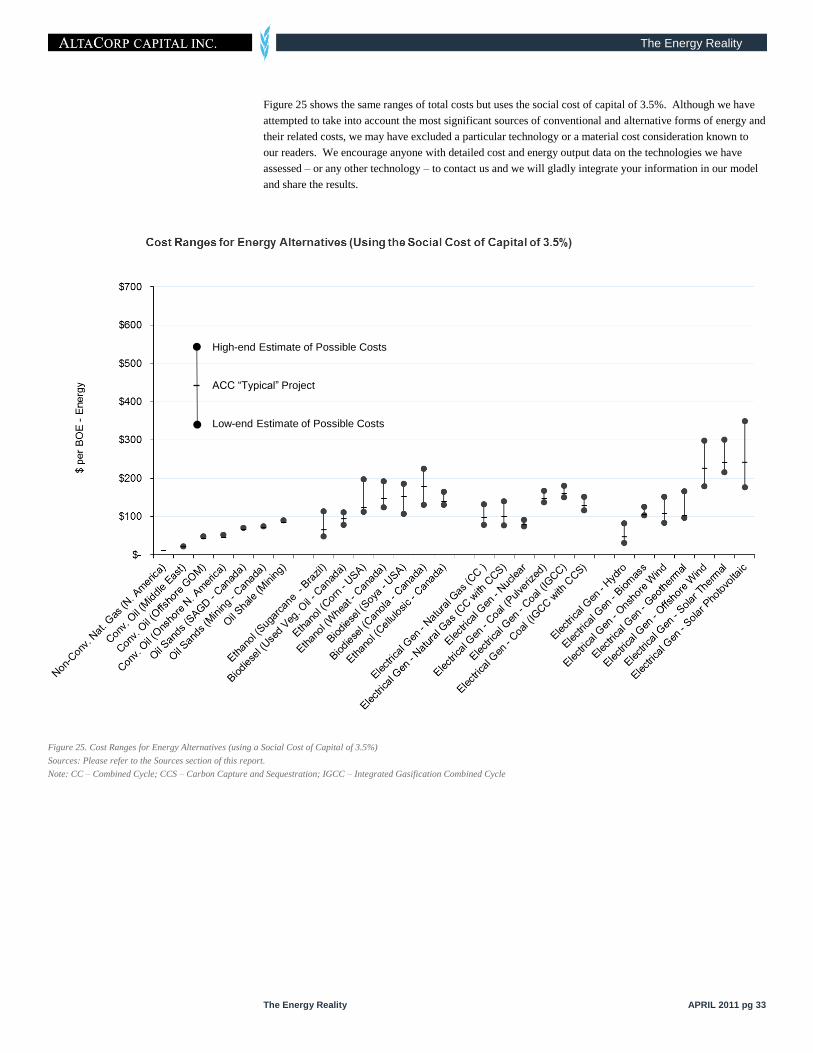
The Energy Reality
The Energy Reality APRIL 2011 pg 33
Figure 25 shows the same ranges of total costs but uses the social cost of capital of 3.5%. Although we have
attempted to take into account the most significant sources of conventional and alternative forms of energy and
their related costs, we may have excluded a particular technology or a material cost consideration known to
our readers. We encourage anyone with detailed cost and energy output data on the technologies we have
assessed – or any other technology – to contact us and we will gladly integrate your information in our model
and share the results.
Figure 25. Cost Ranges for Energy Alternatives (using a Social Cost of Capital of 3.5%)
Sources: Please refer to the Sources section of this report.
Note: CC – Combined Cycle; CCS – Carbon Capture and Sequestration; IGCC – Integrated Gasification Combined Cycle
High-end Estimate of Possible Costs
ACC “Typical” Project
Low-end Estimate of Possible Costs

The Energy Reality
The Energy Reality APRIL 2011 pg 34
What Happens If Oil Prices Continue to Rise?
It is very important to note that in all of these ranges we do not include what might happen to input costs of the
various projects if oil prices rise beyond current levels. We previously indicated that our total cost analysis
showed alternatives become economic when oil prices rose to a certain level. For instance, soya-based
biodiesel in our typical cost scenario becomes economic when oil reaches approximately $160/boe-energy at
the corporate cost of capital. However, if oil prices were that high, then the fuel required to run the farm
machinery to plant and harvest the soya would also be more expensive, which in turn would raise the cost per
BTU of energy received from the biodiesel. The higher the oil prices, the more expensive alternatives
become, because oil is an input cost for all forms of energy, including oil itself.
The higher oil prices are, the
more expensive alternatives
become.
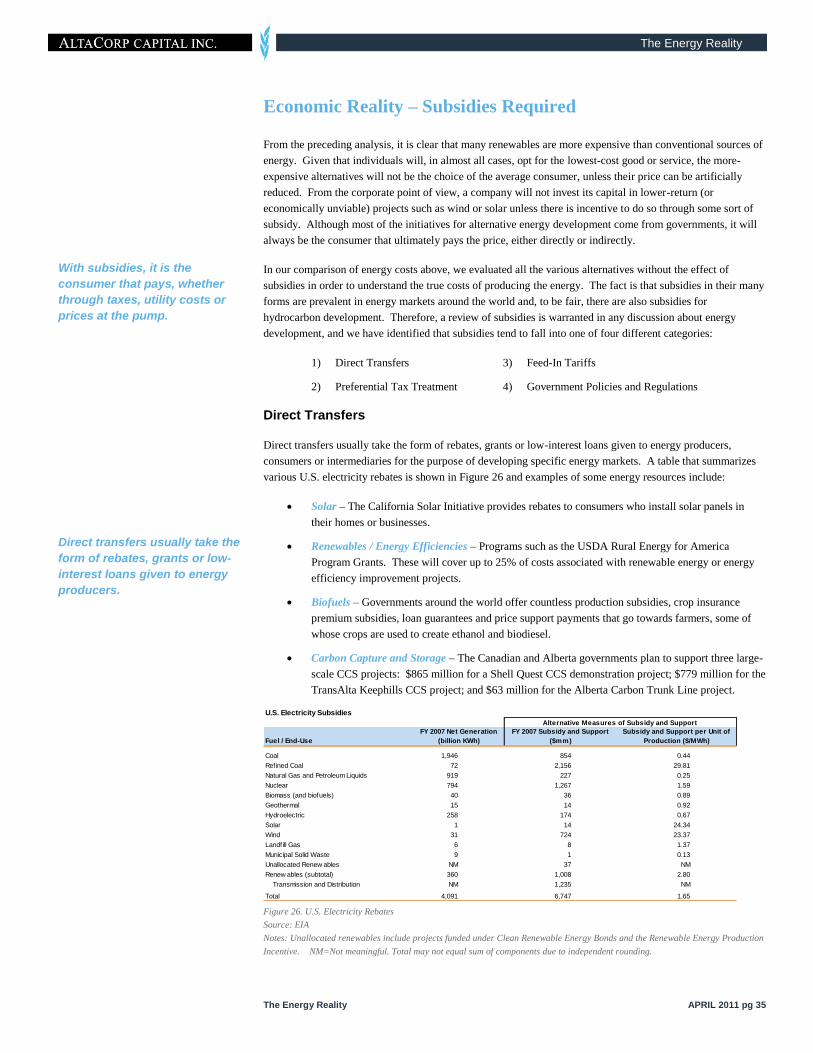
The Energy Reality
The Energy Reality APRIL 2011 pg 35
Economic Reality – Subsidies Required
From the preceding analysis, it is clear that many renewables are more expensive than conventional sources of
energy. Given that individuals will, in almost all cases, opt for the lowest-cost good or service, the more-
expensive alternatives will not be the choice of the average consumer, unless their price can be artificially
reduced. From the corporate point of view, a company will not invest its capital in lower-return (or
economically unviable) projects such as wind or solar unless there is incentive to do so through some sort of
subsidy. Although most of the initiatives for alternative energy development come from governments, it will
always be the consumer that ultimately pays the price, either directly or indirectly.
In our comparison of energy costs above, we evaluated all the various alternatives without the effect of
subsidies in order to understand the true costs of producing the energy. The fact is that subsidies in their many
forms are prevalent in energy markets around the world and, to be fair, there are also subsidies for
hydrocarbon development. Therefore, a review of subsidies is warranted in any discussion about energy
development, and we have identified that subsidies tend to fall into one of four different categories:
1) Direct Transfers 3) Feed-In Tariffs
2) Preferential Tax Treatment 4) Government Policies and Regulations
Direct Transfers
Direct transfers usually take the form of rebates, grants or low-interest loans given to energy producers,
consumers or intermediaries for the purpose of developing specific energy markets. A table that summarizes
various U.S. electricity rebates is shown in Figure 26 and examples of some energy resources include:
Solar – The California Solar Initiative provides rebates to consumers who install solar panels in
their homes or businesses.
Renewables / Energy Efficiencies – Programs such as the USDA Rural Energy for America
Program Grants. These will cover up to 25% of costs associated with renewable energy or energy
efficiency improvement projects.
Biofuels – Governments around the world offer countless production subsidies, crop insurance
premium subsidies, loan guarantees and price support payments that go towards farmers, some of
whose crops are used to create ethanol and biodiesel.
Carbon Capture and Storage – The Canadian and Alberta governments plan to support three large-
scale CCS projects: $865 million for a Shell Quest CCS demonstration project; $779 million for the
TransAlta Keephills CCS project; and $63 million for the Alberta Carbon Trunk Line project.
Figure 26. U.S. Electricity Rebates
Source: EIA
Notes: Unallocated renewables include projects funded under Clean Renewable Energy Bonds and the Renewable Energy Production
Incentive. NM=Not meaningful. Total may not equal sum of components due to independent rounding.
U.S. Electricity Subsidies
Fuel / End-Use
FY 2007 Net Generation
(billion KWh)
FY 2007 Subsidy and Support
($mm)
Subsidy and Support per Unit of
Production ($/MWh)
Coal 1,946 854 0.44
Refined Coal 72 2,156 29.81
Natural Gas and Petroleum Liquids 919 227 0.25
Nuclear 794 1,267 1.59
Biomass (and biofuels) 40 36 0.89
Geothermal 15 14 0.92
Hydroelectric 258 174 0.67
Solar 1 14 24.34
Wind 31 724 23.37
Landfill Gas 6 8 1.37
Municipal Solid Waste 9 1 0.13
Unallocated Renew ables NM 37 NM
Renew ables (subtotal) 360 1,008 2.80
Transmission and Distribution NM 1,235 NM
Total 4,091 6,747 1.65
Alternative Measures of Subsidy and Support
With subsidies, it is the
consumer that pays, whether
through taxes, utility costs or
prices at the pump.
Direct transfers usually take the
form of rebates, grants or low-
interest loans given to energy
producers.
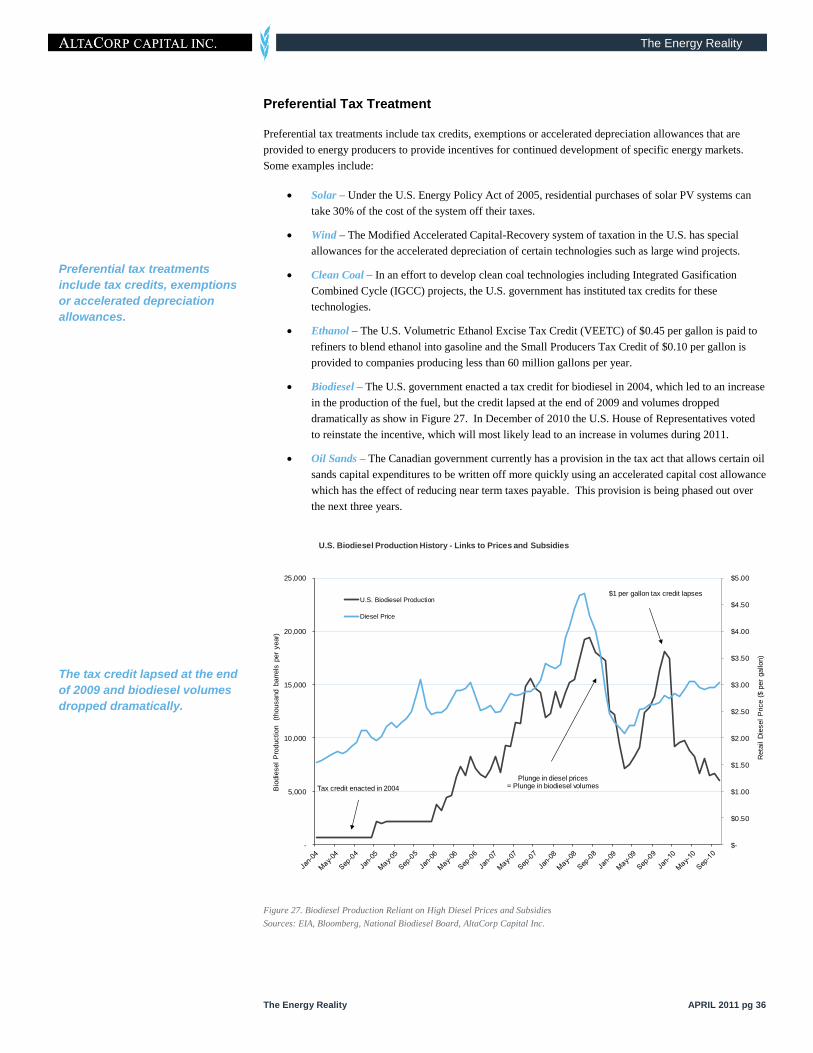
The Energy Reality
The Energy Reality APRIL 2011 pg 36
Preferential Tax Treatment
Preferential tax treatments include tax credits, exemptions or accelerated depreciation allowances that are
provided to energy producers to provide incentives for continued development of specific energy markets.
Some examples include:
Solar – Under the U.S. Energy Policy Act of 2005, residential purchases of solar PV systems can
take 30% of the cost of the system off their taxes.
Wind – The Modified Accelerated Capital-Recovery system of taxation in the U.S. has special
allowances for the accelerated depreciation of certain technologies such as large wind projects.
Clean Coal – In an effort to develop clean coal technologies including Integrated Gasification
Combined Cycle (IGCC) projects, the U.S. government has instituted tax credits for these
technologies.
Ethanol – The U.S. Volumetric Ethanol Excise Tax Credit (VEETC) of $0.45 per gallon is paid to
refiners to blend ethanol into gasoline and the Small Producers Tax Credit of $0.10 per gallon is
provided to companies producing less than 60 million gallons per year.
Biodiesel – The U.S. government enacted a tax credit for biodiesel in 2004, which led to an increase
in the production of the fuel, but the credit lapsed at the end of 2009 and volumes dropped
dramatically as show in Figure 27. In December of 2010 the U.S. House of Representatives voted
to reinstate the incentive, which will most likely lead to an increase in volumes during 2011.
Oil Sands – The Canadian government currently has a provision in the tax act that allows certain oil
sands capital expenditures to be written off more quickly using an accelerated capital cost allowance
which has the effect of reducing near term taxes payable. This provision is being phased out over
the next three years.
Figure 27. Biodiesel Production Reliant on High Diesel Prices and Subsidies
Sources: EIA, Bloomberg, National Biodiesel Board, AltaCorp Capital Inc.
Preferential tax treatments
include tax credits, exemptions
or accelerated depreciation
allowances.
The tax credit lapsed at the end
of 2009 and biodiesel volumes
dropped dramatically.
$-
$0.50
$1.00
$1.50
$2.00
$2.50
$3.00
$3.50
$4.00
$4.50
$5.00
-
5,000
10,000
15,000
20,000
25,000
Reta
il D
iesel
Price (
$ p
er
gallo
n)
Bio
die
sel
Pro
duction
(thousand b
arr
els
per
year)
U.S. Biodiesel Production History - Links to Prices and Subsidies
U.S. Biodiesel Production
Diesel Price
$1 per gallon tax credit lapses
Plunge in diesel prices= Plunge in biodiesel volumesTax credit enacted in 2004

The Energy Reality
The Energy Reality APRIL 2011 pg 37
Feed-In Tariffs
An alternative to direct transfers and tax incentives, which have a negative impact on government balance
sheets, is the application of feed-in tariffs. A feed-in tariff is a premium price, set by government legislation,
that utilities are legally obligated to pay for certain types of energy (in addition to providing guaranteed grid
access). The end result of feed-in tariffs is that the incremental cost of energy due to premium prices and new
grid connections is passed onto all energy rate payers. Therefore, the financial burden migrates from “Joe the
Taxpayer” to “Joe the Ratepayer.” Some examples of feed-in tariffs include:
Solar – In Ontario, the renewable energy feed-in tariff program provides guaranteed prices under
long-term contracts for energy generated from renewable sources. In the case of solar PV projects,
this premium pricing can be as high as $802/MWh whereas average monthly prices for consumers
run at a fraction of that, in the range of $30/MWh to $60/MWh.
Wind – In Denmark, the country‟s large penetration of wind power has been driven, in part, by
significant feed-in tariffs for wind power in the form of Public Service Obligations that appear on
consumers‟ electricity bills. This tends to stabilize the revenue received by wind turbine operators in
the range of €67 to €81/MWh, which is significantly more than spot market prices in the range of
€33 to €57/MWh.
Government Policies, Regulations and Royalties
In some cases, subsidies can take the form of government mandates or regulations designed to encourage the
use of specific types of energies.
Biofuels – Around the world, mandatory blended percentages of ethanol/biodiesel are designed to
encourage consumption of biofuels. In the U.S., some ethanol producers view these regulations as
critical to continued growth in biofuel production/consumption, referring to current standards as a
“Blend Wall” (virtual limit to biofuel production that could not be surpassed without further
government intervention).
Renewables – In the EU‟s directive on renewable energy, it sets a target of a 20% share of energy
from renewable sources by 2020.
Oil Sands – To encourage development of the oil sands, a more-expensive hydrocarbon resource
than conventional oil, the Alberta government initially had in place a very low 1% royalty on gross
revenues before the return of invested capital and 25% of net revenue after return of capital. This
was revised to a sliding scale scheme based on oil prices, which came into effect in 2009, where the
royalty now varies from 1 to 9% before return of capital and from 25% to 40% thereafter.
Tougher Decisions in Leaner Economics Times?
The cost of subsidizing the various segments of the energy sector can take a huge toll on either government
balance sheets or individuals through higher energy costs. No matter what form of subsidy, it is always the
consumer that will pay, whether through higher taxes, higher utility costs or higher prices at the pump. During
tougher economic times there has been a shift away from many forms of subsidies and in some extreme cases,
retroactive reversals. Some prominent examples include:
• In 2000, the Renewable Energy Sources Act (EEG) introduced in Germany had feed-in tariffs over
€500/MWh paid for several years. In 2010, the government announced significant reductions in
these tariffs on a go-forward basis.
The Spanish government has announced retroactive cuts of up to 45% in the feed-in tariffs for solar
PV projects and has also announced cuts to wind power subsidies of 35% by 2012.
The Ontario Power Authority is proposing to cut the rate paid to ground-mounted solar systems by
27% to $585/MWh for new contracts.
A feed-in tariff is a premium
price that utilities are legally
obligated to pay for certain
types of energy.
During tougher economic times
there has been a shift away
from many forms of subsidies.
Mandatory blended percentages
of ethanol / biodiesel are
designed to encourage
consumption of biofuels.

The Energy Reality
The Energy Reality APRIL 2011 pg 38
Sustainable Energy – Under What Economic Conditions?
Alternative energy is often referred to as sustainable energy, which refers to the fact that we can continuously
grow biofuel crops, there are unlimited amounts of sun for solar power and we won‟t run out of wind for wind
turbines. Ironically, it has been shown in many cases that alternatives are not sustainable without government
support. How truly sustainable are alternatives if they cannot survive without government subsidies? How
can governments sustain subsidies in the face of increasing indebtedness? Maybe alternatives are a type of
“Unobtainium” in practical and economic terms.
A Comment on “Green Jobs”
This phrase, which refers to new jobs created by the development of alternatives, is usually used in a positive
light, but given the subsidies required for the development of renewable technologies, these “green jobs” are
really based on businesses that might not survive without government support. Although the development of
renewable industries is necessary, it needs to be done in a truly sustainable way and create jobs that will be
there for the long term, not just for the duration of a government subsidy. Job creation only helps society if the
jobs provide a net economic benefit.
It has been pointed out that renewable energy projects, like solar and wind, create more jobs for every dollar
invested than hydrocarbon projects. This is not surprising; from our analysis of the economics of these
projects, it would actually be expected. This is because for every BTU of solar and wind energy produced,
significantly more money needs to be invested – including labour costs. Although more jobs might be created
with renewable energy for every dollar invested, it would in fact be better if fewer jobs were produced for
every dollar invested. The logic here is: if total costs (including labour) were reduced on a BTU basis then the
projects would be more economically-viable and the businesses behind them might become truly sustainable.
To clarify this somewhat counter-intuitive argument, consider two companies competing in the same business
sector and producing the same product (BTUs in this case, but could be any product). One employs 10 people
and the other five, but they both produce the same amount of product, have the same financial resources and
pay their employees similarly. With everything else being equal, which one will be more successful, grow
more rapidly and continue to add jobs? Obviously the lower-cost company, the one with fewer employees per
product produced; the BTUs would be produced for lower cost. Should the government subsidize the less
efficient company to create more jobs? That seems doubtful.
Some might point out that oil sands projects and certain other hydrocarbon operations do receive subsidies too,
but these rarely involve cash payments from consumers or governments. It is usually in the form of lower
royalties over a limited period and there is no direct movement of cash out of government coffers or
consumers wallets.
In many cases alternatives are
not sustainable without
government support.
Should the government
subsidize the less efficient
company to create more jobs?
Maybe alternatives are a type of
“Unobtainium” in practical and
economic terms.
It would be better for society if
fewer jobs were created for
every dollar invested.
The Energy Reality
The Energy Reality APRIL 2011 pg 39
Tragedy of the Hydrocarbons
In this report, we introduce the concept of the Tragedy of the Hydrocarbons, which is a dilemma related to
Garrett Hardin‟s The Tragedy of the Commons. In the Tragedy of the Hydrocarbons, as we describe it,
individuals will choose to consume hydrocarbons because they are the most economic and practical form of
energy available. The tragedy lies with the reality that it is not in the best long-term interest of the individual,
society, mankind or the planet for this to continue. This is because hydrocarbon resources are limited; as we
continue to consume them, we continue to “empty the tank”. We could have a relatively seamless transition to
alternatives but, because hydrocarbons continue to be the cheapest form of energy, we will use these until
forced to make a transition. A transition forced upon us will not be simple or problem-free.
Garrett Hardin‟s Tragedy of the Commons is well described on Wikipedia:
Central to Hardin's article is an example (first sketched in an 1833 pamphlet by W. F. Lloyd) of a
hypothetical and simplified situation based on medieval land tenure in Europe, of herders sharing a
common parcel of land, on which they are each entitled to let their cows graze. In Hardin's
example, it is in each herder's interest to put the next (and succeeding) cows he acquires onto the
land, even if the quality of the common is temporarily or permanently damaged for all as a result,
through over grazing. The herder receives all of the benefits from an additional cow, while the
damage to the common is shared by the entire group. If all herders make this individually rational
economic decision, the common will be depleted or even destroyed to the detriment of all.
The Tragedy of the Hydrocarbons is similar in many ways to the Tragedy of the Commons, including:
The “group” in this tragedy is the billions of humans on the planet and the “commons” are the
hydrocarbons that are available to most of mankind. We can equate the grasses on Hardin‟s
commons to hydrocarbons; both are a source of energy and a shared resource. The grasses on
Hardin‟s commons are the source of energy for the cows (and ultimately the herders); in the
Tragedy of the Hydrocarbons the hydrocarbons are the source of energy for the global society.
Hydrocarbons provide one of the most economic forms of energy available, and therefore, will be
consumed preferentially before more expensive alternative forms of energy.
The consumption of hydrocarbons can increase the quality of life for an individual through low-cost
transportation, food, goods and services. The individual receives the full benefit of the use of
energy, but shares damage to the commons with billions of others. The damage to the commons in
this tragedy is the reduction of global oil reserves. That is, increasing consumption will reduce the
amount available for others, including future generations.
Conversely, consider an individual who chooses to use a more-expensive and completely-renewable
form of energy, say wind and solar. Although commendable, this person bears the full burden of
higher energy costs and practical limitations of these forms of energy. The benefits this individual
provides to society – less pollution and the preservation of resources – are shared with billions of
other individuals. The net result is the individual pays a large cost for a wise choice, but gains
essentially no personal benefit (when spread over billions of others) from his/her efforts. Think of
the resentment and frustration this wise person might feel when left on the side of the road with
depleted batteries in their expensive solar-powered car while multiple gas guzzling SUVs drive past.
This is the tragedy: individuals will make the choice to use the cheaper non-renewable
hydrocarbons because it is best for them at this moment. It would be better for society if this was
not the case, but this is how individuals will act under the circumstances.
To reiterate what was stated earlier, mankind will have to dramatically change its collective
thinking to avoid this tragedy and adopt the use of alternatives before we are forced to change under
more challenging circumstances.
The individual receives the full
benefit of the use of
hydrocarbons, but shares
damage to the “commons” with
billions of others.
Society will use hydrocarbons
until we are forced to make a
transition.
Mankind will have to
dramatically change its
collective thinking to avoid this
tragedy.

The Energy Reality
The Energy Reality APRIL 2011 pg 40
Practical Reality – An Integrated System View
In addition to understanding the economic realities, we believe that to objectively compare and contrast
alternate energy sources, an integrated approach to comparing the costs and benefits of each is required, rather
than examining one or two criteria in isolation. In this context, integrated means taking into account all
significant practical factors that enter into the choice of an energy source. These include variability, certainty,
versatility, storability, transmission system integration, environmental, and socio-economic factors.
All too often, the notion of a “balanced” approach to comparing energy sources is to ignore economic costs
and practical realities, and consider only CO2 emissions, which are often used as a form of trump card. While
we believe that evaluating pollution is necessary, it should not be done in isolation nor should we focus
exclusively on CO2 emissions. What about water use, as an example? Biofuels actually use far more water
per BTU produced than oil sands projects. Our goal in using a broader perspective is to illustrate that there is
not a clear “winner” – nor should there be – in the energy debate and that every conventional or renewable
form of energy brings with it a number of advantages and disadvantages. Society will need access to all forms
of energy as global demand continues to grow.
Resource Variability and Certainty
Variability is a measure of extent to which the availability of the primary resource (be it oil, gas, wind,
sunlight or moving water) varies over time, which can negatively impact the reliable output of an energy
system. Certainty is a measure of the predictability of variations (magnitude and timing) of the primary
resource. In order to forecast the energy supply and plan for the safe and reliable operation of electrical grids
and other critical energy systems, a higher level of certainty for the underlying energy source is desirable.
In most of the developed world, people have come to expect and demand low-variability and high-certainty
energy but many alternatives do not provide either. We discuss a few renewables from this perspective:
Wind – A wind turbine generates power in direct correlation to the amount of wind at the site which
can fluctuate from one minute to the next – at some times producing at its maximum potential and at
other points, no electricity at all. This results in a highly variable source of energy, which also has
very little predictability. Despite the development of advanced wind modelling techniques,
significant differences between forecasts and actual production levels can occur. For example, on
February 26, 2008 in Texas, wind generation of 2,000 MW dropped to 360 MW, an event that
occurred hours sooner and at a rate faster than forecasted. This unexpected drop resulted in
emergency demand-response measures, forcing several industrial and commercial customers to
curtail their electricity consumption.
Solar – Solar panels‟ power generation will vary depending on cloud cover during the day. There is
greater predictability when solar will produce no electricity (at night) and this can be counted on for
electrical grid management. Similar to wind power, the amount of energy collected from the sun
cannot be controlled by plant operators and solar energy is not demand responsive. If there are
peaks or spikes in demand, the solar power cannot be relied upon requiring other forms of power
generation to step in.
Hydro – Water flow from rivers can vary on an hourly basis, but the ability of dams to “store” water
energy helps smooth the availability of hydro power. Therefore, the resulting variability of the
underlying resource tends only to be seasonal in nature. Certainty is very high with hydro and
facility operators have the ability to control this, unlike solar or wind. Even in “dry” years, the lack
of water can be forecast with relative accuracy, allowing grid operators to adjust the energy supply
mix.
Biofuels – With improved farming techniques, many countries have been able to produce consistent
levels of biofuels and in many instances increase production due to increased crop yields. However,
unlike conventional oil projects, production levels remain sensitive to variations in the weather and
Most people have come to
expect low-variability and high-
certainty energy.
Integrated means taking into
account all significant practical
factors that enter into the
choice of an energy source.
Society will need access to all
forms of energy as global
demand continues to grow.
Wind power is a highly variable
and unpredictable source of
energy.
The Energy Reality
The Energy Reality APRIL 2011 pg 41
its effect on crops. The variability in the production of biofuels is tied to the seasons for growing
and harvesting the underlying feedstock, such as corn and sugarcane, and this variability is highly
predictable. The development of cellulosic technologies will enhance the diversity of feedstock to
produce biofuels and will help to smooth the availability of biofuel inputs. Biofuels are storable
which increases their certainty.
Unconventional Oil – The oil sands have low variability with most projects having the ability to
maintain or increase production levels over their very long lifetimes. However, these facilities have
shown themselves to be vulnerable to unscheduled maintenance and shut-downs due to fire or other
emergencies. Like biofuels, oil is storable so this makes the resource more certain.
Resource Versatility / Useful By-Products
Versatility and useful by-products is an assessment of the resource to satisfy demands of different energy uses
and other applications.
Natural Gas – In addition to heating and electrical generation purposes, natural gas is used for
making plastics (polyethylene). For transportation purposes, it is a source of propane and can be
compressed (CNG) or converted to liquids in a GTL process and used in conventional reciprocating
engines.
Oil – Oil generated from the conventional and unconventional sources, is used for more than just a
combustible fuel source, but also serves as the primary ingredient in plastics, fabrics and other
materials. As a comparison, alternatives often replace only the combustible component of oil, but
may not provide any useful by-products.
Coal – Coal is used as a thermal energy source, for electricity generation, but is also used to create
coke, a primary input to manufacture steel. Coal has significant limitations as a transportation fuel.
Biofuels – Ethanol and biodiesel have the potential to be used as the primary ingredient in fuel,
plastics, fabrics and other materials. However, this versatility is dependent on the larger-scale
development of bio-refineries to create end-use products from the feedstock.
Solar PV and Wind Power – These energy sources can only be used to generate electricity; no other
side products are created.
Storability and Transport
Storability is a measure of the ability of the resource to be stored for a considerable period of time without loss
or degradation in its usability. The ability to store energy is particularly useful when there are fluctuations in
energy consumption.
Oil – Crude oil can be stored for long periods of time without loss or degradation in its usability.
One of the greatest benefits of oil is that it is relatively stable and can be transported by pipeline,
ship, truck and rail. As an indication on how transportable it is, it could even be carried in a pail, if
required.
Coal – Coal is probably the most storable form of energy, but not as easy to transport as oil and
biofuels. For this reason, coal electrical plants are usually built where the coal exists and the power
is then transmitted to the end-user.
Biofuels – Similar to crude oil, biofuels have a good measure of storability. However, potential
corrosion challenges and the fact that ethanol absorbs water mean that biofuels tend to be shipped
by truck, rail and ship as opposed to pipelines. This has cost implications for countries that might
otherwise have the potential to be biofuel exporters.
Natural Gas – Natural gas can be stored in underground facilities such as depleted oil and gas
reservoirs, aquifers or salt caverns. The benefit of these storage facilities is that they improve the
security of gas supply and increase price stability when there are seasonal fluctuations in demand.
Oil sands have shown
themselves to be vulnerable to
unscheduled maintenance and
shut-downs due to fire.
Solar and Wind Power can only
be used for electricity; no other
side products are created.
Coal is the most storable form
of energy, but not as easy to
transport.

The Energy Reality
The Energy Reality APRIL 2011 pg 42
This is a much more limiting form of storage than for oil or biofuel as it depends on geology of the
area, whereas oil storage tanks can be built almost anywhere.
Electricity (Conventional & Renewable) – One of the greatest challenges faced by grid operators
and electricity producers is the lack of practical and widely available utility-scale solutions to store
electricity (other than the “stored” water behind a hydro dam). When electricity is produced it
needs to be used the moment it is generated. Significant progress and cost reductions in electricity
storage technologies could be the solution to address the intermittent nature of many alternative
electricity resources. These developments would also reduce the need to build excess capacity in
electrical grids to ensure adequate supply during spikes or peaks in consumption.
Electrical Transmission and Infrastructure
Electrical transmission and infrastructure is a consideration of the construction, installation and maintenance
costs for expanding and adjusting an energy system‟s infrastructure in order to collect and distribute energy
from the primary resource. Transmission from where the electricity is generated to where it is used is a cost
issue due to the capital required to build transmission lines and the power losses incurred during delivery.
Many renewable energy resources, including wind and solar power, will face geographic restrictions as to
where they can be built and operated in the most economical manner. The resulting energy will then need to
be transported to large population centres. This point can be illustrated graphically by examining the
availability of several resources in the United States as shown in Figures 28, 29 and 30.
Figure 28. U.S. Solar PV Resource
Sources: National Renewable Energy Laboratory (NREL)
The S.W. United States is best
suited for solar power.
Electricity needs to be used the
moment it is generated.

The Energy Reality
The Energy Reality APRIL 2011 pg 43
Figure 29. U.S. Geothermal Resource
Sources: NREL
Figure 30. U.S. Wind Resource
Sources: NREL
The best geothermal areas of
the United States are located in
the West.
The central United States has
the most potential for onshore
wind power.

The Energy Reality
The Energy Reality APRIL 2011 pg 44
Batteries – the “Gas Tank” for Electrical Transportation
Storage of electricity is problematic for transportation purposes when compared with oil-based fuels such as
diesel and gasoline because it is not easy to store. Batteries are required, which are heavy, expensive,
consume non-renewable resources, and require disposal at the end of their life, take a long time to recharge
and have limited capacity. Traditional hydrocarbon fuels can be contained, transported and transferred from
one location to another with minimal difficulty and there is an established infrastructure of refuelling stations
throughout the world. There are significant limitations to the use of electricity for the purpose of
transportation because of this storage problem.
To put this in context, think of a gas tank in a car, which is technologically very simple, can be manufactured
for a reasonable cost and is very light. To stress the simplicity of storing gasoline, diesel, or biofuels, they
could even be placed in a pail and used directly from this container (but admittedly not very safely). This tank
can be filled with an amount of fuel that can transport an average North American car for 600 to 800
kilometres and can then be refilled in a matter of minutes to travel that distance again.
Now compare this with a battery-operated car where the cost of construction of the battery is very high and
current technology allows these vehicles to travel only 100 to 200 kilometres on one charge and take several
hours to recharge.
The Myth of “Emissions Free” Electric Cars
Electric cars are not, and never will be, “emissions free.” Assuming that electric cars are distributed widely
throughout the United States, 51.2% of these cars will actually run on coal (the amount of coal-fired
electricity, measured on a BTU input basis). Similarly, 44% of global electrical power is generated from coal,
so assuming widespread use of electric cars approximately 44% of them will be running on coal-generated
electricity. The technology of electric cars is actually allowing cars to run on coal. It is a stretch to claim
“electric cars are leading a green revolution” when half of them will be powered by coal, the most emissions-
intensive hydrocarbon.
The fact that electric cars will not be consuming gasoline is only beneficial if the electricity is being sourced
by nuclear, wind, solar or hydro. If the electricity is being generated by coal, the planet is worse off than if a
conventional automobile were used.
There are significant limitations
to the use of electricity for the
purpose of transportation.
Approximately 51% of electric
cars will actually run on coal.
The Energy Reality
The Energy Reality APRIL 2011 pg 45
Socio-Economic Impact
Many of the debates about using different energy alternatives derive from socio-economic impacts. The
impacts can be difficult to quantify for comparison purposes but are important none-the-less, and are
categorized below:
Sustainability/Renewability
Sustainability is a measure of the ability to reliably develop resources to meet the needs of humanity in the
short term and for future generations.
Biofuels – The sustainability of certain first generation biofuels is questionable if volumes were to
increase to more significant percentages of global production levels, given the constraints of
available arable land.
Biomass – Energy systems based on biomass feedstocks are only as renewable as the policies which
guide the harvesting of feedstocks, particularly those feedstocks that do not grow quickly.
Coal – Although not a renewable resource, the significant level of coal reserves in many countries is
a primary driver for its use in electricity generation. For example, according to the ERCB, Alberta
has established reserves of 33.4 billion tonnes, which represents over 1,000 years of supply at
current Alberta production levels.
Energy Security
Energy security is a measure of the ability of a country to provide a secure and stable energy system that isn‟t
dependant on resources imported from other countries or regions of the world.
Oil – The dominance of global oil production by OPEC member nations and other state-controlled
oil companies, are reasons that energy security and independence dominates many discussions of
energy development. The current events in Libya highlight this concern.
Coal – The fact that significant coal reserves exist in over 70 countries reduces the chance for
OPEC-type control.
Natural Gas – The better geopolitical distribution of natural gas reserves, particularly shale gas,
positions this resource as a short and medium-term option to reducing many countries‟ dependence
on imported crude oil.
Wind / Solar – The relatively universal nature of wind and solar resource means that it can serve to
meet the energy security needs of many countries. It is important to note that the quality of the
wind resource will vary dramatically within each country.
Expertise and Jobs
Expertise and jobs are the measure of a country`s ability to provide jobs to its citizens and develop expertise
from the development of a primary resource. An evaluation of energy resources also needs to consider if a
country possesses the requisite knowledge, skill set and general know-how to leverage the full potential of a
particular energy resource. Even with the scientific know how in place, countries need to determine if they
have the sufficient resources (people and capital) to undertake efficient development.
The significant level of coal
reserves in many countries is a
primary driver for its use in
electricity generation.
The fact that large coal reserves
exist in over 70 countries
eliminates the chance for
OPEC-type control.
The Energy Reality
The Energy Reality APRIL 2011 pg 46
Environmental Impacts – Water Use
Water usage is the measure of the amount of water used in the energy process across all parts of an energy
system. Water plays a critical role in many conventional and alternative energies, and is used for several
purposes including: 1) the production of a fuel/feedstock; 2) the generation of electricity via steam; and 3) the
transfer of heat via a wet cooling process.
Oil and Natural Gas – Water is used as an input for drilling and fracturing processes, and can
reduce the quantities of groundwater and/or surface water available for other purposes.
Additionally, water is produced as an output from exploration and development wells and can be
saline or contain other contaminants, which can impact the quality of groundwater and surface
water.
Oil Sands – The mining and in-situ processes for oil sands require significant amounts of water for
the separation of the bitumen from the sand reservoir. In mining projects, the associated tailings
ponds can impact the quality of ground and surface water.
Biodiesel and Ethanol – Water is used in the processes of growing the feedstock crops; the water
footprint of biofuels is particularly large when the cropland requires irrigation.
Coal and Nuclear – The mining process for coal and uranium can produce significant amounts of
water; the resulting tailings can impact the quality of groundwater and surface water. The electrical
generation process also requires significant amounts of water as part of a cooling process.
Hydro – The magnitude of hydropower production varies directly with the amount of water
available, therefore larger reservoirs can displace more hydrocarbons. Unfortunately, these large
reservoirs can lose large quantities of water due to evaporation.
Biomass and Geothermal – Both of these electrical generation processes require water in cooling
processes. Biomass electrical plants can also require additional water if irrigation is required for the
biomass feedstock.
Solar Thermal – Solar thermal plants require water in order to convert solar energy into steam used
to generate electricity.
Figure 31 shows the results of our research, with surprisingly-high volumes of water use for the biofuels
related to production of feedstock crops – note that the scale in the figure is logarithmic. The various
hydrocarbon sources of energy use up to 20 barrels of water per boe-energy while the biofuels use thousands
of barrels of water per boe-energy. Even hydroelectricity is higher than the hydrocarbon sources, due to
evaporation from the lakes behind the dams.
In this analysis we do not include any component of recycling in any of the energy sources. For instance the
oil sands can use up to 18 barrels per boe-energy, but this does not include the effect of the 75 to 90%
recycling of water at the plants, which would reduce the water requirements to 1.8 to 4.5 barrels per boe-
energy. Also, in-situ projects mostly use non-potable water, but we do not give any credit for this either.
Similarly, how is the evaporation of water from a hydro project treated? The water will return to the earth
through rainfall, but it is removed from the particular watershed where the dam was built.
Clearly, this is a very complex subject and there are many issues related to water that need to be addressed.
These include what should be considered a “use”, what uses are a concern for human consumption, what are
the environmental impacts and where might water be preserved or recycled.
Biofuels use thousands of
barrels of water per boe-energy.
Hydrocarbon sources of energy
use up to 20 barrels of water per
boe-energy.
In this analysis, we include all
uses of water including non-
potable, and give no credit for
recycling.
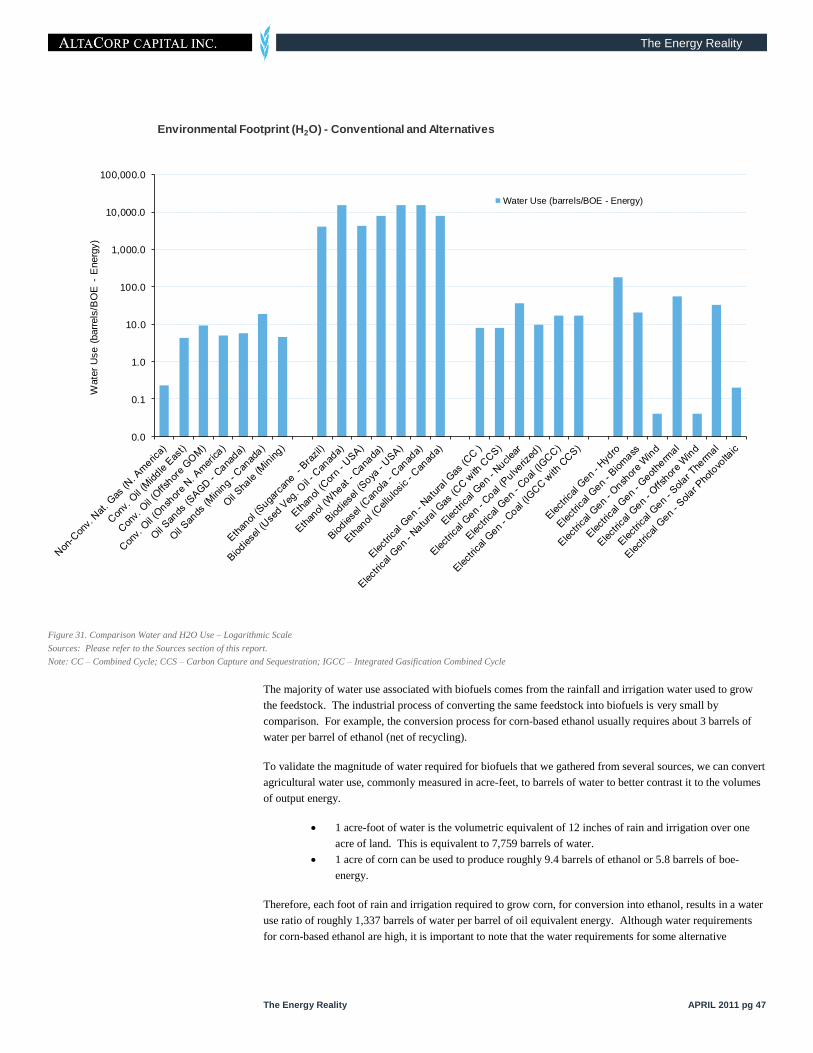
The Energy Reality
The Energy Reality APRIL 2011 pg 47
Figure 31. Comparison Water and H2O Use – Logarithmic Scale
Sources: Please refer to the Sources section of this report.
Note: CC – Combined Cycle; CCS – Carbon Capture and Sequestration; IGCC – Integrated Gasification Combined Cycle
The majority of water use associated with biofuels comes from the rainfall and irrigation water used to grow
the feedstock. The industrial process of converting the same feedstock into biofuels is very small by
comparison. For example, the conversion process for corn-based ethanol usually requires about 3 barrels of
water per barrel of ethanol (net of recycling).
To validate the magnitude of water required for biofuels that we gathered from several sources, we can convert
agricultural water use, commonly measured in acre-feet, to barrels of water to better contrast it to the volumes
of output energy.
1 acre-foot of water is the volumetric equivalent of 12 inches of rain and irrigation over one
acre of land. This is equivalent to 7,759 barrels of water.
1 acre of corn can be used to produce roughly 9.4 barrels of ethanol or 5.8 barrels of boe-
energy.
Therefore, each foot of rain and irrigation required to grow corn, for conversion into ethanol, results in a water
use ratio of roughly 1,337 barrels of water per barrel of oil equivalent energy. Although water requirements
for corn-based ethanol are high, it is important to note that the water requirements for some alternative
0.0
0.1
1.0
10.0
100.0
1,000.0
10,000.0
100,000.0
Wate
r U
se (
barr
els
/BO
E -
Energ
y)
Environmental Footprint (H2O) - Conventional and Alternatives
Water Use (barrels/BOE - Energy)

The Energy Reality
The Energy Reality APRIL 2011 pg 48
biofuels, such as soya-based biodiesel, can be even higher because more water is required to grow the
underlying feedstock.
Some will argue that rainfall, as it occurs naturally, shouldn‟t be counted as a contributor to water use for
biofuels. Others will counter with the view that the majority of that rainfall is necessary for the process of
growing feedstock and that same rainfall, if not diverted for agricultural purposes, would in large part
replenish natural water aquifers, rivers and lakes.
Figure 31 illustrates that water is a necessary ingredient in the production of most conventional and alternative
sources of energy. The water may be used in different ways and take different forms (fresh vs. saline, new vs.
recycled), which can make comparisons of usage challenging, but it is clear that without water most forms of
energy that power our modern society could simply not be produced.
Integrated System View - Summary
An integrated system approach to analyzing energy resources provides a sound context from which to compare
conventional and alternative energy sources. This broad perspective sheds a light on two problematic
characteristics of the energy debate:
1. Despite what many would argue, there is not a clear “winner” (or “loser” for that matter) in the
energy debate and that each form of energy has distinct advantages and disadvantages.
2. Many energy systems‟ problems, such as the need to reduce energy costs and environmental
impacts, are not associated with a specific resource but instead are shared by many. Attempts by
different industries to vilify each other can be described as “the pot calling the kettle black”.
We believe that to address these problems we need to refocus the energy debate towards shared solutions. The
development of new water recycling technologies can just as easily reduce the fresh water required for
synthetic crude from a mining oil sands project in Alberta as ethanol from a plant in Iowa. Advancements in
combined cycle heat engines can improve efficiencies in a coal power plant in the same manner as a
geothermal equivalent. Conventional and alternative energy technologies located at the same site could reduce
the need for additional infrastructure, lowering energy costs for everyone.
We need to refocus the
energy debate towards
shared solutions.
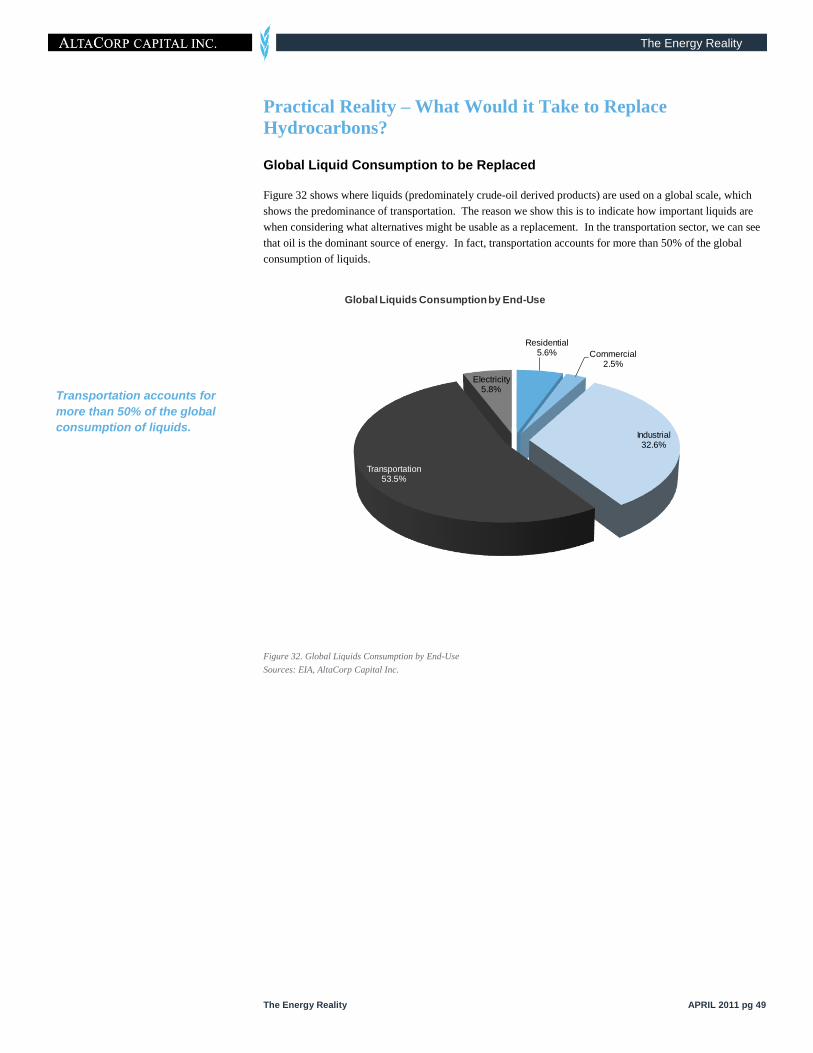
The Energy Reality
The Energy Reality APRIL 2011 pg 49
Practical Reality – What Would it Take to Replace
Hydrocarbons?
Global Liquid Consumption to be Replaced
Figure 32 shows where liquids (predominately crude-oil derived products) are used on a global scale, which
shows the predominance of transportation. The reason we show this is to indicate how important liquids are
when considering what alternatives might be usable as a replacement. In the transportation sector, we can see
that oil is the dominant source of energy. In fact, transportation accounts for more than 50% of the global
consumption of liquids.
Figure 32. Global Liquids Consumption by End-Use
Sources: EIA, AltaCorp Capital Inc.
Transportation accounts for
more than 50% of the global
consumption of liquids.
Residential5.6% Commercial
2.5%
Industrial32.6%
Transportation53.5%
Electricity5.8%
Global Liquids Consumption by End-Use
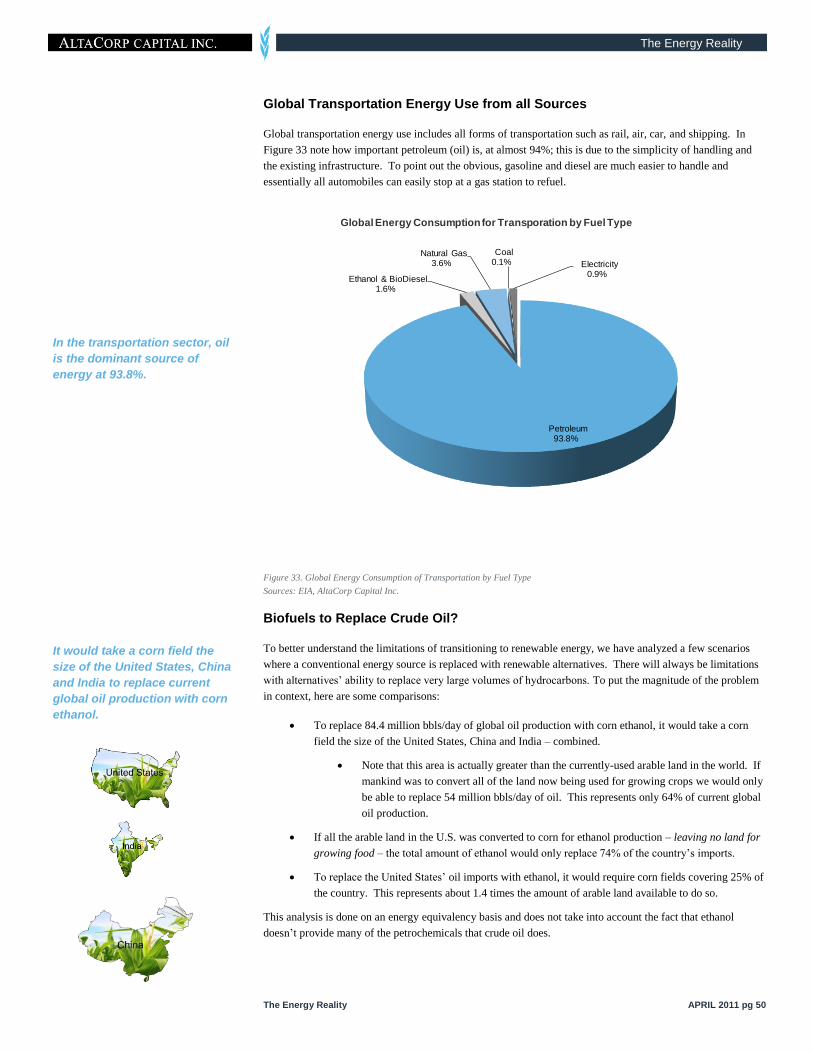
The Energy Reality
The Energy Reality APRIL 2011 pg 50
Global Transportation Energy Use from all Sources
Global transportation energy use includes all forms of transportation such as rail, air, car, and shipping. In
Figure 33 note how important petroleum (oil) is, at almost 94%; this is due to the simplicity of handling and
the existing infrastructure. To point out the obvious, gasoline and diesel are much easier to handle and
essentially all automobiles can easily stop at a gas station to refuel.
Figure 33. Global Energy Consumption of Transportation by Fuel Type
Sources: EIA, AltaCorp Capital Inc.
Biofuels to Replace Crude Oil?
To better understand the limitations of transitioning to renewable energy, we have analyzed a few scenarios
where a conventional energy source is replaced with renewable alternatives. There will always be limitations
with alternatives‟ ability to replace very large volumes of hydrocarbons. To put the magnitude of the problem
in context, here are some comparisons:
To replace 84.4 million bbls/day of global oil production with corn ethanol, it would take a corn
field the size of the United States, China and India – combined.
Note that this area is actually greater than the currently-used arable land in the world. If
mankind was to convert all of the land now being used for growing crops we would only
be able to replace 54 million bbls/day of oil. This represents only 64% of current global
oil production.
If all the arable land in the U.S. was converted to corn for ethanol production – leaving no land for
growing food – the total amount of ethanol would only replace 74% of the country‟s imports.
To replace the United States‟ oil imports with ethanol, it would require corn fields covering 25% of
the country. This represents about 1.4 times the amount of arable land available to do so.
This analysis is done on an energy equivalency basis and does not take into account the fact that ethanol
doesn‟t provide many of the petrochemicals that crude oil does.
In the transportation sector, oil
is the dominant source of
energy at 93.8%.
It would take a corn field the
size of the United States, China
and India to replace current
global oil production with corn
ethanol.
Petroleum93.8%
Ethanol & BioDiesel1.6%
Natural Gas3.6%
Coal0.1% Electricity
0.9%
Global Energy Consumption for Transporation by Fuel Type
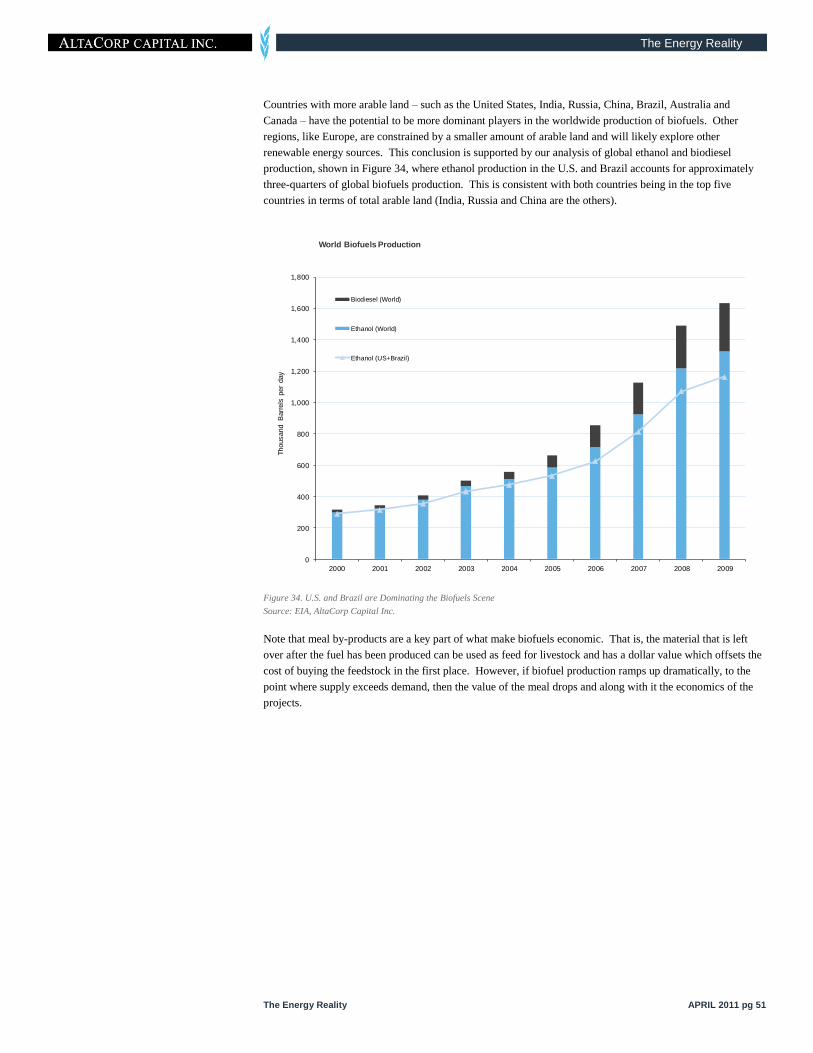
The Energy Reality
The Energy Reality APRIL 2011 pg 51
Countries with more arable land – such as the United States, India, Russia, China, Brazil, Australia and
Canada – have the potential to be more dominant players in the worldwide production of biofuels. Other
regions, like Europe, are constrained by a smaller amount of arable land and will likely explore other
renewable energy sources. This conclusion is supported by our analysis of global ethanol and biodiesel
production, shown in Figure 34, where ethanol production in the U.S. and Brazil accounts for approximately
three-quarters of global biofuels production. This is consistent with both countries being in the top five
countries in terms of total arable land (India, Russia and China are the others).
Figure 34. U.S. and Brazil are Dominating the Biofuels Scene
Source: EIA, AltaCorp Capital Inc.
Note that meal by-products are a key part of what make biofuels economic. That is, the material that is left
over after the fuel has been produced can be used as feed for livestock and has a dollar value which offsets the
cost of buying the feedstock in the first place. However, if biofuel production ramps up dramatically, to the
point where supply exceeds demand, then the value of the meal drops and along with it the economics of the
projects.
0
200
400
600
800
1,000
1,200
1,400
1,600
1,800
2000 2001 2002 2003 2004 2005 2006 2007 2008 2009
Thousand B
arr
els
per
day
World Biofuels Production
Biodiesel (World)
Ethanol (World)
Ethanol (US+Brazil)

The Energy Reality
The Energy Reality APRIL 2011 pg 52
Other Sources of Ethanol – Switchgrass and Cellulosic
Switchgrass is a perennial plant that does not need to be replanted every year (meaning potential cost savings
for farmers of this crop) but still takes up arable land – land that could be used for food crops. It is often
argued that switchgrass can be grown on more marginal lands that aren‟t suitable for food production, but
yields will be lower. The corresponding factor is that a more conservative estimate of switchgrass yields is
warranted in this case because they will be grown in those marginal areas where the soil conditions and
amount of rainfall aren‟t as conducive to growing crops as prime arable land.
Cellulosic technology is not commercially viable, but there is a great deal of research going into this process to
make it economically attractive. This technology creates ethanol using non-food feedstocks such as wood,
wheat straw, corn stalks and biomass waste. However, the process involves more expensive processes that
involve either a biochemical or thermochemical conversion to breakdown the feedstocks. There are good
reasons to research this technology as it has many advantages including:
Cheaper Feedstock – The feedstock is normally a waste product, making it inexpensive.
More Diverse Feedstock – Various technologies are designed to take advantage of different
feedstocks, depending on what is available in the area.
No Competition for Food – The feedstocks are usually parts of plants that are not edible, or other
non-food waste. The moral debate associated with food based ethanol is not an issue with
cellulosic.
The moral debate associated
with food based ethanol is not
an issue with cellulosic.

The Energy Reality
The Energy Reality APRIL 2011 pg 53
The Ethics of Biofuels
This is the “food for fuel” issue. The pivotal question in this debate is “should food crops, or land otherwise
dedicated to food crops, be used for the production of transportation fuels?” The answer for many is a
definitive “no”, especially when the world is facing another food crisis. Using food crops for fuel will only
further increase the price of corn, wheat and other biofuel feedstocks, and push more low-income families into
poverty. Given the magnitude of the problem, we suggest limiting the use of biofuels because they are taxing
an already over-burdened global food system.
How significant is the amount of food-based feedstocks used for ethanol production in the United States? Our
analysis has shown surprising results: 149 million people could be fed for a year with the amount of corn that
is annually used to create ethanol in the U.S. That is not a mistake or a misprint, 149,000,000 people globally
could be sustained every year with the 38.7 million tonnes of corn annually grown in the U.S. to produce
ethanol for blending with gasoline through government incentives and mandates. We suggested the adjective
“surprising” but the strongest words about this issue have been used by Jean Ziegler, Chair of the United
Nations Human Rights Council‟s Advisory Committee who stated:
“So it is a crime against humanity – it’s a crime against humanity to convert agricultural
productive soil into soil…which will be burned into biofuels”
Jean Zeigler, October 26, 2007
Food for Fuel – the Math
We can put the scale of U.S. corn production for ethanol into perspective by examining the caloric equivalent
of the corn and comparing that to the number of Calories required for sustaining an individual. Our
methodology is outlined in the following steps and these calculations are also summarized in Figure 35,
including the sources of data.
Step 1 – How much U.S. produced corn is used for Ethanol production?
According to the USDA in 2009, the U.S. produced 13,110 million bushels of corn, of which
4,568 million bushels was used for ethanol. This amount of corn by weight is 115.1 billion
kilograms.
Step 2 – How many Calories in this Corn?
According to the Food and Agriculture Organization of the United Nations (FAO), the global
corn used for food in 2007 averaged 3,020 Calories per kilogram (we used this conservative
number instead of the USDA‟s own Nutrient Database where 1 kilogram of corn contains
approximately 3,650 Calories).
Therefore, the 4,568 million bushels of corn used for ethanol has a caloric equivalent of 350
trillion Calories.
Step 3 – How Much Food Corn Could be Grown in Place of Industrial (Ethanol) Corn?
In the interest of keeping a conservative estimate of people that could be fed, we have assumed
that yields of food-based corn are one-third of that of the industrial corn. This is based on a
review of global corn yields published by the FAO, where corn yields in most countries range
between one-half to one-third of the U.S. industrial corn.
Therefore, the food corn grown in place of industrial (ethanol) corn would have a caloric
equivalent of 117 trillion Calories.
Step 4 – What is the Recommended Caloric Intake of an Average Person?
According the USDA, the estimated caloric needs for people vary by age, gender and physical
activity, and range from 1,000 to 3,200 Calories per Day. We have selected an average of 2,000
Calories per day based on this data.
149 million people could be
fed with the corn used to
create ethanol in the U.S.
The corn used for ethanol in
the U.S. has a caloric
equivalent of 350 trillion
Calories.
We have assumed that
yields of food-based corn
are one-third of that of the
industrial corn.

The Energy Reality
The Energy Reality APRIL 2011 pg 54
To account for the difference between food production and consumption (due to spoilage &
waste), we increased this amount by 8% (double the global estimated waste for corn (maize)
published by the FAO).
Therefore, the average person should consume 788,400 Calories per year.
Step 5 – How Many People Could be Fed With This Corn?
To calculate this number we simply divided the Calories in the corn by the caloric requirements
of our average person with the result being 149 million people.
Figure 35. U.S. Corn Production and Caloric Equivalent
To put this in context, we did the following calculation. If a 100,000 bbls/d oil sands mining project were
brought on stream for the sole purpose of replacing ethanol production, the corn otherwise used for this fuel
could feed 34 million people on an ongoing basis. Even though many in the U.S. do not want Canada‟s “dirty
oil”, we suggest it may be a contribution to humanity if it were used to displace ethanol production.
Frankly, a better option for the United States might be to reduce energy consumption and use these savings to
limit ethanol production. If the country dropped its oil consumption from all sources by only 1% and this
reduction was used to offset ethanol production, the feedstock land could feed 64 million people every year
and continually.
U.S. Corn Production and Caloric Equivalent
Step Calculation Total Source(s)
1 U.S. Corn Production Used for Fuel Ethanol 4,568 Million Bushels / Year USDA Quick Stats and Feed Grains Databases
2Caloric Equivalent of U.S. Corn = 4,568 million bushels x
56 lbs/bushel x 0.45 kg/lb x 3020 Calories/kg 350 Trillion Calories / Year
FAO Food Balance Sheets Database; USDA National
Nutrient Database for Standard Reference Database
3Caloric Equivalent of U.S. Corn (Food Corn
Replacement) = 350 Trillion Calories (per year) x 1/3 117 Trillion Calories FAO Crop Production Database
4Caloric Requirements per Person = 2000 Calories per
capita/day x 108% (spoilage/w aste) x 365 days/year 788,400 Calories per Capita / Year
FAO Commodity Balances Database; USDA Dietary
Guidelines 2010 Policy Document
5Number of People that Could be Fed = 117 Trillion
Calories ÷ 788,400 Calories per capita149 Million People
If a 100,000 bbls/d oil sands
mining project were brought on
stream to replace corn ethanol
production, the feedstock land
could feed 34 million people.
If the U.S. dropped its oil
consumption by only 1% and
this was used to offset ethanol,
the feedstock land could feed
64 million people.
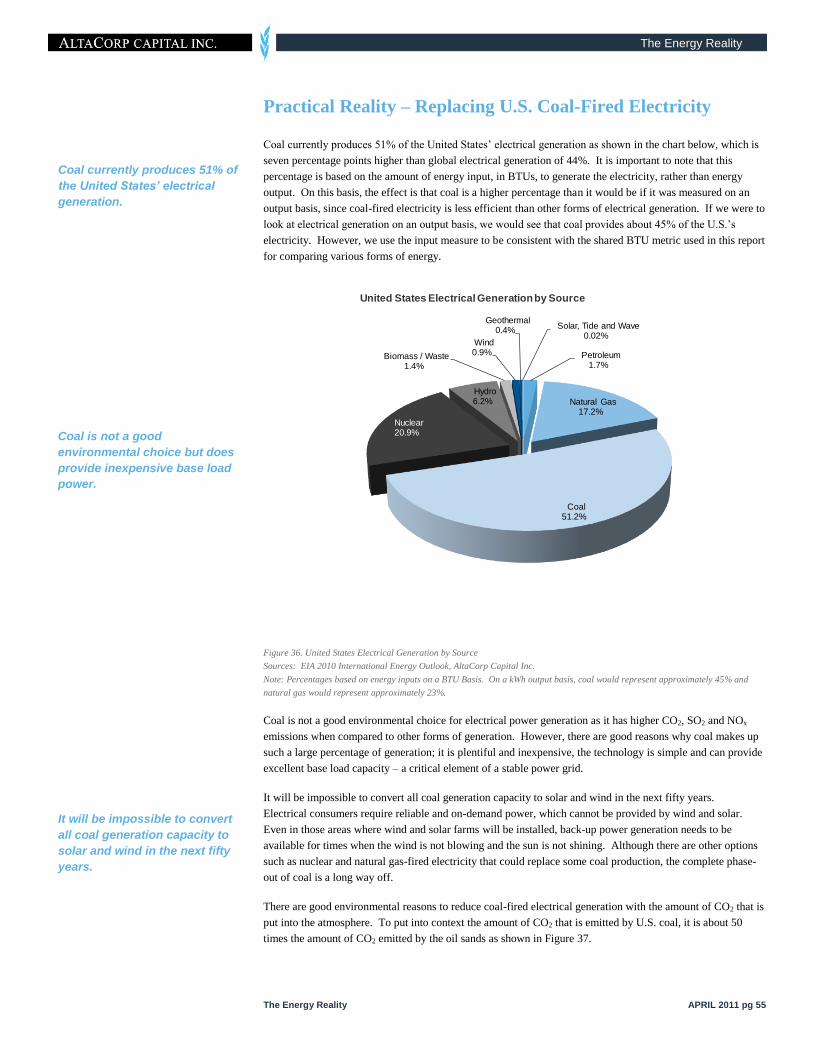
The Energy Reality
The Energy Reality APRIL 2011 pg 55
Practical Reality – Replacing U.S. Coal-Fired Electricity
Coal currently produces 51% of the United States‟ electrical generation as shown in the chart below, which is
seven percentage points higher than global electrical generation of 44%. It is important to note that this
percentage is based on the amount of energy input, in BTUs, to generate the electricity, rather than energy
output. On this basis, the effect is that coal is a higher percentage than it would be if it was measured on an
output basis, since coal-fired electricity is less efficient than other forms of electrical generation. If we were to
look at electrical generation on an output basis, we would see that coal provides about 45% of the U.S.‟s
electricity. However, we use the input measure to be consistent with the shared BTU metric used in this report
for comparing various forms of energy.
Figure 36. United States Electrical Generation by Source
Sources: EIA 2010 International Energy Outlook, AltaCorp Capital Inc.
Note: Percentages based on energy inputs on a BTU Basis. On a kWh output basis, coal would represent approximately 45% and
natural gas would represent approximately 23%.
Coal is not a good environmental choice for electrical power generation as it has higher CO2, SO2 and NOx
emissions when compared to other forms of generation. However, there are good reasons why coal makes up
such a large percentage of generation; it is plentiful and inexpensive, the technology is simple and can provide
excellent base load capacity – a critical element of a stable power grid.
It will be impossible to convert all coal generation capacity to solar and wind in the next fifty years.
Electrical consumers require reliable and on-demand power, which cannot be provided by wind and solar.
Even in those areas where wind and solar farms will be installed, back-up power generation needs to be
available for times when the wind is not blowing and the sun is not shining. Although there are other options
such as nuclear and natural gas-fired electricity that could replace some coal production, the complete phase-
out of coal is a long way off.
There are good environmental reasons to reduce coal-fired electrical generation with the amount of CO2 that is
put into the atmosphere. To put into context the amount of CO2 that is emitted by U.S. coal, it is about 50
times the amount of CO2 emitted by the oil sands as shown in Figure 37.
Coal currently produces 51% of
the United States’ electrical
generation.
It will be impossible to convert
all coal generation capacity to
solar and wind in the next fifty
years.
Petroleum1.7%
Natural Gas17.2%
Coal51.2%
Nuclear20.9%
Hydro6.2%
Biomass / Waste1.4%
Wind0.9%
Geothermal0.4%
Solar, Tide and Wave0.02%
United States Electrical Generation by Source
Coal is not a good
environmental choice but does
provide inexpensive base load
power.
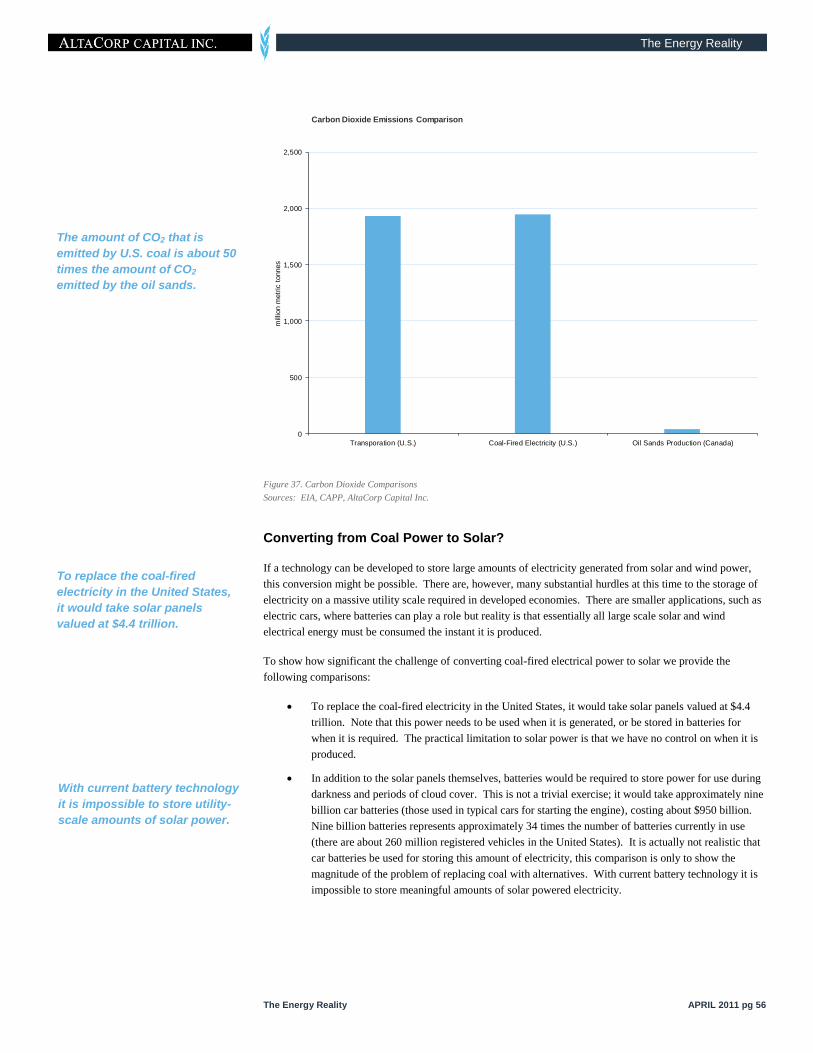
The Energy Reality
The Energy Reality APRIL 2011 pg 56
Figure 37. Carbon Dioxide Comparisons
Sources: EIA, CAPP, AltaCorp Capital Inc.
Converting from Coal Power to Solar?
If a technology can be developed to store large amounts of electricity generated from solar and wind power,
this conversion might be possible. There are, however, many substantial hurdles at this time to the storage of
electricity on a massive utility scale required in developed economies. There are smaller applications, such as
electric cars, where batteries can play a role but reality is that essentially all large scale solar and wind
electrical energy must be consumed the instant it is produced.
To show how significant the challenge of converting coal-fired electrical power to solar we provide the
following comparisons:
To replace the coal-fired electricity in the United States, it would take solar panels valued at $4.4
trillion. Note that this power needs to be used when it is generated, or be stored in batteries for
when it is required. The practical limitation to solar power is that we have no control on when it is
produced.
In addition to the solar panels themselves, batteries would be required to store power for use during
darkness and periods of cloud cover. This is not a trivial exercise; it would take approximately nine
billion car batteries (those used in typical cars for starting the engine), costing about $950 billion.
Nine billion batteries represents approximately 34 times the number of batteries currently in use
(there are about 260 million registered vehicles in the United States). It is actually not realistic that
car batteries be used for storing this amount of electricity, this comparison is only to show the
magnitude of the problem of replacing coal with alternatives. With current battery technology it is
impossible to store meaningful amounts of solar powered electricity.
0
500
1,000
1,500
2,000
2,500
Transporation (U.S.) Coal-Fired Electricity (U.S.) Oil Sands Production (Canada)
mill
ion m
etr
ic t
onnes
Carbon Dioxide Emissions Comparison
To replace the coal-fired
electricity in the United States,
it would take solar panels
valued at $4.4 trillion.
With current battery technology
it is impossible to store utility-
scale amounts of solar power.
The amount of CO2 that is
emitted by U.S. coal is about 50
times the amount of CO2
emitted by the oil sands.

The Energy Reality
The Energy Reality APRIL 2011 pg 57
Converting from Coal to Wind?
A similar challenge exists if trying to replace coal-fired electrical power with wind power. To put this in
context we provide the following comparisons:
To replace the coal-fired electricity in the United States, it would take 580 million residential-sized
wind turbines (1000 watt units), which would cost approximately $2.7 trillion.
Instead of residential-sized wind turbines, it would take 390,000 large wind turbines (1.5 MW
units), which would cost approximately $1.4 trillion. Note that these are at current prices, and if
there was a dramatic increase in the demand for wind turbines (without a corresponding drop in
construction costs per unit), the prices would increase, so the actual costs would be much higher.
Similar to solar power, some of the electricity generated from wind turbines would have to be stored
in batteries for use during periods of calm or low wind-velocity periods. Again, to use the car
battery as a measure it would take 7.5 billion of these batteries, which would cost almost $800
billion. This cost excludes any other infrastructure related to these batteries, including inverters
which modify the DC (direct current) from the batteries to AC (alternating current) for general
household use.
Converting from Coal to Oil Sands?
Although to some this may sound ironic or illogical, there would actually be a reduction in CO2 emissions per
BTU produced if coal-fired electrical plants were shut down and power plants fuelled by synthetic oil from oil
sands were built in their stead. Although there is a great deal of criticism of the oil sands as “dirty oil”, it is
less carbon-intensive than coal. It has been suggested that the United States should not import “dirty oil” from
Canada, but the U.S. would actually improve its environmental footprint if it imported more oil sands crude
and used this crude to offset coal-fired electrical generation. This, of course, will not happen because of the
higher cost of oil when compared to coal.
Converting Coal to Natural Gas Power?
This is probably the most realistic option for the United States. Natural gas is plentiful with new extraction
technologies, therefore it is inexpensive and has much lower CO2 emissions than both coal and oil. With the
lower natural gas prices it makes more sense than ever to move away from “dirty coal."
To replace the coal-fired
electricity in the United States,
it would take 580 million
residential-sized wind turbines.
The U.S. would actually improve
its environmental footprint if it
imported more oil sands crude
and used this crude to offset
coal-fired electrical generation.
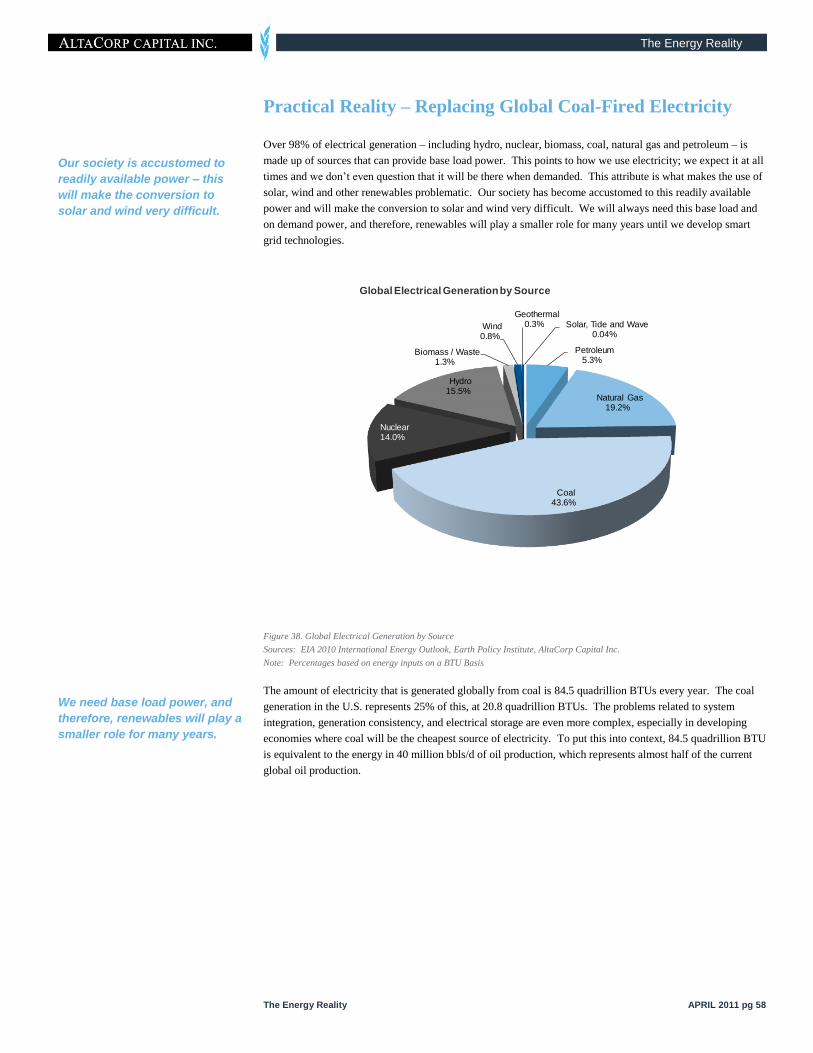
The Energy Reality
The Energy Reality APRIL 2011 pg 58
Practical Reality – Replacing Global Coal-Fired Electricity
Over 98% of electrical generation – including hydro, nuclear, biomass, coal, natural gas and petroleum – is
made up of sources that can provide base load power. This points to how we use electricity; we expect it at all
times and we don‟t even question that it will be there when demanded. This attribute is what makes the use of
solar, wind and other renewables problematic. Our society has become accustomed to this readily available
power and will make the conversion to solar and wind very difficult. We will always need this base load and
on demand power, and therefore, renewables will play a smaller role for many years until we develop smart
grid technologies.
Figure 38. Global Electrical Generation by Source
Sources: EIA 2010 International Energy Outlook, Earth Policy Institute, AltaCorp Capital Inc.
Note: Percentages based on energy inputs on a BTU Basis
The amount of electricity that is generated globally from coal is 84.5 quadrillion BTUs every year. The coal
generation in the U.S. represents 25% of this, at 20.8 quadrillion BTUs. The problems related to system
integration, generation consistency, and electrical storage are even more complex, especially in developing
economies where coal will be the cheapest source of electricity. To put this into context, 84.5 quadrillion BTU
is equivalent to the energy in 40 million bbls/d of oil production, which represents almost half of the current
global oil production.
Our society is accustomed to
readily available power – this
will make the conversion to
solar and wind very difficult.
Petroleum5.3%
Natural Gas19.2%
Coal43.6%
Nuclear14.0%
Hydro15.5%
Biomass / Waste1.3%
Wind0.8%
Geothermal0.3% Solar, Tide and Wave
0.04%
Global Electrical Generation by Source
We need base load power, and
therefore, renewables will play a
smaller role for many years.
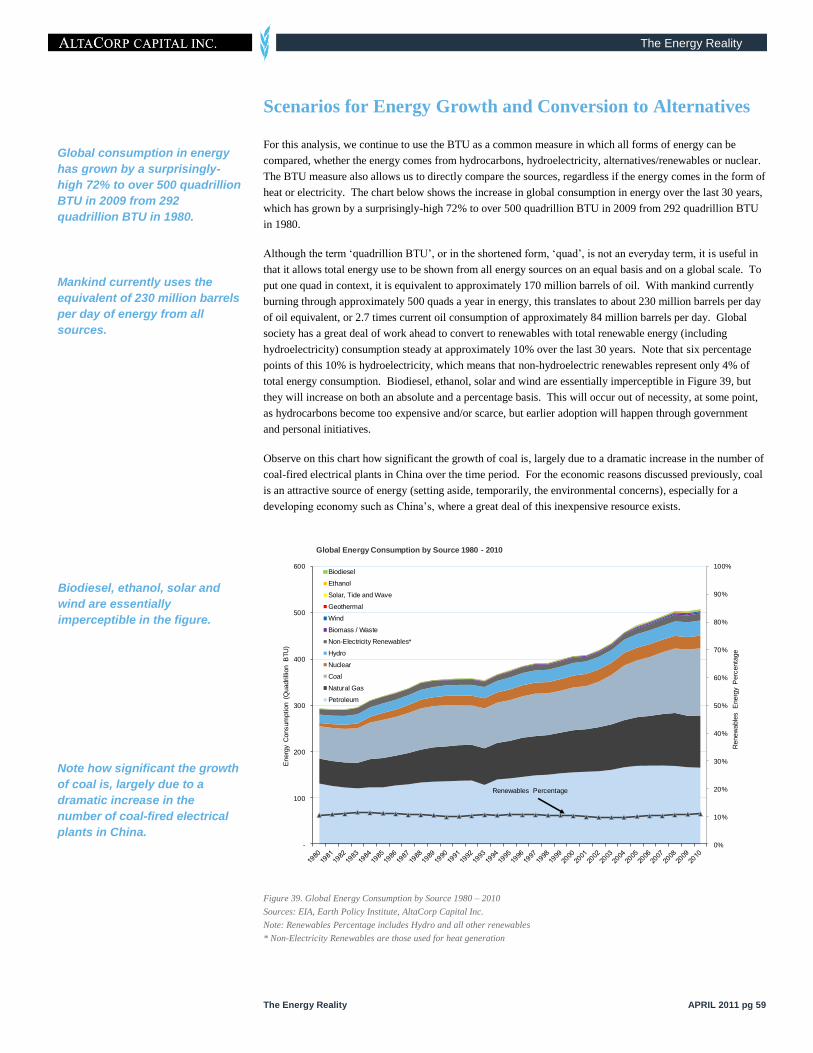
The Energy Reality
The Energy Reality APRIL 2011 pg 59
Scenarios for Energy Growth and Conversion to Alternatives
For this analysis, we continue to use the BTU as a common measure in which all forms of energy can be
compared, whether the energy comes from hydrocarbons, hydroelectricity, alternatives/renewables or nuclear.
The BTU measure also allows us to directly compare the sources, regardless if the energy comes in the form of
heat or electricity. The chart below shows the increase in global consumption in energy over the last 30 years,
which has grown by a surprisingly-high 72% to over 500 quadrillion BTU in 2009 from 292 quadrillion BTU
in 1980.
Although the term „quadrillion BTU‟, or in the shortened form, „quad‟, is not an everyday term, it is useful in
that it allows total energy use to be shown from all energy sources on an equal basis and on a global scale. To
put one quad in context, it is equivalent to approximately 170 million barrels of oil. With mankind currently
burning through approximately 500 quads a year in energy, this translates to about 230 million barrels per day
of oil equivalent, or 2.7 times current oil consumption of approximately 84 million barrels per day. Global
society has a great deal of work ahead to convert to renewables with total renewable energy (including
hydroelectricity) consumption steady at approximately 10% over the last 30 years. Note that six percentage
points of this 10% is hydroelectricity, which means that non-hydroelectric renewables represent only 4% of
total energy consumption. Biodiesel, ethanol, solar and wind are essentially imperceptible in Figure 39, but
they will increase on both an absolute and a percentage basis. This will occur out of necessity, at some point,
as hydrocarbons become too expensive and/or scarce, but earlier adoption will happen through government
and personal initiatives.
Observe on this chart how significant the growth of coal is, largely due to a dramatic increase in the number of
coal-fired electrical plants in China over the time period. For the economic reasons discussed previously, coal
is an attractive source of energy (setting aside, temporarily, the environmental concerns), especially for a
developing economy such as China‟s, where a great deal of this inexpensive resource exists.
Figure 39. Global Energy Consumption by Source 1980 – 2010
Sources: EIA, Earth Policy Institute, AltaCorp Capital Inc.
Note: Renewables Percentage includes Hydro and all other renewables
* Non-Electricity Renewables are those used for heat generation
0%
10%
20%
30%
40%
50%
60%
70%
80%
90%
100%
-
100
200
300
400
500
600
Renew
able
s E
nerg
y P
erc
enta
ge
Energ
y C
onsum
ption (
Quadrilli
on B
TU
)
Global Energy Consumption by Source 1980 - 2010
Biodiesel
Ethanol
Solar, Tide and Wave
Geothermal
Wind
Biomass / Waste
Non-Electricity Renewables*
Hydro
Nuclear
Coal
Natural Gas
Petroleum
Renewables Percentage
Global consumption in energy
has grown by a surprisingly-
high 72% to over 500 quadrillion
BTU in 2009 from 292
quadrillion BTU in 1980.
Note how significant the growth
of coal is, largely due to a
dramatic increase in the
number of coal-fired electrical
plants in China.
Mankind currently uses the
equivalent of 230 million barrels
per day of energy from all
sources.
Biodiesel, ethanol, solar and
wind are essentially
imperceptible in the figure.

The Energy Reality
The Energy Reality APRIL 2011 pg 60
Growth in Alternatives to 2050 – the Short Term
The next two Figures, 40 and 41, show the increase in global energy consumption to 2050 with an assumed
increase of 1.2% per year. Under this growth rate, energy consumption grows by almost 60% to over 816
quadrillion BTUs from approximately 502 quads in 2009. Although, this rate of growth is not unreasonable
(being in the range of other publically-available forecasts) the resulting absolute increase in consumption of
300 quads can arguably be described as “troubling.” Troubling in the sense that 314 quadrillion represents
approximately three times the current energy use of the United States. The ability of mankind to extract this
amount of energy from the earth over the next 40 years will be a monumental – if not impossible – task.
One of the main reasons we will have a hard time replacing hydrocarbons with alternatives is because our
demand for energy is growing so dramatically. The task of converting to alternatives is a classic case of one
step forward and two steps back. It will be very difficult to meet increased energy demand while at the same
time trying to convert to alternatives.
Figure 40 shows our base case, with a moderate adoption of alternatives and where renewables outpace overall
energy consumption with an increase to 20% of total energy consumption in 2050 from 11% in 2009. The
absolute amount of renewable energy increases to 161 quadrillion BTUs in 2050 from 55 quadrillion in 2009,
which represents a 193% increase in renewable energy. In this case we use differing growth rates depending
on the type of renewable energy:
Hydro (2.0%) – The largest component of renewable energy will continue to remain so over the
medium term, growing at a steady rate 2.0%, which is still large given its current contribution to
global energy production.
Biomass/Waste, Non-Electricity Renewables (2.6%) – We anticipate biomass/waste and non-
electricity renewables will grow at or near the overall renewable growth predicted by the EIA at
2.6%.
Geothermal (2.6% until 2030, then 3.0% until 2050) – We anticipate that improved development
techniques will lead to a bump in geothermal development in the medium term.
Wind, Ethanol and Biodiesel (8.0% until 2030, then 4.0% until 2050) – These renewable
technologies have exhibited the greatest growth recently and this will continue in the short term. As
the relative size of these renewable energies grow, however, the increase in market size as a year-
over-year percentage will start to diminish. Additionally, these technologies will begin to face a
variety of constraints (and opposition) as they achieve larger sizes, including arable land constraints
and ethical issues for ethanol/biodiesel, and infrastructure limitations for wind, solar, tide and wave.
Solar, Tide, Wave (8.0% until 2030, then 6.0% until 2050) – Similar to wind, ethanol and
biodiesel, these renewables have shown significant growth, but the year-over-year percentage will
start to diminish over time. They also will begin to face a variety of constraints (and opposition) as
they achieve larger sizes, including infrastructure limitations.
The increase in global demand
over the next 40 years
represents approximately three
times the current energy use of
the United States.
The task of converting to
alternatives is a classic case of
one step forward and two steps
back.
Wind, ethanol and biodiesel
have exhibited the greatest
growth recently and this will
continue.
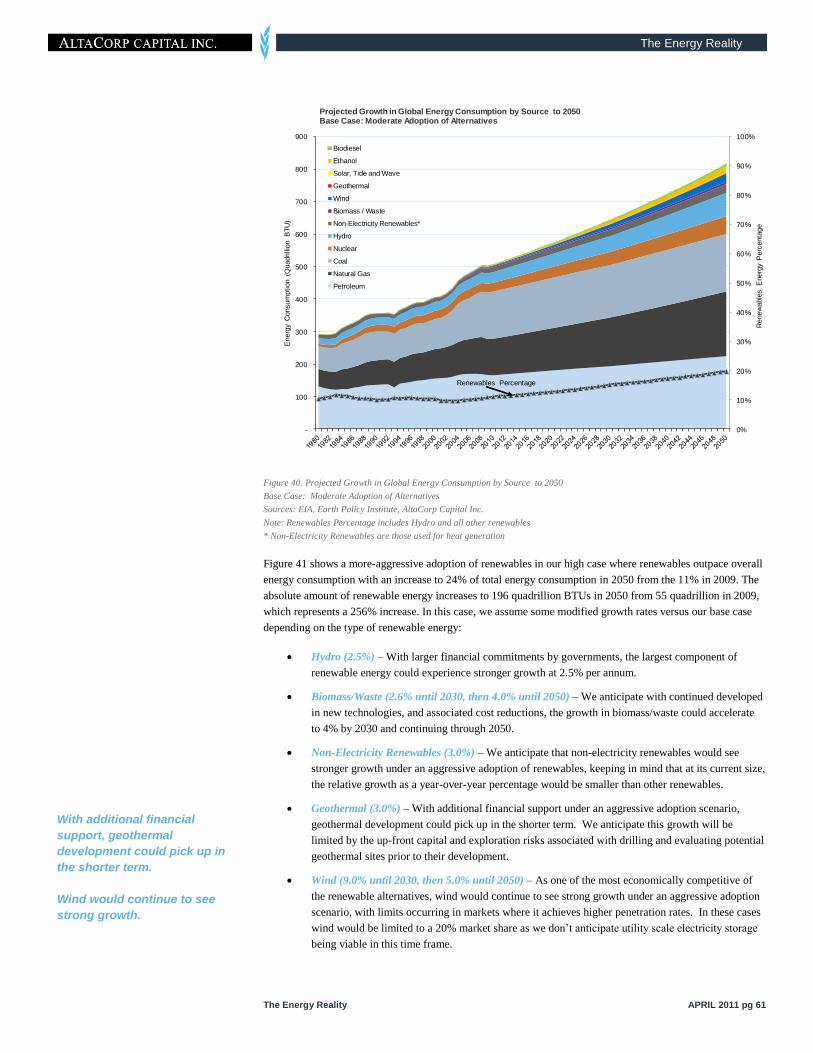
The Energy Reality
The Energy Reality APRIL 2011 pg 61
Figure 40. Projected Growth in Global Energy Consumption by Source to 2050
Base Case: Moderate Adoption of Alternatives
Sources: EIA, Earth Policy Institute, AltaCorp Capital Inc.
Note: Renewables Percentage includes Hydro and all other renewables
* Non-Electricity Renewables are those used for heat generation
Figure 41 shows a more-aggressive adoption of renewables in our high case where renewables outpace overall
energy consumption with an increase to 24% of total energy consumption in 2050 from the 11% in 2009. The
absolute amount of renewable energy increases to 196 quadrillion BTUs in 2050 from 55 quadrillion in 2009,
which represents a 256% increase. In this case, we assume some modified growth rates versus our base case
depending on the type of renewable energy:
Hydro (2.5%) – With larger financial commitments by governments, the largest component of
renewable energy could experience stronger growth at 2.5% per annum.
Biomass/Waste (2.6% until 2030, then 4.0% until 2050) – We anticipate with continued developed
in new technologies, and associated cost reductions, the growth in biomass/waste could accelerate
to 4% by 2030 and continuing through 2050.
Non-Electricity Renewables (3.0%) – We anticipate that non-electricity renewables would see
stronger growth under an aggressive adoption of renewables, keeping in mind that at its current size,
the relative growth as a year-over-year percentage would be smaller than other renewables.
Geothermal (3.0%) – With additional financial support under an aggressive adoption scenario,
geothermal development could pick up in the shorter term. We anticipate this growth will be
limited by the up-front capital and exploration risks associated with drilling and evaluating potential
geothermal sites prior to their development.
Wind (9.0% until 2030, then 5.0% until 2050) – As one of the most economically competitive of
the renewable alternatives, wind would continue to see strong growth under an aggressive adoption
scenario, with limits occurring in markets where it achieves higher penetration rates. In these cases
wind would be limited to a 20% market share as we don‟t anticipate utility scale electricity storage
being viable in this time frame.
0%
10%
20%
30%
40%
50%
60%
70%
80%
90%
100%
-
100
200
300
400
500
600
700
800
900
Renew
able
s E
nerg
y P
erc
enta
ge
Energ
y C
onsum
ption (
Quadrilli
on B
TU
)
Projected Growth in Global Energy Consumption by Source to 2050 Base Case: Moderate Adoption of Alternatives
Biodiesel
Ethanol
Solar, Tide and Wave
Geothermal
Wind
Biomass / Waste
Non-Electricity Renewables*
Hydro
Nuclear
Coal
Natural Gas
Petroleum
Renewables Percentage
With additional financial
support, geothermal
development could pick up in
the shorter term.
Wind would continue to see
strong growth.
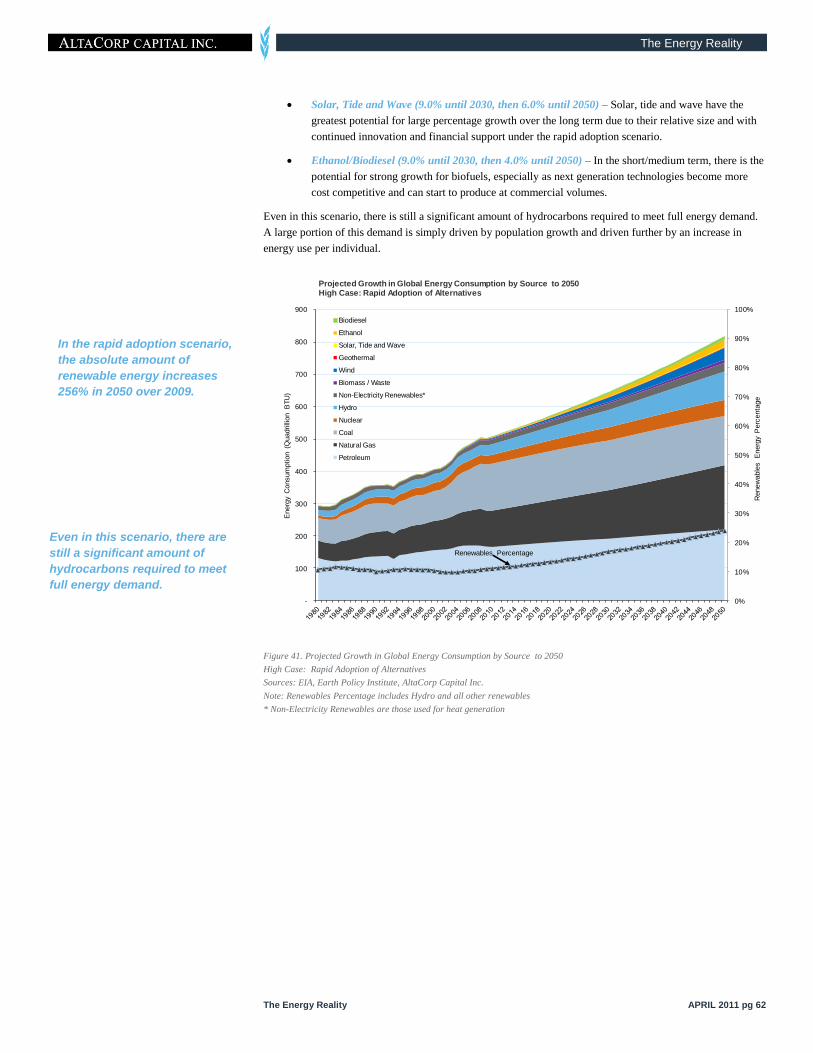
The Energy Reality
The Energy Reality APRIL 2011 pg 62
Solar, Tide and Wave (9.0% until 2030, then 6.0% until 2050) – Solar, tide and wave have the
greatest potential for large percentage growth over the long term due to their relative size and with
continued innovation and financial support under the rapid adoption scenario.
Ethanol/Biodiesel (9.0% until 2030, then 4.0% until 2050) – In the short/medium term, there is the
potential for strong growth for biofuels, especially as next generation technologies become more
cost competitive and can start to produce at commercial volumes.
Even in this scenario, there is still a significant amount of hydrocarbons required to meet full energy demand.
A large portion of this demand is simply driven by population growth and driven further by an increase in
energy use per individual.
Figure 41. Projected Growth in Global Energy Consumption by Source to 2050
High Case: Rapid Adoption of Alternatives
Sources: EIA, Earth Policy Institute, AltaCorp Capital Inc.
Note: Renewables Percentage includes Hydro and all other renewables
* Non-Electricity Renewables are those used for heat generation
0%
10%
20%
30%
40%
50%
60%
70%
80%
90%
100%
-
100
200
300
400
500
600
700
800
900
Renew
able
s E
nerg
y P
erc
enta
ge
Energ
y C
onsum
ption (
Quadrilli
on B
TU
)Projected Growth in Global Energy Consumption by Source to 2050 High Case: Rapid Adoption of Alternatives
Biodiesel
Ethanol
Solar, Tide and Wave
Geothermal
Wind
Biomass / Waste
Non-Electricity Renewables*
Hydro
Nuclear
Coal
Natural Gas
Petroleum
Renewables Percentage
In the rapid adoption scenario,
the absolute amount of
renewable energy increases
256% in 2050 over 2009.
Even in this scenario, there are
still a significant amount of
hydrocarbons required to meet
full energy demand.

The Energy Reality
The Energy Reality APRIL 2011 pg 63
Growth in Alternatives to 2100 – the Long Term
If we assume that growth in energy consumption continues at 1.2%, the total demand in 2100 will grow by
over 195% to 1,482 quadrillion BTUs from approximately 502 quadrillion in 2009. The absolute increase of
980 quadrillion BTUs over this time period represents over nine times the amount of energy currently
consumed in the United States. Little analysis is required to determine that this amount of energy generation is
not possible using current technologies; few would argue it could be achieved. Much is required:
Drop in consumption? Without question
Increase in alternatives? Absolutely
Increase in natural gas production? No doubt
More hydroelectricity? As much as possible
All sources of energy are required to meet growing demand; no single energy source can represent a “saviour”
for the ever-increasing demand for energy. The development of multiple energy sources, including
unconventional hydrocarbons and renewable energy sources, needs to be undertaken in combination with
programs to curb the global appetite for energy.
Moreover, the “elephant in the room” (the obvious issue that is not being acknowledged) is that there is a limit
to the number of people the Earth can support. Current global population is rapidly approaching 7 billion
individuals and could reach 10 billion in the next 40 to 60 years. Population growth is an unresolvable
problem, at least a problem that will not be resolved through government or personal intervention. The only
resolution will be through naturally-occurring events such as famine, disease or natural disasters. Having
shared that rather bleak observation, we resume our analysis.
Figure 42 shows our base case, with a moderate adoption rate of alternatives where renewables outpace overall
energy consumption with an increase to 32% of total energy consumption in 2100 from 11% in 2009. The
absolute amount of renewables increases to 468 quadrillion BTUs in 2100 from 55 quads in 2009, which
represents a 751% increase in renewable energy. In this case we assume differing growth rates for the period
from 2050-2100 depending on the type of renewable energy, acknowledging that predictions over this longer-
term time frame will be increasingly unreliable and depend on a large number of factors which are difficult to
predict:
Hydro (1.0% 2050-2100) – Over time, the number of large water sources that could be developed
for hydro power will become limited, and growth, although still large on an absolute basis, will fall
on a year-over-year-percentage.
Biomass/Waste, Non-Electricity Renewables (2.6% 2050-2100) – We anticipate that biomass/waste
and non-electricity renewables could continue to grow at a reasonable rate over the longer-term.
Geothermal (3.0% 2050-2100) – Growth over the long-term would continue to be strong, although
still mitigated by exploratory risks that would constrain the amount of capital allocated towards
geothermal vs. other alternatives.
Wind (3.0% 2050-2100) – With a large global resource base, growth in wind power would continue,
but diminish on a percentage basis as the relative size of wind power increases and the market
matures (keeping in mind that the highest quality wind power sites will likely be developed in the
first half of the century).
Solar, Tide and Wave (6.0% 2050-2100) – Towards the latter half of the century, given
technological advancements and cost reductions, solar, tide and wave power would see some of the
highest growth rates of all renewables.
Ethanol and Biodiesel (3.0% 2050-2100) – Arable land constraints will cut-off the development of
most first generation biofuels by this time, allowing next generation technologies (e.g. cellulosic,
algae-based fuels) to take over as the drivers of growth in biofuel production.
The increase represents over
nine times the amount of
energy currently consumed in
the United States.
The development of multiple
energy sources need to be
undertaken in combination with
conservation.
Growth in wind power would
continue, but diminish on a
percentage basis as the relative
size of wind power increases.
Solar, tide and wave power
would see some of the highest
growth rates of all renewables.
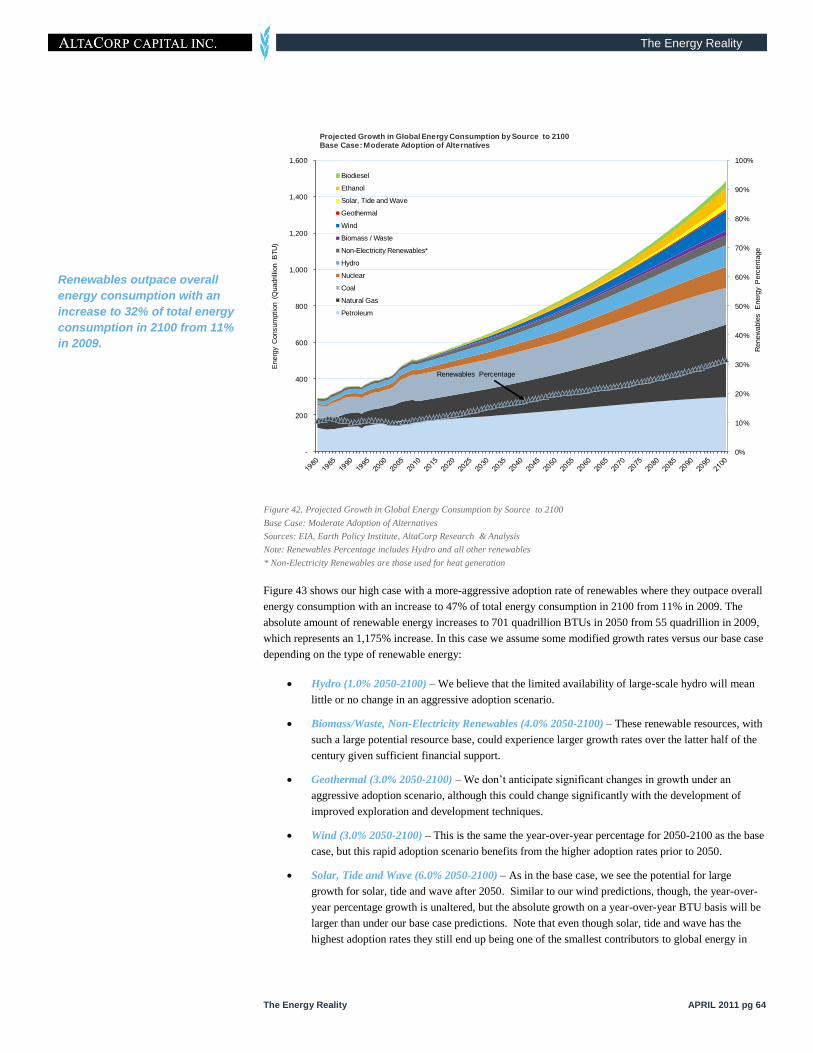
The Energy Reality
The Energy Reality APRIL 2011 pg 64
Figure 42. Projected Growth in Global Energy Consumption by Source to 2100
Base Case: Moderate Adoption of Alternatives
Sources: EIA, Earth Policy Institute, AltaCorp Research & Analysis
Note: Renewables Percentage includes Hydro and all other renewables
* Non-Electricity Renewables are those used for heat generation
Figure 43 shows our high case with a more-aggressive adoption rate of renewables where they outpace overall
energy consumption with an increase to 47% of total energy consumption in 2100 from 11% in 2009. The
absolute amount of renewable energy increases to 701 quadrillion BTUs in 2050 from 55 quadrillion in 2009,
which represents an 1,175% increase. In this case we assume some modified growth rates versus our base case
depending on the type of renewable energy:
Hydro (1.0% 2050-2100) – We believe that the limited availability of large-scale hydro will mean
little or no change in an aggressive adoption scenario.
Biomass/Waste, Non-Electricity Renewables (4.0% 2050-2100) – These renewable resources, with
such a large potential resource base, could experience larger growth rates over the latter half of the
century given sufficient financial support.
Geothermal (3.0% 2050-2100) – We don‟t anticipate significant changes in growth under an
aggressive adoption scenario, although this could change significantly with the development of
improved exploration and development techniques.
Wind (3.0% 2050-2100) – This is the same the year-over-year percentage for 2050-2100 as the base
case, but this rapid adoption scenario benefits from the higher adoption rates prior to 2050.
Solar, Tide and Wave (6.0% 2050-2100) – As in the base case, we see the potential for large
growth for solar, tide and wave after 2050. Similar to our wind predictions, though, the year-over-
year percentage growth is unaltered, but the absolute growth on a year-over-year BTU basis will be
larger than under our base case predictions. Note that even though solar, tide and wave has the
highest adoption rates they still end up being one of the smallest contributors to global energy in
0%
10%
20%
30%
40%
50%
60%
70%
80%
90%
100%
-
200
400
600
800
1,000
1,200
1,400
1,600
Renew
able
s E
nerg
y P
erc
enta
ge
Energ
y C
onsum
ption (
Quadrilli
on B
TU
)
Projected Growth in Global Energy Consumption by Source to 2100 Base Case: Moderate Adoption of Alternatives
Biodiesel
Ethanol
Solar, Tide and Wave
Geothermal
Wind
Biomass / Waste
Non-Electricity Renewables*
Hydro
Nuclear
Coal
Natural Gas
Petroleum
Renewables Percentage
Renewables outpace overall
energy consumption with an
increase to 32% of total energy
consumption in 2100 from 11%
in 2009.
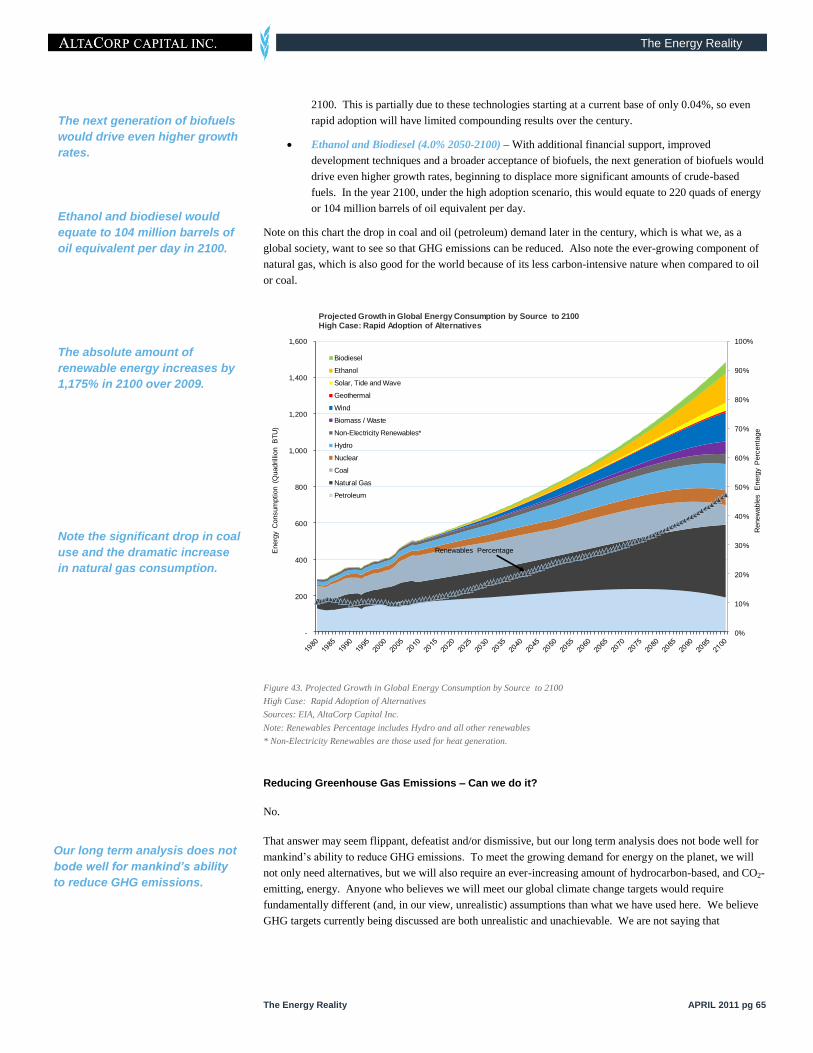
The Energy Reality
The Energy Reality APRIL 2011 pg 65
2100. This is partially due to these technologies starting at a current base of only 0.04%, so even
rapid adoption will have limited compounding results over the century.
Ethanol and Biodiesel (4.0% 2050-2100) – With additional financial support, improved
development techniques and a broader acceptance of biofuels, the next generation of biofuels would
drive even higher growth rates, beginning to displace more significant amounts of crude-based
fuels. In the year 2100, under the high adoption scenario, this would equate to 220 quads of energy
or 104 million barrels of oil equivalent per day.
Note on this chart the drop in coal and oil (petroleum) demand later in the century, which is what we, as a
global society, want to see so that GHG emissions can be reduced. Also note the ever-growing component of
natural gas, which is also good for the world because of its less carbon-intensive nature when compared to oil
or coal.
Figure 43. Projected Growth in Global Energy Consumption by Source to 2100
High Case: Rapid Adoption of Alternatives
Sources: EIA, AltaCorp Capital Inc.
Note: Renewables Percentage includes Hydro and all other renewables
* Non-Electricity Renewables are those used for heat generation.
Reducing Greenhouse Gas Emissions – Can we do it?
No.
That answer may seem flippant, defeatist and/or dismissive, but our long term analysis does not bode well for
mankind‟s ability to reduce GHG emissions. To meet the growing demand for energy on the planet, we will
not only need alternatives, but we will also require an ever-increasing amount of hydrocarbon-based, and CO2-
emitting, energy. Anyone who believes we will meet our global climate change targets would require
fundamentally different (and, in our view, unrealistic) assumptions than what we have used here. We believe
GHG targets currently being discussed are both unrealistic and unachievable. We are not saying that
0%
10%
20%
30%
40%
50%
60%
70%
80%
90%
100%
-
200
400
600
800
1,000
1,200
1,400
1,600
Renew
able
s E
nerg
y P
erc
enta
ge
Energ
y C
onsum
ption (
Quadrilli
on B
TU
)
Projected Growth in Global Energy Consumption by Source to 2100 High Case: Rapid Adoption of Alternatives
Biodiesel
Ethanol
Solar, Tide and Wave
Geothermal
Wind
Biomass / Waste
Non-Electricity Renewables*
Hydro
Nuclear
Coal
Natural Gas
Petroleum
Renewables Percentage
The next generation of biofuels
would drive even higher growth
rates.
Ethanol and biodiesel would
equate to 104 million barrels of
oil equivalent per day in 2100.
Note the significant drop in coal
use and the dramatic increase
in natural gas consumption.
Our long term analysis does not
bode well for mankind’s ability
to reduce GHG emissions.
The absolute amount of
renewable energy increases by
1,175% in 2100 over 2009.
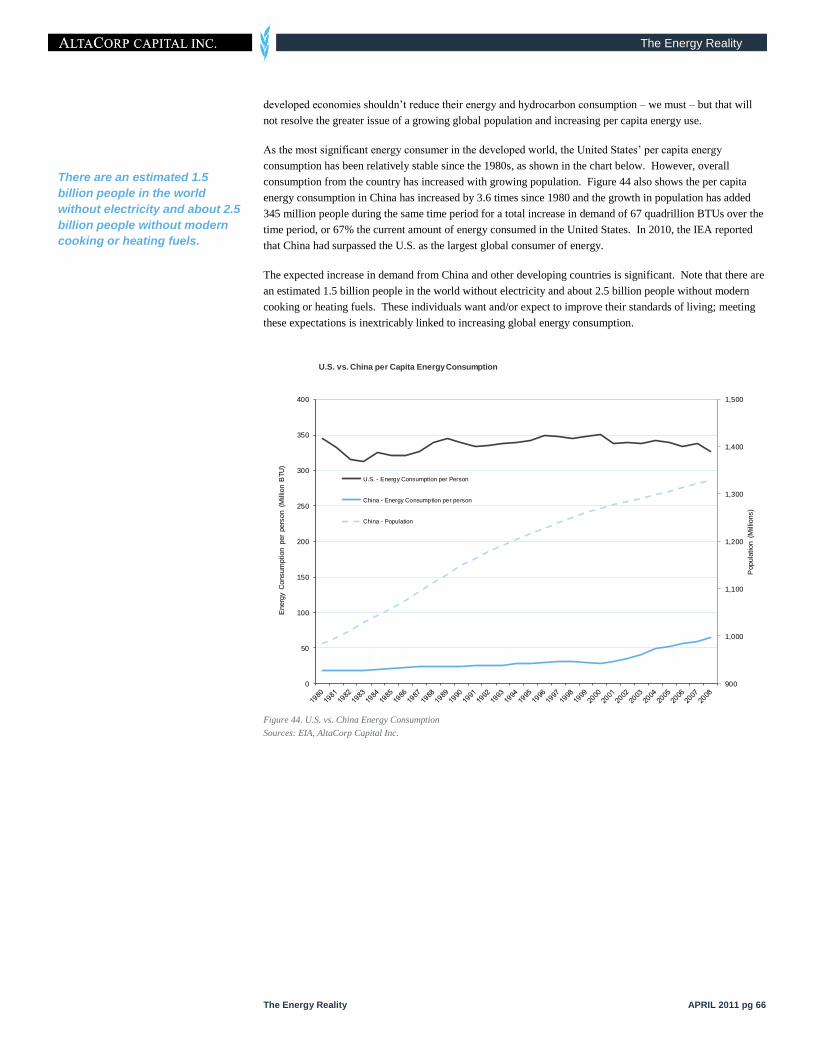
The Energy Reality
The Energy Reality APRIL 2011 pg 66
developed economies shouldn‟t reduce their energy and hydrocarbon consumption – we must – but that will
not resolve the greater issue of a growing global population and increasing per capita energy use.
As the most significant energy consumer in the developed world, the United States‟ per capita energy
consumption has been relatively stable since the 1980s, as shown in the chart below. However, overall
consumption from the country has increased with growing population. Figure 44 also shows the per capita
energy consumption in China has increased by 3.6 times since 1980 and the growth in population has added
345 million people during the same time period for a total increase in demand of 67 quadrillion BTUs over the
time period, or 67% the current amount of energy consumed in the United States. In 2010, the IEA reported
that China had surpassed the U.S. as the largest global consumer of energy.
The expected increase in demand from China and other developing countries is significant. Note that there are
an estimated 1.5 billion people in the world without electricity and about 2.5 billion people without modern
cooking or heating fuels. These individuals want and/or expect to improve their standards of living; meeting
these expectations is inextricably linked to increasing global energy consumption.
Figure 44. U.S. vs. China Energy Consumption
Sources: EIA, AltaCorp Capital Inc.
There are an estimated 1.5
billion people in the world
without electricity and about 2.5
billion people without modern
cooking or heating fuels.
900
1,000
1,100
1,200
1,300
1,400
1,500
0
50
100
150
200
250
300
350
400
Popula
tion (
Mill
ions)
Energ
y C
onsum
ption p
er
pers
on (
Mill
ion B
TU
)
U.S. vs. China per Capita Energy Consumption
U.S. - Energy Consumption per Person
China - Energy Consumption per person
China - Population
The Energy Reality
The Energy Reality APRIL 2011 pg 67
The Critical Role of Oil & Gas in a Long-Term Energy
Strategy
We believe that companies leveraged to oil and natural gas continue to offer an attractive long-term
investment opportunity. This is particularly the case for companies with long-life reserves and resources such
as the oil sands of Canada and non-conventional natural gas. Also, service and infrastructure companies will
benefit from this ongoing demand for hydrocarbons. Our comparison of hydrocarbons to several alternatives
reveals that the oil sands, conventional oil and natural gas will continue to be developed long into the future
and play a critical role in a North American sustainable energy strategy. Renewable energy – harnessing the
power of energy sources like the wind and sun – also play an essential role and will become more important as
hydrocarbons become more expensive to extract. On many practical and economic measures, however,
hydrocarbons are the still the best source of energy we have access to at this time.
The diverse nature of the different energy sources also means that from an integrated system perspective it is
essential to have a good mix – or portfolio – of energy sources. Each alternative energy source has some
inherent limitations, which will place restrictions on their implementation, and hydrocarbons – especially
natural gas – will continue to be central in meeting our energy demands.
Renewable energy will become
more important as
hydrocarbons become more
expensive to extract.
Hydrocarbons – especially
natural gas – will continue to be
central in meeting global energy
demand.

The Energy Reality
The Energy Reality APRIL 2011 pg 68
Suggestions / Recommendations
Most economic activity on our planet is driven by the expenditure of energy. Energy is an essential part of all
humans‟ daily lives, even to those who currently don‟t have access to electricity or hydrocarbons. Through
researching this report we have seen several areas where improvements or changes could be made in the public
debate about energy and the move towards renewables. Hopefully these suggestions and recommendations
might assist in allowing a more realistic assessment of the global energy circumstance.
Consistency – We Suggest Energy Equivalency
We believe that the debate around energy can be done in a common language; that is, comparing energy
sources on an equal – or the “apples to apples” – basis. A consistent methodology is required to properly
compare and contrast the various sources of energy. On a global scale, comparing all forms of energy is a
huge and complex undertaking, however, using an energy-equivalent measure, like the BTU, makes the task
manageable and realistic. An energy equivalency measure will allow consumers, researchers and governments
to make informed decisions when evaluating energy projects and energy use.
Refocusing the Energy Debate
Society needs to use our knowledge about the relative strengths and weaknesses of different energy sources to
identify the appropriate locations, funding structures (government, industry or private investment) and
incentives to develop each energy resource in the most efficient manner. Some examples of this refocused
thinking might include:
Funding Partnerships – Technologies that can be developed with returns attractive to industry and
private investment, based on a corporate cost of capital, should be funded predominantly by those
groups. This would allow more capital-intensive projects that can provide value at a social cost of
capital, which would be funded by governments. To achieve this allocation of funding, formal
partnerships between government, industry and private investment firms are required.
Cost Effective Resource Development – We believe that every type of energy resource has the
potential to be developed in a cost effective manner, but not everywhere in the world. The quality
of an energy resource can vary dramatically by country and within different regions in a country.
For example, it is clear that in Brazil the development of sugarcane-based ethanol is an efficient and
cost effective means to develop liquid fuels. This may not hold true for this feedstock (or others,
such as corn) in other areas of the world.
Diversity and Distributed Energy Generation – There is value to society in having a diverse set of
energy sources, distributed geographically. The different characteristics of each energy source
allow for the creation of reliable and adaptable energy systems when they are used in combinations
that can consist of complementary energy sources such as wind and solar, or renewable and
conventional.
Cooperative Development of Resources and Environmental Technologies – Companies should be
encouraged to cooperate through joint ventures to develop resources and environmental protection
technologies including:
Water Recycling – Conventional hydrocarbon fuel and biofuel companies face challenges
with respect to fresh water usage, so the development of a new generation of water
recycling technologies would be a benefit to both.
Carbon Capture and Storage – We believe that there is long-term potential for captured
carbon to be viewed as an asset/revenue instead of an expense/liability with the continued
development of carbon trading markets, enhanced oil recovery techniques and algae-
based biofuels. Perhaps all energy producers (including biofuel companies) could jointly
explore techniques for capturing and storing carbon as well as marketing the solutions.
Improvements or changes
could be made in the public
debate about energy.
Using an energy-equivalent
measure, like the BTU, makes
the task manageable and
realistic.
There is value to society in
having a diverse set of energy
sources, distributed
geographically.
The development of a new
generation of water recycling
technologies would be a benefit
to both hydrocarbon and
biofuel companies.

The Energy Reality
The Energy Reality APRIL 2011 pg 69
Subsidies – Productive Over the Long Term
Our review of existing subsidy structures leads us to the following recommendations about how subsidy
programs should be structured to be productive over the long term:
Innovation Based Incentives – Tax incentives or rebates that are awarded generically based on
energy source lack the impetus for companies to innovate. As an example, subsidies for solar PV
technology are often granted to practically every manufacturer, regardless of their economic
efficiency. Subsidies often do not reward innovation because they tend to be higher for higher cost
energy solutions (i.e. effectively rewarding them for being high cost). This was the case for oil
sands developers where higher capital costs resulted in more royalty reductions. Over time as costs
get reduced, the subsidies disappear (i.e. effectively penalizing them for now being lower cost).
Subsidies should be given based on cost reductions; for example, the faster you reduce costs the
more subsidies / tax credits you receive. Eventually, yes, all subsidies should disappear but the
reward / behaviour mechanism needs to be considered.
Funding for Research and Development – More funding for R&D directed at producing lower cost
energy sources using conventional alternatives is required (e.g. advances in technology for electrical
generation would mean more kWh produced by burning the same tonne of coal or cubic foot of gas
and also reduce GHG per BTU.)
Subsidies to Create Wider Use of Natural Gas – These subsidies could encourage the development
of new uses for natural gas including GTL, CNG and LNG.
Subsidies and Taxes to Reduce Consumption – This may be one of the cheaper forms of
“alternative energy” which could reduce consumption and provide an income stream.
Subsidy Balance – Subsidy programs need to balance energy consumption, in the form of end-use
efficiency improvements, and energy production, in the form of energy production improvements.
Energy Generic Subsidies – These subsidies would move towards being based on specific
environmental objectives for all fuel types; incentives need to be designed to reward innovation, as
well as cost and pollution reductions, regardless of energy type.
Subsidy Reduction Over Time – Subsidy programs need to include mandated reductions over time
to ensure that only business models with the potential of long-term profitability would be
encouraged to seek subsidies in the first place. This would be similar to hydrocarbon-based
subsidies like the oil sands where there is a lower royalty rate initially, but then increase after the
operators have recovered their invested capital.
Subsidy Aggregation – Subsidy programs need to be evaluated on an aggregate basis and not
implemented in isolation. For example, corn-based ethanol subsidies can be significant when
viewed on an aggregate basis. Let‟s examine a barrel of ethanol produced by a small ethanol
producer:
Farmers: $0.28 cents/bushel of Corn (2002 Farm Act – Direct Payment)
Small Ethanol Producer: $0.10/gallon (Small Producer Tax Credit)
Refinery / Ethanol Blender: $0.45/gallon (VEETC)
When these individual subsidies are aggregated, the total ethanol subsidy equates to
roughly $28/barrel of ethanol (or $46/boe-energy)
Subsidies should be given
based on cost reductions.
Subsidy programs need to
include mandated reductions,
evaluated on an aggregate
basis and not implemented in
isolation.

The Energy Reality
The Energy Reality APRIL 2011 pg 70
Groups or Individuals Involved in the Energy Debate
There are many groups involved in the energy debate and we have some thoughts / suggestions /
recommendations to these groups.
Renewable and Hydrocarbon Energy Producers
There is a clear divide between developers of alternative energy and those involved in conventional
hydrocarbon energy production. We believe that increased collaboration between these companies has
benefits for all, such as:
Sources of Capital and Growth – Companies in the utility and energy sectors are well capitalized
and could serve as reliable sources of funding for alternative energy companies through partnerships
and other joint ventures. This funding could be more reliable than government grants, rebates and
tax credits, but would likely be driven more by economic feasibility. If shown to be economically
viable, the technology and potential resources represented by alternative energy companies could
serve as a growth platform for conventional utility and energy companies.
Co-Location and Cost Sharing – Companies in the alternative and conventional energy sectors
have the opportunity to share costs by leveraging shared infrastructure and through joint lobbying
efforts to governments.
Improved Resource Evaluations and Legislation – Partnerships between conventional and
alternative energy components could promote the sharing of resource evaluation techniques. This
cooperation would be valuable because legislation associated with the evaluation and publication of
reserve and resource data, currently the domain of conventional energy projects, needs to be
expanded to include renewable energy sources.
Environmentalists
Environmentalists should follow David Suzuki‟s lead by being willing to work with industry; as he
said to Jim Prentice during a discussion filmed on Haida Gwaii and aired on CBC television in
2010:
“..it is very easy to be self-righteous when you‟re fighting: „we‟re right and they‟re
wrong, they‟re bastards and you know‟ and it‟s a big shift for a lot of environmental
groups and people – including me – to say look, we‟ve got to engage in dialogue. We‟re
not going to make it by ourselves. It‟s a very difficult thing when you‟ve grown up
fighting, to suddenly say „We‟ve got to reach across‟ ”.
We respect Suzuki‟s willingness to engage with industry and suggest all environmentalists to take
this honourable stance, which will allow everyone to get down to work on improving our complex
and challenging environmental circumstance.
Some environmentalists forecast how the global society can become completely free of
hydrocarbons and nuclear energy in just a few decades. Although this would be an excellent
outcome for mankind, we view these forecasts as not being based in reality; they ignore the
practical and economic realities about alternative energy. Conversely, if anyone believes our
assumptions to be unrealistic, we fully encourage input and feedback on our analysis.
Energy Producers
Cooperation between environmental groups and industry, in our view, must be done. We suggest
that the lead is taken in this effort by environmental groups, because they would be viewed as non-
conflicted. This also gives environmentalists, the opportunity to make significant impacts on the
industry from the “trenches”.
Partnerships could promote the
sharing of resource evaluation
techniques.
We respect Suzuki’s willingness
to engage with industry.
Some unrealistic forecasts
show mankind completely free
of hydrocarbons and nuclear
energy in just a few decades.
Cooperation between
environmental groups and
industry must be done.

The Energy Reality
The Energy Reality APRIL 2011 pg 71
Fund alternative energy investments and companies, those that have the potential of becoming
economically sustainable or those that have a technology that could be integrated with conventional
energy operations.
Donate to reputable environmental causes; especially those who are willing to enter into dialogue
with industry.
Work with government, industry groups and environmentalists to come up with a Canadian Energy
Strategy.
Media
Reduce or eliminate misleading articles that use terms such as:
“this leads us to energy independence”
“we have the technology now to eliminate our use of hydrocarbons”
When discussing the benefits of a technology, also address economics and negatives. For instance,
cellulosic ethanol can sound like a great solution to replace or offset hydrocarbon use, until the
economics are discussed.
Publish balanced articles that take into account all aspects of various forms of energy.
Individuals
Reduce personal energy consumption.
When you buy products that are marketed or considered as “green”, make sure you understand the
full life cycle environmental considerations. For instance, if you are buying an electric car ask
“where is the electricity coming from?” If the answer is coal, then your electric car is likely making
the CO2 emissions problem worse, not better.
Donate to reputable environmental causes; especially those who are willing enter into dialogue with
industry.
Governments
When setting subsidies, be clear on the potential long-term viability of the renewable technologies
being developed.
Governments have the capacity to fund broader studies to understand full life cycle economics of
various sources of energy sources. A comprehensive and ongoing study would provide the proper
basis for making value-added policy decisions.

The Energy Reality
The Energy Reality APRIL 2011 pg 72
Conclusion
Non-renewable energy resources – hydrocarbons – are the most economic and practical forms of energy
available to mankind. Is this sustainable and the most environmentally-friendly solution? No. Do we need to
move towards renewable energy sources? Most definitely. We need to move away from consuming
hydrocarbons, but there are many realities about renewables that are often ignored. These realities need to be
addressed so that the transition to renewables can be done as easily as possible. We believe that the transition
to renewables will take much longer and cost significantly more than might be realized.
One of the main reasons replacing hydrocarbons with alternatives will be difficult is because our demand for
energy is growing so dramatically. In addition to the continued growth in population, there is an increase in
energy demand that goes along with one‟s desire to increase his/her quality of life. The task of converting to
alternatives is a classic case of one step forward and two steps back. It will be very difficult to meet increased
energy demand while at the same time trying to convert to alternatives. In our base case adoption of
alternatives, we view that by 2050 we see renewable alternatives increasing to 20%, and even with our high
case we only see renewables usage increasing to 24% of total energy consumption.
It is going to take open discussions with the public, government and industry to move away from the cost
effectiveness of non-renewable energy sources, establish the best method of defining / managing alternatives
as well as the positive / negative outputs. An economic reality of energy is that as usage continues to increase,
the most cost efficient form is preferable. Another economic reality is that it is expensive to develop
sustainable, consistent energy sources on a scale large enough for the masses. The practical realities of energy
include the realistic full cycle effects on the environment and society as a whole.
Renewable energy sources are required to create a sustainable energy infrastructure, and we do need to phase
out hydrocarbons because of their non-renewable nature. Renewable sources of energy need research and
development to help increase their efficiency, and to reduce their environmental footprint. To increase the
validity and effectiveness of renewable energy resources, government, industry and individuals are going to
have to step up to fund the high cost of these projects.
These realities need to be
addressed so that the transition
to renewables can be done as
easily as possible.
It will be very difficult to meet
increased energy demand while
at the same time trying to
convert to alternatives.
Renewable energy sources are
required to create a sustainable
energy infrastructure, and we
do need to phase out
hydrocarbons.

The Energy Reality
The Energy Reality APRIL 2011 pg 73
This Page Intentionally Left Blank

The Energy Reality
The Energy Reality APRIL 2011 pg 74
Table of Figures
Figure 1. Total Costs for Various Energy Projects, Plus CO2 Costs at $50/tonne (Corporate Cost of Capital) ... 3 Figure 2. Projected Growth in Global Energy Consumption by Source to 2050 ................................................ 6 Figure 3. Global Energy Consumption by Source (on an energy-equivalent BTU basis) ................................... 8 Figure 4. Renewable Alternatives ..................................................................................................................... 10 Figure 5. Hydrocarbon-Based Options.............................................................................................................. 10 Figure 6. Cost of Energy Comparison ($/mmBTU) .......................................................................................... 14 Figure 7. CO2 Environmental Footprint ............................................................................................................ 15 Figure 8. Well to Wheels GHG Emissions Comparison ................................................................................... 17 Figure 9. Total Costs for Various Energy Projects, Plus CO2 Costs at $50/tonne (Corporate Cost of Capital) . 19 Figure 10. Cost of Capital Sensitivity Analysis ($/Barrel of Oil Equivalent).................................................... 21 Figure 11. Cost of Capital Sensitivity Analysis ($/Barrel of Oil Equivalent).................................................... 22 Figure 12. Average Capacity Factors (Renewables and Conventional) ............................................................ 23 Figure 13. Sensitivity of Energy Costs to Capacity Factor (Select Renewables) .............................................. 24 Figure 14. Trends in Feedstock Prices .............................................................................................................. 25 Figure 15. Feedstock Impact on Total Energy Cost .......................................................................................... 26 Figure 16. Feedstock Impact on Total Energy Cost .......................................................................................... 27 Figure 17. Feedstock Impact on Total Energy Cost .......................................................................................... 27 Figure 18. Sensitivity of Operating Costs to Heat Rate..................................................................................... 28 Figure 19. Sensitivity of Energy Costs to Coal Prices ...................................................................................... 29 Figure 20. Sensitivity of Energy Costs to Natural Gas Prices ........................................................................... 29 Figure 21. Sensitivity of Energy Costs to Uranium (plus Enrichment) Prices .................................................. 30 Figure 22. CO2 Prices ....................................................................................................................................... 31 Figure 23. Sensitivity of Energy Costs to CO2 .................................................................................................. 31 Figure 24. Cost Ranges for Energy Alternatives (Corporate Cost of Capital) ................................................... 32 Figure 25. Cost Ranges for Energy Alternatives (Social Cost of Capital)......................................................... 33 Figure 26. U.S. Electricity Rebates ................................................................................................................... 35 Figure 27. Biodiesel Production Reliant on High Diesel Prices and Subsidies ................................................. 36 Figure 28. U.S. Solar PV Resource Sources: National Renewable Energy Laboratory (NREL) ....................... 42 Figure 29. U.S. Geothermal Resource Sources: NREL ..................................................................................... 43 Figure 30. U.S. Wind Resource Sources: NREL ............................................................................................... 43 Figure 31. Comparison Water and H2O Use – Logarithmic Scale.................................................................... 47 Figure 32. Global Liquids Consumption by End-Use ....................................................................................... 49 Figure 33. Global Energy Consumption of Transportation by Fuel Type ......................................................... 50 Figure 34. U.S. and Brazil are Dominating the Biofuels Scene ........................................................................ 51 Figure 35. U.S. Corn Production and Caloric Equivalent ................................................................................. 54 Figure 36. United States Electrical Generation by Source ................................................................................ 55 Figure 37. Carbon Dioxide Comparisons .......................................................................................................... 56 Figure 38. Global Electrical Generation by Source ........................................................................................... 58 Figure 39. Global Energy Consumption by Source 1980 – 2010 ...................................................................... 59 Figure 40. Projected Growth in Global Energy Consumption by Source to 2050 ............................................ 61 Figure 41. Projected Growth in Global Energy Consumption by Source to 2050 ............................................ 62 Figure 42. Projected Growth in Global Energy Consumption by Source to 2100 ............................................ 64 Figure 43. Projected Growth in Global Energy Consumption by Source to 2100 ............................................ 65 Figure 44. U.S. vs. China Energy Consumption ............................................................................................... 66
The Energy Reality
The Energy Reality APRIL 2011 pg 75
Sources
Cost Comparison Graphs
Figures 1, 6, 9, 10, 11, 13, 15 – 26 (charts with the $/Million BTU and $/boe-energy)
AltaCorp Capital Inc.
• Internal Research Estimates and Analysis
Alberta Electric System Operator (AESO)
• Alberta Electricity Pool Prices
Asian Development Bank
• ERD Working Paper Series No. 94 - Theory and Practice in the Choice of Social Discount Rate for
Cost –Benefit Analysis: A Survey (Zhuang et al., May 2007)
Brazilian Reference Center on Biomass (CENBIO)
• Brazilian Sugarcane Ethanol: Lessons Learned (Coelho, 2005)
Biodiesel Magazine
• Published Crushing Plant and Biodiesel Refinery Costs
BioTechnology for Biofuels
• The Brazilian biofuels industry(Goldemberg, 2008)
Canadian Association of Petroleum Producers (CAPP)
• Guide - Calculating Greenhouse Gas Emissions (April 2003)
Canadian Bioenergy Corporation
• Estimated costs of proposed Canola-based biodiesel plant in Lloydminster, Alberta
Canola Council of Canada
• Canola Oil: Physical and Chemical Properties (Przybylski)
• Canola Seed, Oil and Meal Prices
Canadian Natural Resources Limited (CNRL)
• Actual / Projected Costs of Oil Sands Mining and In-Situ Projects
Cheminfo Services Inc., (S&T)2 Consultants Inc. and Cemcorp Ltd
• Ethanol Production in Alberta, Final Report (April 2000)
Energy Information Administration
• Annual Energy Outlook (Dec. 2010)
• Biomass For Electricity Generation Analysis Report
• EIA Energy Calculators
• Electric Power Annual 2009 (Nov. 2010)
• Heat Content of Petroleum Consumption and Biofuels Production, 1949-2009
• Oil Production Capacity Expansion Costs For The Persian Gulf (1996)
• Updated Capital Cost Estimates for Electricity Generation Plants (Nov. 2010)
• Uranium Marketing Annual Report 2009 (Aug. 2010)
Farm Energy Online
• Ethanol Economics Comparison
Food and Agriculture Organization of the United Nations (FAOSTAT)
• Crop Production Database
• Agricultural Price Statistics Database
Go Solar California (California Energy Commission and the California Public Utilities Commission)
• List of Eligible SB1 Guidelines Compliant Photovoltaic Modules
Government of Brazil
• CONAB national crop survey results
Government of Ontario – Ministry of Agriculture Food & Rural Affairs
• Guidelines for Estimating Canola Biodiesel Production Costs
• Guidelines for Estimating Used Vegetable Oil Biodiesel Production Costs
• Guidelines for Estimating Soybean Biodiesel Production Costs
International Energy Agency
• IEA Unit Converters

The Energy Reality
The Energy Reality APRIL 2011 pg 76
International Monetary Fund
• Primary Commodity Prices
Iogen Corporation
• Technology Process Overview
• Estimated Costs for Proposed Saskatchewan Plant
Iowa State University Extension
• Tracking ethanol profitability Spreadsheet Model (Hofstrand)
Jordan Energy and Mining Ltd.
• Al Lajjun Oil Shale Project Summary
Methanex
• Methanol Posted Contract Prices
Natural Resources Defence Council
• Growing Energy – How Biofuels Can Help End America’s Oil Dependence (Green et al.)
Oak Ridge National Laboratory (ORNL)
• Bioenergy Conversion Factors
Richardson International Limited
• Estimated Canola Crushing Plant Costs
Shell
• Perdido Construction Costs
Spectrum Commodities
• Conversion Tables and Formulas
Suncor
• Actual / Projected costs of Oil Sands Mining and In-Situ Projects
Terra Grain Fuels
• Belle Plaine Plant Construction Cost Estimates
TradeTech
• Unit Conversion Calculator / Table
U.S. Department of Agriculture
• Amber Waves Publication (May 2007)
• Economic Research Service – Feed Grains Database
• National Agriculture Statistics Service – Quick Stats
• The Economic Feasibility of Ethanol Production From Sugar In The United States (2006)
• Managing and enhancing switchgrass as a bioenergy feedstock (Mitchel et al., 2008)
U.S. Federal Reserve Bank of St. Louis
• Historic Moody's Seasoned Aaa Corporate Bond Yields (AAA)
www.usinflationcalculator.com
• Historic U.S. Inflation Rates
CO2 and H20 Footprints
Figures 7, 8, 31
Argonne National Laboratory
• Consumptive Water Use in the Production of Ethanol and Petroleum Gasoline (Jan 2009)
• GREET Model 1.8d.1 (2010)
Biomass and Bioenergy Journal
• Greenhouse gases emissions in the production and use of ethanol from sugarcane in Brazil: The
2005/2006 averages and a prediction for 2020 (Macedo et al, July 2008)
Cambridge Energy Research Associates (CERA)
• Oil Sands, Greenhouse Gases, and U.S. Oil Supply Getting the Numbers Right (2010)
Chesapeake Energy
• Water Use in Deep Shale Gas Exploration – Fact Sheet (July 2010)
Congressional Research Service
• Water Issues of Concentrating Solar Power (CSP) Electricity in the U.S. Southwest (Carter and
Campbell, June 2009)
Energy Information Administration
• Updated Capital Cost Estimates for Electricity Generation Plants (Nov. 2010)

The Energy Reality
The Energy Reality APRIL 2011 pg 77
Environmental Science & Technology
• The Water Footprint of Biofuels: A Drink or Drive Issue? (Dominguez-Faus et al., 2009)
Government of the State of São Paulo
• Assessment of greenhouse gas emissions in the production and use of fuel ethanol in Brazil
(Macedo et al., 2004)
International Energy Agency
• Benign Energy? The Environmental Implications of Renewables (1998)
Jacobs Consultancy and Life Cycle Associates LLC
• Life Cycle Assessment Comparison of North American and Imported Crudes (July 2009)
Jordan Energy and Mining Ltd.
• Al Lajjun Oil Shale Project Summary
National Renewable Energy Laboratory
• Fuel from the Sky Solar Power’s Potential for Western Energy Supply (July 2002)
Natural Resources Canada
• GHGenius version 3.19 (2010)
New Energy Externalities Developments for Sustainability (NEEDS)
• Reports on Innovative Technologies
Proceedings of the National Academy of Sciences
• The water footprint of bioenergy (Gerbens et al., 2009)
Pembina Institute
• Mining vs. In Situ Fact Sheet
• Upgrader Alley Report (Griffiths and Dyer, 2008)
Syncrude Canada
• 2009 Sustainability Report
TIAX LLC and MathPro. Inc.
• Comparison of North American and Imported Crude Oil Lifecycle GHG Emissions (July 2009)
U.S. Department of Energy
• Energy Demands on Water Resources (Dec. 2006)
World Nuclear Association
• Comparative Carbon Dioxide Emissions from Power Generation (2009)
World Steel Association
• ENVIRONMENTAL CASE STUDY - Wind energy (Oct. 2008)
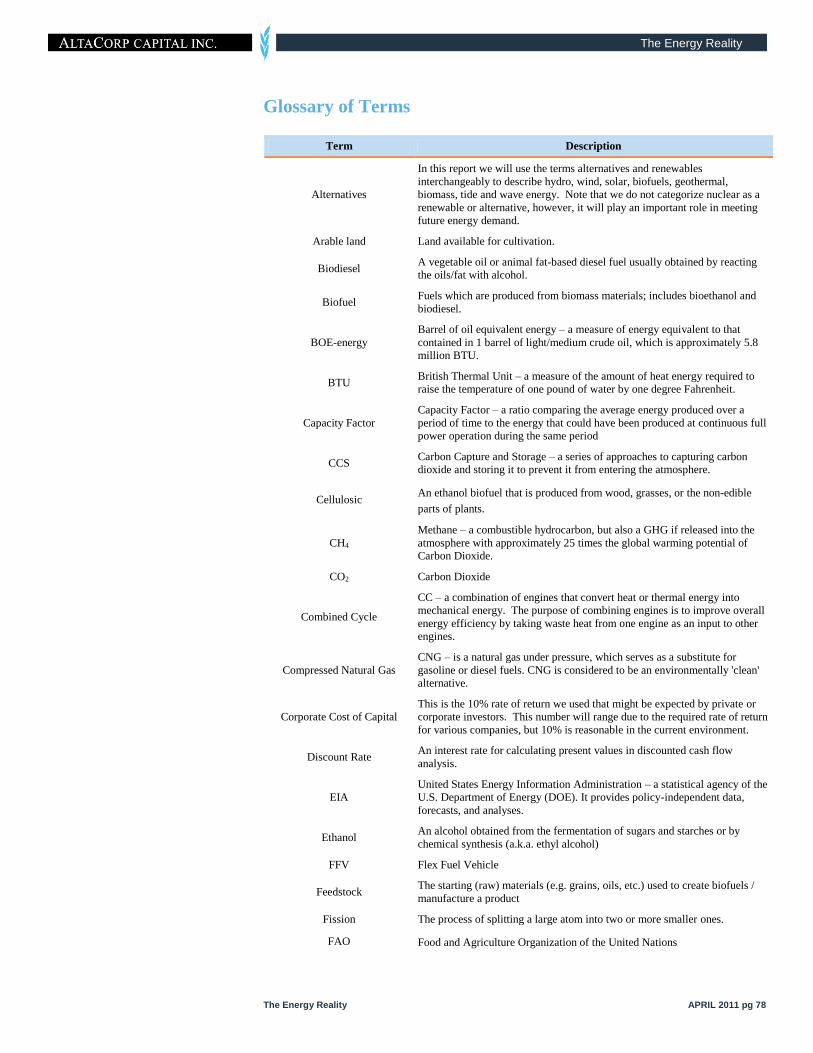
The Energy Reality
The Energy Reality APRIL 2011 pg 78
Glossary of Terms
Term Description
Alternatives
In this report we will use the terms alternatives and renewables
interchangeably to describe hydro, wind, solar, biofuels, geothermal,
biomass, tide and wave energy. Note that we do not categorize nuclear as a
renewable or alternative, however, it will play an important role in meeting
future energy demand.
Arable land Land available for cultivation.
Biodiesel A vegetable oil or animal fat-based diesel fuel usually obtained by reacting
the oils/fat with alcohol.
Biofuel Fuels which are produced from biomass materials; includes bioethanol and
biodiesel.
BOE-energy
Barrel of oil equivalent energy – a measure of energy equivalent to that
contained in 1 barrel of light/medium crude oil, which is approximately 5.8
million BTU.
BTU British Thermal Unit – a measure of the amount of heat energy required to
raise the temperature of one pound of water by one degree Fahrenheit.
Capacity Factor
Capacity Factor – a ratio comparing the average energy produced over a
period of time to the energy that could have been produced at continuous full
power operation during the same period
CCS Carbon Capture and Storage – a series of approaches to capturing carbon
dioxide and storing it to prevent it from entering the atmosphere.
Cellulosic An ethanol biofuel that is produced from wood, grasses, or the non-edible
parts of plants.
CH4
Methane – a combustible hydrocarbon, but also a GHG if released into the
atmosphere with approximately 25 times the global warming potential of
Carbon Dioxide.
CO2 Carbon Dioxide
Combined Cycle
CC – a combination of engines that convert heat or thermal energy into
mechanical energy. The purpose of combining engines is to improve overall
energy efficiency by taking waste heat from one engine as an input to other
engines.
Compressed Natural Gas
CNG – is a natural gas under pressure, which serves as a substitute for
gasoline or diesel fuels. CNG is considered to be an environmentally 'clean'
alternative.
Corporate Cost of Capital
This is the 10% rate of return we used that might be expected by private or
corporate investors. This number will range due to the required rate of return
for various companies, but 10% is reasonable in the current environment.
Discount Rate An interest rate for calculating present values in discounted cash flow
analysis.
EIA
United States Energy Information Administration – a statistical agency of the
U.S. Department of Energy (DOE). It provides policy-independent data,
forecasts, and analyses.
Ethanol An alcohol obtained from the fermentation of sugars and starches or by
chemical synthesis (a.k.a. ethyl alcohol)
FFV Flex Fuel Vehicle
Feedstock The starting (raw) materials (e.g. grains, oils, etc.) used to create biofuels /
manufacture a product
Fission The process of splitting a large atom into two or more smaller ones.
FAO Food and Agriculture Organization of the United Nations
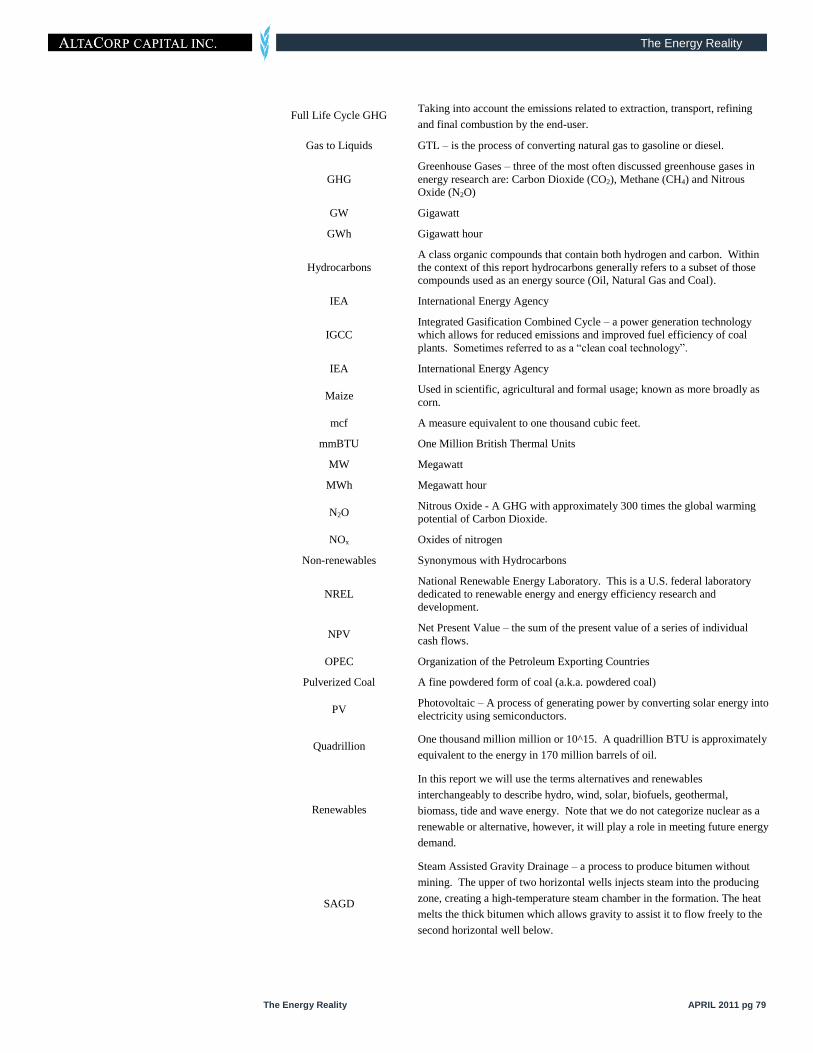
The Energy Reality
The Energy Reality APRIL 2011 pg 79
Full Life Cycle GHG Taking into account the emissions related to extraction, transport, refining
and final combustion by the end-user.
Gas to Liquids GTL – is the process of converting natural gas to gasoline or diesel.
GHG
Greenhouse Gases – three of the most often discussed greenhouse gases in
energy research are: Carbon Dioxide (CO2), Methane (CH4) and Nitrous
Oxide (N2O)
GW Gigawatt
GWh Gigawatt hour
Hydrocarbons
A class organic compounds that contain both hydrogen and carbon. Within
the context of this report hydrocarbons generally refers to a subset of those
compounds used as an energy source (Oil, Natural Gas and Coal).
IEA International Energy Agency
IGCC
Integrated Gasification Combined Cycle – a power generation technology
which allows for reduced emissions and improved fuel efficiency of coal
plants. Sometimes referred to as a “clean coal technology”.
IEA International Energy Agency
Maize Used in scientific, agricultural and formal usage; known as more broadly as
corn.
mcf A measure equivalent to one thousand cubic feet.
mmBTU One Million British Thermal Units
MW Megawatt
MWh Megawatt hour
N2O Nitrous Oxide - A GHG with approximately 300 times the global warming
potential of Carbon Dioxide.
NOx Oxides of nitrogen
Non-renewables Synonymous with Hydrocarbons
NREL
National Renewable Energy Laboratory. This is a U.S. federal laboratory
dedicated to renewable energy and energy efficiency research and
development.
NPV Net Present Value – the sum of the present value of a series of individual
cash flows.
OPEC Organization of the Petroleum Exporting Countries
Pulverized Coal A fine powdered form of coal (a.k.a. powdered coal)
PV Photovoltaic – A process of generating power by converting solar energy into
electricity using semiconductors.
Quadrillion One thousand million million or 10^15. A quadrillion BTU is approximately
equivalent to the energy in 170 million barrels of oil.
Renewables
In this report we will use the terms alternatives and renewables
interchangeably to describe hydro, wind, solar, biofuels, geothermal,
biomass, tide and wave energy. Note that we do not categorize nuclear as a
renewable or alternative, however, it will play a role in meeting future energy
demand.
SAGD
Steam Assisted Gravity Drainage – a process to produce bitumen without
mining. The upper of two horizontal wells injects steam into the producing
zone, creating a high-temperature steam chamber in the formation. The heat
melts the thick bitumen which allows gravity to assist it to flow freely to the
second horizontal well below.

The Energy Reality
The Energy Reality APRIL 2011 pg 80
Silicon A non-metal with semiconducting properties, used in the production of solar
cells and solar photovoltaic
SO2 Sulphur Dioxide
Social Cost of Capital
This is the rate of return that would be used by governments and economists
to determine the value of investing in social projects like energy. In this
report we use a 3.5% rate.
Solar PV Solar Photovoltaic – converting solar radiation into electricity using
semiconductors
U-235 Uranium-235 – an isotope of uranium that can sustain a fission chain
reaction.
Unobtainium
From Wikipedia: Since the late 1950s, aerospace engineers have used the
term “unobtainium” when referring to unusual or costly materials, or when
theoretically considering a material perfect for their needs in all respects,
except that it does not exist.
USDA
United States Department of Agriculture – an agency of the U.S. government
responsible for developing and executing policy on farming, agriculture, and
food.
VEETC The U.S Volumetric Ethanol Excise Tax Credit (U.S.)
WTW Well to Wheels. A life cycle assessment technique for oil and natural gas
energy.
Yield In this report yield refers to „crop yield‟ which a measure of the agricultural
production or output per unit area of land

The Energy Reality
The Energy Reality APRIL 2011 pg 81
This Page Intentionally Left Blank
The Energy Reality
The Energy Reality APRIL 2011 pg 82
Disclosure Requirements
1 Is this an issuer related or industry related publication? Industry
2 Does the analyst, a member of the analyst's household, associate or employee who prepared this
research report hold or are short on any of the issuer's securities directly or through derivatives?
N
3 If answer to #2 is yes, state name and the nature of the interest:
4 Is AltaCorp Capital making a market in an equity or equity related security of the issuer? N
5 Does AltaCorp Capital and it affiliates collectively benefic ially own more than 1% of any class of common
equity of the issuer?
N
6 Does AltaCorp Capital or the analyst have any actual material conflicts of interest with the issuer? If yes,
explain:
N
7 Does any director, officer, employee of AltaCorp Capital or member of their household serve as a director
or officer or advisory capacity of the issuer? (if applicable, list name)
N
8 Did the analyst and/or associate who prepared this research report receive compensation based solely
upon investment banking revenues?
N
9 Did the analyst receive any payment or reimbursement of travel expenses by the issuer? N
10 Has the analyst received any compensation based on a specific investment banking transaction relative
to this issuer?
N
11 Has any director, officer or employee who prepared this research report received any compensation
from the subject company in the past 12 months?
N
12 Has AltaCorp Capital provided the issuer or its predecessor with non- investment banking securities-
related services in the past 12 months?
N
13 Has AltaCorp Capital managed or co- managed an offering of securities by the issuer or its predecessor
in the past 12 months?
N
14 Has AltaCorp Capital received compensation for investment banking and related services from the issuer
or its predecessor in the 12 months prior to the date of this report?
N
R anking
D istribut io n
% IB
C lients
Outperform 89% 11%
Sector Perform 11% 0%
Underperform 0% 0%
Speculative 0% 0%
Restricted 0% 0%
Total 100%
The inf ormation contained herein is f or inf ormation purposes only and is not to be construed as an of f er or solicitation f or
the sale or purchase of securities. While the accuracy or
completeness of the inf ormation contained in this document
cannot be guaranteed by AltaCorp Capital Inc., it was obtained f rom sources believ ed to be reliable. AltaCorp
Capital Inc. and/or its of f icers, directors and employ ees may
f rom time to time acquire, hold or sell positions in the
securities mentioned herein as principal or agent.
1100, 888 – 3rd Street SW, Calgary , Alberta T2P 5C5
Tel: 403 539 8600
www.altacorpcapital.com
Rating System
AltaCorp’s rating system reflects our outlook for
expected performance of an issuer’s equity securities relative to its peer group over the
next 12 months.
An Outperform (Buy) rating represents a security expected to provide a return greater
than the peer group average.
A Sector Perform (Hold) rating represents a security expected to provide a return in l ine with
the peer group average.
An Underperform (Sell) rating represents a security expected to provide a return less than
the peer group
A Speculativ e rating represents a security where the return potential is high, but the risk of
a significant loss is material.
The author of this report hereby certif ies that the v iews expressed in this report accurately ref lect his/her personal v iews about the subject security
and issuer.
The author of this report f urther certif ies that no part of his/her
compensation was, is, or will directly or indirectly related to the specif ic recommendations or v iews contained in this research report.
AltaCorp Capital Inc. may receiv e or intends to seek compensation f or
inv estment banking serv ices f rom all issuers under research cov erage
within the next three months.
This report has not been approv ed by AltaCorp Capital Inc. f or the
purposes of section 21 of the Financial Serv ices and Markets Act 2000 as it
is being distributed only to persons who are inv estment prof essionals within
the meaning of article 19 of the Financial Serv ices and Markets Act 2000 (Financial Promotion) Order 2005 and is not intended to, and should not be
relied upon, by any other person.

1100, 888 – 3RD STREET SW
CALGARY AB CANADA T2P 5C5
MAIN: 403 539 8600 FAX: 403 539 8575
WWW.ALTACORPCAPITAL.COM