Embed Size (px)
Citation preview
Renewables Global Status Report for 2006
Dr. Eric Martinot
Senior Visiting Scholar, Tsinghua University, Beijing Senior Research Fellow, Worldwatch Institute
[email protected] www.martinot.info
Report sponsored by the REN21 Renewable Energy Policy Network (www.ren21.net)
Eighth Annual New Zealand Energy Summit Wellington
July 17-19, 2006
Report Outline
1. Investment Flows 2. Global Market Overview 3. Industry Trends 4. Policy Landscape 5. Rural (Off-Grid) Renewable Energy
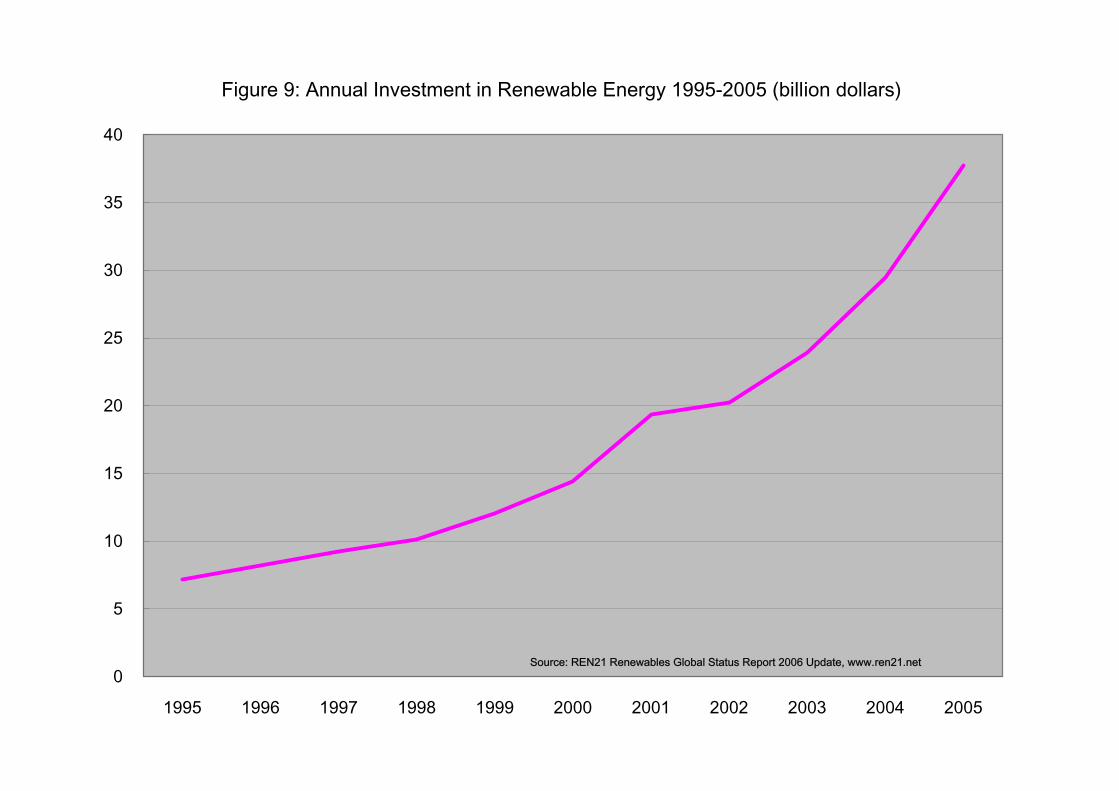
Figure 9: Annual Investment in Renewable Energy 1995-2005 (billion dollars)
0
5
10
15
20
25
30
35
40
1995 1996 1997 1998 1999 2000 2001 2002 2003 2004 2005
Source: REN21 Renewables Global Status Report 2006 Update, www.ren21.net
Investment Flows
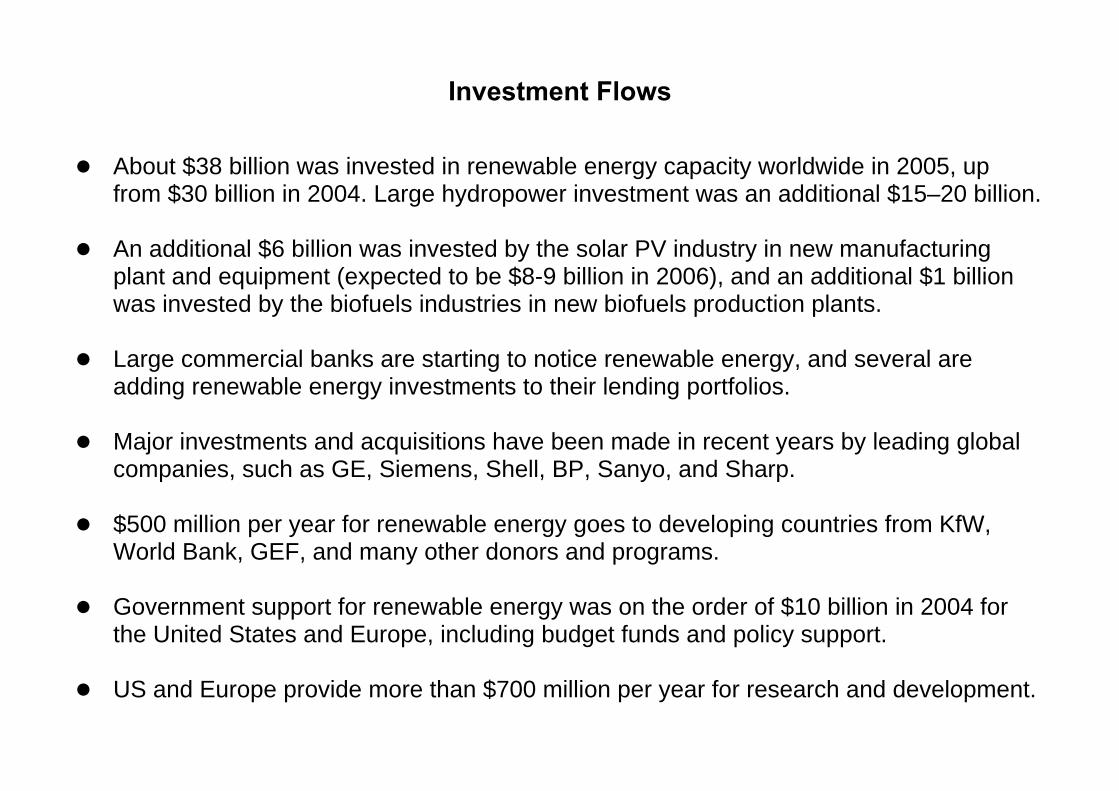
About $38 billion was invested in renewable energy capacity worldwide in 2005, up from $30 billion in 2004. Large hydropower investment was an additional $15–20 billion.
An additional $6 billion was invested by the solar PV industry in new manufacturing
plant and equipment (expected to be $8-9 billion in 2006), and an additional $1 billion was invested by the biofuels industries in new biofuels production plants.
Large commercial banks are starting to notice renewable energy, and several are
adding renewable energy investments to their lending portfolios.
Major investments and acquisitions have been made in recent years by leading global companies, such as GE, Siemens, Shell, BP, Sanyo, and Sharp.
$500 million per year for renewable energy goes to developing countries from KfW,
World Bank, GEF, and many other donors and programs.
Government support for renewable energy was on the order of $10 billion in 2004 for the United States and Europe, including budget funds and policy support.
US and Europe provide more than $700 million per year for research and development.
Global Market Overview – Power Generation
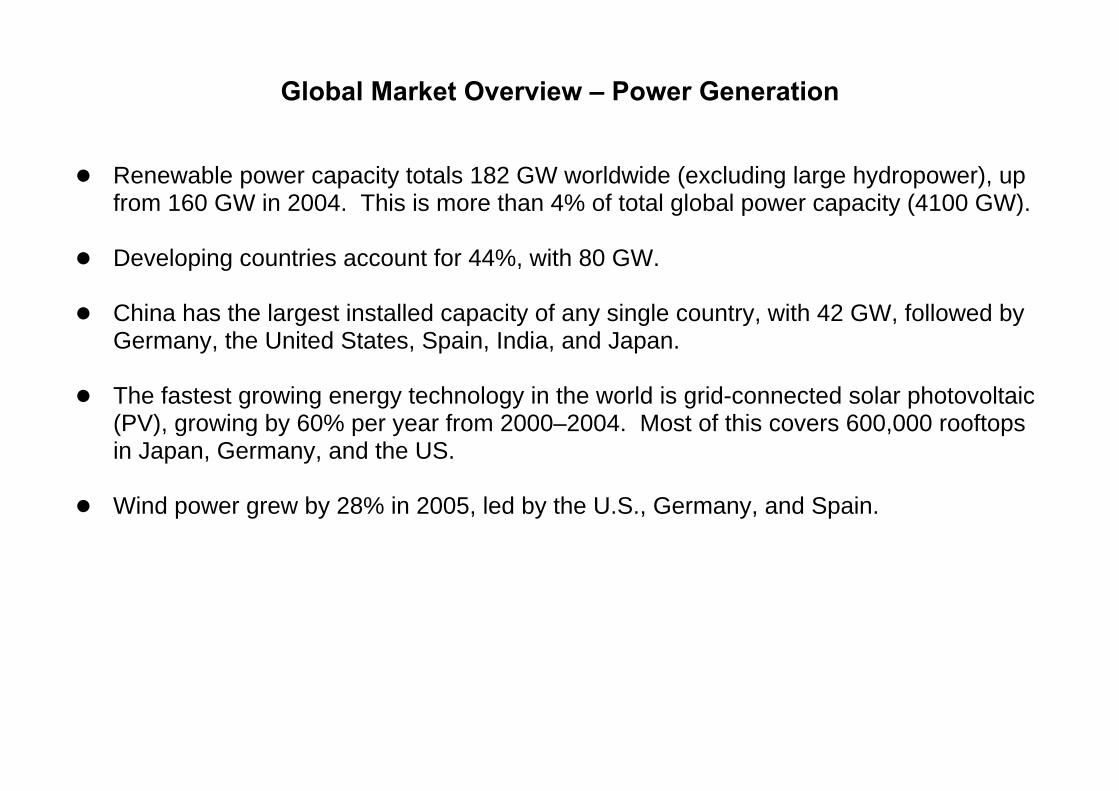
Renewable power capacity totals 182 GW worldwide (excluding large hydropower), up from 160 GW in 2004. This is more than 4% of total global power capacity (4100 GW).
Developing countries account for 44%, with 80 GW.
China has the largest installed capacity of any single country, with 42 GW, followed by
Germany, the United States, Spain, India, and Japan.
The fastest growing energy technology in the world is grid-connected solar photovoltaic (PV), growing by 60% per year from 2000–2004. Most of this covers 600,000 rooftops in Japan, Germany, and the US.
Wind power grew by 28% in 2005, led by the U.S., Germany, and Spain.
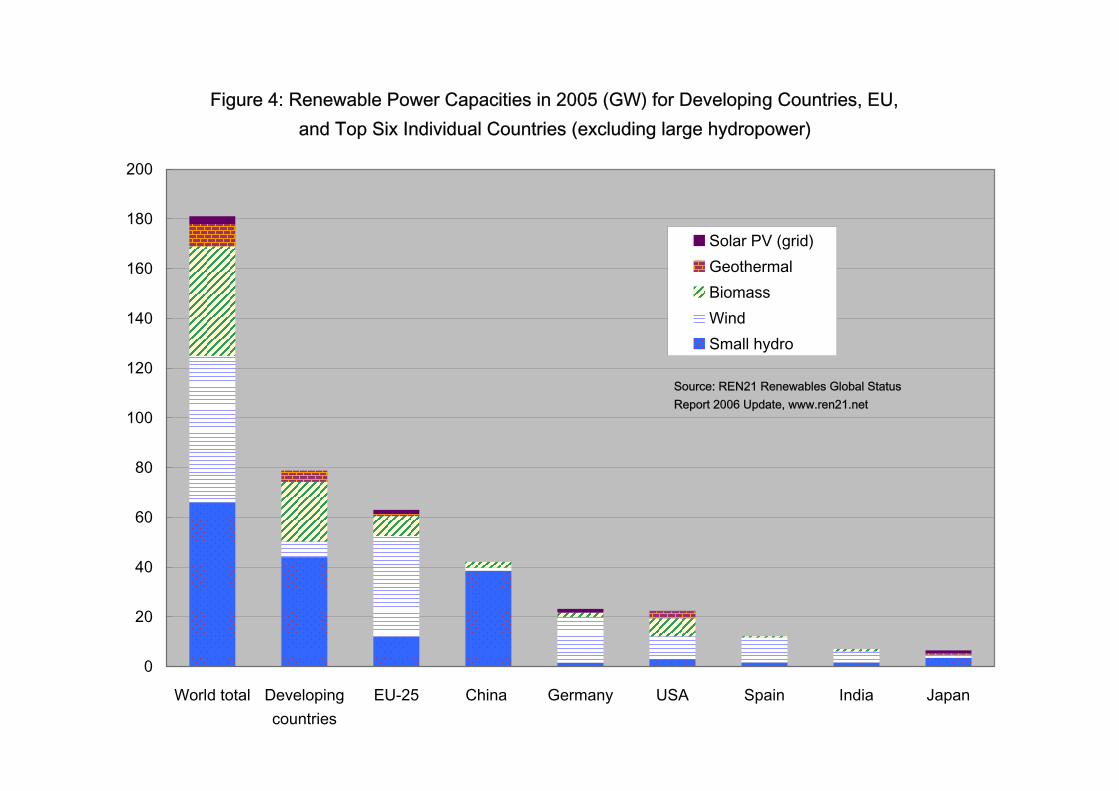
Figure 4: Renewable Power Capacities in 2005 (GW) for Developing Countries, EU,and Top Six Individual Countries (excluding large hydropower)
0
20
40
60
80
100
120
140
160
180
200
World total Developingcountries
EU-25 China Germany USA Spain India Japan
Solar PV (grid)GeothermalBiomassWindSmall hydro
Source: REN21 Renewables Global StatusReport 2006 Update, www.ren21.net
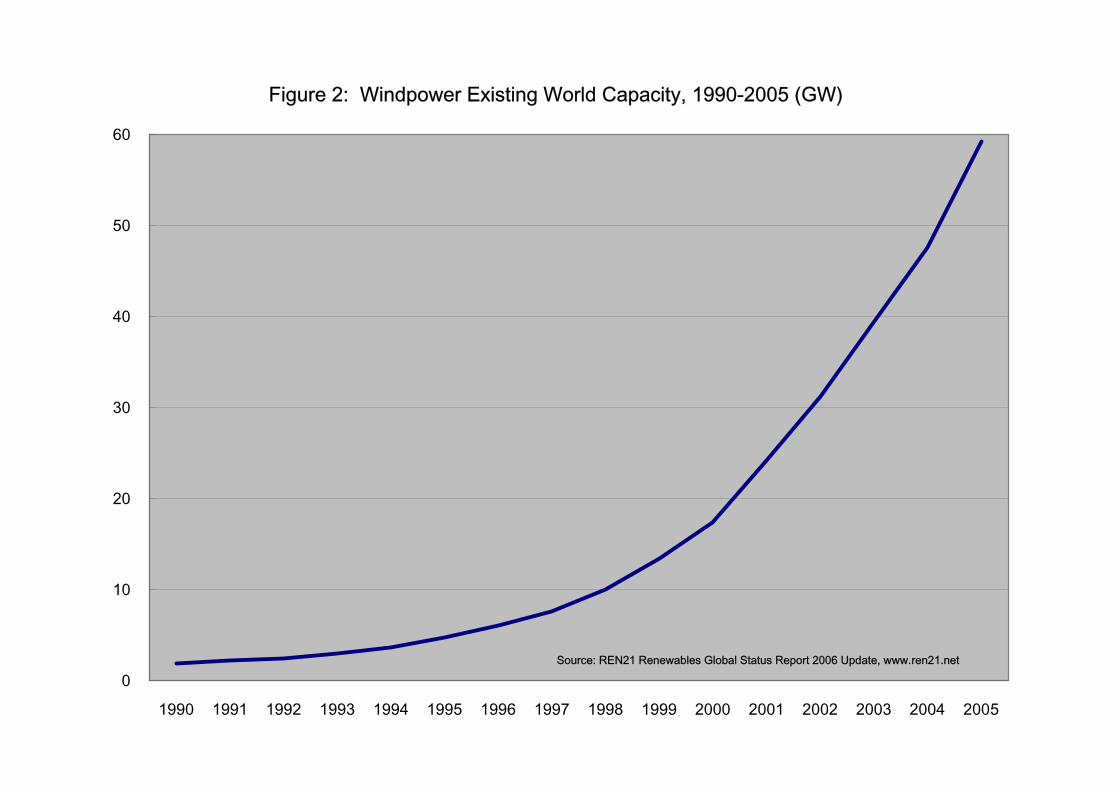
Figure 2: Windpower Existing World Capacity, 1990-2005 (GW)
0
10
20
30
40
50
60
1990 1991 1992 1993 1994 1995 1996 1997 1998 1999 2000 2001 2002 2003 2004 2005
Source: REN21 Renewables Global Status Report 2006 Update, www.ren21.net
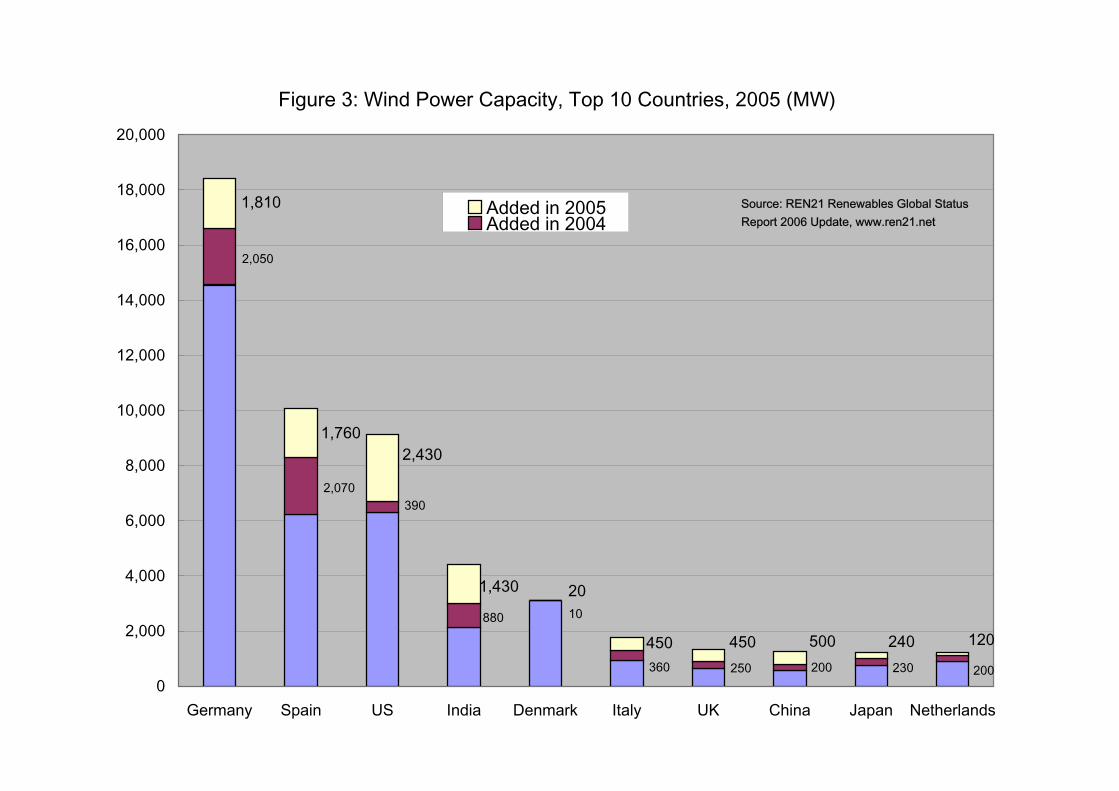
Figure 3: Wind Power Capacity, Top 10 Countries, 2005 (MW)
200230200250360
10880
3902,070
2,050
120240500450450
201,430
2,4301,760
1,810
0
2,000
4,000
6,000
8,000
10,000
12,000
14,000
16,000
18,000
20,000
Germany Spain US India Denmark Italy UK China Japan Netherlands
Added in 2005Added in 2004
Source: REN21 Renewables Global StatusReport 2006 Update, www.ren21.net
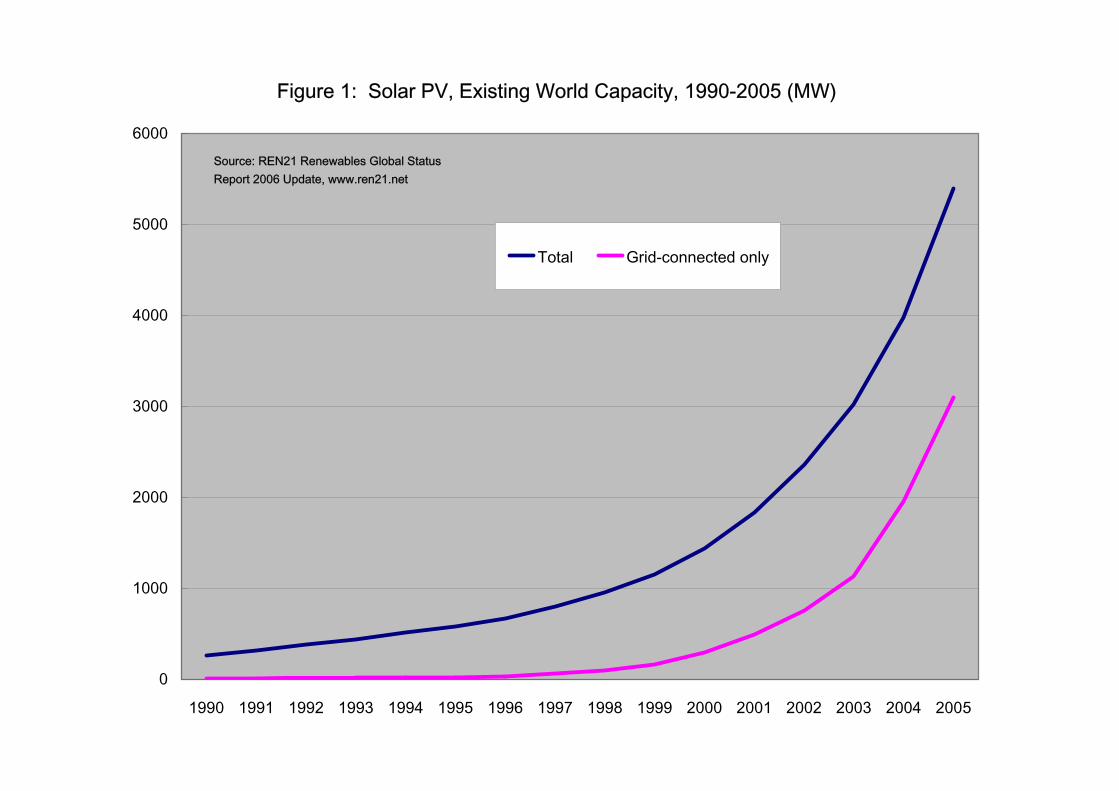
Figure 1: Solar PV, Existing World Capacity, 1990-2005 (MW)
0
1000
2000
3000
4000
5000
6000
1990 1991 1992 1993 1994 1995 1996 1997 1998 1999 2000 2001 2002 2003 2004 2005
Total Grid-connected only
Source: REN21 Renewables Global StatusReport 2006 Update, www.ren21.net
Global Market Overview – Hot Water/Heating
Rooftop solar collectors provide hot water to nearly 45 million households worldwide, most of these in China. China represents 80% of the global annual additions of solar hot water.
Geothermal heat pumps are a rapidly growing market, with over 2 million heat pumps
used in over 30 countries, mostly in Europe and the U.S.
Biomass-fueled heating provides five times more heat worldwide than solar and geothermal combined.
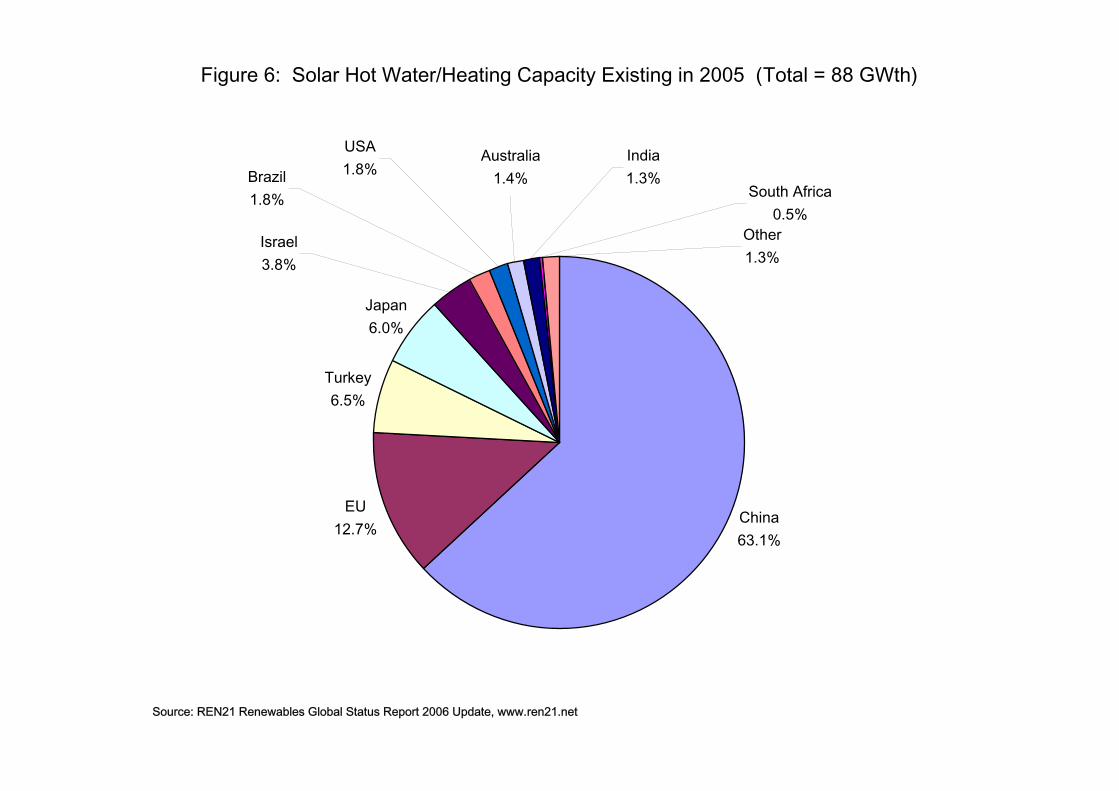
Figure 6: Solar Hot Water/Heating Capacity Existing in 2005 (Total = 88 GWth)
China63.1%
EU12.7%
Turkey6.5%
Japan6.0%
Brazil1.8%
USA1.8%
Australia1.4%
India1.3%
Other1.3%
South Africa0.5%
Israel3.8%
Source: REN21 Renewables Global Status Report 2006 Update, www.ren21.net
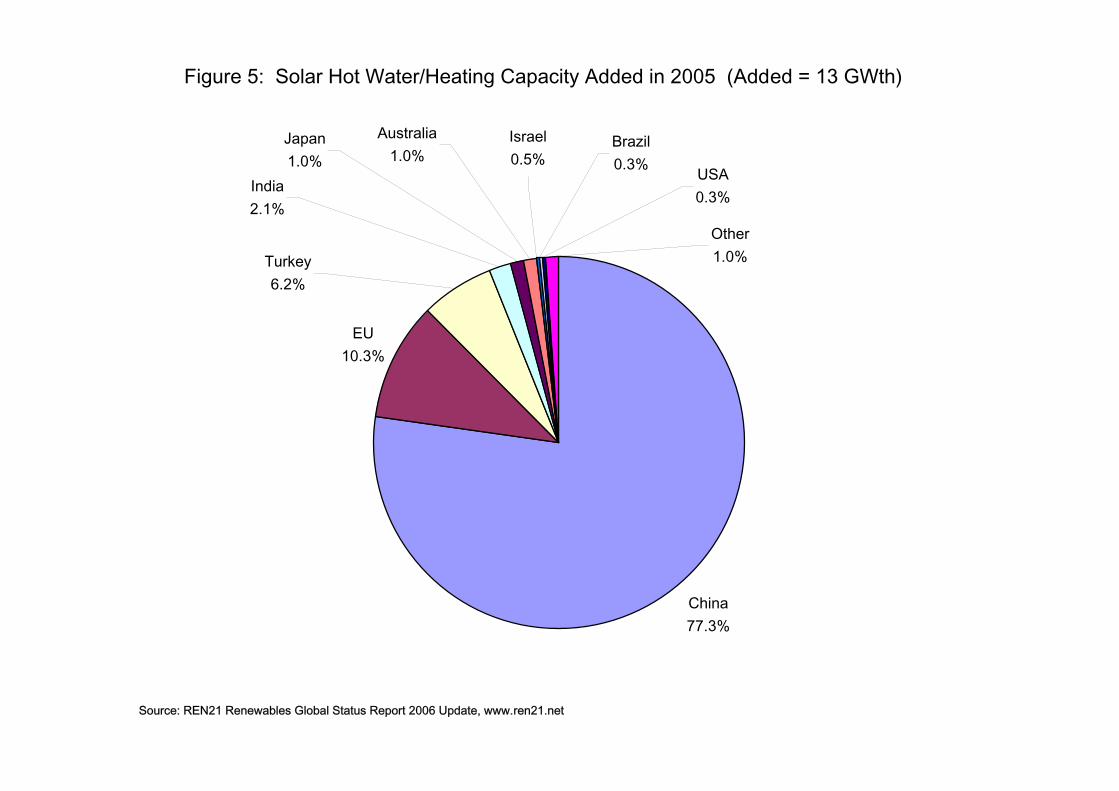
Figure 5: Solar Hot Water/Heating Capacity Added in 2005 (Added = 13 GWth)
China77.3%
EU10.3%
Turkey6.2%
India2.1%
Australia1.0%
Israel0.5%
Brazil0.3% USA
0.3%
Other1.0%
Japan1.0%
Source: REN21 Renewables Global Status Report 2006 Update, www.ren21.net

Global Market Overview – Biofuels
Production of ethanol was 33 billion liters in 2005, up from 30.5 billion liters in 2004.
Production of biodiesel was 3.9 billion liters in 2005, up from 2.1 billion liters in 2004.
Together, annual biofuels production compares to about 3 percent of the 1,300 billion liters of gasoline consumed globally.
Ethanol provided 41 percent of all (non-diesel) motor vehicle fuel consumed in Brazil in
2005.
Ethanol was being blended with 30 percent of all gasoline sold in the United States.
New investment in ethanol production facilities could reach $2 billion in 2006, with more than 45 plants under construction in the U.S. and Canada and a major program starting in Brazil that could increase output by 50% by 2009.
The investment value of new ethanol production facilities under construction or
announced through 2008 is more than $6 billion in Brazil, Canada, France, and the U.S.
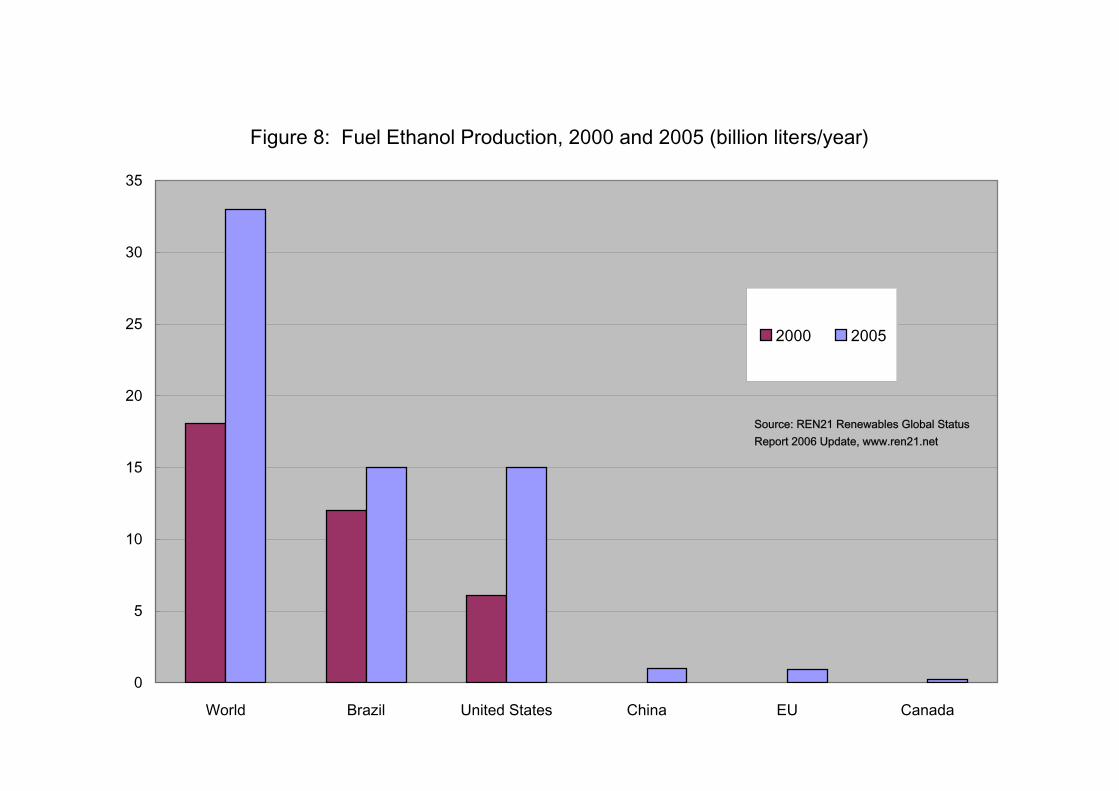
Figure 8: Fuel Ethanol Production, 2000 and 2005 (billion liters/year)
0
5
10
15
20
25
30
35
World Brazil United States China EU Canada
2000 2005
Source: REN21 Renewables Global StatusReport 2006 Update, www.ren21.net
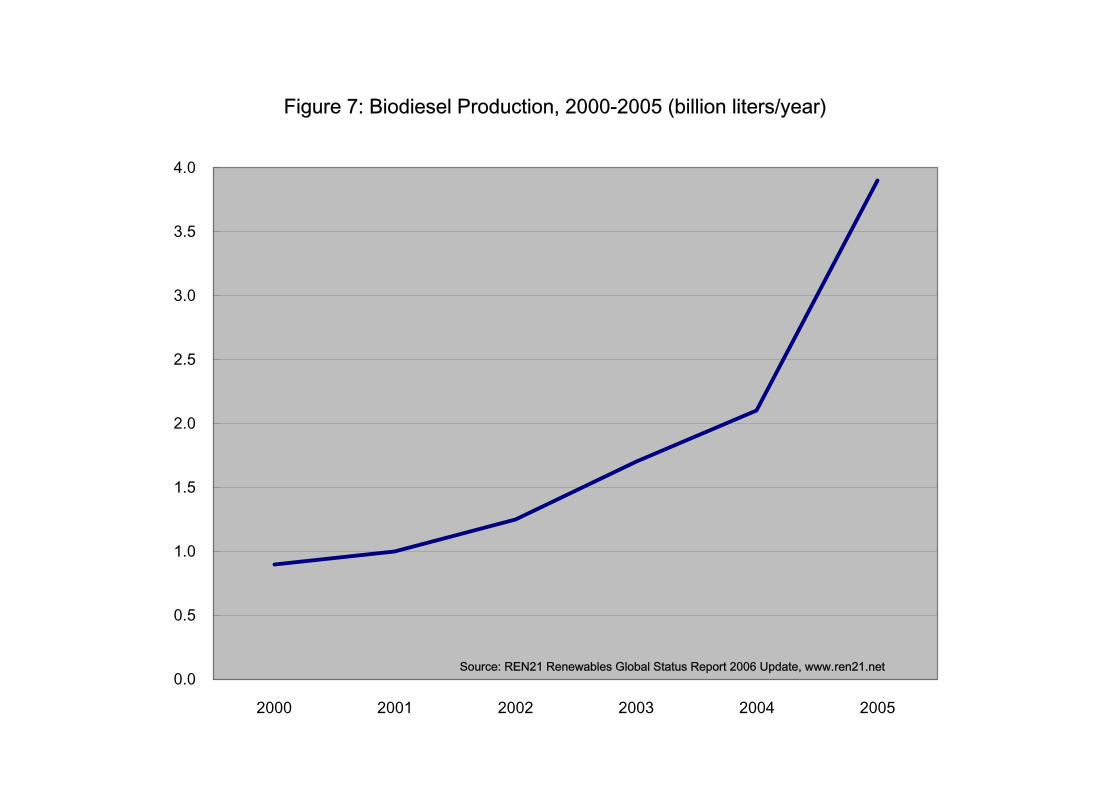
Figure 7: Biodiesel Production, 2000-2005 (billion liters/year)
0.0
0.5
1.0
1.5
2.0
2.5
3.0
3.5
4.0
2000 2001 2002 2003 2004 2005
Source: REN21 Renewables Global Status Report 2006 Update, www.ren21.net
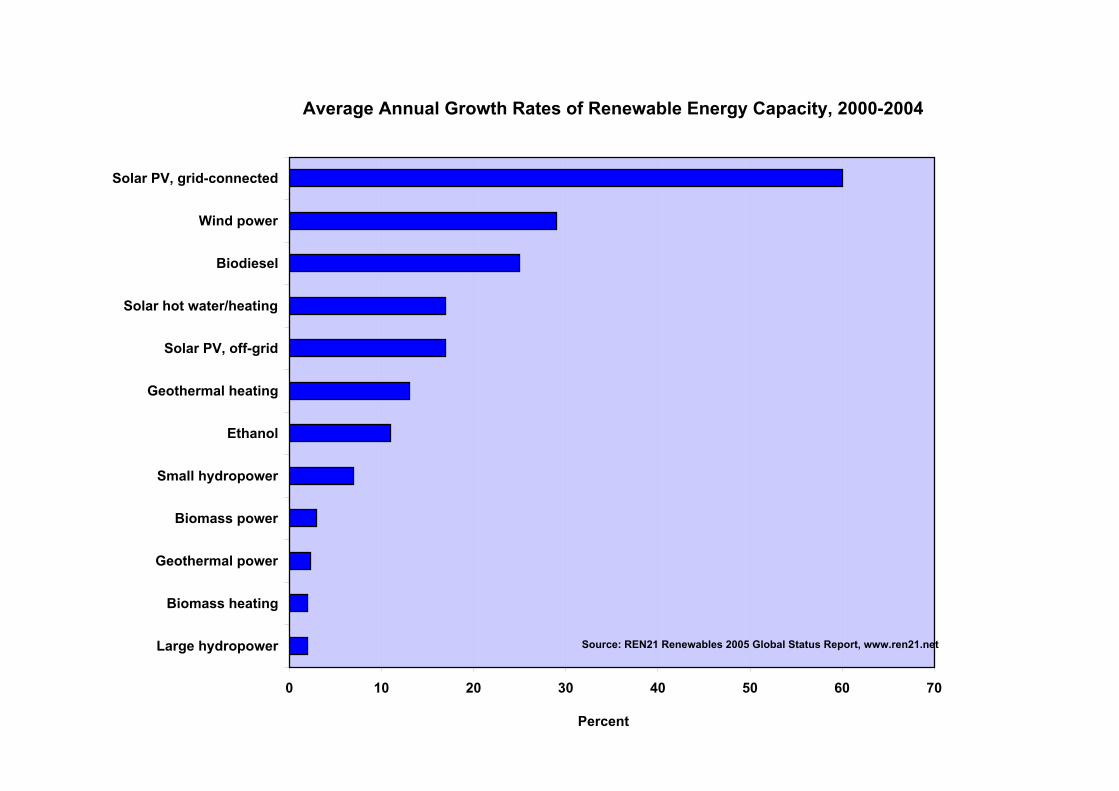
Average Annual Growth Rates of Renewable Energy Capacity, 2000-2004
0 10 20 30 40 50 60 70
Large hydropower
Biomass heating
Geothermal power
Biomass power
Small hydropower
Ethanol
Geothermal heating
Solar PV, off-grid
Solar hot water/heating
Biodiesel
Wind power
Solar PV, grid-connected
Percent
Source: REN21 Renewables 2005 Global Status Report, www.ren21.net
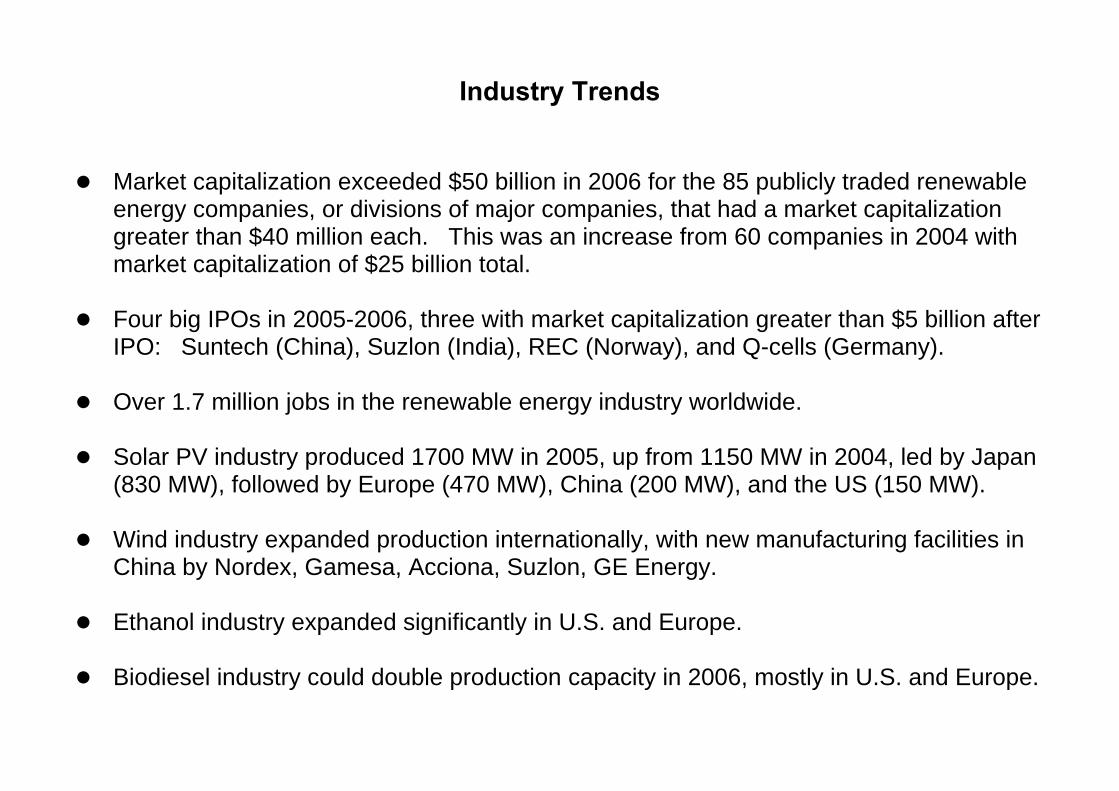
Industry Trends
Market capitalization exceeded $50 billion in 2006 for the 85 publicly traded renewable energy companies, or divisions of major companies, that had a market capitalization greater than $40 million each. This was an increase from 60 companies in 2004 with market capitalization of $25 billion total.
Four big IPOs in 2005-2006, three with market capitalization greater than $5 billion after
IPO: Suntech (China), Suzlon (India), REC (Norway), and Q-cells (Germany).
Over 1.7 million jobs in the renewable energy industry worldwide.
Solar PV industry produced 1700 MW in 2005, up from 1150 MW in 2004, led by Japan (830 MW), followed by Europe (470 MW), China (200 MW), and the US (150 MW).
Wind industry expanded production internationally, with new manufacturing facilities in
China by Nordex, Gamesa, Acciona, Suzlon, GE Energy.
Ethanol industry expanded significantly in U.S. and Europe.
Biodiesel industry could double production capacity in 2006, mostly in U.S. and Europe.
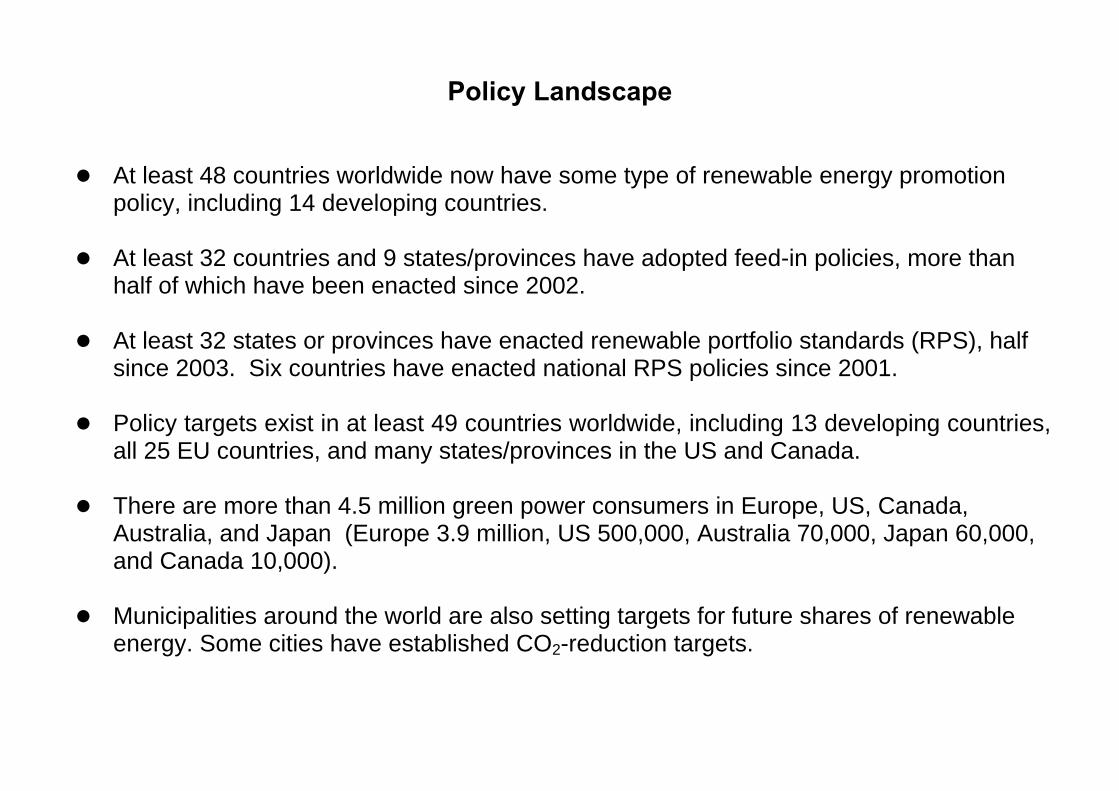
Policy Landscape
At least 48 countries worldwide now have some type of renewable energy promotion policy, including 14 developing countries.
At least 32 countries and 9 states/provinces have adopted feed-in policies, more than
half of which have been enacted since 2002.
At least 32 states or provinces have enacted renewable portfolio standards (RPS), half since 2003. Six countries have enacted national RPS policies since 2001.
Policy targets exist in at least 49 countries worldwide, including 13 developing countries, all 25 EU countries, and many states/provinces in the US and Canada.
There are more than 4.5 million green power consumers in Europe, US, Canada,
Australia, and Japan (Europe 3.9 million, US 500,000, Australia 70,000, Japan 60,000, and Canada 10,000).
Municipalities around the world are also setting targets for future shares of renewable
energy. Some cities have established CO2-reduction targets.
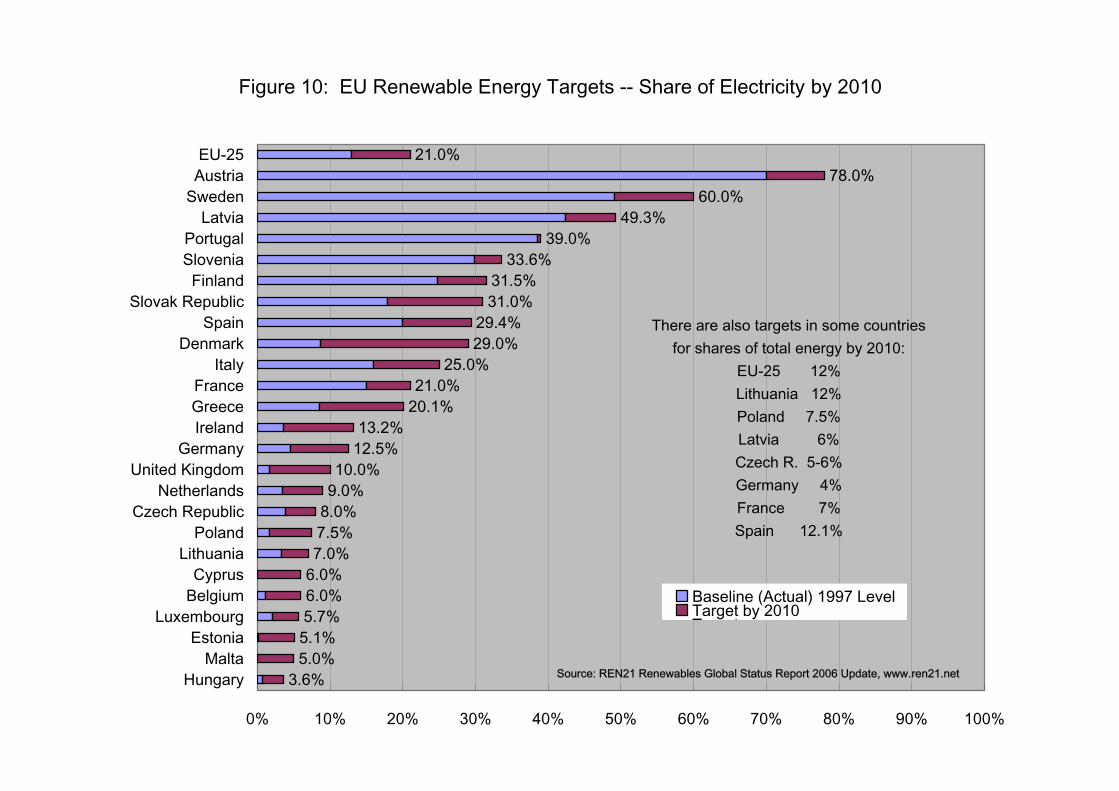
Figure 10: EU Renewable Energy Targets -- Share of Electricity by 2010
3.6%5.0%5.1%5.7%6.0%6.0%7.0%7.5%8.0%9.0%10.0%
12.5%13.2%
20.1%21.0%
25.0%29.0%29.4%
31.0%31.5%
33.6%39.0%
49.3%60.0%
78.0%21.0%
0% 10% 20% 30% 40% 50% 60% 70% 80% 90% 100%
HungaryMalta
EstoniaLuxembourg
BelgiumCyprus
LithuaniaPoland
Czech RepublicNetherlands
United KingdomGermany
IrelandGreeceFrance
ItalyDenmark
SpainSlovak Republic
FinlandSloveniaPortugal
LatviaSwedenAustriaEU-25
Baseline (Actual) 1997 LevelTarget by 2010T t
There are also targets in some countriesfor shares of total energy by 2010:
EU-25 12%Lithuania 12%Poland 7.5%Latvia 6%Czech R. 5-6%Germany 4%France 7%Spain 12.1%
Source: REN21 Renewables Global Status Report 2006 Update, www.ren21.net
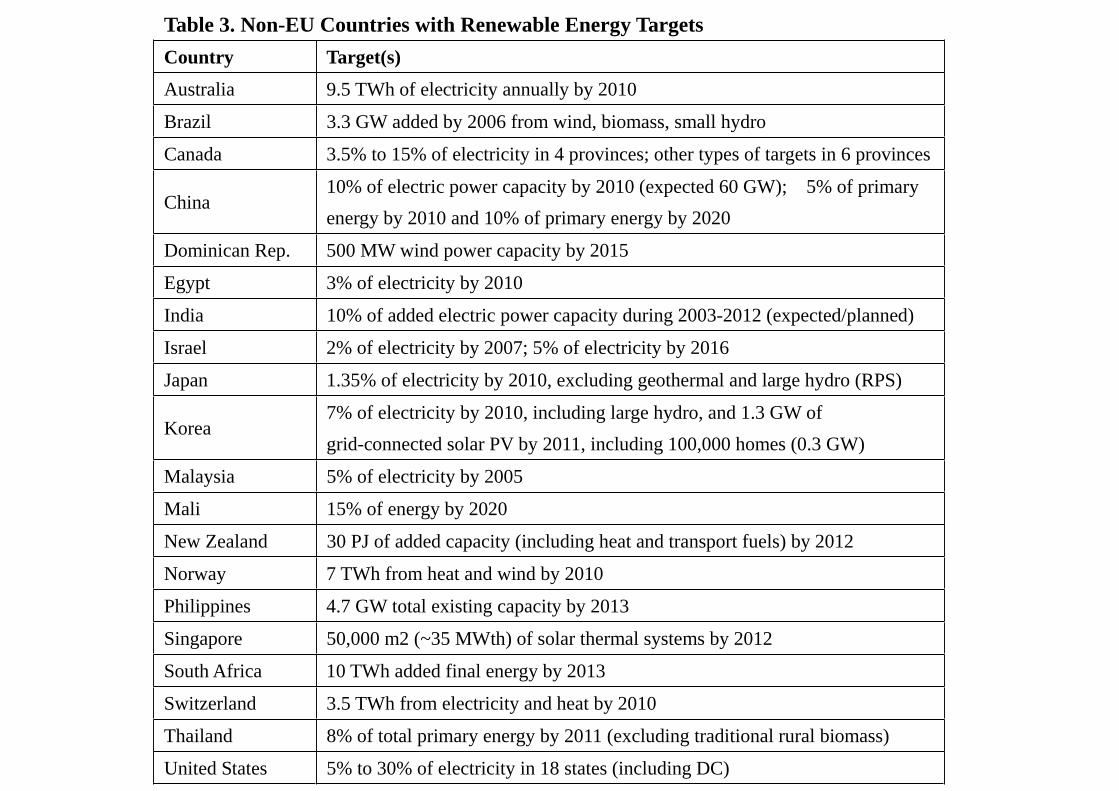
Table 3. Non-EU Countries with Renewable Energy Targets
Country Target(s)
Australia 9.5 TWh of electricity annually by 2010
Brazil 3.3 GW added by 2006 from wind, biomass, small hydro
Canada 3.5% to 15% of electricity in 4 provinces; other types of targets in 6 provinces
China10% of electric power capacity by 2010 (expected 60 GW); 5% of primary
energy by 2010 and 10% of primary energy by 2020
Dominican Rep. 500 MW wind power capacity by 2015
Egypt 3% of electricity by 2010
India 10% of added electric power capacity during 2003-2012 (expected/planned)
Israel 2% of electricity by 2007; 5% of electricity by 2016
Japan 1.35% of electricity by 2010, excluding geothermal and large hydro (RPS)
Korea7% of electricity by 2010, including large hydro, and 1.3 GW of
grid-connected solar PV by 2011, including 100,000 homes (0.3 GW)
Malaysia 5% of electricity by 2005
Mali 15% of energy by 2020
New Zealand 30 PJ of added capacity (including heat and transport fuels) by 2012
Norway 7 TWh from heat and wind by 2010
Philippines 4.7 GW total existing capacity by 2013
Singapore 50,000 m2 (~35 MWth) of solar thermal systems by 2012
South Africa 10 TWh added final energy by 2013
Switzerland 3.5 TWh from electricity and heat by 2010
Thailand 8% of total primary energy by 2011 (excluding traditional rural biomass)
United States 5% to 30% of electricity in 18 states (including DC)
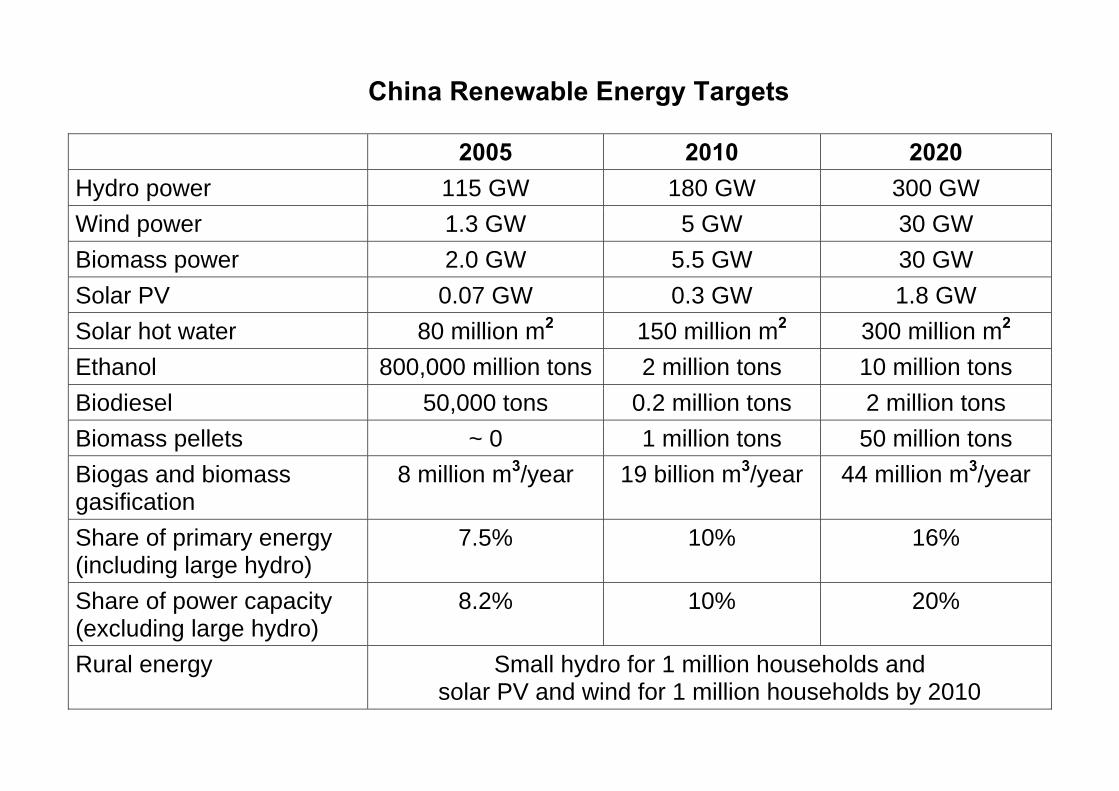
China Renewable Energy Targets
2005 2010 2020 Hydro power 115 GW 180 GW 300 GW Wind power 1.3 GW 5 GW 30 GW Biomass power 2.0 GW 5.5 GW 30 GW Solar PV 0.07 GW 0.3 GW 1.8 GW Solar hot water 80 million m2 150 million m2 300 million m2 Ethanol 800,000 million tons 2 million tons 10 million tons Biodiesel 50,000 tons 0.2 million tons 2 million tons Biomass pellets ~ 0 1 million tons 50 million tons Biogas and biomass gasification
8 million m3/year 19 billion m3/year 44 million m3/year
Share of primary energy (including large hydro)
7.5% 10% 16%
Share of power capacity (excluding large hydro)
8.2% 10% 20%
Rural energy Small hydro for 1 million households and solar PV and wind for 1 million households by 2010
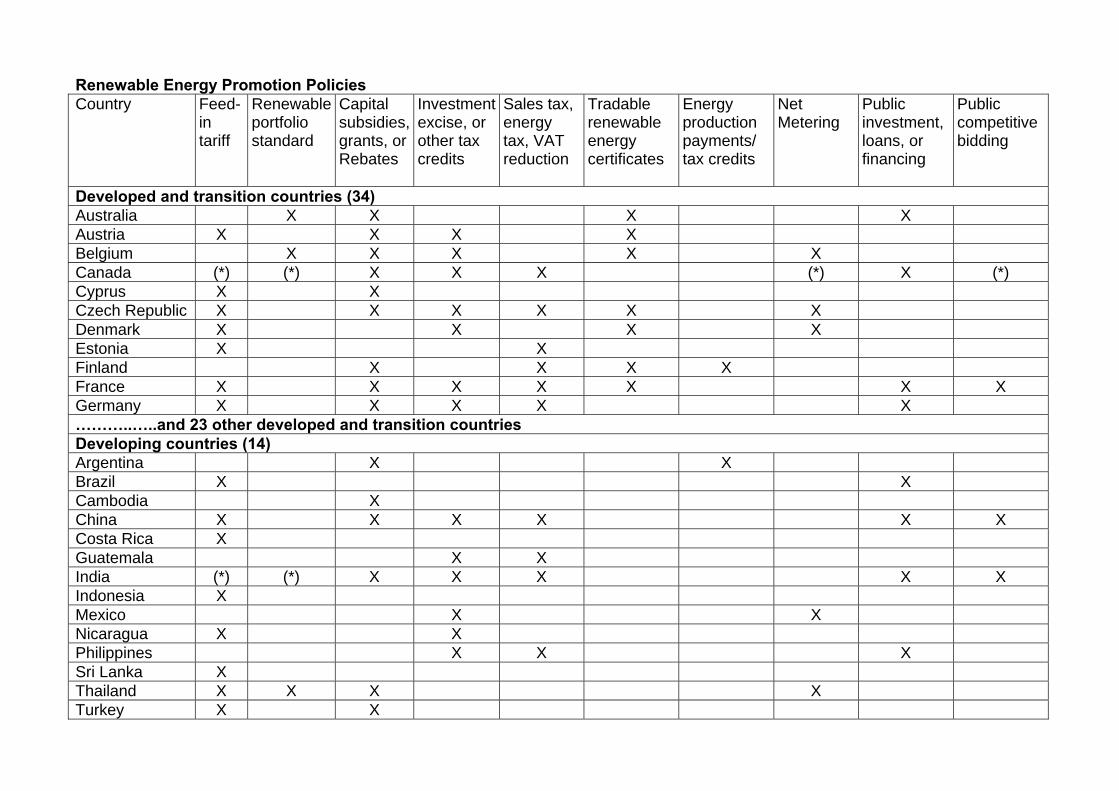
Renewable Energy Promotion Policies Country
Feed- in tariff
Renewable portfolio standard
Capital subsidies, grants, orRebates
Investment excise, or other tax credits
Sales tax, energy tax, VAT reduction
Tradable renewable energy certificates
Energy production payments/ tax credits
Net Metering
Public investment, loans, or financing
Public competitive bidding
Developed and transition countries (34) Australia X X X X Austria X X X X Belgium X X X X X Canada (*) (*) X X X (*) X (*) Cyprus X X Czech Republic X X X X X X Denmark X X X X Estonia X X Finland X X X X France X X X X X X X Germany X X X X X ………..…..and 23 other developed and transition countries Developing countries (14) Argentina X X Brazil X X Cambodia X China X X X X X X Costa Rica X Guatemala X X India (*) (*) X X X X X Indonesia X Mexico X X Nicaragua X X Philippines X X X Sri Lanka X Thailand X X X X Turkey X X
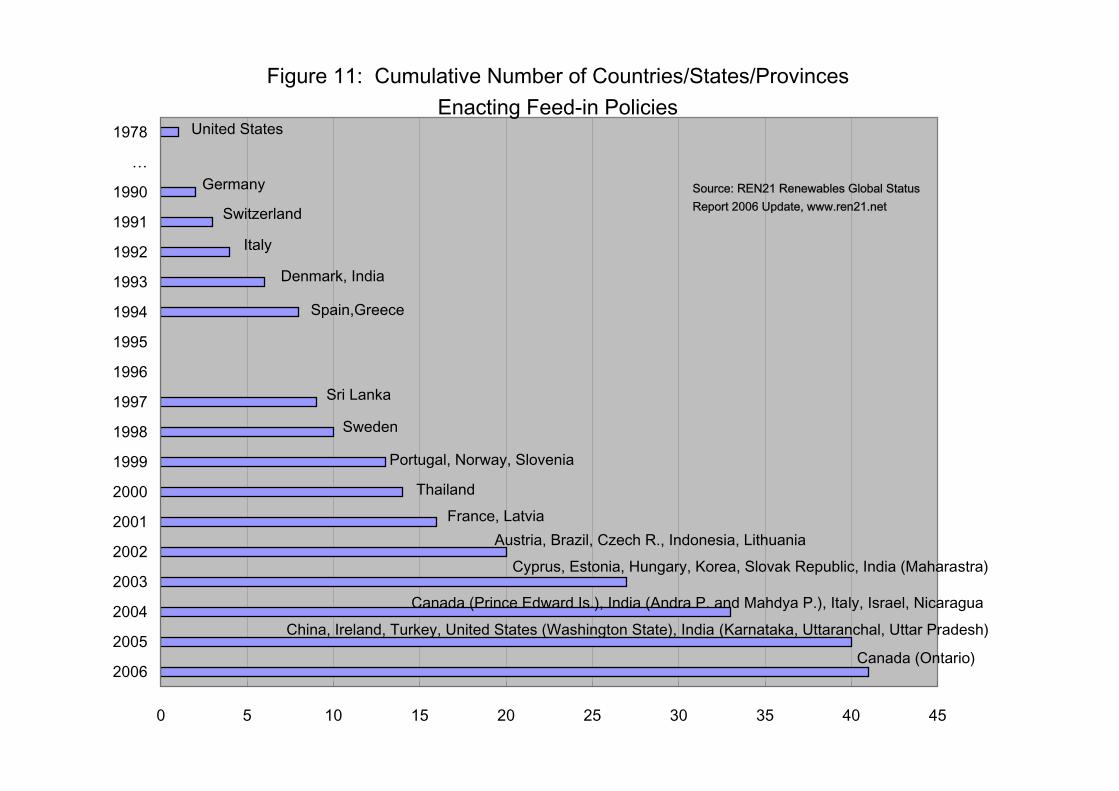
Figure 11: Cumulative Number of Countries/States/ProvincesEnacting Feed-in Policies
0 5 10 15 20 25 30 35 40 45
2006
2005
2004
2003
2002
2001
2000
1999
1998
1997
1996
1995
1994
1993
1992
1991
1990
…
1978 United States
Germany
Denmark, India
Spain,Greece
Sri Lanka
Portugal, Norway, Slovenia
Thailand
Sweden
France, LatviaAustria, Brazil, Czech R., Indonesia, Lithuania
Cyprus, Estonia, Hungary, Korea, Slovak Republic, India (Maharastra)
Canada (Prince Edward Is.), India (Andra P. and Mahdya P.), Italy, Israel, NicaraguaChina, Ireland, Turkey, United States (Washington State), India (Karnataka, Uttaranchal, Uttar Pradesh)
Switzerland
Italy
Canada (Ontario)
Source: REN21 Renewables Global StatusReport 2006 Update, www.ren21.net
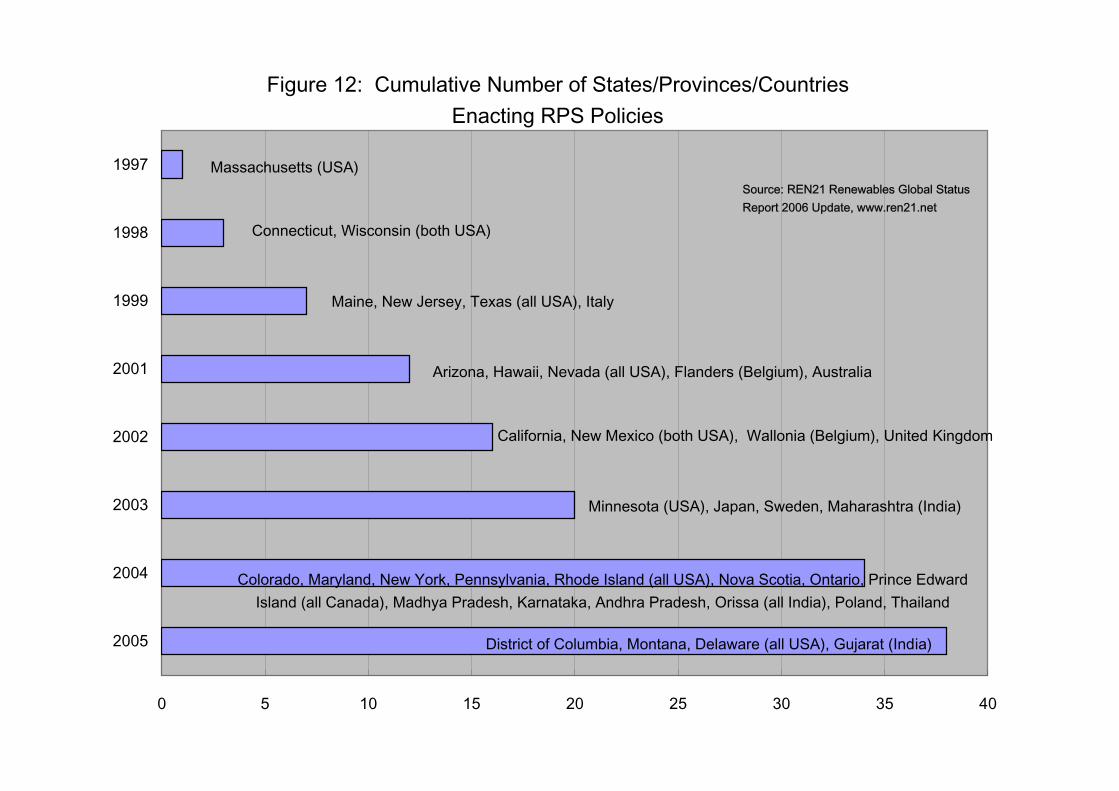
Figure 12: Cumulative Number of States/Provinces/CountriesEnacting RPS Policies
0 5 10 15 20 25 30 35 40
2005
2004
2003
2002
2001
1999
1998
1997 Massachusetts (USA)
Connecticut, Wisconsin (both USA)
Maine, New Jersey, Texas (all USA), Italy
Arizona, Hawaii, Nevada (all USA), Flanders (Belgium), Australia
California, New Mexico (both USA), Wallonia (Belgium), United Kingdom
Minnesota (USA), Japan, Sweden, Maharashtra (India)
Colorado, Maryland, New York, Pennsylvania, Rhode Island (all USA), Nova Scotia, Ontario, Prince EdwardIsland (all Canada), Madhya Pradesh, Karnataka, Andhra Pradesh, Orissa (all India), Poland, Thailand
District of Columbia, Montana, Delaware (all USA), Gujarat (India)
Source: REN21 Renewables Global StatusReport 2006 Update, www.ren21.net
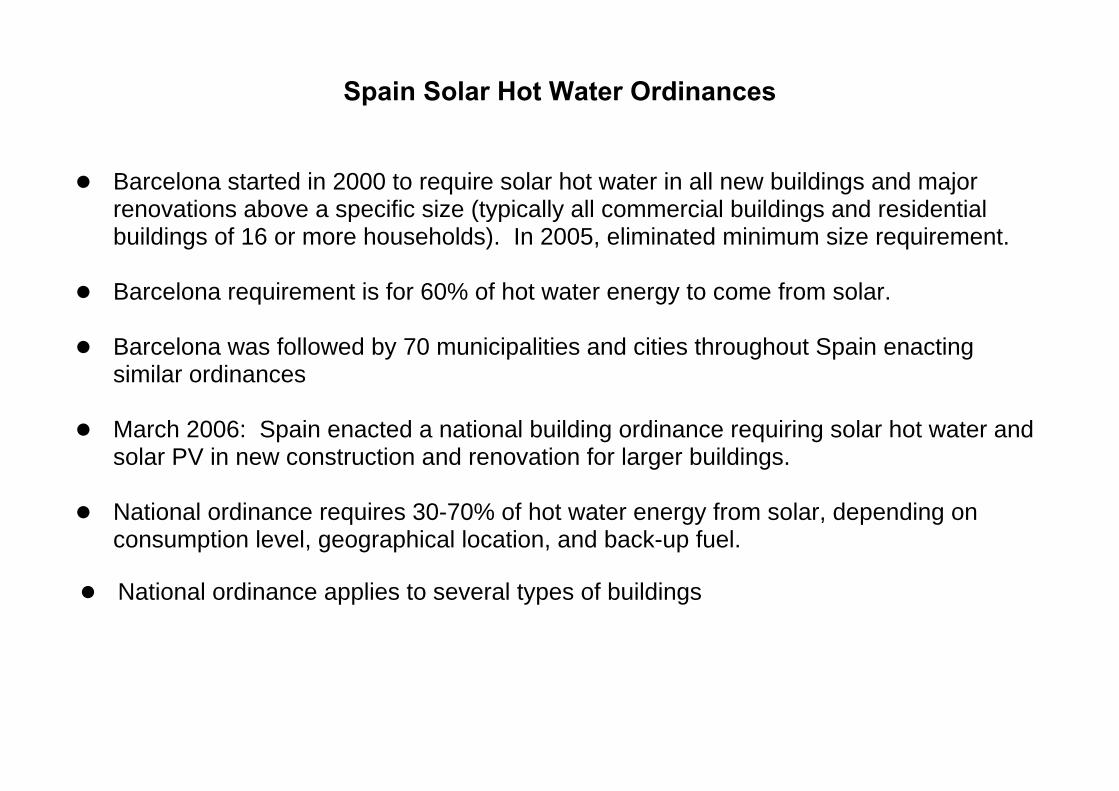
Spain Solar Hot Water Ordinances
Barcelona started in 2000 to require solar hot water in all new buildings and major renovations above a specific size (typically all commercial buildings and residential buildings of 16 or more households). In 2005, eliminated minimum size requirement.
Barcelona requirement is for 60% of hot water energy to come from solar.
Barcelona was followed by 70 municipalities and cities throughout Spain enacting
similar ordinances
March 2006: Spain enacted a national building ordinance requiring solar hot water and solar PV in new construction and renovation for larger buildings.
National ordinance requires 30-70% of hot water energy from solar, depending on
consumption level, geographical location, and back-up fuel.
National ordinance applies to several types of buildings
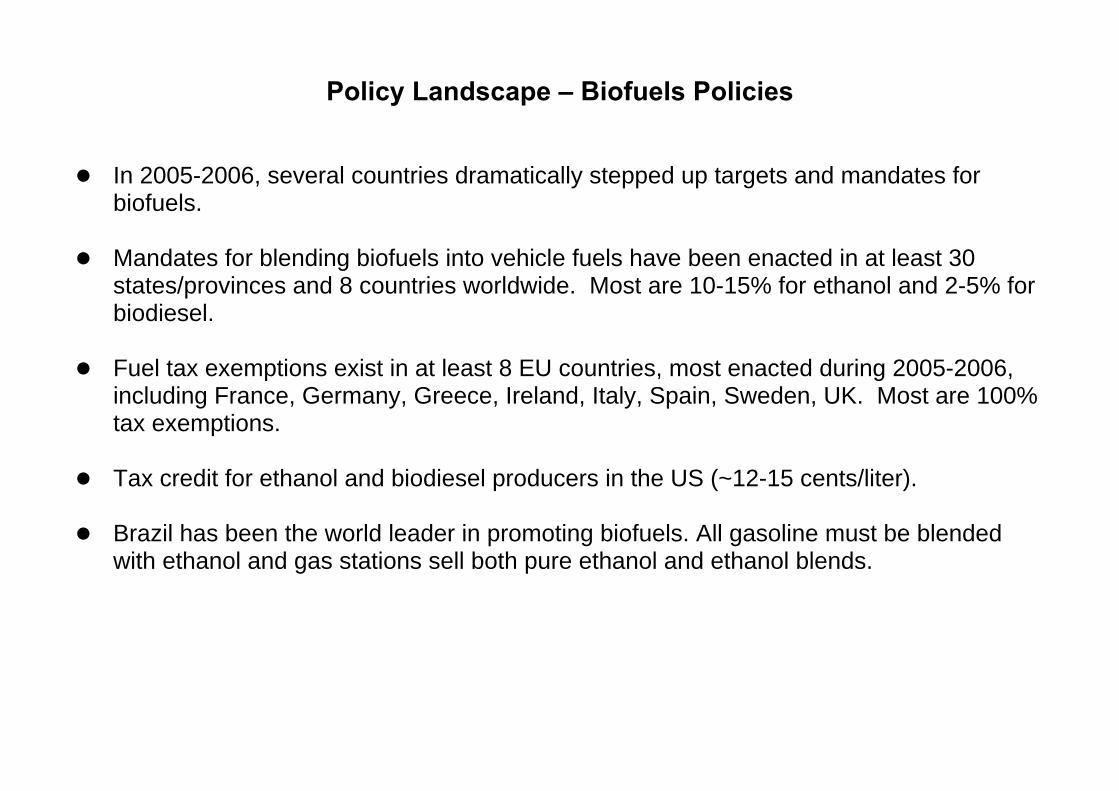
Policy Landscape – Biofuels Policies
In 2005-2006, several countries dramatically stepped up targets and mandates for biofuels.
Mandates for blending biofuels into vehicle fuels have been enacted in at least 30
states/provinces and 8 countries worldwide. Most are 10-15% for ethanol and 2-5% for biodiesel.
Fuel tax exemptions exist in at least 8 EU countries, most enacted during 2005-2006,
including France, Germany, Greece, Ireland, Italy, Spain, Sweden, UK. Most are 100% tax exemptions.
Tax credit for ethanol and biodiesel producers in the US (~12-15 cents/liter).
Brazil has been the world leader in promoting biofuels. All gasoline must be blended
with ethanol and gas stations sell both pure ethanol and ethanol blends.
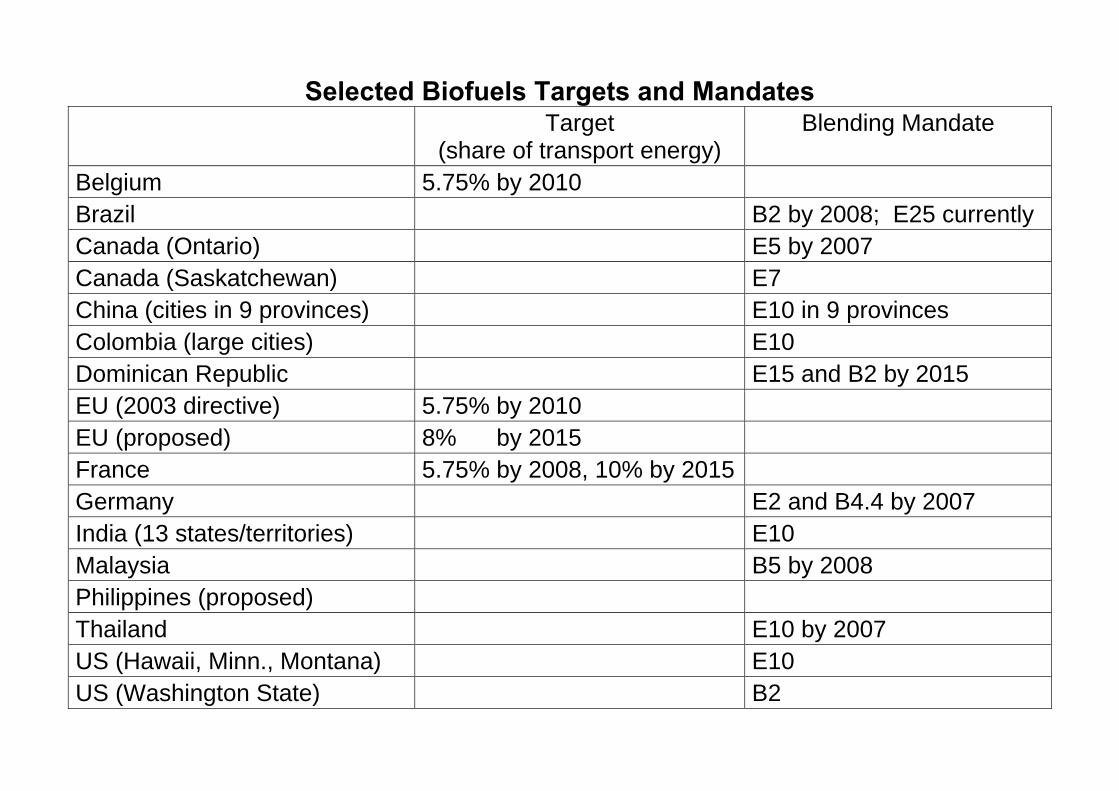
Selected Biofuels Targets and Mandates Target
(share of transport energy) Blending Mandate
Belgium 5.75% by 2010 Brazil B2 by 2008; E25 currently Canada (Ontario) E5 by 2007 Canada (Saskatchewan) E7 China (cities in 9 provinces) E10 in 9 provinces Colombia (large cities) E10 Dominican Republic E15 and B2 by 2015 EU (2003 directive) 5.75% by 2010 EU (proposed) 8% by 2015 France 5.75% by 2008, 10% by 2015 Germany E2 and B4.4 by 2007 India (13 states/territories) E10 Malaysia B5 by 2008 Philippines (proposed) Thailand E10 by 2007 US (Hawaii, Minn., Montana) E10 US (Washington State) B2
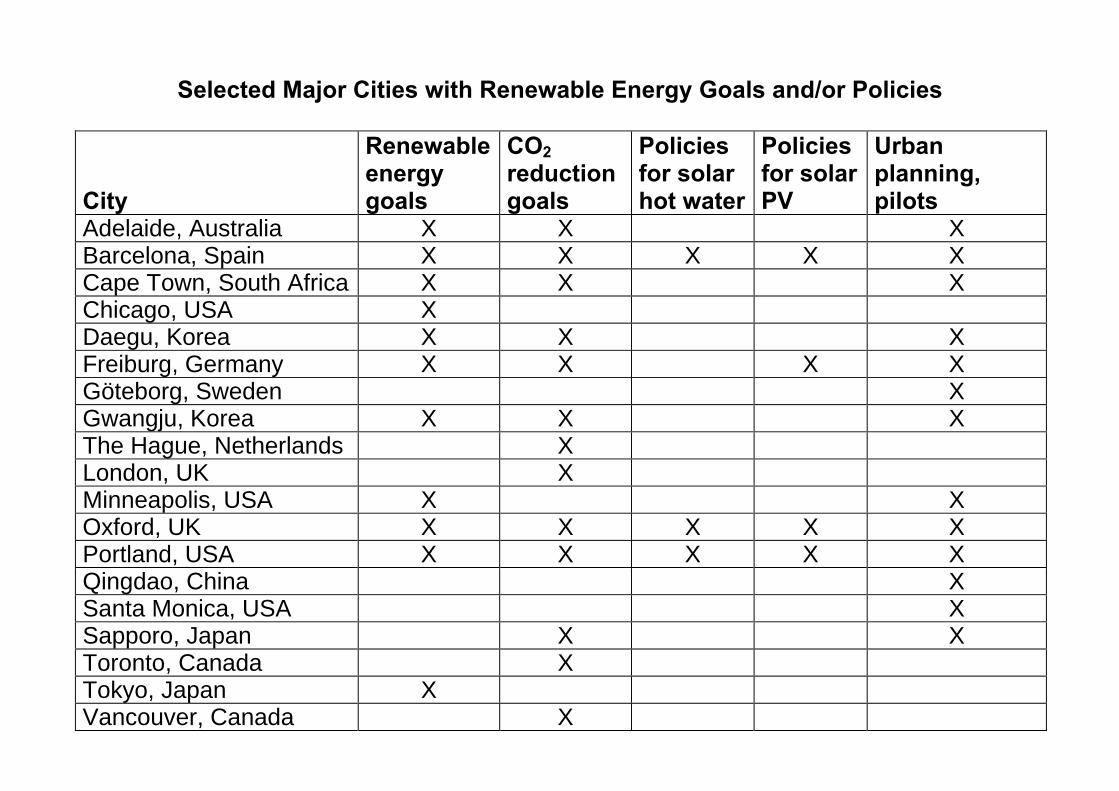
Selected Major Cities with Renewable Energy Goals and/or Policies City
Renewable energy goals
CO2 reduction goals
Policies for solar hot water
Policies for solar PV
Urban planning, pilots
Adelaide, Australia X X X Barcelona, Spain X X X X X Cape Town, South Africa X X X Chicago, USA X Daegu, Korea X X X Freiburg, Germany X X X X Göteborg, Sweden X Gwangju, Korea X X X The Hague, Netherlands X London, UK X Minneapolis, USA X X Oxford, UK X X X X X Portland, USA X X X X X Qingdao, China X Santa Monica, USA X Sapporo, Japan X X Toronto, Canada X Tokyo, Japan X Vancouver, Canada X
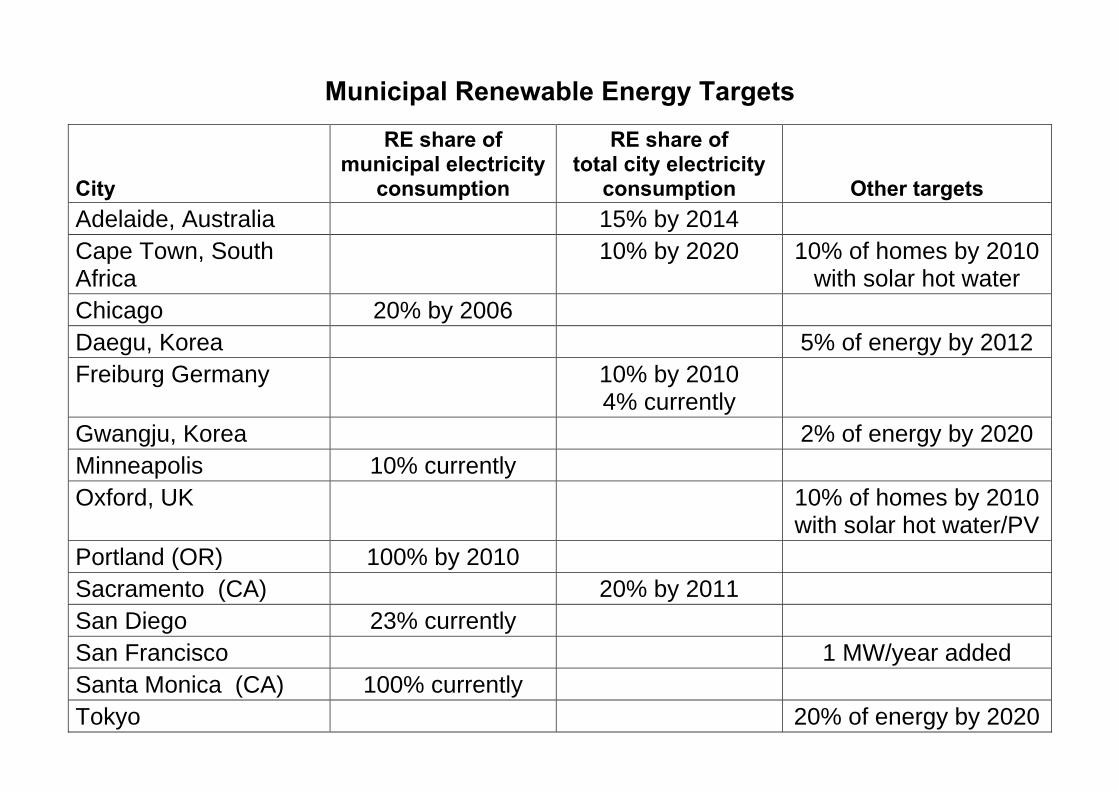
Municipal Renewable Energy Targets
City
RE share of municipal electricity
consumption
RE share of total city electricity
consumption
Other targets Adelaide, Australia 15% by 2014 Cape Town, South Africa
10% by 2020
10% of homes by 2010 with solar hot water
Chicago 20% by 2006 Daegu, Korea 5% of energy by 2012 Freiburg Germany 10% by 2010
4% currently
Gwangju, Korea 2% of energy by 2020 Minneapolis 10% currently Oxford, UK 10% of homes by 2010
with solar hot water/PV Portland (OR) 100% by 2010 Sacramento (CA) 20% by 2011 San Diego 23% currently San Francisco 1 MW/year added Santa Monica (CA) 100% currently Tokyo 20% of energy by 2020
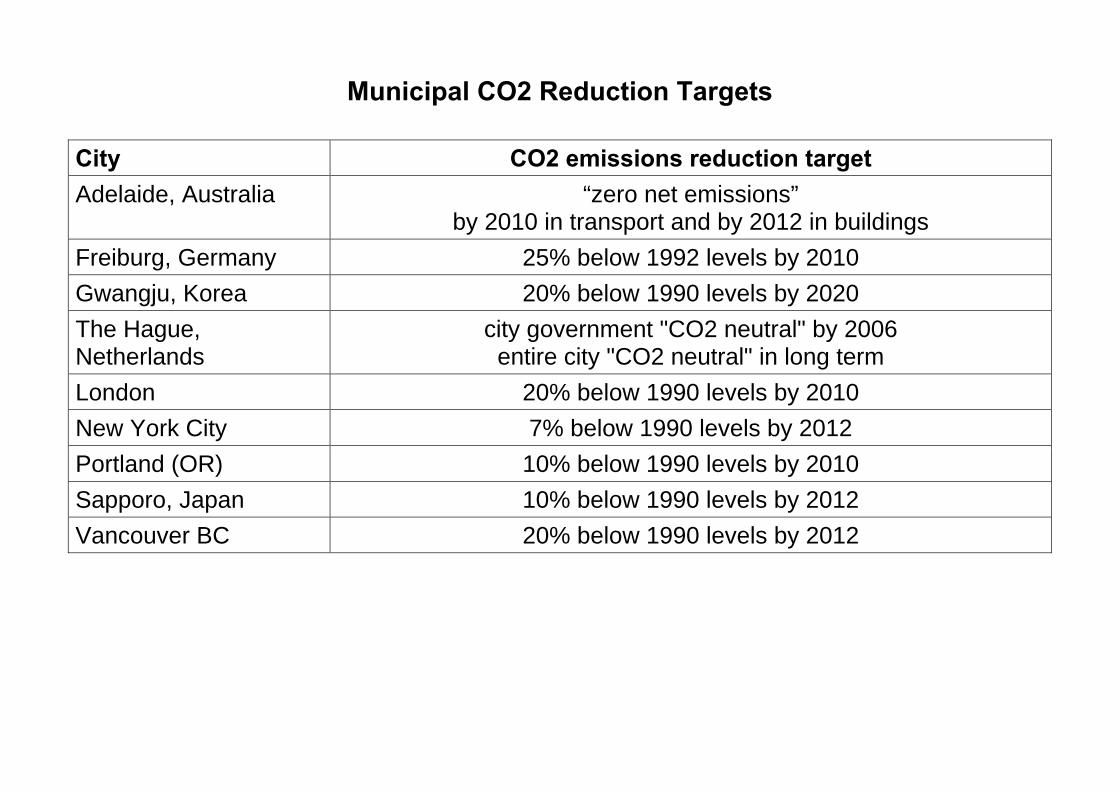
Municipal CO2 Reduction Targets
City CO2 emissions reduction target Adelaide, Australia “zero net emissions”
by 2010 in transport and by 2012 in buildings Freiburg, Germany 25% below 1992 levels by 2010 Gwangju, Korea 20% below 1990 levels by 2020 The Hague, Netherlands
city government "CO2 neutral" by 2006 entire city "CO2 neutral" in long term
London 20% below 1990 levels by 2010 New York City 7% below 1990 levels by 2012 Portland (OR) 10% below 1990 levels by 2010 Sapporo, Japan 10% below 1990 levels by 2012 Vancouver BC 20% below 1990 levels by 2012
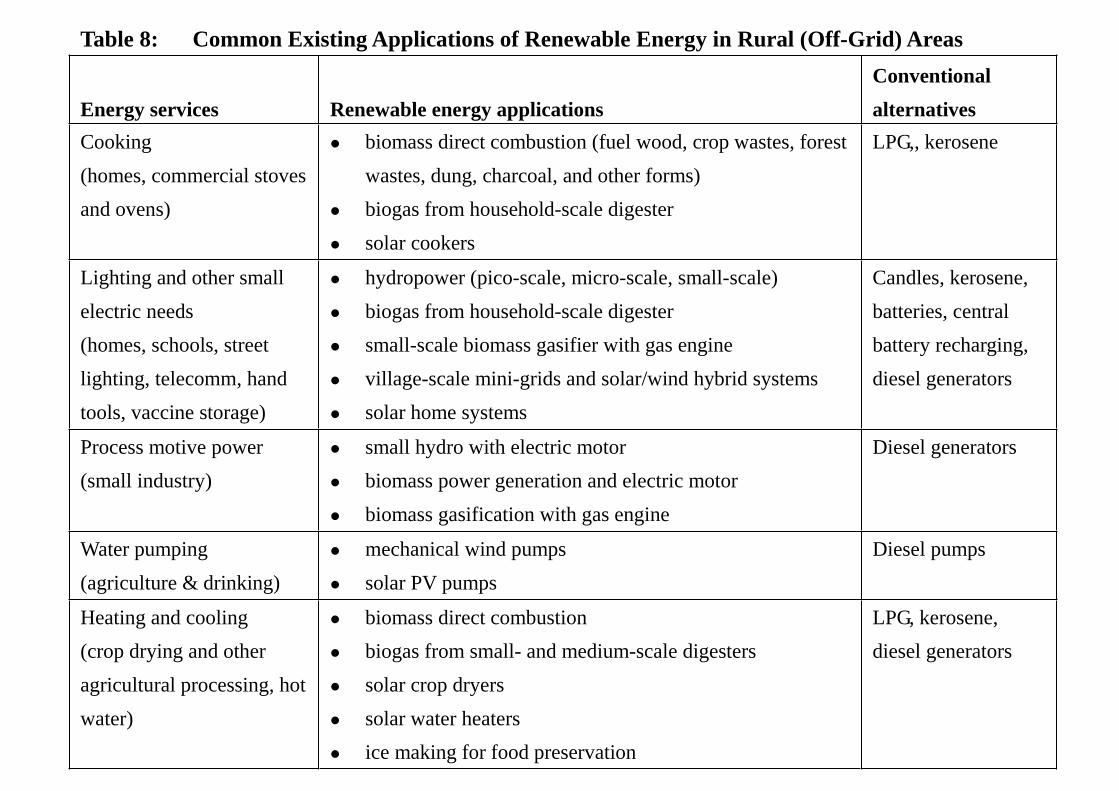
Table 8: Common Existing Applications of Renewable Energy in Rural (Off-Grid) Areas
Energy services Renewable energy applications
Conventional
alternatives
Cooking
(homes, commercial stoves
and ovens)
biomass direct combustion (fuel wood, crop wastes, forest
wastes, dung, charcoal, and other forms)
biogas from household-scale digester
solar cookers
LPG,, kerosene
Lighting and other small
electric needs
(homes, schools, street
lighting, telecomm, hand
tools, vaccine storage)
hydropower (pico-scale, micro-scale, small-scale)
biogas from household-scale digester
small-scale biomass gasifier with gas engine
village-scale mini-grids and solar/wind hybrid systems
solar home systems
Candles, kerosene,
batteries, central
battery recharging,
diesel generators
Process motive power
(small industry)
small hydro with electric motor
biomass power generation and electric motor
biomass gasification with gas engine
Diesel generators
Water pumping
(agriculture & drinking)
mechanical wind pumps
solar PV pumps
Diesel pumps
Heating and cooling
(crop drying and other
agricultural processing, hot
water)
biomass direct combustion
biogas from small- and medium-scale digesters
solar crop dryers
solar water heaters
ice making for food preservation
LPG, kerosene,
diesel generators
Renewables Global Status Report
Report designed to compile existing factual information about markets, investments, and policies. No analysis, recommendations, or conclusions.
Original 2005 report based on research, data, interviews, and review by over 100
contributors from around the world, from February to September 2005.
2006 Update shows statistics for 2005 and shows new policies and market trends.
Sponsored by the REN21 Renewable Energy Policy Network and German government. Worldwatch Institute and GTZ are producer and publisher. Eric Martinot is lead author and research director.
Available for download at www.ren21.net and www.martinot.info