Embed Size (px)
Citation preview

1
Renewable energy incentives in Kenya: Feed-in-tariffs and Rural Expansion
June 15, 2016
By: Richard Boampong a and Michelle Andrea Phillips b
Abstract
Kenya has recently enacted policies seeking to expand electricity access through the use of renewable energy sources. This paper discusses the regulatory environment, policies, and tariffs used by the government for this effort, focusing on two important programs: the feed in tariff scheme and the creation of the Rural Electrification Authority. These policies and the use of clear targets have increased access and the use of renewable energy. Current challenges, including access to financing and expansion to the rural poor, are also discussed.
Keywords: Feed-in-tariff, renewable energy, solar photovoltaic, geothermal, Kenya.
Funding: This work was financially supported by the National Science Foundation’s Sustainable Energy Pathways Initiative, Grant number CHE-1230929.
a Department of Economics, University of Florida, PO Box 117140, Gainesville, FL 32611, United States of America. Email: [email protected] b Corresponding author. Public Utility Research Center, Warrington College of Business Administration, University of Florida, 205 Matherly Hall, Gainesville, FL 32611, United States of America. Email: [email protected]

2
1. Introduction
Governments in developing countries are considering various ways to increase access to
modern energy services using renewable energy sources. This study looks at the regulatory
environment, policies, and tariffs used by Kenya to increase the deployment of renewable energy
thereby increasing energy access, particularly in rural off-grid areas. While several studies have
discussed the use of policies for increasing the use of renewable energy sources, very few have
focused on areas in Sub-Saharan Africa, where access levels, the urban/rural distribution, and
high use of firewood and kerosene present unique challenges. Renewable energies provide an
opportunity to address climate change and development goals at the same time.
Of the world’s 1.267 billion population without electricity access, 1.265 billion live in
developing countries. An estimated 2.8 billion people in developing countries use solid fuel such
as charcoal, wood, or other traditional biomass for cooking and heating (Legros et al. 2009). Low
access to electricity in rural areas, the unreliable nature of power supply in urban areas, and the
continued reliance on traditional methods of lighting, cooking, and heating have constrained
economic growth and resulted in roughly two million deaths per year from pneumonia, chronic
lung disease, and lung cancer associated with indoor air pollution (Legros et al. 2009).
In order to curb this trend, the United Nations launched the “Sustainable Energy for All”
initiative with the following goals in mind: (1) ensuring universal access to electricity and clean
cooking solutions, (2) doubling the share of the world’s energy supplied by renewable sources
from 18% to 36%, and (3) doubling the rate of improvement in energy efficiency (World Bank
2013).

3
So far 77 countries, most of them from the developing world, have opted to pursue the
objectives of “Sustainable Energy for All.” The initiative’s second objective of increasing energy
supplied by renewable sources from 18% to 36% has been well taken by stakeholders. Almost
all developing countries are now considering renewable energy as one of their main resources for
increasing energy supply in urban areas. Renewable energy technology has also been replacing
diesel powered generators as the main source of off-grid power for the electrification of rural
areas, especially in regions where grid extension is not economically feasible.
An opportunity exists for investors and enterprises to supply renewable energy products
in these markets. The opportunity in each market is, however, affected by the regulatory
environment, consumer awareness, consumer finance, product quality, and presence of policy
advocacy groups in each country. The purpose of this paper is to present the current state of
renewable energy diffusion in Kenya, with an emphasis on its regulatory environment, incentives
set to increase access to electricity and clean energy.
According to the International Energy Agency (IEA 2015), Kenya has a population of
44.35 million and gross domestic product of 28.05 billion in 2005 US dollars (USD). In 2015, its
energy production totaled 17.59 million tonnes of oil equivalent, with electricity consumption1 of
7.33 terawatt-hours and CO2 emissions from fuel combustion totaling 11.70 million tonnes of
CO2. Kenya has pledged to cut greenhouse gas emissions 30% below their “business as usual
levels” by 2030. The government plans on meeting this target by expanding the use of solar,
1 Calculated as gross production + imports – exports – losses.
4
wind, and geothermal generation, and bringing forest cover up while reducing reliance on wood
fuel2 (Bounagui 2015).
According to the Global Tracking Framework Report (Angelou et al. 2013), access to
electricity has been improving over the years, increasing from 11% of population with access in
1990, to 15% in 2000, to 23% in 2010. The country has 71% and 8% access in urban and rural
areas, respectively. The electricity mix relies heavily on hydropower, fossil fuels, geothermal and
wind generating sources (Ngui et al. 2011). Geothermal energy, a renewable energy source
consisting of energy that comes from the earth’s heat, became the largest player in the energy
mix (51%) with the addition of two plants with a combined capacity of 280 megawatts (MW) in
2015 (World Bank 2015).
The percentage of renewable energy share as of 2010 was 58.1% of electricity capacity
and 69.5% of electricity generation. Kenya’s electricity sector currently experiences the
following challenges: high frequency of outages, low access rate, an inability to meet demand
(particularly when hydrological conditions dip3) and high power system losses (Mutua et al.
2012; Economic Consulting Associates 2012). Installed capacity as of 2011 was 40 watts (W)
per capita, which is low compared to South Africa’s 800 W per capita (Economic Consulting
Associates 2012). Table 1 provides a summary of installed capacity (in MW) as of 2014 by
generation source.
2 The country estimates an approximate cost of 40 billion USD for achieving its climate change goals (Bounagui 2015). 3 In the short term, lack of electricity when there is a drop in water levels has been addressed by increasing the use of thermal power (diesel) generation (Ngui et al 2011).

5
Kenya liberalized its power sector in 1996 and unbundled the state owned utility in 1997.
An Electricity Regulatory Board was established in 1997 (Republic of Kenya 2011). Table 2
describes the main institutions involved in Kenya’s electricity sector.
Among renewable energy sources, Kenya has high potential for the use of geothermal
energy, but faces several challenges in its use. These include: high upfront investment costs, high
resource exploration and development risks, land use conflicts, inadequate expertise, and high
investment in infrastructure due to long distances from geothermal sites to existing load centers
(Ministry of Energy and Petroleum 2014). Government policies that encourage resource
assessment, development, and capacity building have been considered as part of the
government’s policy agenda. A recent Least Cost Power Development Plan (Republic of Kenya
2011), identified renewables as a major upcoming development, with a plan to use geothermal
generation for base load (Economic Consulting Associates 2012).
Kenya also has potential for solar photovoltaics (PV). Kenya’s solar PV market was
established in the 1970s mostly by donor investments. It became a “donor hub” for solar PV,
which allowed for a market to emerge early on. Donor investments still contribute to the
development of renewable energy in Kenya. For instance, the International Finance Corporation
(IFC) invested 5 million USD for market development of solar PV between 1998 and 2008
through its PV Market Transformation Initiative (Bawakyillenuo 2012). In the geothermal sector,
the World Bank has been involved in several facets such as feasibility studies, exploration,
geothermal steam development, and plant construction. It has also provided investor risk
mitigation (World Bank 2015).
2. Methodology

6
In order to evaluate the development of renewable energy markets in Kenya an extensive
literature review was carried out covering the academic literature, mass media, and government
reports. We review Kenya’s recent renewable energy policies in section 3. We then describe the
markets for renewable energy, with an emphasis in solar PV and geothermal, in section 4. We
discuss current progress in the sector in Section 5. Section 6 concludes.
3. Renewable Energy Policies
Policies can help determine the extent to which renewable energy resources are adopted
in a given country. Kenya has enacted several policies that promote the use of renewable
energies. In adopting these policies they have taken into account lessons learned from other
countries’ experiences, such as making sure Feed in Tariffs (FIT) offer less risk to investors by
ensuring them that prices negotiated in 20 year contracts can only change based on inflation.
The first relevant renewable energy policy passed in recent years was Energy Act 12 of
2006, enacted by the Ministry of Energy and Petroleum. The Energy Act set up an independent
regulator for the sector, the Energy Regulatory Commission (ERC), whose role included the
approval of Power Purchase Agreements (PPA) and the preparation of national energy plans. The
Act puts the responsibility for developing renewable energy frameworks in the Ministry of
Energy and Petroleum. As is the case in many countries, there is special emphasis on the
expansion of local manufacturing and incentives to existing renewable sources such as bio-
digesters, solar, and hydro turbines (IEA 2016). The act also encourages the use of biomass co-
generation (heat and power) and alternative fuel production using sugar mills. The Energy Act
also provides other incentives expected to increase the use of renewables, such as an
authorization for 4 MW capacity systems of renewable energy to produce energy without a
license, income tax holidays for some generation and transmission projects, and tax exemptions
7
for imports that are to be used for renewable energy equipment (IEA 2016). The Act also created
the Rural Electrification Program, promoting off grid renewable energy generation for
households and income-generating activities.
FITs offer long term contracts to renewable energy producers to supply energy to the grid
at a pre-determined rate, typically based on the average cost of generation of each technology
(different technologies can be paid different amounts per megawatt-hour (MWh) of electricity
provided). Kenya’s first FIT policy was enacted in 2008 by the Ministry of Energy. It applied to
generators of wind, bioenergy, and hydropower. The policy required system operators to connect
plants generating renewable energy and guaranteed priority purchase of their electricity. Grid
operators were allowed to recover some of the cost from the FIT directly from consumers, up to
2.6 cents/kilowatt-hour (kWh). The policy set tariffs that were technology and capacity-specific
and expected to apply for 15 years. Investors’ Expressions of Interest were evaluated by a panel
with representatives from the Ministry of Energy, grid operator and regulator (IEA 2016).
Kenya’s FIT was revised in 2012. The revision standardized PPA templates to be used in
negotiations, issued guidelines for connection of small scale renewables to the grid, added a
standardized application form and progress reporting / monitoring frameworks, changed FIT
levels, and expanded the list of renewable energy sources qualifying for FITs (IEA 2016). One of
the major goals of standardized PPAs and technology-based FIT values, was to reduce time and
transaction costs that would be incurred if negotiations took place instead.
More recently, in 2015, Kenya introduced new renewable energy tax incentives. Kenya
now offers and exemption from Value Added Tax to several components of renewable energy
sources, including certain solar cells and modules and PV semi-conductor devices (IEA 2016).
4. Renewable Energy Projects

8
The market for renewable energy in Kenya can be divided into two broad categories: On
grid renewable energy projects and off grid projects. Two renewable energy sources that have
been promoted in Kenya are solar PV and geothermal.
Kenya is located near the equator, which provides it with 4-6 kilowatt-hour per meter
squared per day (kWh/m2/day) levels of insolation. The average daily radiation in over 28,000
square kilometers is above 6 kWh/m2/day. The government estimates that 20,000 PV home
systems are currently in use in Kenya, generating 9 Gigawatt-hours (GWh) of electricity
annually, and accounting for 1.2% of households (Republic of Kenya 2011). Given Kenya’s
insolation levels and large rural population, there is potential for solar PV penetration.
In regards to geothermal energy, Kenya has over 14 high temperature potential sites
along the Rift Valley (Ministry of Energy and Petroleum 2014). A challenge of geothermal
energy, compared to other sources is that, in a manner similar to petroleum, it requires large
investments in exploration which may not result in a viable site. This imposes a development and
exploration risk. Kenya has addressed this by providing government support for resource
assessment and development (Ministry of Energy and Petroleum 2014). Geothermal, unlike other
renewable sources, can be used as baseload.
4.1. On-grid Renewable Energy Projects
On-grid renewable energy projects are products for utility-scale and customer-scale
applications where the power generated is sold to others, including the utility. Globally,
renewable energy technologies represent alternatives for developing countries to increase their
generating capacity and improve their weak and unreliable power sector while responding to the
need to transition to more sustainable energy sources. Governments and policy makers can

9
develop incentives to attract private investment to the on-grid electricity sector. Investors, in
general, are concerned about the high risks associated with long-term investments in developing
countries, for instance, due to apprehensions about political instability. Policymakers can use
several financial incentives to mitigate against these high investment risk perceptions.
While the main objective of FIT policies in most developed countries is to shift
production of energy from fossil fuels to renewable sources, the main objective of FIT policies in
developing countries is to encourage investments in renewable energy sources to supplement the
inadequate traditional sources of energy supply.
There are several arguments for and against FIT policies. The main disadvantages of FIT
are that: (1) they can lead to upward pressure on prices in the near-term, (2) they do not address
the high up-front costs of renewable energy technologies, (3) payment levels are often
independent of market signals, (4) they do not encourage direct price competition between
project developers, and (5) they make it difficult to allocate costs across ratepayer classes
(Couture et al. 2010). It is important to note that what are traditionally thought as advantages and
disadvantages of FIT will differ for Kenya compared to developed countries that have ample
electricity generation sources and supply. For Kenya’s case, most areas where FIT were
implemented, did not have enough electricity supply prior to the projects4. High up-front costs of
renewable energy technologies are especially challenging for developing countries, where there
is often times a lack of access to banks and other formal financial institutions. For the case of
renewable energy in Kenya, several of these concerns have been addressed with financial help
from the government, donor agencies, and mechanisms such as micro-lending.
4 Additionally, for urban areas that are already grid connected, changes in water levels can have very high price impacts. A drought in 2008-2009 caused an 18.4% drop in power generation from hydro sources. The government responded by using emergency and pre-installed thermal generation to meet the shortfall, which amounted to an almost doubling of consumer charges (Yadoo and Cruickshank 2012).

10
Some of the main advantages of FIT are that: (1) they limit investment risk for the
producer5, (2) they only cost money to ratepayers if projects are in operation, (3) they lower
transaction costs, (4) they settle uncertainties related to grid access and interconnection6, (5) they
enhance market access, and (6) they encourage the use of technologies at different stages of
maturity (Couture et al. 2010).
In March 2008, Kenya’s Public Procurement Oversight Authority approved the country’s
first FIT policy for renewable energy technologies. The government sought to meet the following
objectives: contribute to increasing the country’s energy supply, improve the energy mix,
contribute to reductions in greenhouse gases, and generate income and employment7. A FIT was
considered appropriate by the government because it was expected to provide investment
security, reduce transaction and administrative costs, and provide adequate incentives to private
investors (Ministry of Energy 2012; Ministry of Energy and Petroleum 2014).
Different rules were enacted for small and large producers. The policy guaranteed
renewable energy investors under the FIT policy with priority purchase. Small renewable energy
projects (capacity up to 10 MW) were assigned standardized PPAs. The tariffs offered were
technology specific, but the PPAs were technology neutral. In order to get a PPA offer, a project
had to demonstrate technical and economic viability, meet grid connection requirements, and be
able to secure legal and regulatory approvals and financing. Projects were accepted on a first
come, first serve basis, without any sort of bidding involved (Ministry of Energy 2012; Ministry
of Energy and Petroleum 2014).
5 This risk is shifted to other participants, such as ratepayers or taxpayers. 6 FITs settle uncertainties related to grid access and interconnection assuming there were no previous policies to address this. 7 To our knowledge, there is mixed empirical evidence linking FITs to job creation.

11
Kenya’s FIT policy revision was meant to include technologies that investors had shown
interest in but were not contained in the earlier policy or for which the tariffs had not been
attractive enough. The December 2012 revised version contains FIT policies for wind, biomass,
small hydro, geothermal, biogas, and solar resource generated electricity. The policy allows for
tariff differentiation so that each renewable energy technology is paid a different tariff calculated
on a technology-specific basis using the principle of cost plus reasonable investor return. All
contracts are for a 20 year period and use the fixed FIT value that was applicable at the time the
contract was signed, plus an adjustment for inflation. The government set a cap of 10% of
cumulative capacity distribution system-wide generation for FIT projects up to 10 MW (Ministry
of Energy 2012).
Given their greater impact on system reliability, larger producers (larger than 10 MW)
had to follow a different set of rules. Perhaps the most important rule is that large producers must
meet government loadflow/dispatch and system reliability requirements. Once again the
government imposed capacity limits. It also specified a competitive bidding process for large
projects. The government first identifies the most competitive bidders and then has them
compete on a lowest levelized price basis. The government also provides a Standardized PPA for
these types of projects (Ministry of Energy 2012).
For both types of projects, access to Kenya’s grid is guaranteed. The government also
specifies that FITs will be reviewed in set intervals of 3 years from the date of publication of the
previous version. Any change to the policy made during the review will not affect power plants
contracted under old policy, but will apply to power plants developed after the revised policy is
published, following best practices from other countries. The FIT values include a standardized
allowance for interconnection costs. All interconnection and construction costs are to be borne

12
by the developers. The developers also bear costs associated with upgrading transmission and
distribution lines, substations, and associated equipment (Ministry of Energy 2012).
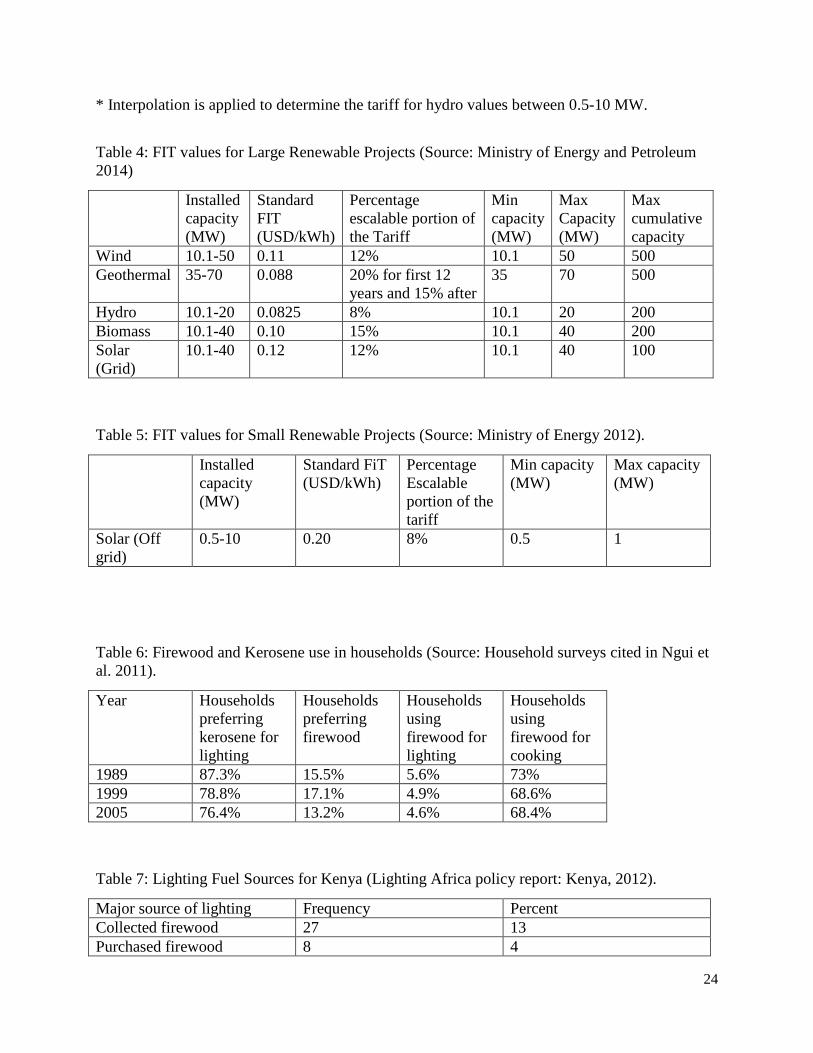
Table 3 presents values for Small Renewable Projects (≤ 10MW installed capacity),
while Table 4 presents values for Large Renewable Projects (> 10MW installed capacity)
4.2. Off-grid systems
There are two types of off-grid systems. Small off-grid systems consist of products
primarily for residential solar home applications, especially in rural areas, and for small scale
commercial PV applications, such as kiosk lighting and mobile phone charging. Large off-grid
systems consist of products providing power for larger institutions, such as schools, health
centers, missions in rural areas, and water pumping.
In Kenya, the main method of electrification is grid extension. This method is, however,
only economically feasible for households in urban areas and towns close to the grid. The rising
costs of fuel, materials, and generators for connection to the grid makes grid connection
uneconomical for some rural areas at this point in time. The low load demand and the dispersed
nature of most rural settlements in developing countries worsens the problem and makes grid
extension unlikely even in the long term (Belward et al. 2011). Consequently, grid extension in
Kenya has followed a slow pace. Bawakyillenuo (2012) argues that this slow pace of grid
extension is one of the main drivers for the growth of PV use in rural areas of Kenya.
Traditionally, most African countries had relied on diesel stand-alone generators for the
electrification of isolated areas (Belward et al. 2011). Governments in developing countries are
now focusing on renewable energy technologies for rural electrification because of diesel costs
and environmental benefits of renewable energy.
13
Replacing diesel generators with renewable energy sources has been criticized. We
summarize the main concerns, following Yadoo and Cruickshank’s (2012) and Jacobson’s
(2007) analyses. A common concern is that off-grid renewable energy solutions, particularly
solar PV technologies, tend to be more costly and less reliable than diesel. Intermittency from the
sun and high up-front costs, while still challenging, have become less problematic during recent
years due to lower lifecycle costs and improved efficiency of solar PV technologies. In fact,
several renewable energy technologies are, at this point, cheaper than diesel on a levelized cost
basis (Yadoo and Curickshank 2012). The use of generators can also be intermittent if
households face financial constraints for the purchase of diesel.
Another concern is that solar home system initiatives tend to be donor driven. There is
some, anecdotal, evidence of donor driven investments leading to increased adoption of solar
systems in Kenya. In the early 1980s, donor agencies donated PV systems for lighting and
refrigerators, primarily for off-grid missions and health clinics. As stated in Hankins (2000),
when one of these projects, for example, installed solar PV in rural boarding schools, the rural
PV agents in charge of installing and selling systems, quickly realized there was a market in
community households. Within two years of the project, the headmasters and other community
members had purchased PV systems for their own households. By the end of 1990, despite
continuing to purchase between 20 and 40% of the PV equipment each year, donors had become
much less important for the household market.
There is also a concern about benefits only accruing to rural elites. For Kenya,
specifically, Jacobson (2007) conducted research “in the field” and found that the majority of
benefits from the solar PV market were obtained by the rural middle class. The author also found
14
that unsubsidized, market-driven approaches to rural PV service provision bypassed poorer8 rural
households. Historically, private businesses in Kenya targeted PV sales to affluent rural
communities, which were seen as a commercially viable segment, beginning with the South of
Mount Kenya, a well-off rural area of coffee and tea farms in the 1980s. This allowed the sector
to be successful without a need for donor assistance, and helped boost entry of other private
businesses into the rural PV market (Bawakyillenuo 2012)9. In the 2000s, the focus shifted
towards middle class families in rural areas as documented by Jacobson (2007) presumably
fueled by lower costs of PV systems, higher middle class purchasing power, and a desire of the
middle classes to have access to television viewing.10 This concern can be alleviated by
obtaining resources to help these families attain access, such as donor funding, government
policies, or financing options that allow users to pay for systems over time.
Another criticism addressed by Jacobson (2007) is that solar PV panels were mainly used
for productive applications such as mobile phone communications or television as opposed to
income-generating activities, education, or poverty alleviation. Benefits that could accrue from
the use of light for evening time studying with children, did not necessarily accrue when lighting
was constrained and families preferred to use their limited electricity for television watching.
While Jacobson (2007) finds that television viewing in Kenya is a substitute for night time
reading, the same author in a later study (Kirubi et al. 2009) mentions how television is a useful
medium through which, for example, women can acquire information on health and family
8 The majority of Kenya’s poor rural population consists of subsistence farmers (Hankins 2000) 9 This strategy was also followed in several other African countries such as Zimbabwe. 10 The purchase of solar PV for television viewing is not unique to Kenya’s rural households and has been shown to exist in studies from China, Thailand, Sri Lanka, and Zimbabwe (Jacobson 2007).

15
planning. Furthermore, according to Hankins (2000), with the growth of the television market in
Kenya, “came smaller, cheaper, and incrementally purchased PV systems”11 (p.94).
Another concern is that several projects failed within a number of years due to economic,
technical, and organization challenges (Yadoo and Cruickshank 2012). These concerns are
typically addressed by setting up policies that can help mitigate these issues. A characteristic of
FIT that can help mitigate these concerns, is the fact that a payment only occurs if the project is
running.
In 2006, the government set up the Rural Electrification Authority (REA) with the
ultimate goal of ensuring that all Kenyan households in rural areas have electricity by the year
2020. It is a special purpose agency, whose goal is to accelerate the pace of rural electrification,
through fund allocation and the promotion of renewable energy sources. The function of
increasing rural electric penetration had previously been performed by the Ministry of Energy
(REA 2015; REA 2012b). Currently, only 26% of all households in the country have access to
electricity. The REA has focused on the electrification of secondary schools, health centers, and
trading centers. One of the government’s goals is to provide access to e-learning and
Information, Communications and Technology (ICT) services to schools in rural areas. One of
REA’s goals was to electrify all secondary schools and health and trading centers by 2013. REA
expected to implement its goals using the following strategies (REA 2012a):
1. Setting up targets. These targets included several phases. Phase I involved the connection of
all public facilities and took place during the 2008-2012 period. Phase II seeks to increase
customer connections during the 2013-2022 period, with a goal of 65%.
11 Televisions can also be powered by batteries. However, batteries have to be carried to and from battery charging stations (Hankins 2000).

16
2. Setting up a rural electrification plan. REA identified and listed the number of public facilities
requiring electrification. This list with statistics on achievements is available on their website12.
3. Partnering with local communities. REA involved the community during the implementation
process. This included, for example, using community participation to deal with transformer
vandalism.
Even though the government promotes the use of all renewable energy sources for rural
electrification, since 2009 most of the off-grid generation for schools, health centers, and
government institutions has used solar PV. For this reason, the 2012 PPA contains tariffs only
for solar technology for off-grid generation. Table 5 shows an extract from the PPA for mini-
grid solar technology in Kenya.
Small solar PV units and products have been sold in Kenya for several years. To put the
use of small solar PV products in perspective, during the 1995-1999 period, the country’s rural
electrification program achieved less than 21,000 connections. During the same period, over
80,000 households purchased solar modules (Hankins 2000).
Early rural electrification programs did not focus on the electrification of rural
households. Consequently, those in rural areas not connected to the grid have been using small
solar-home systems for their lightning and mobile phone charging needs. Small solar home
systems, however, do not provide the household with the necessary energy for refrigeration,
cooking, or other thermal uses (Hankins 2000).
For very remote areas where grid-connected electrification is not currently considered
cost-effective, decentralized systems such as solar lanterns and solar cooking stoves have been
12 http://www.rea.co.ke/
17
promoted to increase the adoption of renewable energy and to improve the livelihood of rural
households. A major goal is to reduce the use of kerosene and firewood, and the dangers
associated with smoke. Electric lighting also provides more lumens per dollar (Hankins 2000).
Kerosene lamps and lanterns still remain as the main lighting source in rural areas (and as the
main back up source in urban areas). Firewood is the most popular source of cooking fuel (Ngui
et al. 2011) and is usually a free resource (Hankins 2000)13. Table 6 illustrates estimates of
household usage of kerosene and firewood over the years. Additionally, among urban
households, charcoal is preferred to gas and electricity because of its lower prices. The use of
charcoal is difficult to quantify because it is primarily purchased in the informal sector (Ngui et
al. 2011).
Solar lanterns are being promoted across areas of the country as a substitute to the use of
kerosene as the main source of lighting in rural areas and as the main back up lighting system in
urban areas.
According to Ondraczek (2013), residential solar home systems and small-scale
commercial PV applications, such as cell phone charging kiosks, account for three quarters of
total installed PV capacity in Kenya. The country offers favorable financing schemes such as
micro-credit financing and the Hire Purchase credit system, whereby consumers are able to
purchase systems on credit with monthly payment installments (Bawakyillenuo 2012). Table 7
depicts the lighting fuel sources from responses to a preliminary pilot questionnaire conducted
on a variety of sample groups in Kenya in 2004-2005.
5. Discussion
13 Firewood does not, however, provide acceptable lighting levels and cannot be used to power televisions (Hankins 2000).
18
Small-scale renewable energy sources in Kenya, such as solar, have slowly increased
from 1% of installed capacity in 2005, to 3% in 2012. The share of geothermal in the country’s
energy mix increased from 13% to 51% between 2010 and 2015 (World Bank 2015). Kenya
appeared as one of the top 5 countries in the Share of GDP 2012 USD invested in Geothermal
Power Capacity category of the Renewables 2014 Global Status Report. This report also
highlights Kenya as one of 18 countries in the world that generated more than 10% of its
electricity from non-hydro renewable energy resources by 2013. Additionally, Kenya was listed
as one of Africa’s leading investors in renewable energy, with an investment of 249 million
USD, which is higher than every other African country with the exception of South Africa.
Kenya is also currently in the process of building Africa’s largest wind energy farm, the Kale
Turkana Wind Power Project, which is expected to generate 20% of the country’s power using
365 turbines (with a load capacity factor of approximately 68%). This project is being financed
by a consortium of investors under the auspices of the European Union and using the African
Development Bank as lead arranger (Mushakavanhu 2015).
So far, the FIT program has received some criticism from investors. For instance a PV
trade magazine recently mentioned how some developers believed that the rate offered for solar
was too low to encourage viable investments (Willis 2014). Despite what initially appeared like a
lack of initial uptake of FITs, there are many projects in the pipeline. A table of projects in the
pipeline for the 2012-2018 period for several types of renewable energy is provided in Table 8.
Approved projects from the ERC’s report for the 2013-2014 period are shown in Table 9. We
can gauge the magnitude of completed projects by examining calculations of the potential from
renewable energy sources as of June of 2013, shown in Table 10 and installed capacity of main
grid connected renewables, shown in Table 11.

19
According to the ERC (2013), there was an upsurge in solar energy connections, due
mainly to off grid projects and heavy consumers seeking to reduce their cost of power. For
example, Williamson Tea Kenya Limited, had a 1 MW solar PV plant investment. In the off grid
small units segment, Non-governmental organizations distributed solar lanterns, phone charges,
and refrigerators. The government also approved PPAs for wind projects such as Lake Turkana
and Kinangop. According to the Commission’s estimates, total generation from renewable
energies increased from 3,625 GWh in 2009-2010 to 6,026 GWh in 2013-2014. During the
2013-2014 period, the ERC approved 25 projects under the FIT policy, with a 93% approval
rate14. Table 12 shows a summary of applications approved under the FIT program.
The REA increased access to electrification in rural areas. From 2008 to 2011, the
installations of solar PV home systems increased at an average of 20,000 units per year
(Republic of Kenya 2011). Furthermore, roughly 500 public institutions have been installed with
solar power lighting (REA 2013). One of REA’s goals was to electrify all secondary schools and
health and trading centers by 2013. The agency achieved electricity connections in 89% of public
facilities by 2013, with the help of the government, Ministry of Energy and development partners
such as the World Bank and the Governments of France and Spain (REA 2012b; REA 2013).
Additionally, pilot renewable energy projects through mini hydro, wind, and biogas were started
for community generation and distribution of electricity. Immediately after Phase I came to an
end, REA developed new strategic plans and reviewed the status of the targets from Phase I.
Table 13 presents REA’s progress in electrification of off-grid areas.
According to a recent newspaper article (REA Press Release 2015), Kenya’s policies
have resulted in the following outcomes: (1) an addition of 514.9 MW to the grid, (2) enough
14 The ERC did not approve one wind proposal and one hydro proposal.
20
geothermal power additions to make Kenya the world’s 8th largest producer with a steam power
capacity of 579 MW, (3) 18,424 schools that are connected to the grid (with plans of connecting
the remaining 3,076). These changes are, in part, a consequence of the policies examined.
A major concern when increasing use of electricity in Sub Saharan Africa and in
developing countries in general is the lack of access to the poor. For many remote rural areas, at
least in the early stages of electricity access involving the use of small systems such as solar-
powered refrigerators and mobile phone chargers, renewable energy sources seem to be the least
cost option. As mentioned earlier, donor and government funding or financing has been one
avenue for addressing this. For example, in 2015, the World Bank approved $457.5 million USD
funding to increase electricity access for Kenya’s low income households and firms. This
included a loan of $250 million USD from the International Development Association (IDA)15
and a guarantee for $200 million USD from the IDA to help improve Kenya Power’s
creditworthiness. While these funds are not entirely meant to be used for renewable energy, $7.5
million USD were directly allocated to increases in generation from renewable energy sources.
The money will be shared by Kenya’s Ministry of Energy, Kenya Power and the REA and is
expected to provide access to electricity for 630,000 people (Karambu 2015). Another example,
the Olkaria geothermal project, received funding from several donor agencies such as the World
Bank, the Japan International Cooperation Agency, the European Investment Bank, Agency
France de Developpement and Germany’s KFW (World Bank 2015).
6. Conclusions
15 The IDA is the World Bank’s commercial loan arm and complements the International Bank for Reconstruction and Development.

21
So far, it seems that Kenya’s policies have helped increase connectivity. Perhaps the
biggest issue that still needs to be addressed is how to increase connectivity for the poorest
households. The Ministry of Energy and Petroleum (2014) mentions insufficient financing
mechanisms as a challenge. Connecting schools and health centers is a first step towards
reaching the rural poor.
While it is not possible to calculate the employment effects of increases in the availability
of renewable energy in Kenya, there is information about the solar industry in Kenya. According
to Ondraczek (2013), in 2009, there were approximately 15 to 40 major suppliers of solar
equipment, 3 manufacturers of batteries, and 9 lamp manufacturers. There were also several
companies dedicated to importing solar systems, hundreds of sales agents, and roughly 2,000
installation technicians (Ondraczek 2013). The author further notes that this makes Kenya an
import and manufacturing hub for the area.
The use of cleaner cooking and lighting technologies can help reduce the health problems
related to indoor smoke, alleviate poverty and climate change concerns, and provide better
outcomes for education through the use of night time reading and access to ICT technologies.
Additionally, renewable energy investments have produced positive effects for other
sectors. For example, recent geothermal investments led to a reduction in the costs of power to
industrial and commercial consumers which in turn reduced the costs of doing business in Kenya
(World Bank 2015).
Looking into the future, and as a way to deal with the intermittency issues of solar
energy, the government has started an initiative for building combined solar/wind and
solar/diesel plants (Ministry of Energy and Petroleum 2014).

22
Even though Kenya has experienced growth in the use of renewable energy sources,
several challenges still remain. For geothermal energy, development and exploration activities
continue to be costly and risky. There is also a lack of expertise in the industry and skilled
capacity for several sources, such as geothermal, wind, small hydro, and solar. Furthermore, high
upfront costs remain a challenge for geothermal, wind, and solar sources (Ministry of Energy and
Petroleum 2014). Because of these challenges the country is expected to continue its dependence
on aid from donor organizations, at least in the short term. Having clear policies, does, however
help by reducing investor risk and attracting foreign investment. In regards to the FIT
themselves, the government has identified “insufficient data and analytical tools to inform the
level of tariffs” (Ministry of Energy and Petroleum 2014, p.30) as one of its major challenges.
Other challenges mentioned include a lack of awareness of the FIT program by investors and
inadequate technical and financial capacity. A challenge that is not mentioned but is worth
noting is making sure that electricity is provided at the lowest cost possible while taking
environmental and health concerns into account.
Table 1: Power Generation Capacity: Installed capacity in MW as of June 30, 2014. (Source: Energy Regulatory Commission 2013)
Type Installed capacity (MW) % of Source of Power Hydro 818.21 42.64% Geothermal 363.40 18.94% Wind 5.3 0.28% Solar 0.7 0.04% Cogeneration (Biomass) 26 1.35% Gas Turbine 60 3.13% Medium Speed Diesel 548.8 28.60% High Speed Diesel 37.6 1.96% Note: The geothermal share increased to 51% in 2015 thanks to the commissioning of Olkaria I and Olkaria 4 in the Rift Valley (World Bank 2015).

23
Table 2: Electricity Sector Institutions in Kenya (Source: Republic of Kenya 2011).
Institution Description Ministry of Energy Establishes energy policies, sets strategic direction for the sector. Energy Regulatory Commission
Regulates the energy sector. Sets tariffs and oversight, coordinates the development of energy plans, monitors and enforces sector regulations.
Energy Tribunal Arbitrates disputes. Rural Electrification Authority
Implements the Rural Electrification Program.
Kenya Electricity Generating Company
Main electricity generator (installed capacity of 1,176 MW). Ownership is 70% government, 30% private investors. It accounts for roughly 75% of installed capacity from hydropower, thermal, geothermal, and wind sources.
Independent Power Producers
Private investors involved in generation under Kenya’s feed in tariff. They account for roughly 26% of the country’s installed capacity from thermal, geothermal, and bagasse.
Kenya Power and Lighting Company
Off-taker in the power market. Buys power from all power generators under Power Purchase Agreements for transmission and distribution. Ownership is 50.1% Government of Kenya and National Social Security Fund and 49.9% private investors.
Table 3: FIT values for Small Renewable Projects (Source: Ministry of Energy and Petroleum 2014)
Installed capacity (MW)
Standard FIT (USD/kWh)
Percentage Escalable portion of the tariff
Min capacity (MW)
Max capacity (MW)
Wind 0.5-10 0.11 12% 0.5 10 Hydro* 0.5 0.105 8% 0.5 10 Hydro* 10 0.0825 8% 0.5 10 Biomass 0.5-10 0.10 15% 0.5 10 Biogas 0.2-10 0.10 15% 0.2 10 Solar (Grid) 0.5-10 0.12 8% 0.5 10 Solar (Off grid)
0.5-10 0.20 8% 0.5 1
24
* Interpolation is applied to determine the tariff for hydro values between 0.5-10 MW.
Table 4: FIT values for Large Renewable Projects (Source: Ministry of Energy and Petroleum 2014)
Installed capacity (MW)
Standard FIT (USD/kWh)
Percentage escalable portion of the Tariff
Min capacity (MW)
Max Capacity (MW)
Max cumulative capacity
Wind 10.1-50 0.11 12% 10.1 50 500 Geothermal 35-70 0.088 20% for first 12
years and 15% after 35 70 500
Hydro 10.1-20 0.0825 8% 10.1 20 200 Biomass 10.1-40 0.10 15% 10.1 40 200 Solar (Grid)
10.1-40 0.12 12% 10.1 40 100
Table 5: FIT values for Small Renewable Projects (Source: Ministry of Energy 2012).
Installed capacity (MW)
Standard FiT (USD/kWh)
Percentage Escalable portion of the tariff
Min capacity (MW)
Max capacity (MW)
Solar (Off grid)
0.5-10 0.20 8% 0.5 1
Table 6: Firewood and Kerosene use in households (Source: Household surveys cited in Ngui et al. 2011).
Year Households preferring kerosene for lighting
Households preferring firewood
Households using firewood for lighting
Households using firewood for cooking
1989 87.3% 15.5% 5.6% 73% 1999 78.8% 17.1% 4.9% 68.6% 2005 76.4% 13.2% 4.6% 68.4%
Table 7: Lighting Fuel Sources for Kenya (Lighting Africa policy report: Kenya, 2012).
Major source of lighting Frequency Percent Collected firewood 27 13 Purchased firewood 8 4

25
Grass 2 1 Kerosene 144 70 Electricity 16 8 Dry cell torch 1 1 Solar 5 3
Table 8. Pipeline Projects <30MW 2012-2018 (Source: Economic Consulting Associates 2012).
Type Total MW Number of sites By when Small hydro 119 35+ 2018 Biomass 65 8 2016 Small wind 51 2 2014 Small geothermal 36.5 8 2016 Biogas 22 4 2018 Solar PV 10 1 2015
Table 9: Proposals approved under FIT policy, year 2013-2014 (Source: ERC 2013)
Type Number of approved proposals
Total capacity (MW)
Solar 18 554.6 Small Hydro 20 77.83 Biomass/Biogas 4 52 Geothermal 1 15
Table 10: Potential from Renewable Energy Sources, as of June 2013 (Source: ERC 2013)
Source Minimum (MW) Maximum (MW) Hydropower 3,000 6,000 Geothermal Power 7,000 10,000 Cogeneration (Biomass) 193 350 Biogas 29 131 Solar PV 106 15,000 Wind 300 1,000
Table 11: Installed Capacity of Main Grid Connected Renewables (MW), 2015-2011 (Source: ERC 2011)
Type 2005 2006 2007 2008 2009 2010 2011 Large hydro (>10MW)
663.3 663.3 663.3 723.3 735.3 764.6 763.3

26
Small hydro (<10MW)
13.7 13.7 13.7 13.7 13.7 14 14
Geothermal 128 128 128 128 163 198 198 Wind 0.4 0.4 0.4 0.4 0.4 5.1 5.1 Biomass 0 2 2 26 26 26 26 Solar 0 0 0 0 0 0 0.6
Table 12: FIT programs approved, 2013-2014 period (Source: ERC 2013).
Type Capacity (MW) Number of Projects Wind 140 2 Biomass 3 1 Hydro 93.28 11 Geothermal 0 0 Solar 343 9 Biogas 7.2 2 Cogeneration 0 0 Sea Waves 0 0 TOTAL 586.48 25
Table 13. Electricity for Off-Grid Areas by REA (Source: REA 2012a, REA 2013)
Facility Number of facilities electrified from 1973-2003
Total number of facilities electrified in 2012
Total number of facilities electrified in 2013
Trading Centers 1,096 9,234 10,658 Public Secondary Schools 285 6,546 8,258 Health Centers 348 3,251 4,082 Proportion of electrification 75% 89%
27
Acknowledgements: We would like to thank Maria Paulina Carvallo, Lenz Gelin, and Tayo
Ilegbusi for research assistance. We also thank Mark Jamison for helpful comments and advice.
References
Angelou, Nicolina, Elizondo Azuela, Gabriela, Banerjee, Sudeshna Ghosh, Bhatia, Mikul,
Bushueva, Irina, Inon, Javier Gustavo, Jaques Goldenberg, Ivan, Portale, Elisa, Sarlar,

28
Ashok, 2013. Global Tracking Framework. World Bank.
http://documents.worldbank.org/curated/en/2013/05/17765643/global-tracking-
framework-vol-3-3-main-report
Bawakyillenuo, Simon, 2012. Deconstructing the dichotomies of solar photovoltaic (PV)
dissemination trajectories in Ghana, Kenya and Zimbabwe from the1960s to 2007.
Energy Policy, 49, 410-421.
Belward, A, Bisselink, B., Bodis, K., Bring, A., Dallemand, J., de Roo, A. Huld, T., Kayitakire,
F., Mayaux, P., Moner-Girona, M., Ossenbrink, H., Pinedo, I., Sint, H., Thielen, J.,
Szabo, S., Tromboni, U., Willemen, L, 2011. Renewable energies in Africa. JRC
Scientific and Technical Reports. JRC, European Commission.
https://ec.europa.eu/jrc/sites/.../reqno_jrc67752_final%2520report%2520.pdf
Bounagui, Ryan, 2015. Kenya pledges to cut carbon emissions 30% by 2030. July 24, 2015. The
Guardian. http://www.theguardian.com/environment/2015/jul/24/kenya-pledges-to-cut-
carbon-emissions-30-by-2030
Couture, Toby D., Cory, Karlynn, Kreycik, Claire, Williams, Emily, 2010. A policymaker’s
guide to Feed-in-Tariff policy design. NREL. www.nrel.gov/docs/fy10osti/44849.pdf
Economic Consulting Associates Ramboll, 2012. Technical and Economic Study for
Development of Small Scale Grid Connected Renewable Energy in Kenya.
Energy Regulatory Commission, 2013. Annual report financial statements.
http://erc.go.ke/index.php?option=com_docman&task=cat_view&gid=39&Itemid=429
29
Hankins, Mark, 2000. A case study on private provision of photovoltaic systems in Kenya in
Energy services for the world’s poor. World Bank, ESMAP.
http://www.worldbank.org/html/fpd/esmap/energy_report2000/ch11.pdf
International Energy Agency. 2015. Key World Energy Statistics.
http://www.iea.org/publications/freepublications/publication/KeyWorld_Statistics_2015.
International Energy Agency. 2016. Policies and Measures: Kenya.
https://www.iea.org/policiesandmeasures/renewableenergy/?country=Kenya
Jacobson, A. 2007. Connective power: solar electrification and social change in Kenya. World
Development 35(1), 144-162.
Karambu, Immaculate, 2015. Kenya gets Sh41 billion to finance power supply. April 2, 2015.
Daily Nation.
Kirubi, Charles, Jacobson, Arne, Kammen, Daniel M., and Mills, Andrew, 2009. Community-
based electric micro-grids can contribute to rural development: Evidence from Kenya.
World Development, 37(7), 1208-1221.
Legros, Gwenaelle, Havet, Ines, Nigel, Bruce, Bonjour, Sophie, 2009. A review focusing on the
least developed countries and Sub-Saharan Africa. United Nations Development
Programme.
http://www.undp.org/content/dam/undp/library/Environment%20and%20Energy/Sustaina
ble%20Energy/energy-access-situation-in-developing-countries.pdf
30
Lighting Africa Report: Kenya, 2011. IFC and World Bank.
https://www.lightingafrica.org/wp.../24_Kenya-policy-report-note.pdf
Ministry of Energy, 2012. Feed in tariffs policy on wind, biomass, small hydro, geothermal,
biogas and solar resource generated electricity.
www.renewableenergy.go.ke/downloads/policy.../Feed_in_Tariff_Policy_2012.pdf
Ministry of Energy and Petroleum, Government of Kenya, 2014. Draft national energy and
petroleum policy, October 11, 2014.
Mushakavanhu, Tinashe, 2015. Kenya is building Africa’s biggest wind energy farm to generate
a fifth of its power. Quartz Africa, July 3, 2015. http://qz.com/444936/kenya-is-building-
africas-biggest-wind-energy-farm-to-generate-a-fifth-of-its-power/
Mutua, John, Ngui, Dianah, Osiolo, Helen, Aligula, Eric, Gachanja, James, 2012. Consumers
satisfaction in the energy sector in Kenya. Energy Policy 48, 702-710.
Ngui, Dianah, Mutua, John, Osiolo, Hellen, Aligula, Eric, 2011. Household energy demand in
Kenya: An application of the linear approximate almost ideal demand system (LA-
AIDS). Energy Policy, 39, 7084-7094.
Ondraczek, Janosch, 2013. The sun rises in the East (of Africa): A comparison of the
development and status of solar energy markets in Kenya and Tanzania. Energy Policy
56, 407-417.
REA News, June 2012a. Issue 4, Vol.2. www.rea.co.ke
REA News, December 2012b. Issue 6, Vol.3. www.rea.co.ke
REA News, December 2013. Issue 7, Vol. 4. www.rea.co.ke

31
REA Press Release, 2015. Megawatts Added to National Grid, March 27, 2015.
http://www.rea.co.ke/index.php?option=com_content&view=article&id=89&Itemid=539
Renewables 2014: Global Status Report, 2014. REN21, Renewable Energy Policy Network for
the 21st Century.
Republic of Kenya. 2011. Updated least cost power development plan study period: 2011-2031.
http://www.renewableenergy.go.ke/downloads/studies/LCPDP-2011-2030-Study.pdf
Yadoo, Annabel, Cruickshank, Heather, 2012. The role of low carbon electrification
technologies in poverty reduction and climate change strategies: A focus on renewable
energy mini-grids with case studies in Nepal, Peru, and Kenya. Energy Policy, 42, 591-
602.
Willis, Ben, 2014. Calls for Kenya to increase solar FiT or risk losing investment. March 6,
2014. PV-Tech. http://www.pv-
tech.org/news/calls_for_kenya_to_increase_solar_fit_or_risk_losing_investment
World Bank, 2013. Sustainable Energy for All.
http://www.worldbank.org/en/topic/energy/brief/sustainable-energy-for-all
World Bank, 2015. Kenya’s Geothermal Investments Contribute to Green Energy Growth,
Competitiveness and Shared Prosperity. February 23, 2015.
http://www.worldbank.org/en/news/feature/2015/02/23/kenyas-geothermal-investments-
contribute-to-green-energy-growth-competitiveness-and-shared-prosperity


![· Web viewDraft Agreement. Chapter on Market Access. CHAPTER ON MARKET ACCESS [CHAPTER] ON TARIFFS AND NON-TARIFF MEASURES. Section One. General Provisions. Article 1. Scope of](https://img.pdfslide.us/doc/110x75/5e979c278fea0430cb0fbb47/web-view-draft-agreement-chapter-on-market-access-chapter-on-market-access-chapter.jpg)