Embed Size (px)
Citation preview

Renewable Carbon for a renewed chemistry
Paul COLONNA

INRA: a 10-year strategy implemented…839 M€
budget
In 2012
8 211permanent
staff
Dijon
Jouy-en-Josas
Versailles Grignon
Lille
Nancy
Colmar Rennes
Angers
Nantes
Paris
Orléans
Tours
…across 17 research centers…by 13 research divisions
ALIMH Nutrition, Chemical Food Safety & Consumer
Behavior
BAP Plant Biology and Breeding
CEPIA Science & Process Engineering of Agricultural
Products
EFPA Forest, Grassland & Freshwater Ecology
EA Environment & Agronomy
2,500researchers
200200 Dijon
Nantes
Poitou-Charentes
Clermont-Ferrand - Theix
Bordeaux Aquitaine
Toulouse Montpellier
PACA
Corse Antilles Guyane
Implantations
Centres de recherche
Centre siège
EA Environment & Agronomy
GA Animal Genetics
MIA Applied Mathematics & informatics
MICA Microbiology & the Food Chain
PHASE Animal Physiology & Livestock Systems
SA Animal Health
SPE Plant Health & Environment
SAD Science for Action & Sustainable Development
SAE2 Social Sciences, Agriculture & Food,
Rural Development & Environment
± 1,800PhD students
in the labs
200200researchresearch unitsunits
4949experimentalexperimental unitsunits


AtmosphereN20 (+ 63% vs 1750, 325,1 ppb, ~6% Green house effect) CO2 (+ 143% vs 1750; 400 ppm
2013) and CH4 (+260%, 1819 ppb, ~ 18% green house effect)
750 GtC
AtmosphereN20 (+ 63% vs 1750, 325,1 ppb, ~6% Green house effect) CO2 (+ 143% vs 1750; 400 ppm
2013) and CH4 (+260%, 1819 ppb, ~ 18% green house effect)
750 GtC
Living organismsLiving organisms
7,7 –7,7 –
8,4
GtC
1,5 -1,5 -
1,9
GtC0,1
Stock and
flux GtC/an
90
GtC
92,3
GtC
63
GtC
60
GtC
Fossil C
16 000 GtC
Sediments
150 GtC
Sediments
150 GtC
Oceans
Surface
1 020 GtC
Deep zones
38 100 GtC
Oceans
Surface
1 020 GtC
Deep zones
38 100 GtC
Soils
1 580 GtC
Soils
1 580 GtC
Living organisms
810 GtC
Living organisms
810 GtCGtC GtC
0,2
GtC
Sources: GIEC, Friedlenstein et al., 2010; Pan et al., 2011; OMM 2013
0,1
GtC
VolcanoesVolcanoes
Sed. 0,4 GtC/an
GtC GtC
Direct
and
indirect
land use
changes
ES35

4. dia
ES35 "usage"Elodie SALICETO, 11/05/2012

Primary production of renewable energyCountries Share of
renewables in
gross energy
consumption
(%)
Ren
primary
prod.
(Mteo)
Solar (%) Biomass and
wastes (%)
Geothermal
energy (%)
Hydraulic
energy (%)
Wind energy
(%)
UE-27 9.0 148.4 1.7 67.7 3.9 19.0 7.7
Germany 8.5 27.7 3.5 77.0 1.7 5.8 12.0
Spain 9.3 11.9 5.7 47.9 0.1 19.0 27.3
France 7.5 19.6 0.3 70.2 0.6 25.1 3.5
Italy 9.5 14.7 1.0 34.0 32.6 28.7 3.8Italy 9.5 14.7 1.0 34.0 32.6 28.7 3.8
Netherlands 3.9 2.8 0.9 84.4 0.1 0.3 14.2
Austria 27.3 8.4 1.5 54.6 0.4 41.5 2.0
Finland 23.2 7.8 0.0 85.6 13.9 0.3
Sweden 34.4 15.9 0.1 62.8 - 35.8 1.4
UK 3.0 5.1 1.4 74.1 - 8.9 15.7
Norway 42.4 12.1 - 9.7 - 89.6 0.7
Source: Eurostat, 2009

This situation is not sustainable
• It does not meet the needs of today's society, since it can not
be extended to the entire globe due to resource limitations,
impacts on the environment and health (particular case of
foods in Western countries).
• It affects future generations, by irresistible exhaustion of fossil
carbon whose reserves are limited in principle.
• The enrichment of CO2 in the atmosphere leads to a
strengthening of the greenhouse effect.strengthening of the greenhouse effect.
• Organic carbon during decomposition in the soil can be
removed from storage quickly in response to changes in
agricultural practices, deforestation, thus enhancing the
greenhouse effect.
• The excess demand (development) is currently conducting to
tensions between yields surfaces and ecosystems' capacity to
provide simultaneous and non-market goods (ecosystem
services).

• (1) meet the food needs of a global population of some 9.7 billion people in
2050* (7.1 in 2013), including some regional populations experiencing strong
economic growth,
• (2) control, limit and reduce emissions of greenhouse gases (GHGs) in the
atmosphere to yield a neutral development (emission = absorption) carbon plan
reduction commitment by two of GHG emissions 2050 compared to 1990 (factor
4 in France).
Our societies are facing four challenges
4 in France).
• (3) develop substitutes for fossil fuels (and their derivatives) which reserves for
a given cost, will be increasingly scarce. Uses in chemistry represent only 9 % of
the uses of oil and gas in France.
• (4) expand the range of molecules and materials available to prevent human
and environmental health risks associated with chemical substances, which are
necessary to our needs in terms of clothing, transportation, housing and
hygiene.
*source : INED

Scenario of sustainable development
1972 United Nations Conference on the HumanEnvironment, Stockholm
1970 1980 1990 2000
Convention
Climat
Kyoto Protocol: reduce
GHG emissions to an average of
1992 EarthSummit in Rio
1987 Commission Brundtland
2002, World Summit on Sustainable
Development,Johannesburg
2009, CopenhagenWorld Summit
Club de Rome: The limits to
growth Gre
en
Ch
em
istr
y
CSR Corporate Social Responsibility
Climat GHG emissions to an average of
5% againt 1990 levels
The challenge of a green economy is to improve the
standard of living in developing countries without
increasing their carbon footprint and at the same
time maintain the standard of living in developed
countries while reducing their footprint.
Bioeconomie with biotechnologies as
game changers.
Sustainable development is development
that meets the needs of the present without
compromising the ability of future
generations to meet their own needs.
Ch
em
istr
y
Low sustainability ?

Bioeconomy: a shared vision ?
OCDE Europe
China included the
bioeconomy and biotech
sector as priorities
within its 12th five-year
economic guideline,
from 2011 to 2015
Germany
Source: Staffas,
2013 Base Scopus
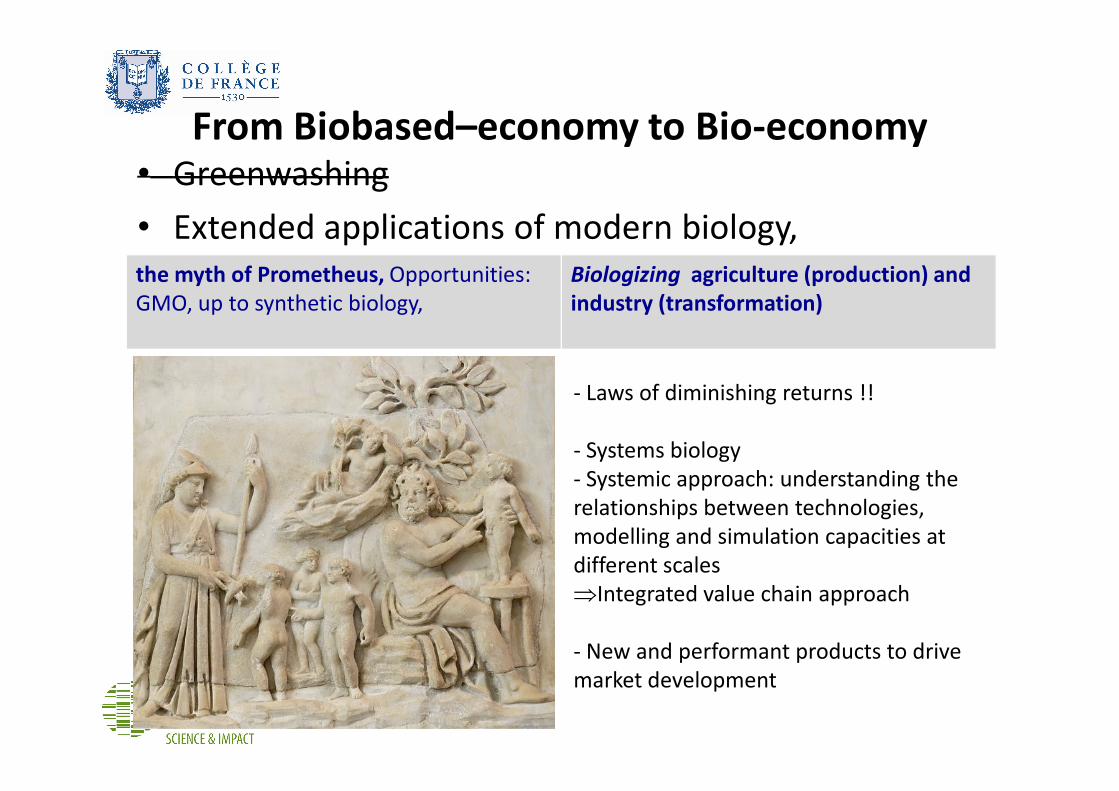
From Biobased–economy to Bio-economy• Greenwashing
• Extended applications of modern biology,
the myth of Prometheus, Opportunities:
GMO, up to synthetic biology,
Biologizing agriculture (production) and
industry (transformation)
- Laws of diminishing returns !!- Laws of diminishing returns !!
- Systems biology
- Systemic approach: understanding the
relationships between technologies,
modelling and simulation capacities at
different scales
⇒Integrated value chain approach
- New and performant products to drive
market development

Tableau staffas
Who When document source Bio-based
ou
bioeconomy
Vision
P ou T
Targets Main domains
OCDE 2009 The bioeconomy to
2030: designing a
policy agenda
OCDE BE T No Biotechnology,
agriculture, health
and industry
UE 2012 Innovating for
sustainable growth: a
bioeconomy for
Europe
Commission BBE P & T economical Foods, resources,
chimistry,
innovation and
skills
USA 2012 National
Blueeconomy
Blueprint
White house BE P +, qualitative biotechnologies
Canada 2009 The Canadian Biotech BE P +, qualitative biotechnologiesCanada 2009 The Canadian
blueprint: beyond
moose and moutains
Biotech
Canada
BE P +, qualitative biotechnologies
Germany 2011 National Research
Strategy
Germ.Min.
Research
BBE P +, qualitative Agriculture,
health, food and
bioenergies
Finland 2011 Distibuted bio-based
economy: driving
sustainable growth
S. Res.
Council
(Formas)
BBE T +, qualitative Sustainable uses
of resources and
biorefineries
Sweden 2012 Swedish Research
and innovation:
strategy for a bio-
based economy
ACIL
Taiman
BE T no Sustainable uses
of resources

of
inn
ova
tio
n ,
pu
bli
c p
oli
cie
s, r
eg
ula
tio
ns
� Annual, perennial plantes, forests, micro-algae
� Green biotechnologies
� New species, Phytoremediation
� Cropping systems
� Annual, perennial plantes, forests, micro-algae
� Green biotechnologies
� New species, Phytoremediation
� Cropping systems
� Adaptation to
climate change
� Mitigation of climate
change
� Competition with
urban growth
Biorefinery: land, harbor and environmental
Exert pressure on the
expansion of the
bioeconomy system
Phototrophic system
Territories
� Lands and ressources
� Location and actors: agro-industrial ecology
� Rules for allocation
� Sustainability assessment
� Lands and ressources
� Location and actors: agro-industrial ecology
� Rules for allocation
� Sustainability assessment
For INRA
Eco
no
mic
so
f in
no
vati
on
, p
ub
lic
� Fractionation technologies
� Separation technologies
� Transformation technologies
� Industrial biotechnologies , synthetic biology
� Nanobiotechnologies
� Fractionation technologies
� Separation technologies
� Transformation technologies
� Industrial biotechnologies , synthetic biology
� Nanobiotechnologies
Eco
con
cep
tio
n
Nanobio-objects
Platform molecules with
reactivity or property value
uses (clothing, housing,
transportation, health ...
Ecosystem services
(support, control,
socio-cultural
Biorefinery: land, harbor and environmental bioeconomy system
Energies
Enzymes,
Microorganisms,
Agents tech
Foods
Ingredients,
additives

Agricultural, algal and
forestry biomasses Foods, Bioenergies,
Biomaterials,
Bio-based chemicals
Molecules or
assemblies with
functional/nutritio
nal properties
Physical processes
Chemical processes
Grain, stem
starch, fibers, lipids, gluten
Polysaccharides, fatty acids,
1st g
2nd g
A biorefinery is a facility that integrates biomass conversion processes and equipment to produce foods,
fibers, fuels, power and value-added chemicals
Basic units
(reactivity)
nal properties
Thermo-
mechanical
processes
Biotechnologies
Syngas, CO, H2
Polysaccharides, fatty acids,
Protein isolates, sugar
Fatty acids, glycerol, hexoses,
pentose, polypepides
3rd g
4th g

Methyl esters
of plant fatty acids
feeds
Rape, sunflower,
soja, palm
meal
Sugar beet,
cane, sorghoSucrose
By-product
Corn-gluten
Chemistry
1st generation
oil
CH3OH fossil
Isobuten fossil
Ethyl esters of
Plant fatty acids EEHV
Engines
diesel
A biorefinery is a facility that integrates biomass conversion processes and equipment to produce foods,
fibers, fuels, power and value-added chemicals
Ethanol
Hydrocarbures, Diesel FT
Wood, Jatropha,
Miscanthus,by-products,
wastes
Glucose
CelluloseLignocellulose
ETBE
Wheat, maize,
manioc, rice, cassava
starch
Corn-gluten
feed
Fermentation
Thermochemical
Processes, BtL
CO2
Micro- and macro-algae Methy esters
of fatty acidsChemistry
2nd generation
3rd generation
Oils
Ethanol
gazoline
gazoline
diesel
Butanol
Isoprenoides,
alcans

Common features
- biotechnology from biodiversity systems biology to synthetic biology and
integrative biology (crossing of food, energy systems, chemical).
- Systemic approach
Two complementary visions:
- Bio-Based Economy: a scientific and economic strategy to create the
conditions for a transition from an economy based on fossil fuels to one based
on biological raw materials (economic growth efficient economy in harmonyon biological raw materials (economic growth efficient economy in harmony
with the environment and economy adopted by the citizen-consumer).
Biotechnology are then elements of technological breakthrough in our socio-
ecosystems. The bio-economy is the operational arm of sustainable
development, in synergy with the evolution scenarios based on sobriety for
so-called developed societies.
- BioEconomy: sustainable growth through advances in the biosciences to the
"biologization" industrial processes and products, with the development of
environmental technologies and wastes reduction.

Oil
Glycerol
Ethylen
Methanol,
Ethanol
Ethanol
Paraffins
CO2, CO, H2
Clostridium
acetobutylicum
ButaneSuccinic
acidGlucose
Coal
Lignocellulose
Natural gas BiomasseMethane
methanation
methanisation
Lipids
Naphta
Isobutene
Fatty acids
Butadien
Ethylen
Propene
(propylene)
Aromatics
(Phenol)Aceton
ETBE
Acrylic acid Acide
3-hydroxypropionique
Clostridium Beijerinckii,
acetobutylicum
1,4 -butanediol
Diesel)


The second new frontier : lignocellulose
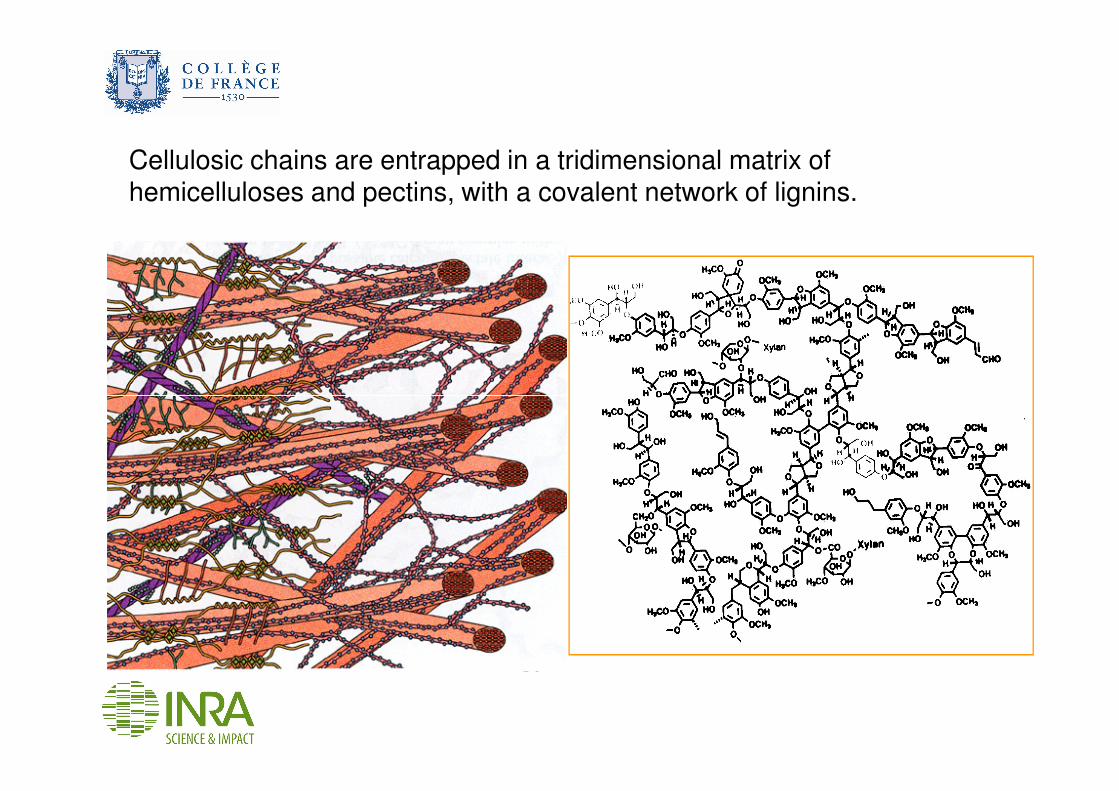
Cellulosic chains are entrapped in a tridimensional matrix of hemicelluloses and pectins, with a covalent network of lignins.

% Celluloses Hemi-celluloses
Lignins Ashes
Wheat straw 51-54 26-30 16-18 7-8
Kénaf 55-59 23-25 12-15 2-5
Hard wood 38-49 19-26 23-30 1
Ligno-cellulose = substrat complexe
Soft wood 40-45 7-14 26-34 1
Glucose (C6)Phényl-propane
units
polymerizedArabino-glucurono-xylanes (cereals)
Galacto-gluco-mannanes (softwoods)
Glucurono-xylanes (hardwoods)
Homogalacturonanes (pectines, P I)
C5 > C6

Scales
Protecting ecosystemic services
Reducing green house
gaz emissions
.021Paul COLONNA / Plant Based Summit, 2013 November 19th, 2013
Earth
Forests vs
Fields vs
Protected landscapes
Vs urban zones
Chloroplastfield
Game changers
Climate change Land uses
changesAgroecology Species and
cultivars
Green
biotechnologies
Reversibility

Photosynthesis – carbon reactions
Sucroase, starch,
Lipids, lignocellulose
H2Calvin cycleCO2
uptake
Lipids, lignocellulose
O2Active solar : 45%
Max photosynthetic conversion
extent: 27% x 45% = 15 %
Efficiency : 33 %
Source: Blakenship et al., 2011

Light response curves for
• C3 (P-glycerate; most plants, including trees)
• C4 plant (oxalate; maize, canne, sorgho, miscanthus)
• CO2 supply limits P/S in C3 plants
– Light saturation occurs at fluence
rates ~ 25% full sunlight
• CO2 does not limit P/S in C4
plants ANDmo
l m
-2s-1
)
.023Paul COLONNA / Plant Based Summit, 2013 November 19th, 2013
plants AND
• C4 plants have a higher
photosynthetic capacity
– C4 plants concentrate CO2
– C4 plants can take advantage of
excess light and don’t show light
saturation
– Utilization of excess light NRG allows
C4 plants to provide the ATP needed
to run the CO2 pumpFluence rate (µmol m-2 s-1)
CO
2 u
pta
ke
(µm
ol
m
Climate change

Choice of biological factory
yield (t/ha.year)
Organism Oil Sugars Lignocellulose
Microalgae 25-60
Lignocellulosic
plants
20-25
Sugar canne,
sugar beet
10 - 13
.024Paul COLONNA / Plant Based Summit, 2013 November 19th, 2013
sugar beet
Cereals 9 - 12
Rape,
sunflower, Soja
0.5- 2
Palm 5-7
Chemistry
Chemistry and materials
Chemistry and materials

Agroecology
Rationale: by understanding
ecological relationships and
processes, agroecosystems can
be manipulated to improveproduction and to produce more
sustainably, with fewer negative
environmental or social impacts
and fewer external inputs.
----- Protein content ------->
.025Paul COLONNA / Plant Based Summit, 2013 November 19th, 2013
Increasing nutrient input
From Dibb, 2000
and fewer external inputs.=> Design cropping systems that
mimic nature, optimal use can be
made of sunlight, soil nutrients and
rainfall
⇒ Crop diversity
⇒ Supply chain dependant
on territories
⇒ Lignocellulosic crops from
woodlots and hedges

Enzymes
des
espèces
Mutagénèse
aléatoire, puis
dirigée
10 à 20 variants
ciblés à partir
de données
Evolution
moléculaireDonnées
structurales non
nécessaires,
Accumulation de
modifications
bénéfiques
Conception
rationnelleModélisation,
screening
virtuel
Approche
combinant les
4 précédentes
Les enzymes: l’évolution qualitative
Baker, 2008espèces
Sauvages
4585 enzymes
MACiE database
de données
structurales Métagénomique
culture préalable
Métagénomique
105 à 106 clones
par banque sans
culture préalable
Amylase
(Payen, 1833) Smith, 1978
103-
104
Screening assays
105-
106
104-
105
A partir de Monsan (2010)
Arnold, 1997
Criblage à
haut débit
Mutagénèse
massive
Technology
-push
Souches
extrémophiles
Souches
extrémophiles
Accès aux
gènes
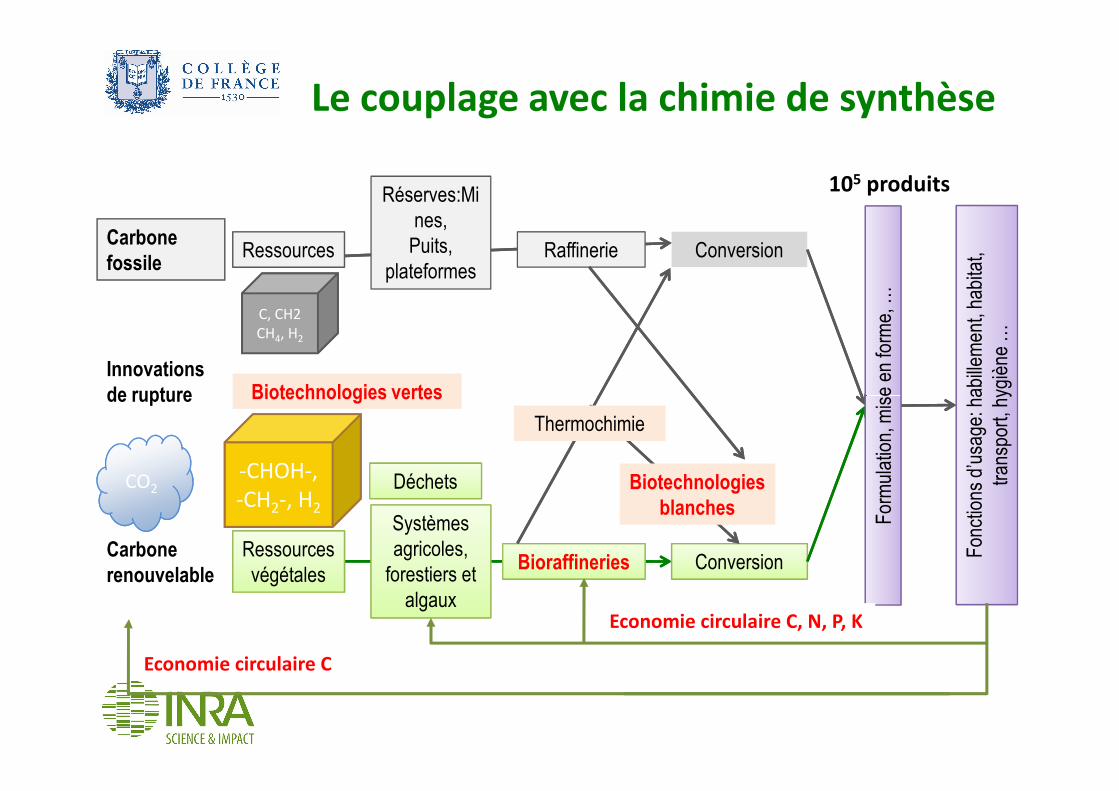
Le couplage avec la chimie de synthèse
Carbone
fossile
Innovations
de rupture
Ressources
Réserves:Mi
nes,
Puits,
plateformesRaffinerie Conversion
Biotechnologies vertes habillement, habitat,
hygiène…
miseen forme, …
105 produits
C, CH2
CH4, H2
Carbone
renouvelable
de rupture
Ressources
végétales
Systèmes
agricoles,
forestiers et
algaux
Bioraffineries
Biotechnologies vertes
Conversion
Fonctions
d’usage: habillem
ent
transport, hygiène
Formulation, mise
Déchets
Economie circulaire C, N, P, K
CO2-CHOH-,
-CH2-, H2
Economie circulaire C
Biotechnologies
blanches
Thermochimie

C as an energy carrier
30
40
50
34.4: Butanol (O/C:0.25)36.3: ETBE (O/C:0.17)
36.3: FAME (O/C:0.17)
42.5: Gasoline (O/C:0)
42.8: Diesel (O/C:0)
50.1: Methane (O/C:0)
44.0 : Microbial alcans44 .5: Isoprenoïdes
30 : Ethanol
Hydrogen 119.4 MJ/Kg
Industrial Biotechnologies
MJ/kg
10
20
30
14.2: Glucose (O/C:1)
26.9: Ethanol (O/C: 0.5)
28.8: DME (O/C:0.5)
00: CO2 / H2O
16 – 19 Biomass
> 20 Pyrolysis oils
30 : Ethanol

Losses of lands Surfaces
(106 ha)
♦ Earth 13 109 ha
♦Agriculture : 38 % (4,9 109 ha)
♦ 33 % (1,6 109) for annual and perennial plants, including 287 106 irrigated
♦ 66 % (3,2 billion) for meadows and permanent pastures
♦ Forests : 30 % (3,9 billion)
♦ Remaining surfaces would be difficult to use.
Land : a key productive variable with strong regional differences
.029Paul COLONNA / Plant Based Summit, 2013 November 19th, 2013
Deforestation for cultivation, mainly food, and urbanization 580
Overgrazing of 20% of grasslands 680
Over-harvesting for timber, industrial wood, wood energy (firewood) 137
Crop management defective, leading to water erosion, salinization 550
Industrialization, urbanization of agricultural lands 19,5
Source: FAO , 2009

Dream or nigthmare
• All the products of plant biomass, of all types, including wood, justcover 1.19 billion toe / year, or 10.1% of the energy consumedworldwide. An important part of this renewable energy is consumedlocally and escapes to the commercial channels. Biofuels account for35 Mtoe / year.
• In EU countries, biomass used for energy (including combustion) in2000 represented over 60% of total renewable energy consumed, with2000 represented over 60% of total renewable energy consumed, withthe bulk coming from wood or wastes and municipal solid waste : theweight of biofuels is almost negligible: 11 Mtoe / year.
• Bioenergies can be part of the energy mix, without coping withall needs.

Biomass availability
• Primary solid biomass use for heat and electricity will increase to ~ 160 Mtoe in 2020.
• Biofuels ~ 35 Mtoe: biodiesel 22 Mtoe, bioethanol 8 Mtoe, biomethane 0.7 Mtoe, biofuels fromwastes 2,7 Mtoe
• Estimated target in 2020: bioelectricity 14%, biofuels 24%, bio-heat 62%.
• Estimated potential: 350 Mtoe (15EJ)
– Studies EEA, BEE, European Forest sector outloook
• Main bottleneck: land
– Availability: the production of 1 TWh using biomass demands a ground
– area of 700 km2– area of 700 km
– Logistics and transportation infrastructures
• Biomass imports from third countries will increase, which may leads to higher sustainability risks
• Concerns about deforestation , forest certification requirements, concerns about ‘carbon debt’ issue, NGOs concerns
• National sustainability schemes are likely to have negative impacts on biomass trade and costs
Dauber et al., 2012
World Consumption mondiale: 442 EJ/year
Share of bioenergies: 50 EJ/year
Potential 100 à 300 EJ/year. Chum et al., 2011

For the citizen – consumer
Food
- food technologies have reached a plateau of technological maturity,
- processes and the food system: which sustainability?
Bio-energy, bio-based molecules and bio-based materials
three possible complementary ways:three possible complementary ways:
- Reproduction of original oil-based molecules;
- Production of biobased molecules with original properties (uses)
similar to those of oilbased molecules: innovation by substitution;
- Development of molecules or nano-objects with new features to
enhance the characteristics of vegetable raw materials: disruptive
innovation.

Societal controversies
• Safety of biotechnological processes, both industrial accidents and environmental
safety of commercial products (REACH).
• Intellectual property, due to in silico steps based software tools, broad spectrum of • Intellectual property, due to in silico steps based software tools, broad spectrum of
biotech building in very narrow spectrum, marketable for targeted applications.
• The ethics of living with the artificial life, especially in synthetic biology, which may
offend certain cultures.


![[B2B] Générer trafic et leads ciblés avec Linkedin - le cas Simplify.fr](https://img.pdfslide.us/doc/110x75/58796d6a1a28ab37368b5393/b2b-generer-trafic-et-leads-cibles-avec-linkedin-le-cas-simplifyfr.jpg)