Embed Size (px)
Citation preview

1
Renewable EnergyRenewable Energy
•
Figure 2-10 Renewables data 2004-2005 (REN21)
2
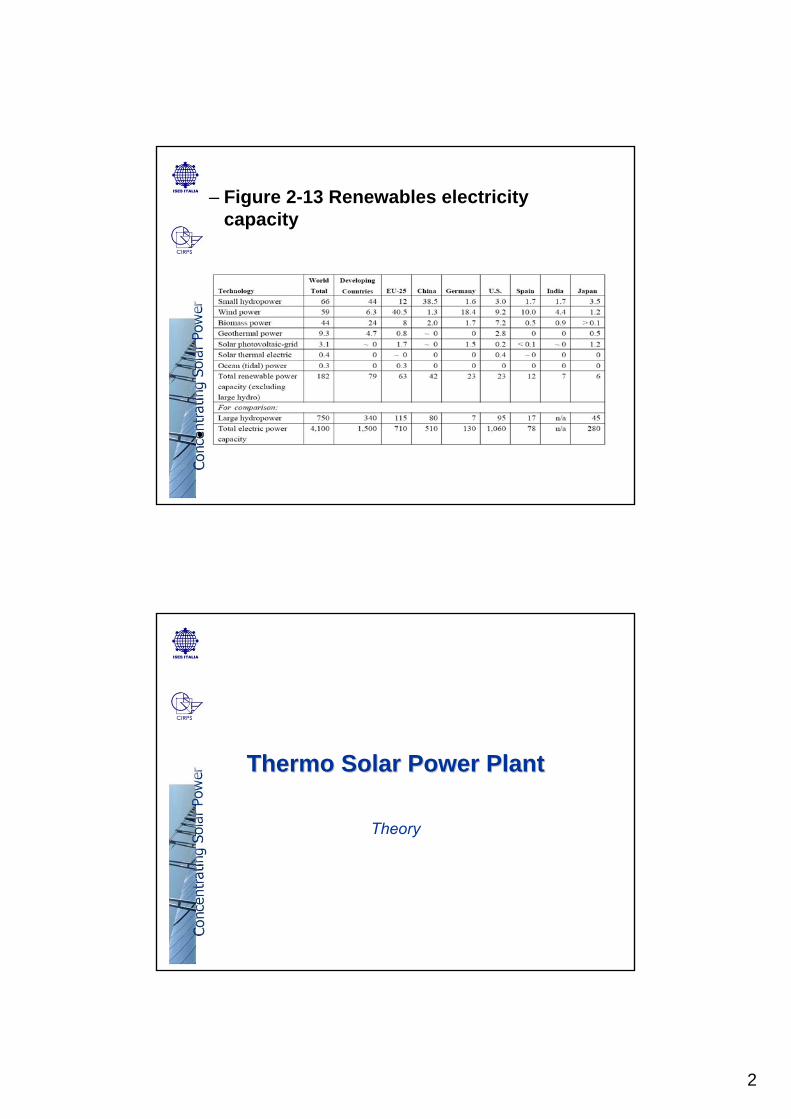
– Figure 2-13 Renewables electricity capacity
• S
Thermo Solar Power PlantThermo Solar Power Plant
Theory

3
Dish Stirling
Solar Tower
Parabolic Trough
CSP isideal for multi-megawatt central power stationsdispatch able power for peaking and intermediate loads through hybridization and/or thermal storagedistributed power for grid support and remote applicationsrapidly deployed because it uses conventional items such as glass, steel, gears, turbines, etc.Water requirements similar to coal-fired plant.
CSP: Concentrating Solar Power
CSP Technology provides CSP Technology provides sustainablesustainable, , clean and clean and reliablereliable powerpower fromfrom 10 kW to 200 MW10 kW to 200 MW
Parabolic Trough:- Size: 50 - 200 MW - proven utility scale technology - commercial operation since 1984- prefered technology for newplants in USA/Spain/MENA
Solar Tower:- Size: 50 - 100 MW - Demonstration plants builtin 80‘s (not operating yet)
- new 10-15 MW plants in Spain
Linear Fresnel:- Size 50 - 200 MW - in study phase
Dish Stirling:- Size 25 kW (modular) - few installations operating- applications competingwith PV

4
7
Key point: integration
TV
GVR
TG
TV
Diathermicoil
Diathermicoil / salt
Solar field Boiler
Oil/salt exchangerStorage
Molten saltsstorage
Stand alone
Combinedcycle
SteamPowerPlant
Steam390 °C
Steam390 °C
Steam550 °C
Collecting solar energy Electricity generation
Moltensalts
Two systems
Linear parabolic collectorsSystems with tower
ReceiverReceiver pipe
Reflector
Pipes of the solar field
Mirrors

5
Stirling EuroDISH
Functional diagram of a parabolic dish with Stirling motor at the focus
A dish/Stirling system consists of a wide-diameter parabolic mirror with a Stirling-type external combustion motor installed in its focal area.
The parabolic dish-mirror continuously tracks the sun, so that the sun’s rays are reflected onto its focal plane, obtaining a Gaussian shape concentrated solar energy map and several tens of kW.
The Stirling motor is an external combustion motor that employs the thermodynamic cycle of the same name and that has two advantages that make it appropriate for this application:
• Combustion is external, that is, the energy contribution may from sunlight collected by the parabolic dish and concentrated on its focal zone. • It is a high-performance thermodynamic cycle.
Plataforma Solar de Almería
In operation since 1992, this installation initially consisted of 3 7.5 m diameter
parabolic dish units capable of collecting up to 40 kWt energy with a SOLO V160 9 kWe
Stirling motor located in its focal zone
DISTAL I
EuroDISH
The second and latest attempt to make this technology economical is the
Spanish-German EUROdish project.

6
CesiRicerca
EuroDISH with Stirling motor SOLO V161Milano, CesiRicerca laboratory
World World DevelopmentDevelopment
Nevada Solar One
Thermosolar plant in Puertollano
“Archimede” Project
7
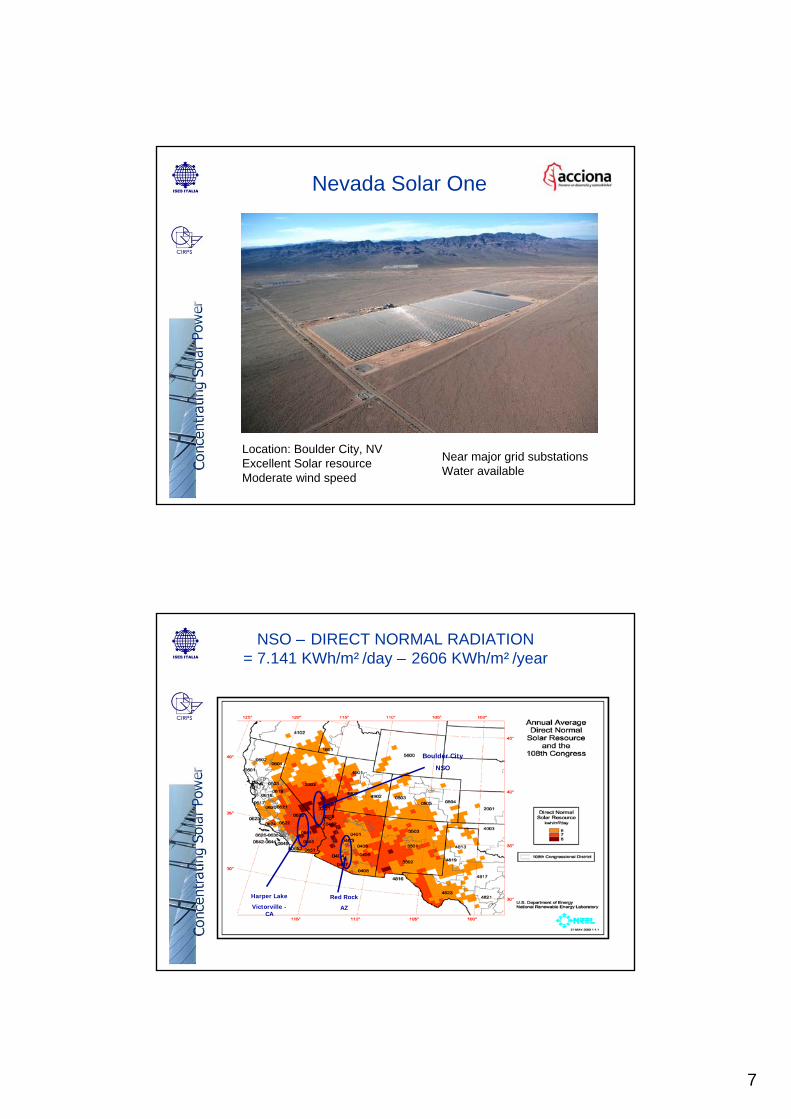
Nevada Solar One
Location: Boulder City, NVExcellent Solar resourceModerate wind speed
Near major grid substations Water available
Red Rock
AZ
Harper Lake
Victorville -CA
Boulder City
NSO
NSO – DIRECT NORMAL RADIATION = 7.141 KWh/m²/day – 2606 KWh/m²/year

8
Solar Collector Assemblies 760
Aperture Area (m/ft) 5/16
Aperture Area (m2/sq. ft.) 470/5059
Length (m/ft.) 100/328
Concentration Ratio 71
Optical Efficiency 0.77
# of Mirror Segments 182,400
# of Receiver Tubes 18,240
Field Aperture (m2) 357,200
Site Area (Km2/acres) 1.62/400
Field Inlet Temperature (°C/°F) 300/573
Field Outlet Temperature (°C/°F) 390/735
SOLAR FIELD
Turbine Generator Gross Output 75 MWe
Net Output to Utility 72 MWe
Solar Steam Inlet Pressure 86.1 bars/1248.8 psi
Solar Steam Reheat Pressure 19.5 bars/282.8 psi
Solar Steam Inlet Temperature 371°C / 700°F
POWER BLOCK
PROJECT OVERVIEW: NSO Characteristics
Generating Capacity 64 MW (Nominal)72 MW Net Output Steam turbine 357,200 m2 of Solar FieldAnnual Production > 130,000 MWhConstruction in Less than 18 months1,600.000 men hoursExcellent safety recordCapital investment : ≈ 250 Millions USD
Solar Field

9
PERFORMANCE FORECAST
90% PERFORMANCE TESTING
10
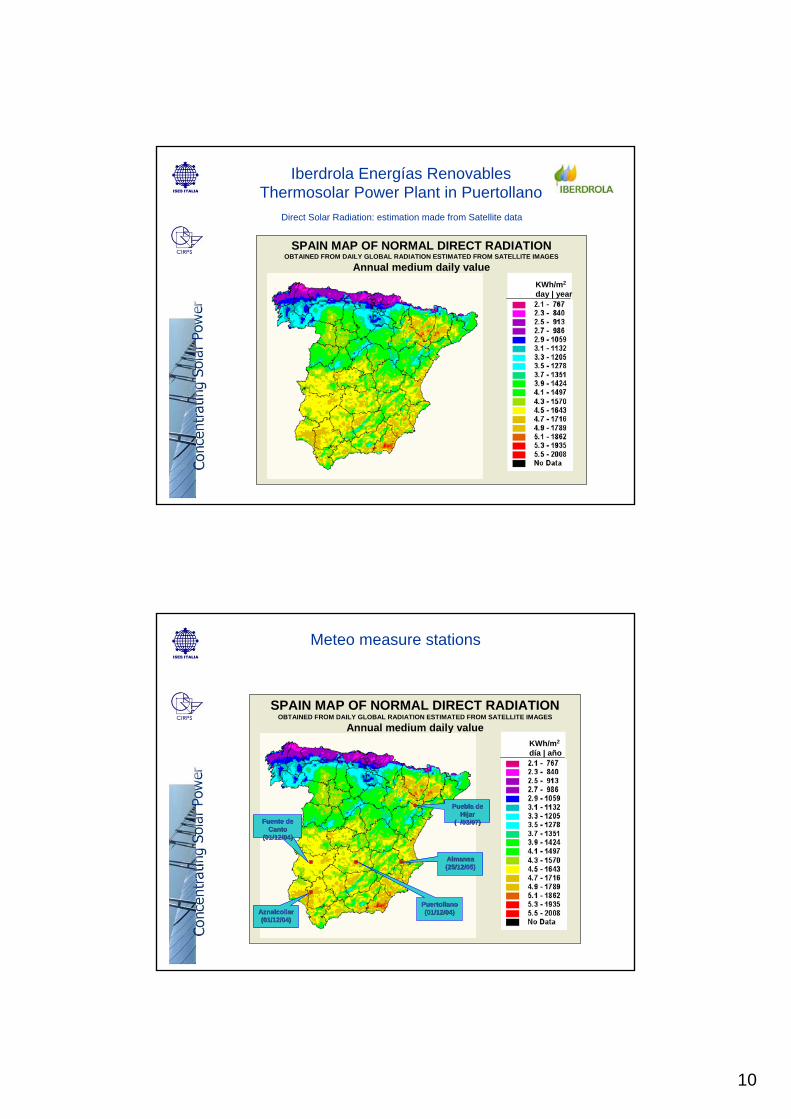
Iberdrola Energías RenovablesThermosolar Power Plant in Puertollano
Direct Solar Radiation: estimation made from Satellite data
SPAIN MAP OF NORMAL DIRECT RADIATIONOBTAINED FROM DAILY GLOBAL RADIATION ESTIMATED FROM SATELLITE IMAGES
Annual medium daily valueKWh/m2
day | year
Meteo measure stations
SPAIN MAP OF NORMAL DIRECT RADIATIONOBTAINED FROM DAILY GLOBAL RADIATION ESTIMATED FROM SATELLITE IMAGES
Annual medium daily valueKWh/m2
día | año
PuertollanoPuertollano(01/12/04)(01/12/04)
AlmansaAlmansa(25/12/05)(25/12/05)
Puebla de Puebla de HijarHijar
( /03/07)( /03/07)
AznalcollarAznalcollar(01/12/04)(01/12/04)
Fuente de Fuente de CantoCanto
(01/12/04)(01/12/04)

11
Thermosolar power plants under Promotion
MAPA DE ESPAÑA DE RADIACIÓN DIRECTA NORMALA PARTIR DE LA RADIACIÓN GLOBAL DIARIA ESTIMADA CON IMÁGENES DE SATÉLITE
Valor diario medio anualKWh/m2
día | año
PuertollanoPuertollano(01/12/04)(01/12/04)
AlmansaAlmansa(25/12/05)(25/12/05)
Puebla de Puebla de HijarHijar
( /03/07)( /03/07)
AznalcollarAznalcollar(01/12/04)(01/12/04)
Fuente de Fuente de CantoCanto
(01/12/04)(01/12/04)
MURCIA 50 MURCIA 50 MWMW(LorcaLorca))
ALBACETE 50 ALBACETE 50 MWMW(Almansa)(Almansa)
CIUDAD REAL 50 CIUDAD REAL 50 MWMW ((PuertollanoPuertollano))
SEVILLA 50 SEVILLA 50 MWMW((AznalcollarAznalcollar))
ZAMORA 50 ZAMORA 50 MWMW(Cubillos)(Cubillos)
ALMERALMERÍÍA 50 A 50 MWMW(Tabernas)(Tabernas)
SORIA 50 SORIA 50 MWMW((AlconabaAlconaba))
MADRID 50 MADRID 50 MWMW((EstremeraEstremera))
TERUEL 50 TERUEL 50 MWMW((AzailaAzaila/Puebla de /Puebla de
HijarHijar))VALDECABALLEROSVALDECABALLEROS I Y I Y
IIII100 100 MWMW Y 50 Y 50 MWMW dentro dentro
de Central de Central ((ValdecaballerosValdecaballeros))
BADAJOZ I 50 BADAJOZ I 50 MWMW(Fuente de Cantos)(Fuente de Cantos)
Design DataPower output: 50MWeProduction: 114,2GWh/yearAuxiliary electrical consumption: 11,08 GWh/yearGas hybridation: 15%Equivalent working hours: 2062 h/yearWater consumption: 570.000 m3/yearGas Consumption: 59.275.727 kWh/year
Period of construction:Beginning of the works: 19-03-07Plant in operation: End of 2008
Puertollano Project Data

12
CAMPO DE COLECTORES
SOLARES
CCP’s technology (Cilinder Parabolic trough collectors)
SOBRECALENTADOR
PRECALENTADOR
EVAPORADOR
TURBINA
DE VAPOR
RECALENTADOR
CALENTADOR AUXILIAR DE
ACEITE
Puertollano Process Diagram
Basic principle of workingA heat tranfer fluid (oil) is heated by the Solar FieldSteam is produced from the oilElectricity is generated from the steam
CCP - Cylinder Parabolic trough collector
Absorber tube

13
CCP - Cylinder Parabolic trough collector
Number of loops (600 m) 88Number of collectors (150 m) 352Total area of captation 287.760 m2
Volume of thermal oil 1.000 m3Oil limit temperature 12 – 400 ºCNumber of absorber tubes (4 m) 12.672Number of mirrors 118.272
Puertollano Panoramic Photo

14
SEGS Plants (Solar Electric Generation System)
Nine plants in total (354 MWe)SEGS I, 14 MW.SEGS II to VII, 30 MW (photo).SEGS VIII y IX, 80 MW.Start up of the first Plant in 1984Energy produced more than 10.000.000 MWh.More than 25.000 hours in operation.Installed in the dessert of Mojave (California, EEUU)30% of direct hybridation with Gas.
Plants in Operation
FocusFocus on Archimede Projecton Archimede Project

15
CSP ROADMAP
2001
2002
2006
2007
2008
Start-up of the project
Design components and test facility (PCS)
Start-up of the test facility (PCS)
Design and construction Archimede power plant
Start-up Archimedepower plant
Agreement with ENEL (Italian electricity utilities)
Experimental phase new components 2005
2004
2003Building test facility and main components
2010
Research phase
Industrial phase
2009
R&D Activities
• New solar collector design• Innovative receiving tube• New heat transfer fluid• Energy storage
ENEA design introduces relevant improvements to the current technology:

16
• Supporting structure• Reflective panels• Tracking system• Limited number of
assembling parts • Simple installation and
on field regulation• Reduced manufacture
and installation costs
Main beam (single tube)
Supporting arms (parabolic shape)
New solar parabolic collector design
New coating
Sputtering machine
New bellow
• Stable up to 600°C• Solar absorbance
>= 94%• Thermal emittance
~ 10% at 400°C< 14% at 550°C
New receiver tube

17
Molten salt (60% NaNO3 40% KNO3)
Advantages: – High working temperature (stable in air up to 600°C, low vapor pressure)– High thermal capacity– Low cost and environmental impact– Suitable for thermal storage (atmospheric pressure)
Disadvantages: – High freezing temperature (238°C)– Auxiliary electric heating system
New heat transfer fluid
Mean yearly conversion factors
Collectors (65,3 %)
88 % 91,9 % 81 % 80,7 % 82,2 % 41 %
One axistracking
Shades,Extremity losses.
Opticefficency
Thermalefficency Storage Electric
generation
199 105,1 86,4 35,4175,1 160,9 130,3
DNI
W/m2
Archimede energy conversion cascade
Overall efficency = 17,8 %

18
Site selection
- The site has been selected due to:- Combined Cycle Power Plant with steam integrability chance- High Global Insulation: 4,7 - 4,8 KWh/(m2 day) (max Italian value)- Constant and predictable climate- Not windy- Space available for solar field (100ha)- Flat site with 360° free horizon- Good auxiliary structures
1350
1750kWh/m2
Priolo Gargallo
Global insolation in Sicily
Demonstration plant: “Archimede” project
The plant will be located in Sicily at Priolo Gargallo near Siracusa and will be integrated in an ENEL Plant
Priolo
ENEL plant

19
Design parameters and expected performances
8.028t/yAvoided CO2 emissions2.571TOE/yPrimary energy saving
12300MWh/yGross electric energy produced
5,9MWeNominal electric power 15MWtMaximum SG thermal power 130MWhThermal storage capacity 290°CCold tank temperature550°CHot tank temperature
40780m2Collectors’ area
1.936kWh/(m2 y)Direct Normal Irradiation
ValueU.M.Parameter
Demonstration plant: “Archimede” project
Area available for
solar power plant
Solar field
Steam line
Storage system
Gas turbine combined cycle2 units of 380 MWe each
(250 MWe gas turbine 130 MWe steam cycle)

20
Timing
Activities
1 Preliminary Design
2 Executive Design & Procurement
3 Plant Erection
4 Commissioning
5 Experimental Operation
201120082007 2009 2010
EnergyEnergy PricePrice

21
Promising Markets for CSP
excellent good suitable not suitable
Sour
ce: S
olar
Mille
nniu
m A
G, E
rlang
en
High Potential for CSP in the South West of USA
Potential of identified areas:
200 GW generation capacity
470 TWh electricity per year(≈ 17% of total U.S. consumption)
(Source: NREL)
Huge power demand meets excellent solar resource

22
Long-Term Economic Electricity Potentials in EUMENA
Biomass
Wind
Geothermal
Hydro
Solar
Typical Yield (GWhel/km²/y)EUMENA Potential (TWh/y)
301950
301350
11100
11350
250630 000
Every 10 km² in MENA yield 15 million barrels of fuel oil per year in form of solar energy
Production Line for Receivers in Germany and Spain
Production Line in Mitterteich, Germany, operating since August 2006
Production Line near Seville, Spain, operating in March 08
annual capacity about 110 -160 MW per line
total Investment : 37 Mio Euro

23
Parabolic Trough Power Plant
Utility scale plant with conventional power block
2000 - 7000 full load hours via hybrid mode or using thermal storage
firm, dispatchable peak power w/o need of back-up capacity in the electric system
LECs today: 13 - 20 ct/kWh, future: 5 - 10 ct/kWh
How fast will the CSP-Market grow?
Forecasts for next 15 years between 4 and 45 GW (cum.)
in which forecast should we trust ?
Capacity in GW
Growth rate of wind in Europe
Growth rate of wind in Germany
Growth rate of wind in Spain

24
What brings the cost down?innovations in components and system, improved production technology
improving the overall efficiency
increasing the full load hours by using thermal storage
bigger power blocks (economy of scale)
reducing the O&M costs
1985 1990 2005 2010 2015 20200,00
0,05
0,10
0,15
0,20
0,25
0,30
0,35
0,40
0,45
no new plants
LEC
(€/k
Wh)
Roadmap for Parabolic Trough Plants
Key Success Factors for a Strong Market Growth
Technical and economical success of the first projects
stable green pricing or subsidies to bridge the initial gap in LECs
Successful LEC-reduction strong R&D to leverage the potential of technical improvement. Major challenges:
- higher temperatures (coatings, HTF)- thermal storage- component and system optimization
New markets and market opportunities (Power from North Africa to Europe)
strong CSP industry and strong political commitment

25
The Role of the EU and the Member States Push technology, pull demand, push generation
Market development and penetration:Install demand pull instruments, promote feed-in-laws as most powerful instrumentto push generation
open the European transmission grid for solar power from North Africaand secure this power import by implementing demand pull instruments
Technology:R&D-funding for material, component and system development(e.g. coatings, storage, direct steam/molten salt systems)
Fund demonstration plants to push new technologies (only proven technology is bankable)
PS10 construction (March 2006)

26
PS10 project was oriented to the construction of 11MW concentrating solar thermal plant using the technology of tower and heliostats field, for commercial exploitation in the frame of the R.D.436/2004 and later regulatory dispositions, that allow to this class of plants to access to a solar electricity tariff about 0,21€/kWh, (premium about 0,18€/kWh + pool about 0,03€/kWh)
• PS10 plant is promoted by Sanlúcar Solar S.A., company belonging entirely to Abengoa
• PS10 is financed by Banc Sabadell as Project Finance
• PS10 will achieve economical feasibility through the annual generation of 23GWh of electricity
PS10 Plant Cost: 35.000.000 €
European Commission contribution to the Project PS10: 5.000.000 €
Autonomic Government Junta de Andalucía contribution to the project PS10: 1.200.000 €
PS10 Project
CSP: plant in Spain or in Africa ? import from Africa cheaper than Spanish production:
going south: Solar gain stronger than transmission loss
Electricity Cost (Example Spain)
0
5
10
15
20
25
30
35
40
2000 2010 2020 2030 2040 2050Year
Elec
trici
ty C
ost [
c/kW
h]
PhotovoltaicsWindGeothermalHydropowerBiomassWave / TidalCSP PlantsOil GasCoalNuclearImport Solar
CSP fromSpain
CSP fromAfrica

27
Power generation cost from new plants, in Spain
4,04,55,05,56,06,57,07,58,0
2000 2010 2020 2030 2040 2050
Year
Aver
age
Ele
ctric
ity C
ost
[cen
t/kW
h]
Solar Import Electricity TRANS-CSP AverageElectricity Mix 2000
CSP fromAfrica
TRANS-CSP Mix: Energy Mix as described here incl. RUE, RES and CCSMix 2000: Maintaining exactly the Power Mix like in the Year 2000 with CCSNo Nuclear: Mix like in the Year 2000, but substituting Nuclear by Coal & CCS
Cost of Electricity Mix (Only New Plants, No Import)
Germany
4,0
4,5
5,0
5,5
6,0
6,5
7,0
7,5
2000 2010 2020 2030 2040 2050
Year
Ave
rage
Ele
ctric
ity C
ost
[c/k
Wh]
TRANS-CSP Mix Mix 2000 No Nuclear Solar Import

28
Power generation cost from new plants in Italy