Embed Size (px)
Citation preview

Renewable Power generation in India: Establishing Feasible Targets
Rangan BanerjeeDept of Energy Science and Engineering
Seminar at IIASA, Laxenburg June 4, 2008
India- Primary Commercial Energy
2003-4
Total comm
14000 PJ
Biomass 6500 PJ (33%)
Total
20500 PJ
19700 PJ (-non energy)
Hydro2.4%
Coal51.7%
Oil (D)9.8%
Oil Import24.9%
Nat gas9.1%
Wind0.2%
Nuclear1.8%

India - Fossil Fuel reserves
F u e l R e se rv e s P ro d n 2 0 0 3 -4
R /P ra tio
C o a l + L ig n ite
(M illio n T o n n e s ) 3 4 0 0 0 4 1 4 ~ 8 3 (P )
1 4 0 P + IO il (M illio n T o n n e s )
7 6 0 3 3 (1 1 7 )
2 3 (7 )
N .G a s B illio n m 3
9 2 0 3 2 2 9
U ra n iu m T o n n e s
6 1 0 0 0 P H W R ~ 5 0 1 0 G W
Data Source Plg Comm IEPC, 2006

NET POWER TO ULTIMATE CONSUMERS386000 MU (69 %)
58900MU
T & D LOSS175500 MU
31 %
ENERGY AVAILABLE 562000 MU
AUX.CON.41600 MU
(7 %)
STEAM424000 MU
( 71 %)
HYDRO84600 MU
(14 %)
GAS61500 MU
(10 %)
NUCLEAR17000 MU
(3 %)
RENEWABLES7100 MU
(1 %)
GROSS GENERATION 594000 MU
Import ( other countries)1700 MU
AUX.CON.5400 MU
(8 %)
7100 MU
8800 MU
Captive Generation71400 MU
RESIDENTIAL95700 MU
(21 %)
COMMERCIAL31400 MU
(7 %)
TRACTION9500 MU
(2 %)WATER WORKS ,
PUMPING & LIGHTING 14600 MU
( 3 %)
AGRICULTURAL88600 MU
( 20 %)
OTHERS8900 MU
(2 %)
INDUSTRIAL POWER (HV + LV)
196500 MU(44 %)
GROSS ENERGY CONSUMPTION 445000 MU

0
1000
2000
3000
4000
5000
6000
1960 1965 1970 1975 1980 1985 1990 1995 2000 2005
Year
Cap
acity
Add
ition
(MW
)
Annual Capacity Additions
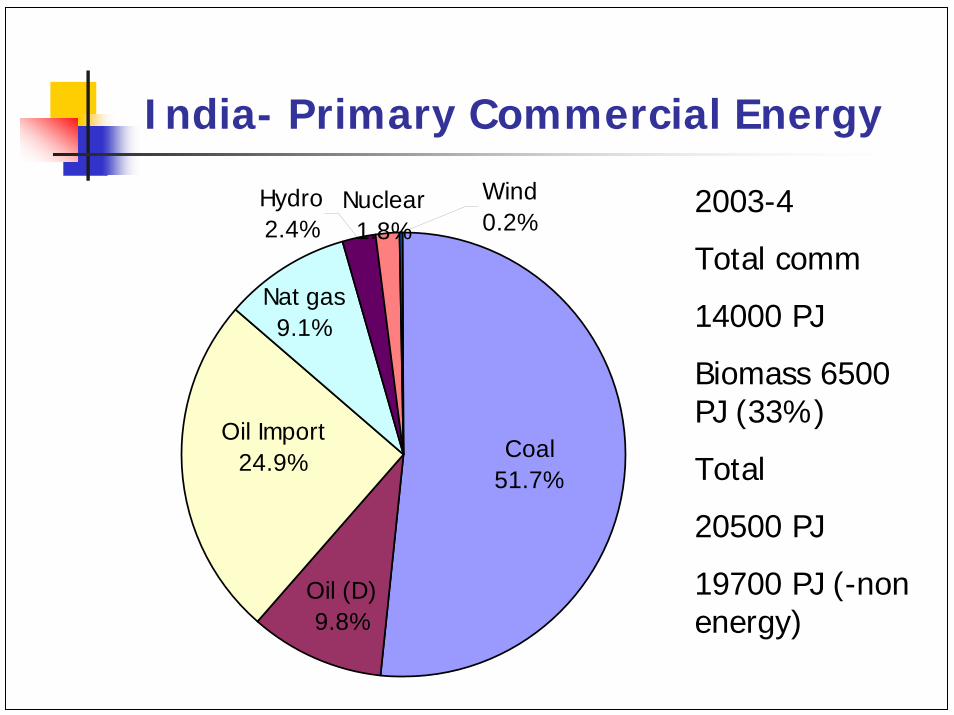
India - Electricity Sales
0
50000
100000
150000
200000
250000
300000
350000
1950 1960 1970 1980 1990 2000
Year
Elec
tric
ity S
ales
(GW
h)
S
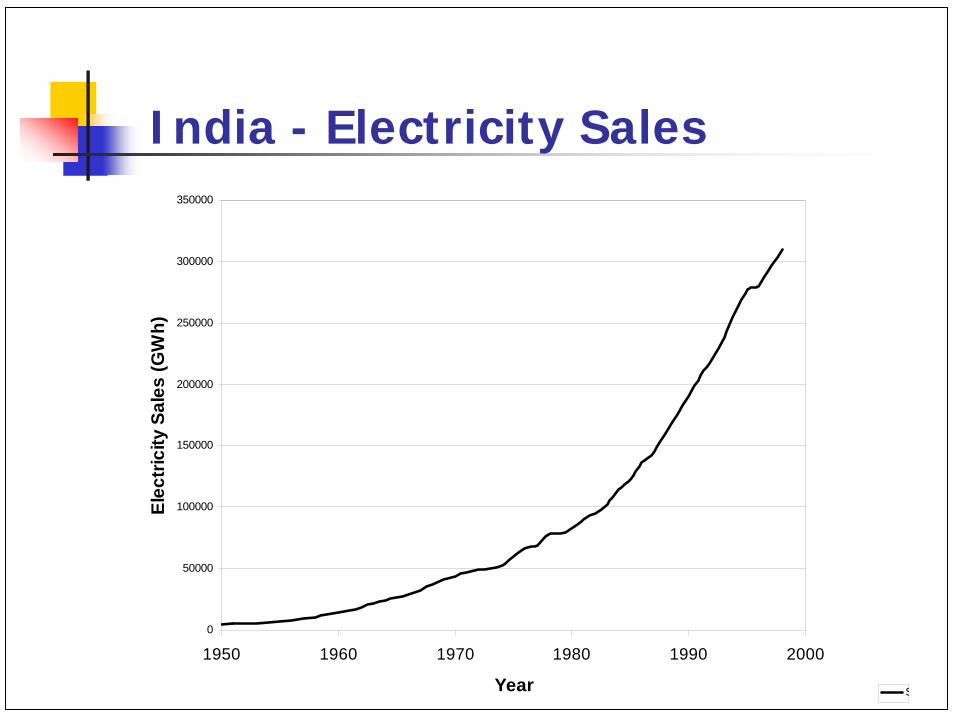
Need for Alternatives
Fossil fuel reserves limitedIndia - 17% of World population, 4% of primary energyPresent pattern – predominantly fossil based (87% comm, 64% total)52% of households unelectrifiedLinkage between energy services and quality of life

Renewable Energy Options
Wind Solar Small
Hydro Biomass
Tidal Energy
Wave EnergyOcean Thermal Energy
Solar Thermal
Solar Photovoltaic
Geothermal*

Power Generation Options
Power Generation
CentralisedGrid Connected
Cogeneration/Trigeneration
DecentralisedDistributed Generation
Isolated
Demand Side Management (Solar Water Heater,
Passive Solar)

Geothermal/OTEC/Tidal/Wave
World Cost Estimates
Geothermal COMMERCIAL 8240 MW 4c/kWh$2000/kW No Indian experience50 MW plant J & K planned
Tidal PROTOTYPE 240 MWFRANCE
LF 20%No Indian experience (3.6MW planned Sunderbans)
OTEC PROTOTYPE 50 kW210 kWNELHA
India 1MW gross plant attempted
Wave Energy
PROTOTYPE < 1MWGrid Connected
India 150kW plant Thiruvananthpuram
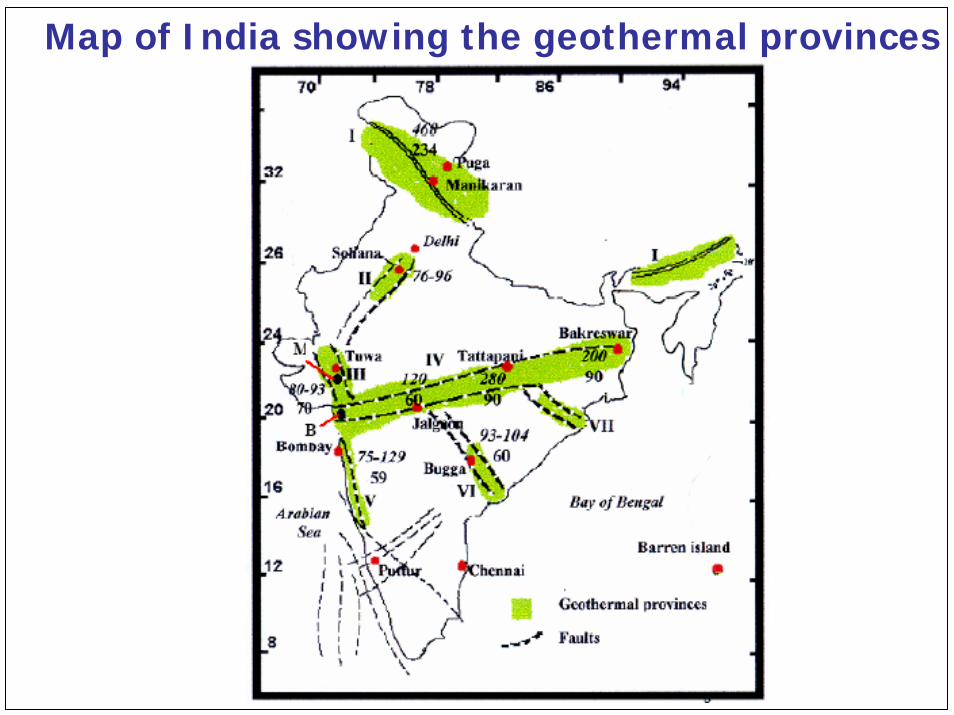
Map of India showing the geothermal provinces

OTEC plant schematic

Mooring Arrangement
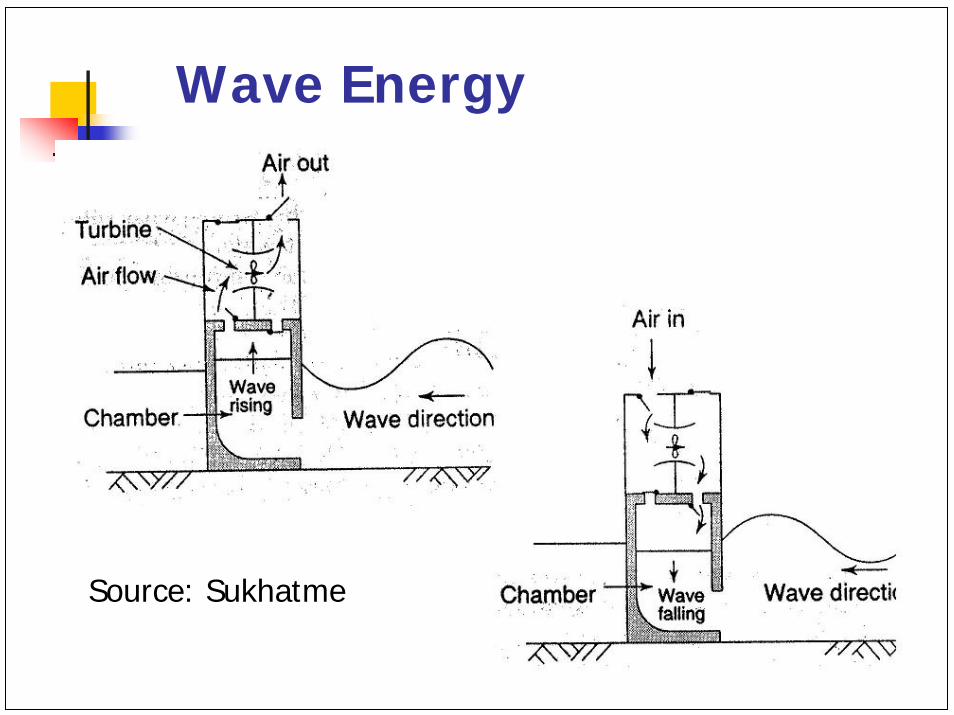
Wave Energy
Source: Sukhatme
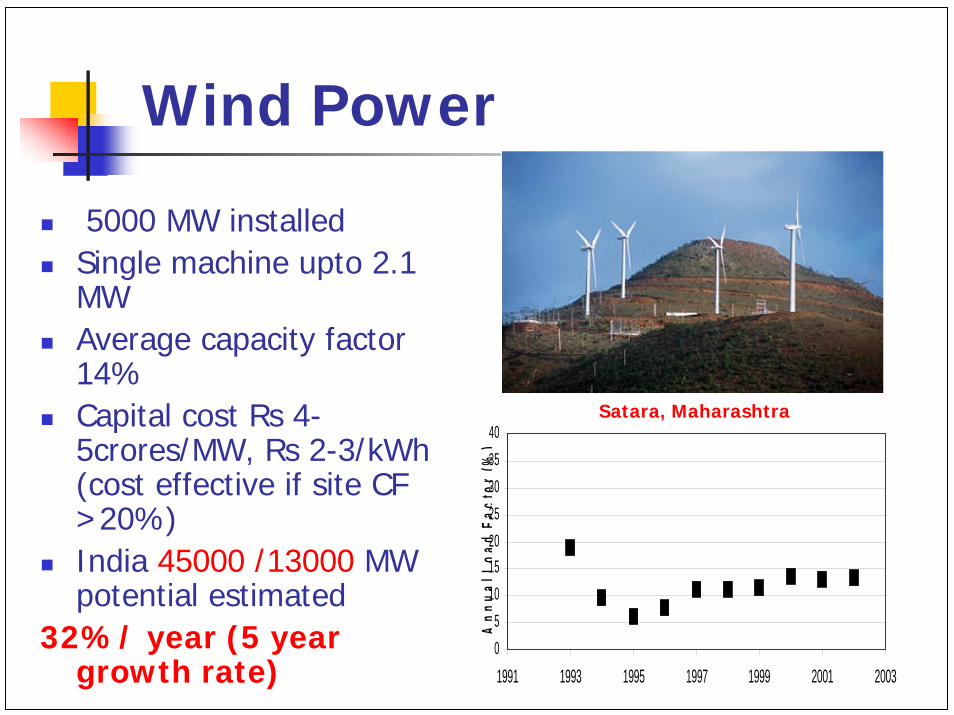
Wind Power
5000 MW installed Single machine upto 2.1 MWAverage capacity factor 14%Capital cost Rs 4-5crores/MW, Rs 2-3/kWh (cost effective if site CF >20%)India 45000 /13000 MW potential estimated
32%/ year (5 year growth rate)
05
10152025303540
1991 1993 1995 1997 1999 2001 2003
Ann
ualL
oad
Fact
or(%
)
Satara, Maharashtra


0
200
400
600
800
1000
1200
1400
Jan
Feb Mar AprMay Ju
n Jul
Aug Sep
Oct Nov Dec
Month of year
Act
ual M
onth
ly G
ener
atio
n (*
1000
kWh)
0
2
4
6
8
10
12
14
Ave
rage
Win
d Sp
eed
(m/s)
Monthly GenerationWind Speed

Small Hydro Power
Classification - Capacity-Micro less than 100 kWMini 100 kW - 3 MWSmall 3 MW - 15 MWMicro and Mini - usually isolated, Small grid connectedHeads as low as 3 m viableCapital Cost Rs 5-6crores/MW , Rs 1.50-2.50/kWh1846 MW (7%/year)
200 kW Chizami village, Nagaland
Aleo (3MW) Himachal Pradesh
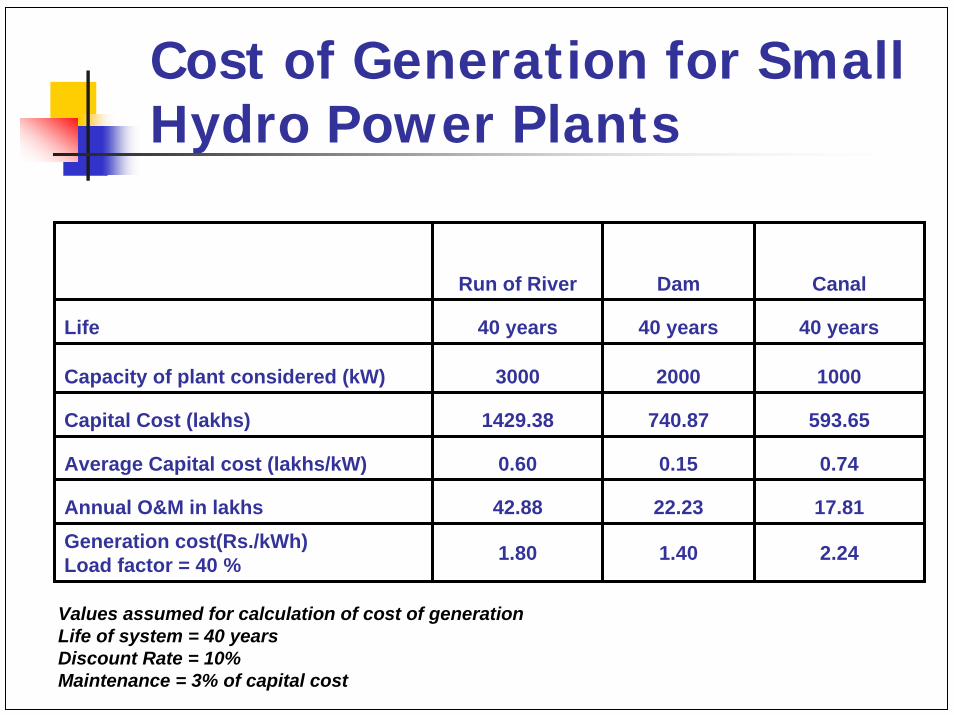
Cost of Generation for Small Hydro Power Plants
Run of River Dam Canal
Life 40 years 40 years 40 years
Capacity of plant considered (kW) 3000 2000 1000
Capital Cost (lakhs) 1429.38 740.87 593.65
Average Capital cost (lakhs/kW) 0.60 0.15 0.74
Annual O&M in lakhs 42.88 22.23 17.81Generation cost(Rs./kWh)Load factor = 40 % 1.80 1.40 2.24
Values assumed for calculation of cost of generationLife of system = 40 yearsDiscount Rate = 10%Maintenance = 3% of capital cost

Cost of Electricity Generation(Small Hydro)
0
0.5
1
1.5
2
2.5
3
3.5
4
4.5
5
0% 20% 40% 60% 80%
Capacity Utilisation Factor
Uni
t Cos
t of E
lect
rici
ty G
ener
atio
n (R
s./kW
h Run of RiverRun of River (with capital subsidy)DamDam (with capital subsidy)CanalCanal (with capital subsidy)

BIOMASS
THERMOCHEMICAL BIOCHEMICAL
COMBUSTION GASIFICATION PYROLYSIS
RANKINE CYCLE
PRODUCER GAS
ATMOSPHERIC PRESSURISED
FERMENTATIONDIGESTION
BIOGAS ETHANOL
Duel Fuel SIPGEGas Turbines
BIOMASS CONVERSION ROUTES

Biomass Power
Higher Capacity factors than other renewablesFuelwood, agricultural residues, animal wasteAtmospheric gasification with dual fuel engine -500 kW gasifier - largest installationCombustion – 5-7.5 MW Rs 2.50-4/kWh
Kaganti Power Ltd. Raichur Distt. A.P. 7.5 MW
100 kWe Pfutseromi village, Nagaland

Biogas45-70% CH4 rest CO2
Calorific value 16-25MJ/m3
Digestor- well containing animal waste slurry
Dome - floats on slurry- acts as gas holder
Spent Slurry -sludge- fertiliser
Anaerobic Digestion- bacterial action
Family size plants 2m3/day
Community Size plants 12- 150 m3/day
Rs 12-14000 for a 2m3 unit
Cooking, Electricity, running engine
Pura, Karnataka
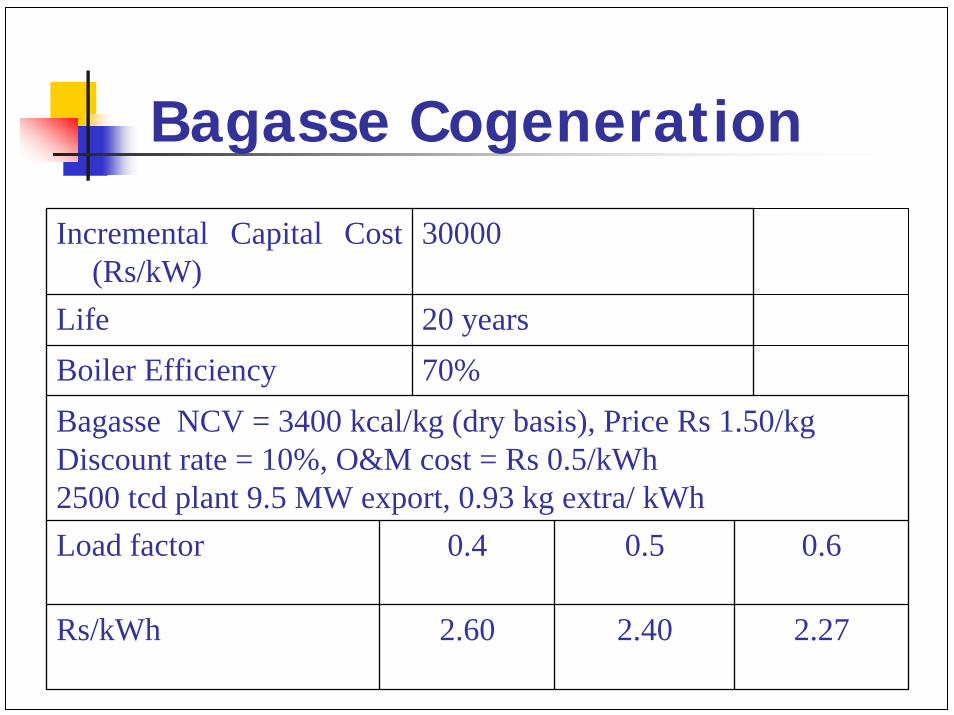
Bagasse Cogeneration
Incremental Capital Cost (Rs/kW)
30000
Life 20 yearsBoiler Efficiency 70%Bagasse NCV = 3400 kcal/kg (dry basis), Price Rs 1.50/kgDiscount rate = 10%, O&M cost = Rs 0.5/kWh2500 tcd plant 9.5 MW export, 0.93 kg extra/ kWhLoad factor 0.4 0.5 0.6
Rs/kWh 2.60 2.40 2.27

0 . 5 T / h r
F e e d w a t e r
P r o c e s s
P r o c e s s
2 a t a
~
S T E A M T U R B I N E
2 . 5 M W
6 a t a
B A G A S S E
5 8 T / h r 2 2 a t a 3 3 0 o C
4 . 5 T / h r 2 7 T / h r 2 6 T / h r
S c h e m a t i c o f t y p i c a l 2 5 0 0 t c d S u g a r f a c t o r y
F l a s h e d C o n d e n s a t e
P R D S
P R D S
M I L L I N G
0 . 5 T / h r
F E E D W A T E R
B O I L E R

F e e d w a t e r
Con
dens
er
2 a t a
P R O C E S S
7 5 T P H , 6 5 a t a , 4 8 0 O C
4 . 5 T P H
~
6 a t a
B A G A S S E ( A lt e r n a t e f u e l)
2 a t a
B F P
1 3 M W
B O I L E R
1 . 0 M WM il l d r iv e s
9 . 5 M W P o w e r e x p o r t
2 . 5 M WC a p t i v e lo a d
P R O C E S S
P R O P O S E D P L A N T C O N F I G U R A T I O N : O P T I O N 2
S T E A M T U R B I N E
C O N D E N S E R

PVThermal
Low Temp.<100 o C
HighTemp.>400 o C
Medium Temp. Upto 400 o C LineFocusing Parabolic
Solar PondSolar ChimneySolar Flat PlateCollectors
Parabolic Dish
Material
Single Crystal Silicon
Production Process
Central Tower
Amorphous Silicon
Wafer
CdTe/ GAAs
PolycrystallineSilicon
Thin Film
Solar Power
Technology Options for Solar power

Comparison of Solar Thermal Power Generation Technologies
TechnologyEfficiency Indian
ExperienceStatus Capital Cost
(Rs/kW)Electricity (Rs/kWh)
Solar FlatPlate Collectors
2% 10 kW exptl unit at IITM
D Rs. 300.000 _
Solar Chimney 1 % No experience 50 kW Spain
D Rs. 200,000 ($4600/kW)
_
Solar Pond 1-2% Experience for hot water Bhuj(Israel power 5MW)
D
Line focussingParabolic
Peak 20% Average 11-14%
50 kW system in SEC Planned 35MW solar in 140 MW ISCC at Mathania
C Rs. 140,000 ($3000/kW) ~390 MW of operating plants
15 c/kWhRs. 6/kWh
Paraboloid Dish 29% peak 12-18%
Demo unit 10 kW Vellore
D Rs. 150,000
Central Tower 23% peak 7-14%
No experience D ~Rs. 200,000 ($4700/kW)

b- bar
75.5 M W 103 b,371oC
Steam turbine
~
W HRB
Heat exchanger
Solar Heat Exchanger
Solar Radiation
Condenser
~
Air
Fuel
GTG-2 sets of35.2 MW
Aux. Firing Feed water
Steam, 103 b,500 oC
Steam, 103 b,500 oC
Flue gas from GT
BFP
To W HRB Heat Transfer oil, 291oC
391oC
Gas Turbine sets
Heat exchanger
GTG 2sets of 35 MW each Proposed
ISCC
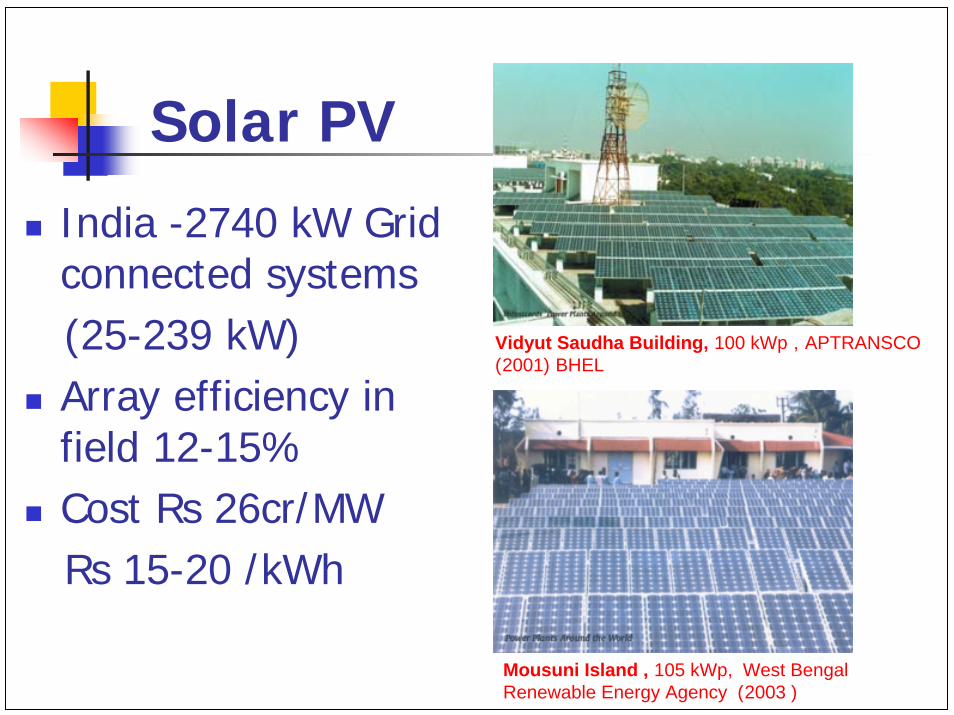
Solar PV
India -2740 kW Grid connected systems (25-239 kW)Array efficiency in field 12-15%Cost Rs 26cr/MW Rs 15-20 /kWh
Vidyut Saudha Building, 100 kWp , APTRANSCO(2001) BHEL
Mousuni Island , 105 kWp, West Bengal Renewable Energy Agency (2003 )

Solar Photovoltaic Power Plant
www.mnes.nic.in

Summary of Power Generation Technologies Using Renewable Energy
CDM Projects ApplicationsTechnology
Status of Technolog
y
Largest Installation
Capacity Factor
Cost of Generation (Rs./kWh)
No. of projects
MW Estimate of GHG abatement in million tCO2 eq.
Geothermal D 50 25%OTEC D 1 MWa -Wave P 150 kW -Tide P 3.6 MWb 17%Wind C 400 MW 14% 2.0-4.4 42 1186 20.5Small Hydro C 25 MW 40% 1.0-4.5 37 317 8.4Solar PV C 239 kW 15% 18.0-50.0 - - -
D - DemonstrationP - PrototypeC – Commerciala - Not operational till dateb – being planned
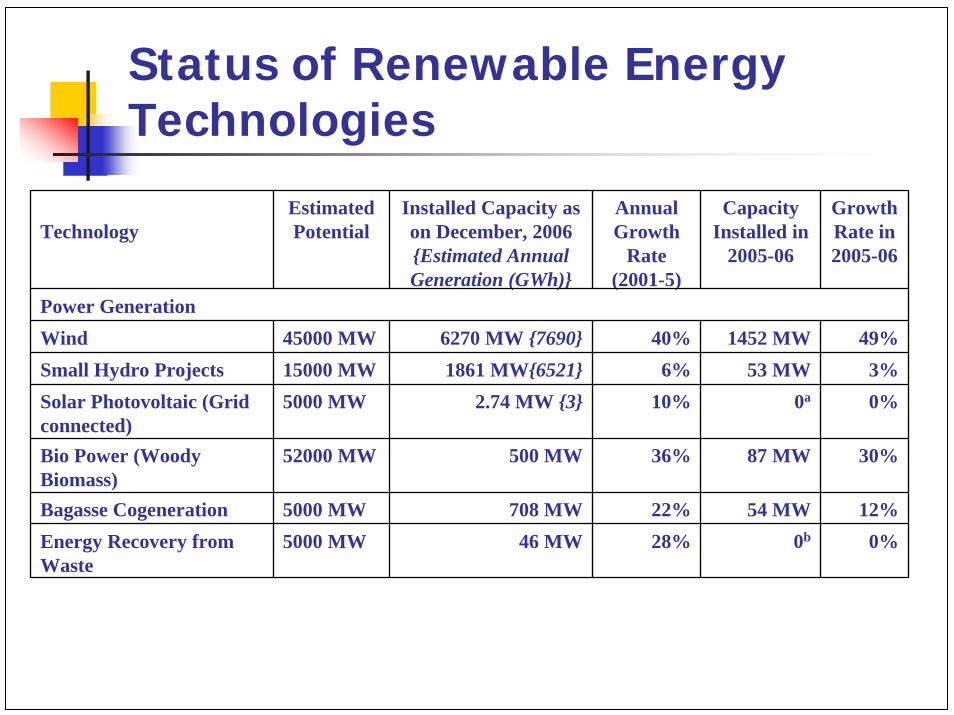
Status of Renewable Energy Technologies
TechnologyEstimated Potential
Installed Capacity as on December, 2006{Estimated Annual Generation (GWh)}
Annual Growth
Rate (2001-5)
Capacity Installed in
2005-06
Growth Rate in 2005-06
Power GenerationWind 45000 MW 6270 MW {7690} 40% 1452 MW 49%Small Hydro Projects 15000 MW 1861 MW{6521} 6% 53 MW 3%Solar Photovoltaic (Grid connected)
5000 MW 2.74 MW {3} 10% 0a 0%
Bio Power (Woody Biomass)
52000 MW 500 MW 36% 87 MW 30%
Bagasse Cogeneration 5000 MW 708 MW 22% 54 MW 12%Energy Recovery from Waste
5000 MW 46 MW 28% 0b 0%

TechnologyInstalled
Capacity as on December,
2006
Annual Growth
Rate (2001-5)
Capacity Installed in
2005-06
Growth Rate in 2005-06
Decentralized Energy SystemsBiogas Plants 3.9 million 4% 0.02 million 1%
Improved Chulhas 35.2 million 1% 0 0%
Solar Photovoltaicsi.Solar Street Lighting System (March 31, 2006)
54795 nos. 4% 1023 nos. 2%
i.Solar Home Lighting Systems (March 31, 2006)
342607 nos. 11% 16530 nos.5%
i.Solar Power Plants (Isolated) 1.86 MWp 3% 0.59 MWp 3%
Solar Thermali.Solar Water Heating Systems 1.65 million m2 26% 0.2 million
m225%
i.Box solar cookers 0.6 million 4% 0.25 5%
i.Concentrating dish cookers 2000 nos. 98% 0 nos. 0%
i.Community cookers 12 nos. - 1 nos. 10%
Wind Pumps 1137 nos. 8% 62 nos. 7%
Aero-generator /Hybrid Systems 0.5 MW 38% 11 kW 3%
Solar Photovoltaic Pumps 7015 nos. 14% 366 nos. 6%

Renewable Installed Capacity trend
0
2000
4000
6000
8000
10000
12000
1992 1994 1996 1998 2000 2002 2004 2006 2008
Year
Inst
alle
d C
apac
ity

Perspective Plan (MNRE)
Source: 11th Plan proposal MNRE Govt of India

Renewable installed capacity and generation
Installed Capacity*(MW)
Estimated Capacity factor
EstimatedGeneration
(GWh)Wind 7845 14% 9621
Biomass Power 606 70% 3185
Biomass Gasifier 86 60% 527
BagasseCogeneration
720 60% 3784
Small Hydro 2046 40% 7169
Waste to Energy 55 50% 241
Solar PV 2.74 20% 5
Total 11360 25% 24380*as on Jan 1, 2008

Estimated Renewable Generation in India
0
5000
10000
15000
20000
25000
2001 2002 2003 2004 2005 2006 2007
Y ear
Ann
ual G
ener
atio
n (M
iliio
n K
Wh)
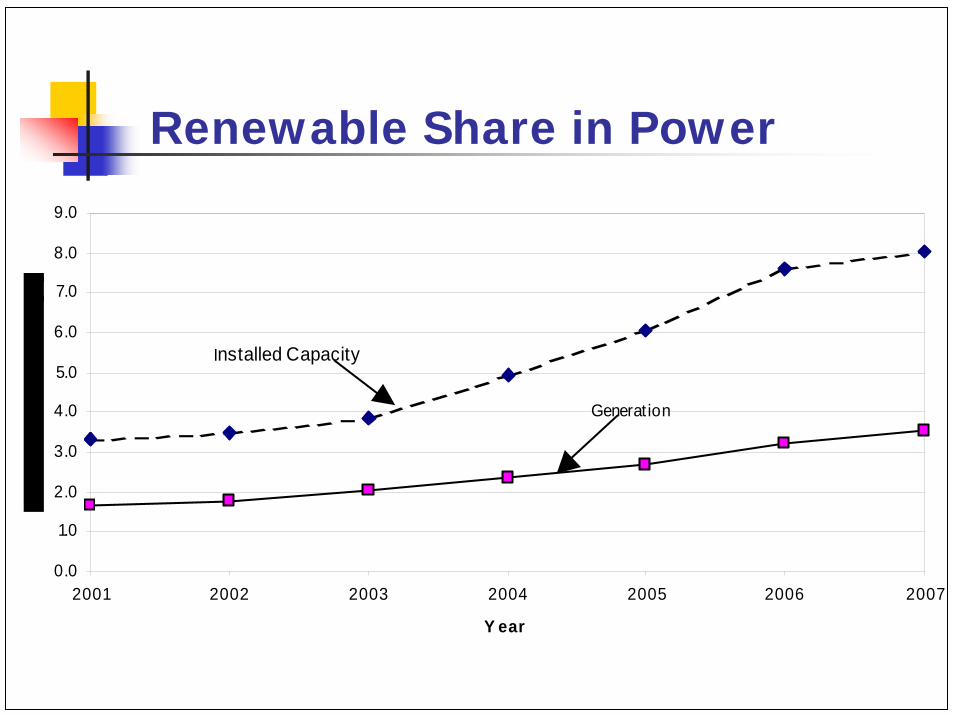
Renewable Share in Power
0.0
1.0
2.0
3.0
4.0
5.0
6.0
7.0
8.0
9.0
2001 2002 2003 2004 2005 2006 2007
Y ear
Installed Capacity
Generat ion

Trend of wind energy development in India
0
1000
2000
3000
4000
5000
6000
7000
Till 03
/92199
2-93
1993-9
4199
4-95
1995-9
6199
6-97
1997-9
8199
8-99
1999-2
000
2000-0
1200
1-02
2002-0
3200
3-04
2004-0
5200
5-06
Till 09
/06
Year
Inst
alle
d C
apac
ity (M
W

Generation from wind
0
500
1000
1500
2000
2500
3000
3500
Till 03
/9219
92-93
1993
-9419
94-95
1995
-9619
96-97
1997
-9819
98-99
1999
-2000
2000
-0120
01-02
2002
-0320
03-04
Year
Pow
er G
ener
ated
Ann
ualy
(GW
h)..

Diffusion curve
L wind potential estimate.
P cumulative installed capacity
dP/dt increment in installed capacity
)( PLPdtdP
−α
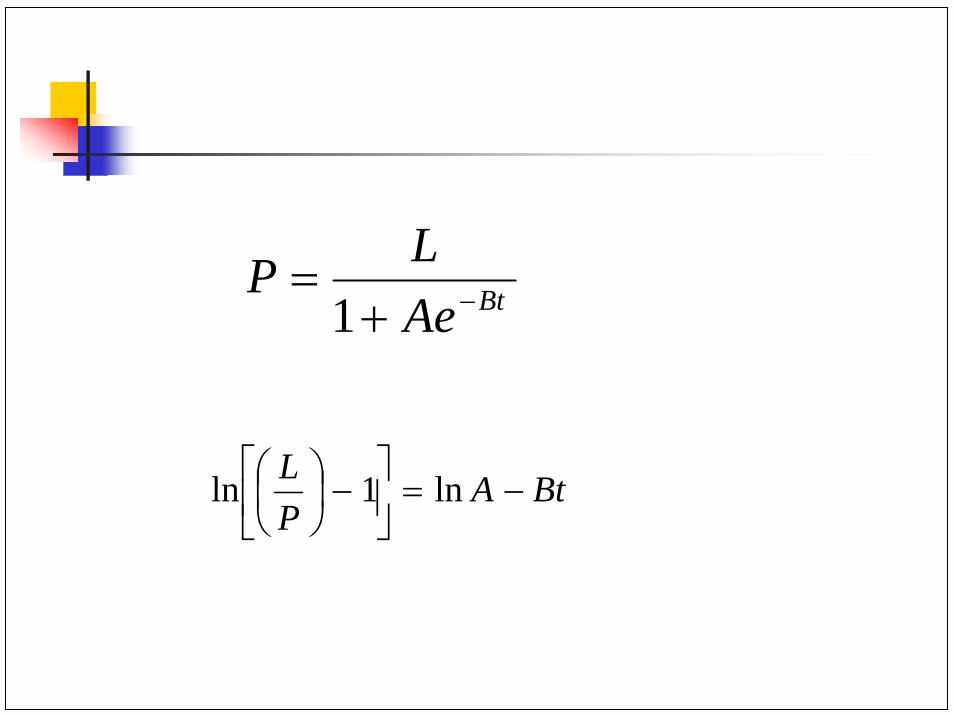
BtAeLP −+
=1
BtAPL
−=⎥⎦
⎤⎢⎣
⎡−⎟
⎠⎞
⎜⎝⎛ ln1ln
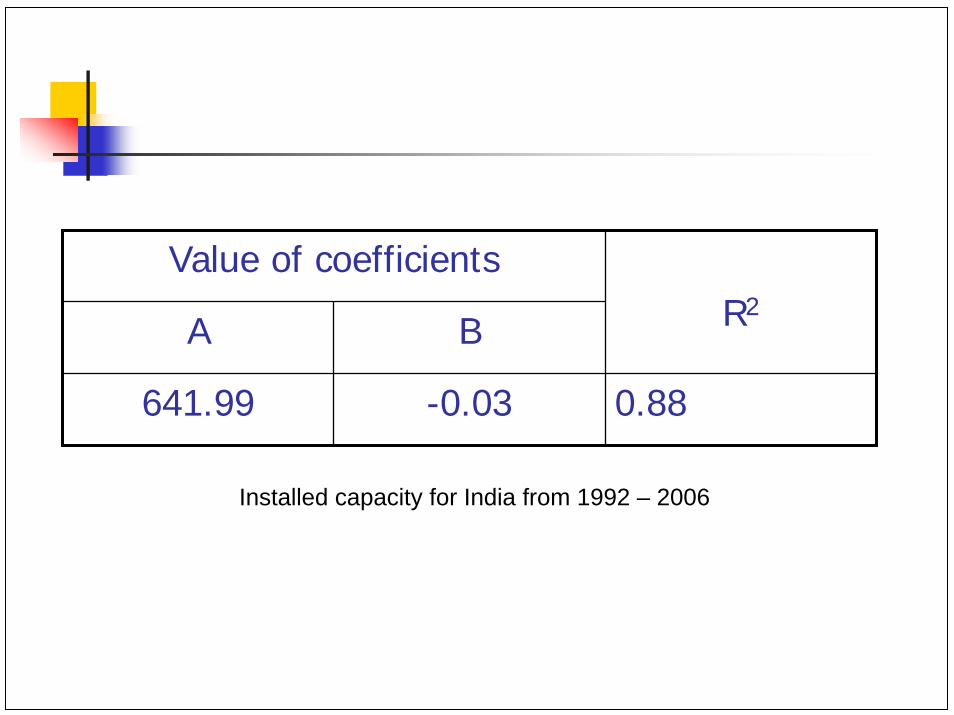
Installed capacity for India from 1992 – 2006
Value of coefficients
A B
641.99 -0.03 0.88
R2

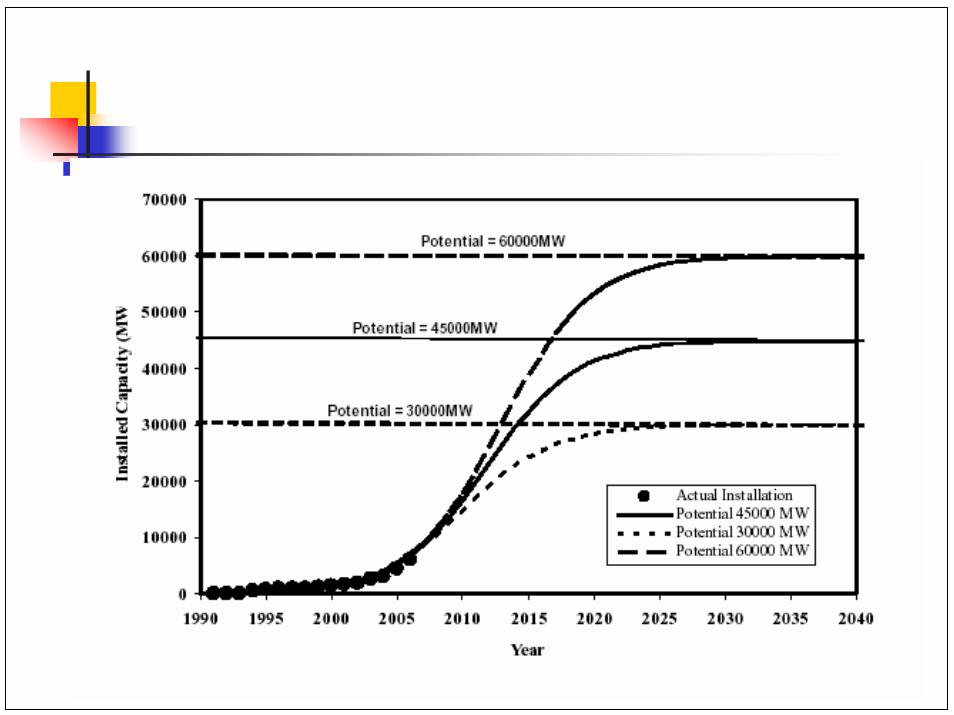
Diffusion Curves for wind energy
0
10000
20000
30000
40000
50000
1990 1995 2000 2005 2010 2015 2020 2025 2030 2035 2040
Year
Inst
alle
d C
apac
ity (M
W
Actual InstallationDiffusion curve Upper limit of uncertainityLow er limit of uncertainityForecast Values by MNRE
Potential = 45000MW
a1
a2
aam
Values in the uncertainty limit of 5%
Year Projection by MNRE
Projection by diffusion curve Lower
limitHigher limit
2007 7000 8700 2000 248002012 17500 23000 5800 396002022 40000 42900 27400 44800

Trend of Installed Capacity Small Hydro Power Projects in India
0
200
400
600
800
1000
1200
1400
1600
1800
2000
1991 1992 1993 1994 1995 1996 1997 1998 1999 2000 2001 2002 2003 2004 2005 2006
Year
Inst
alle
d C
apac
ity (M
W
Installed CapacityCapacity Addition

Diffusion Curves for Small Hydro Power Projects
0
2000
4000
6000
8000
10000
12000
14000
16000
1990 2010 2030 2050 2070 2090 2110 2130
Year
Inst
alle
d C
apac
ity (M
W
Actual InstallationDiffusion curve Upper limit of uncertainityLower limit of uncertainityForecast Values by MNREDiffusion curve (accelerated growth rate =9%)
Potential =15000MW
Values in the uncertainty limit of 5%Year Projection by
MNREProjection by diffusion curve
Lower limit Higher limit2007 1960 1970 1860 20802012 3360 2550 2370 27402022 6500 4100 3710 4520

Hydro Diffusion
0
2000
4000
6000
8000
10000
12000
14000
16000
18000
20000
22000
1990 2010 2030 2050 2070 2090 2110 2130
Year
Inst
alle
d C
apac
ity (M
W).
Actual InstallationPotential 15000 MWPotential11000 MWPotential 20000 MWValues by MNRE Potential = 15000MW
Potential =20000MW
Potential = 11000MW

Maharashtra
0
500
1000
1500
2000
2500
3000
3500
4000
1990 1995 2000 2005 2010 2015 2020 2025 2030
Year
inst
alle
d ca
paci
ty o
f win
d po
wer
(MW
)
Tamil nadu
0
1000
2000
3000
4000
5000
6000
1990 1995 2000 2005 2010 2015 2020 2025 2030
year
inst
alle
d ca
paci
ty o
f win
d po
wer
in M
W
5000
5500
6000
6500
7000
7500
8000
8500
9000
9500
0 4 8 12 16 20 24
Jan-07junejulyaugustsept
0200400600800
100012001400160018002000
0 4 8 12 16 20 24
hours
Pow
er g
ener
ated
in M
W
januaryJuneJulyAugustSeptember
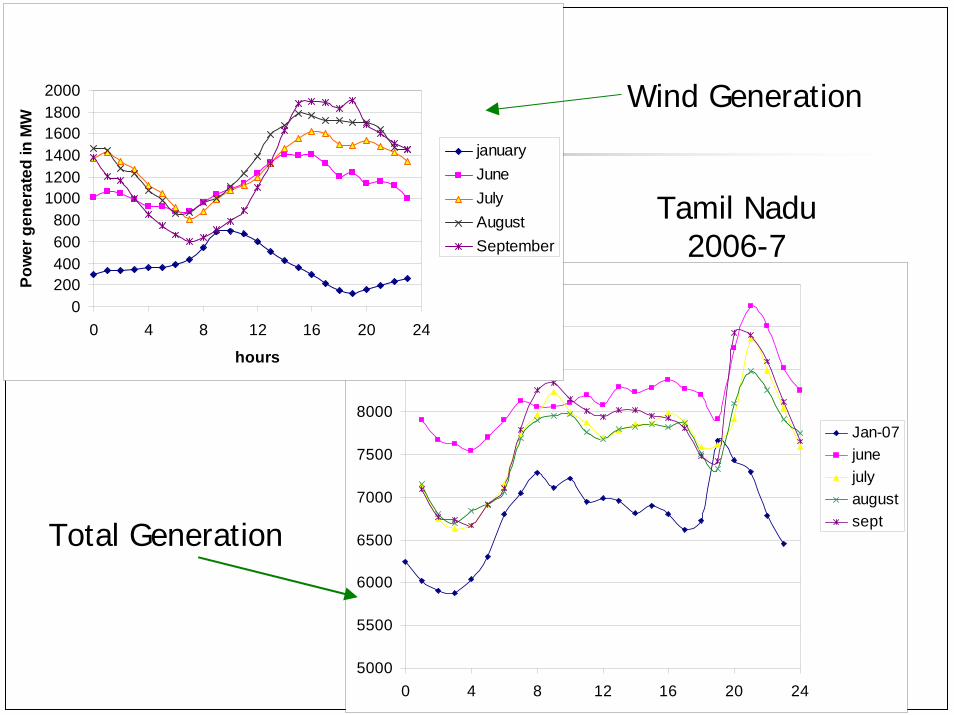
Wind Generation
Total Generation
Tamil Nadu2006-7

Growth in Production of Photovoltaic Modules in India
Solar PV Modules Production
0
10
20
30
40
50
60
70
1980 1985 1990 1995 2000 2005 2010
Year
Ann
ual P
V M
odul
e Pr
oduc
iton
(MW
)
Cost of Generation (Rs./kWh)Capital cost/MW
(Million INR)
Annualisedcapital cost (Million INR)
Annual O&M
(Million INR)
ALCC (Million
INR)CUF=10
%CUF=20
%CUF=25
%
300.60 35.30 6.00 41.30 47.17 23.58 18.87
Cost of power generation using solar PV
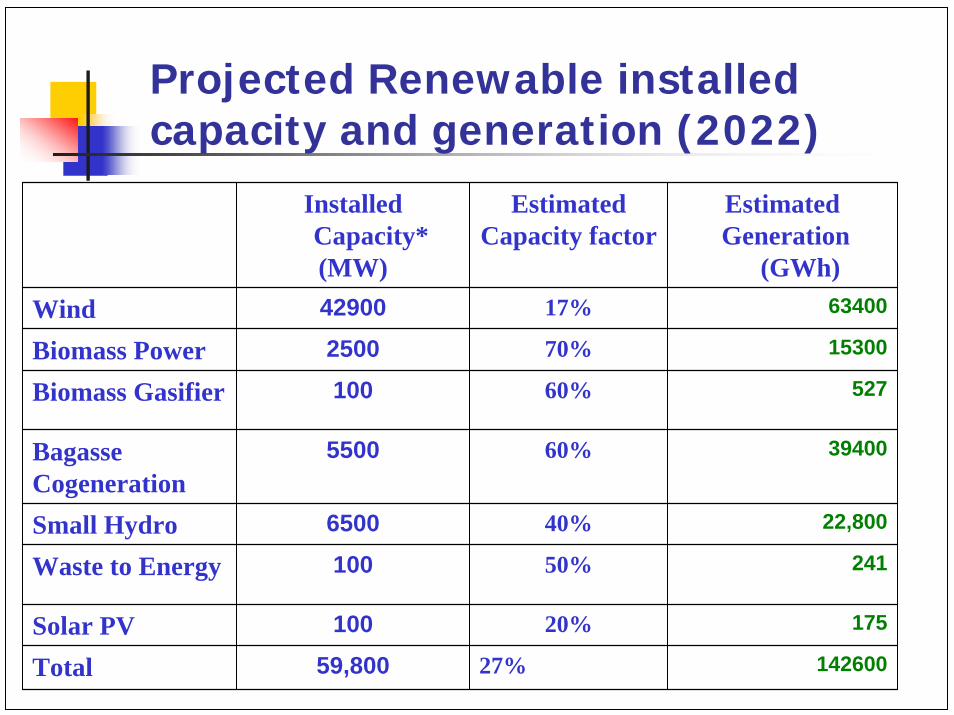
Projected Renewable installed capacity and generation (2022)
Installed Capacity*(MW)
Estimated Capacity factor
EstimatedGeneration
(GWh)Wind 42900 17% 63400
Biomass Power 2500 70% 15300
Biomass Gasifier 100 60% 527
BagasseCogeneration
5500 60% 39400
Small Hydro 6500 40% 22,800
Waste to Energy 100 50% 241
Solar PV 100 20% 175
Total 59,800 27% 142600

Aggregate Grid connected
Integrated Energy Policy Committee2022 – 425000 MW Installed capacity 2118000
GenerationRenewables 14% of Installed capacity6.7% of generationTrends of overall growth lower than forecast valuesTrends of renewable capacity higher than forecast valueTechnology cost reductionsNeed for refinement of methods

Solar Water Heating System
COLLECTOR
STORAGE TANK
FROM OVERHEAD
TANK
TO USAGE POINT
AUXILIARY HEATER
STORAGE TANK
COLLECTOR
PUMP
FROM OVERHEAD
TANK
TO USAGE POINT
Schematic of solar water heating system
AUXILIARY HEATER
Solar Water Heating Systems in India
– Installed Capacity = 1.5 million sq. m. (0.8% of estimated potential)

Model for Potential Estimation of Target AreaTarget area
Weather data, area details
Identification and Classification of different end uses by sector (i)
Residential (1) Hospital (2)
Nursing Homes (3)
Hotels (4)
Others (5)
POTENTIAL OF SWHS IN TARGET AREATechnical Potential (m2 of collector area)
Economic Potential (m2 of collector area)Market Potential (m2 of collector area)Energy Savings Potential (kWh/year)Load Shaving Potential (kWh/ hour for a monthly average day)
Sub-class (i, j)
Classification based on factors* (j)
Technical Potential
Economic Potential Market Potential
Potential for end use sector (i = 1)
Potential for i = 2
Potential for i = 5
Potential for i = 4
Potential for i = 3
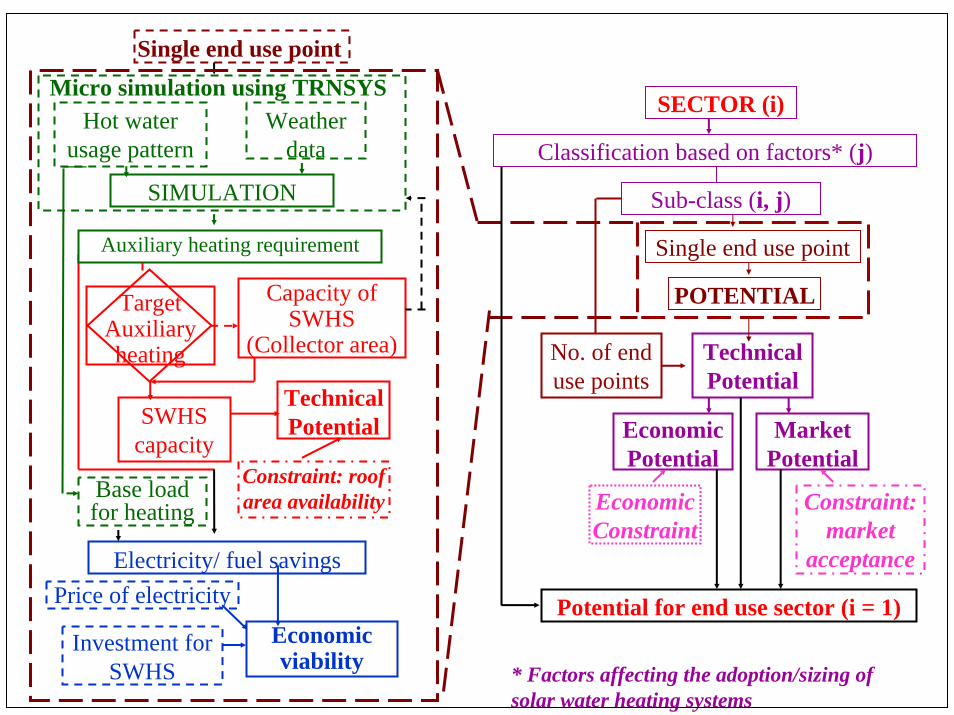
Base load for heating
Electricity/ fuel savings
Economic viability
Price of electricity
Investment for SWHS
Technical PotentialSWHS
capacityConstraint: roof area availability
Capacity of SWHS
(Collector area)
TargetAuxiliary heating
Single end use point Micro simulation using TRNSYS
Hot water usage pattern
Weather data
SIMULATION
Auxiliary heating requirement
No. of end use points
Technical Potential
Economic Potential
Economic Constraint
Market Potential
Constraint: market
acceptance
Potential for end use sector (i = 1)
* Factors affecting the adoption/sizing of solar water heating systems
Sub-class (i, j)
Classification based on factors* (j)
Single end use point
POTENTIAL
SECTOR (i)

Load Curve Representing Energy Requirement for Water Heating for Pune
0
100
200
300
400
500
600
700
800
900
1000
0 2 4 6 8 10 12 14 16 18 20 22 24Hour of day
Ene
rgy
Con
sum
ptio
n (M
W)
Typical day of January
Typical day of May
Total Consumption =760 MWh/day
Total Consumption = 390 MWh/day
53%
Electricity Consumption for water heating of Pune
Total Consumption =14300 MWh/day
Total Consumption = 13900 MWh/day
Total Electricity Consumption of Pune

Solar Water Heater Diffusion
0
10
20
30
40
50
60
70
80
1988 1998 2008 2018 2028 2038 2048 2058 2068 2078
Year
Inst
alle
d C
apac
ity o
f Soa
lr W
ater
Hea
ting
Syst
ems (
mill
ion
sq. m
.)
Actual installed (million sq. m.)Diffusion curve Upper limit of uncertainityLower limit of uncertainity Potential =60 million sq.m.

Diffusion of SWH
0
50
100
150
200
250
300
1990 2010 2030 2050 2070 2090
Year
Sola
r W
ater
Hea
ting
Cap
acity
(col
lect
or a
rea
in m
illio
sq. m
.)..
Actual installed (million sq. m.)Potential 140 million sq. m.Potential 60 million sq. m.Potential 200 million sq. m.Extrapolated Potential (million sq.m.)
Potential = 60 million m 2
Potential = 140 million m2
Potential = 200 million m2
Estimated Potential in 2092 = 199 million m2
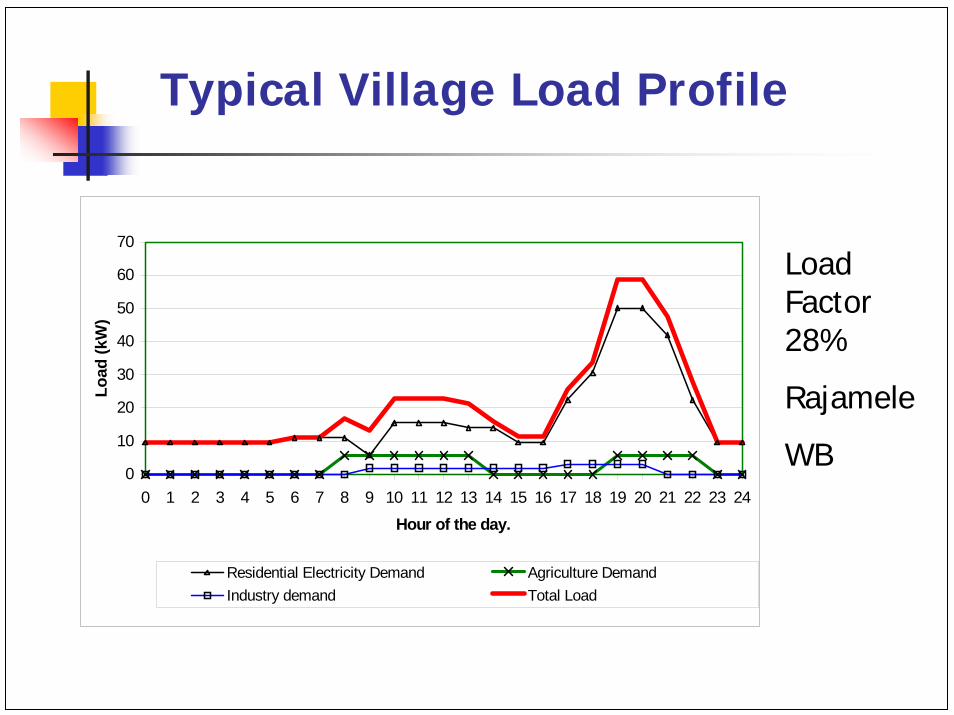
0
10
20
30
40
50
60
70
0 1 2 3 4 5 6 7 8 9 10 11 12 13 14 15 16 17 18 19 20 21 22 23 24Hour of the day.
Load
(kW
)
Residential Electricity Demand Agriculture DemandIndustry demand Total Load
Typical Village Load Profile
Load Factor 28%
Rajamele
WB

Only 44% of households have access to electricityCapacity of village electrification systems vary from 1 kW to 100 kWSupply for 4-6 hrs/day
~ 80,000 villages to be electrified
Village Electrification

Features of these villages (Sastry, 2003):Difficult terrain3-30 km away from gridNo. of households - 2 to 200Avg. population ~ 500Power demand quite lowTransport & communication facilities are minimalIncome levels & paying capacity low

State Type of Renewable Energy No. of Isolated Power systems
ChattisgarhPVBio-DieselHybridPVBio-mass
West BengalPV Wind-DieselBio-mass gasifier
17 (25 to 110 kW)1 (510 kW)2 (500 kW)
AssamPVMicro-hydel
11
PV
Karnataka PV Solar home lighting systems only
micro-hydel
800 (1 to 6 kW)05 (10 kW)01
Maharashtra2 (5 kW)1 (15 kW)
Andhra Pradesh Solar home lighting systems only
Kerala 2 (55 kW) – but recently got synchronized with the grid
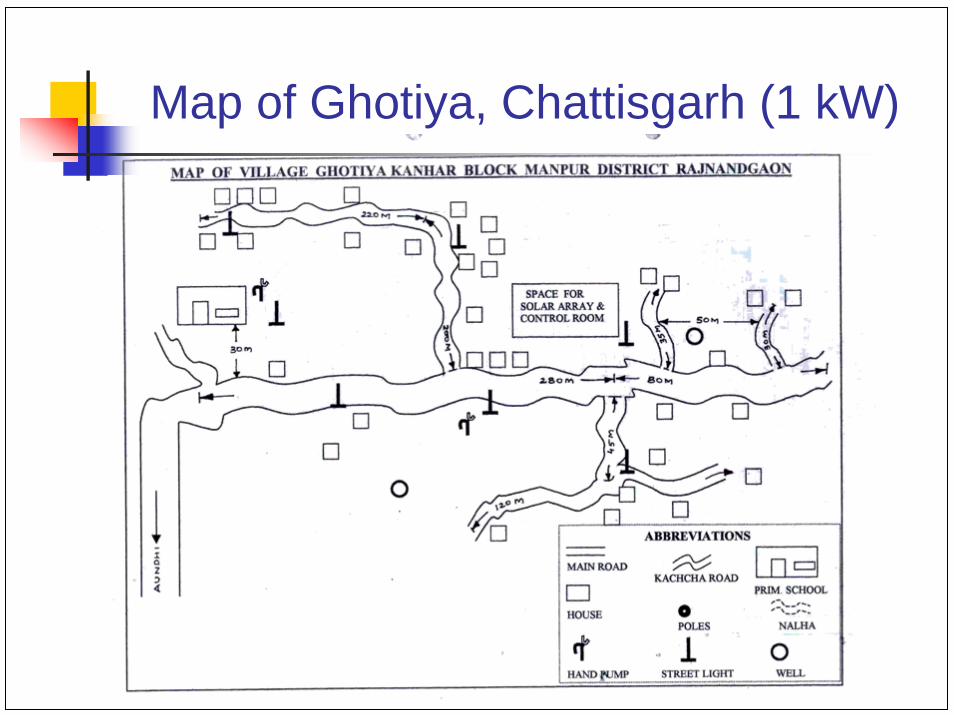
Map of Ghotiya, Chattisgarh (1 kW)
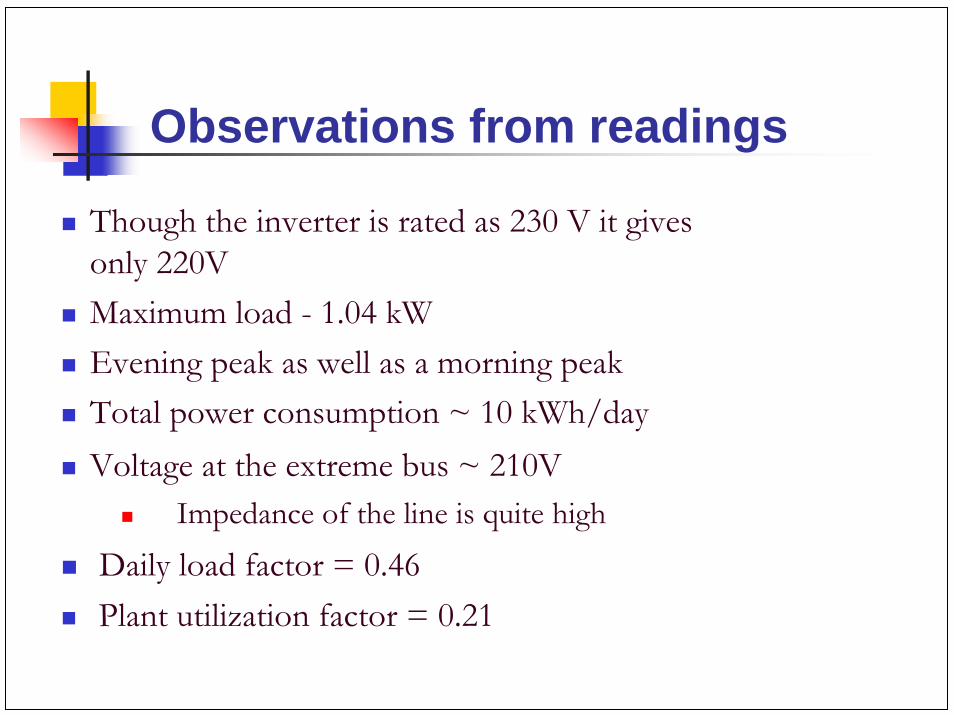
Observations from readings
Though the inverter is rated as 230 V it gives only 220VMaximum load - 1.04 kWEvening peak as well as a morning peakTotal power consumption ~ 10 kWh/dayVoltage at the extreme bus ~ 210V
Impedance of the line is quite high
Daily load factor = 0.46Plant utilization factor = 0.21

Successful initiatives in decentralized generation (Sharma, 2007)
DESI PowerBarefoot College, TiloniaAvani, UttaranchalNARI, PhaltanSunderbans, West Bengal
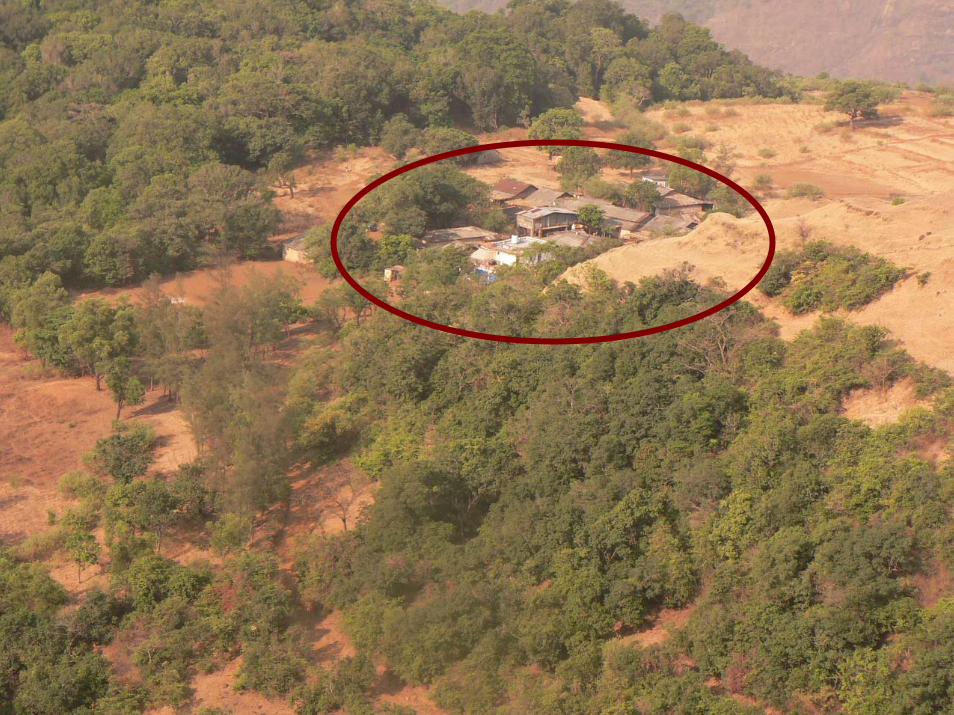

Map of Rajmachi, Maharashtra
System SpecificationsCapacity: 5 kWSingle phase, 220 V 100 PV modules of 50 W eachLead acid battery of tubular type120 V; 800 AhInverter: 7.5 kVA

5 kWp Solar PV system at Rajmachi village, Maharashtra

Experimental setup forthe measurement of load curve and generation
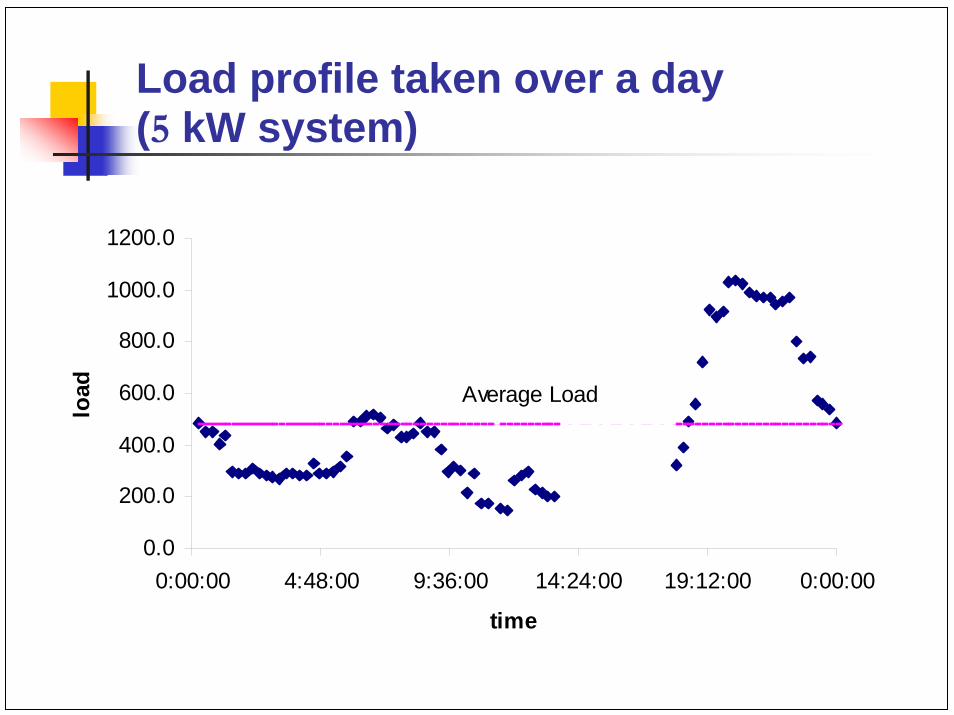
Load profile taken over a day(5 kW system)
0.0
200.0
400.0
600.0
800.0
1000.0
1200.0
0:00:00 4:48:00 9:36:00 14:24:00 19:12:00 0:00:00
time
load Average Load
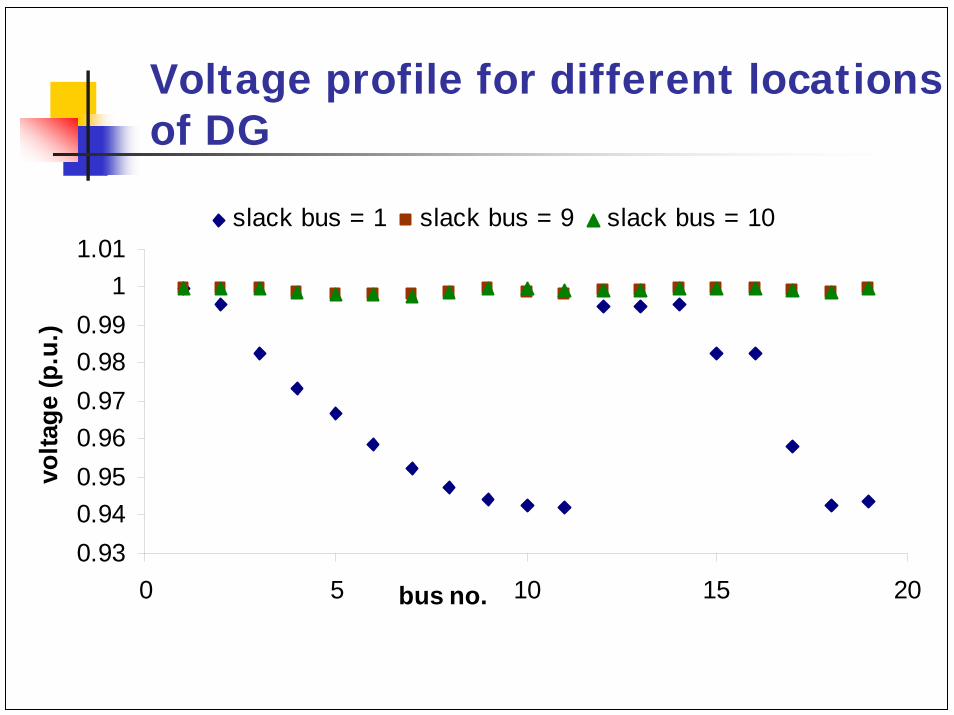
Voltage profile for different locations of DG
0.930.940.950.960.970.980.99
11.01
0 5 10 15 20bus no.
volta
ge (p
.u.)
slack bus = 1 slack bus = 9 slack bus = 10

Bio-diesel based power plant of 10 kW rating (Raipur, Chattisgarh)
Solar Water pumping system for village

ConclusionsNeed for better methods of potential estimationDiffusion models – scope for improved target settingNeed to track actual generationPolicy makers underestimate renewable shareNeed for uncertainty estimationQuantification for distributed generation, DSM options needed10% renewable generation by renewables till 2022 achievable, basedon existing technologyIssues related to mainstreaming of renewables

Acknowledgment
Balkrishna SurveProject Assistant
Indu R. PillaiPh.D - 2008
Mel George A.M.Tech - Ongoing
M.B. SivapriyaM.Tech - 2008
Thank you

ReferencesAKNReddy,R H Williams, T. Johannson,Energy After Rio-Prospects and Challenges-,UNDP, 1997, New York. MNES Annual Reports, 2001-2008Integrated Energy Policy Report, Planning Commission, 200611th Five year plan proposal, MNRE, Govt of Indiawww.mnes.nic.inS.P.Sukhatme, Solar Energy, Tata McGraw Hill, Delhi,1997Banerjee, Comparison of DG options, Energy Policy, 2006Pillai, Banerjee, Solar Energy, 2007Manish, Pillai, Banerjee, ‘Sustainability analysis of renewables’, Energy for Sustainable Development , December 2006


![Feasible Power-Flow Solution Analysis of DC …pe.csu.edu.cn/lunwen/120-Feasible Power-Flow Solution...renewable energy; easy to stabilize [7]-[13]. Therefore, DC microgrids are increasingly](https://img.pdfslide.us/doc/110x75/5fb6f981c58dc21fe96595e6/feasible-power-flow-solution-analysis-of-dc-pecsueducnlunwen120-feasible-power-flow.jpg)