Embed Size (px)
Citation preview
Renewable heat in Scotland, 2015 A report by the Energy Saving Trust for the Scottish Government October 2016 Prepared by Fiona Flynn, Energy Saving Trust

Renewable Heat in Scotland, 2015 Page i
About the Energy Saving Trust
The Energy Saving Trust is Scotland and the UK’s leading impartial organisation helping
people save energy and reduce carbon emissions. We do this by directly supporting
consumers to take action, helping local authorities and communities to save energy, using
our expert insight and knowledge and providing quality assurance for goods and services.
This work was carried out by the Energy Saving Trust on behalf of the Scottish Government.
The report draws on various sources of data from the Energy Saving Trust and other
organisations working in Scotland and was written by Fiona Flynn.
The Energy Saving Trust would like to thank all individuals and organisations who provided
data, with particular thanks to the Department for Business, Energy and Industrial Strategy,
Gemserv, the Forestry Commission Scotland and Rural Development Initiatives.
Please note that the methodology used in this report to calculate renewable heat capacity
and output for Scotland may not necessarily be in line with that required by the EU
Renewable Energy Directive and as such the figures should not be used for any reporting
purposes associated with this Directive.
Renewable Heat in Scotland, 2015 Page ii
Contents
About the Energy Saving Trust .............................................................................................. i
1 Purpose of report ........................................................................................................... 4
2 Summary of key findings ................................................................................................ 5
3 Methodology .................................................................................................................. 8
3.1 Approach taken ....................................................................................................... 8
3.2 Technologies included .......................................................................................... 10
3.3 Data sources used ................................................................................................ 11
3.4 Assumptions used................................................................................................. 12
3.5 Accounting for sites commissioned part-way through 2015 ................................... 15
3.6 Data collection for district heating schemes .......................................................... 16
4 Renewable heat capacity and renewable heat output in 2015 ...................................... 17
4.1 Results for 2015 .................................................................................................... 17
4.2 Results by installation size .................................................................................... 20
4.3 Results by technology ........................................................................................... 22
4.4 Results by size and technology ............................................................................. 25
4.5 Change in output and capacity by technology since 2014 .......................................... 27
4.6 Capacity and output by local authority area ............................................................... 28
5 Further renewable heat capacity in development ......................................................... 35
5.1 Overview of pipeline projects in the renewable heat database .............................. 35
5.2 Trends seen in the RHI monthly statistics ............................................................. 38
5.3 Emerging technologies and innovative projects in the pipeline .............................. 39
5.4 Other developments from 2015 onwards .............................................................. 41
6 Uncertainty levels associated with the methodology used, and recommendations for
future updates ..................................................................................................................... 42
6.1 Estimating heat capacity and renewable heat output for non-domestic RHI
accredited installations .................................................................................................... 42
6.2 Estimating micro installations: capacity and output ............................................... 43
6.3 Potential useful heat output that is not currently utilised ........................................ 44
6.4 Recommendations for future updates ................................................................... 44
Appendix 1. Technical terms used ...................................................................................... 46
7.1 References to ‘heat output’ ................................................................................... 46
7.2 Renewable energy technologies ........................................................................... 46
Renewable Heat in Scotland, 2015 Page iii
Appendix 2. Capacities assumed for individual installations where information was not
available.............................................................................................................................. 50
8.1 Capacity assumptions ........................................................................................... 50
Appendix 3. Merging the renewable heat database with the non-domestic RHI database ... 53
9.1 Background ........................................................................................................... 53
9.2 Methodology ......................................................................................................... 53
9.3 Uncertainties and duplication ................................................................................ 54
Appendix 4. Measurement of heat demand in Scotland ...................................................... 56
10.1 Background ........................................................................................................ 56
10.2 Derivation of the 11% heat target ........................................................................ 56
10.3 Improving data on heat demand in Scotland ....................................................... 57
10.4 Summary of the changes as a result of the new methodology ............................ 59
Renewable Heat in Scotland, 2015 Page 4
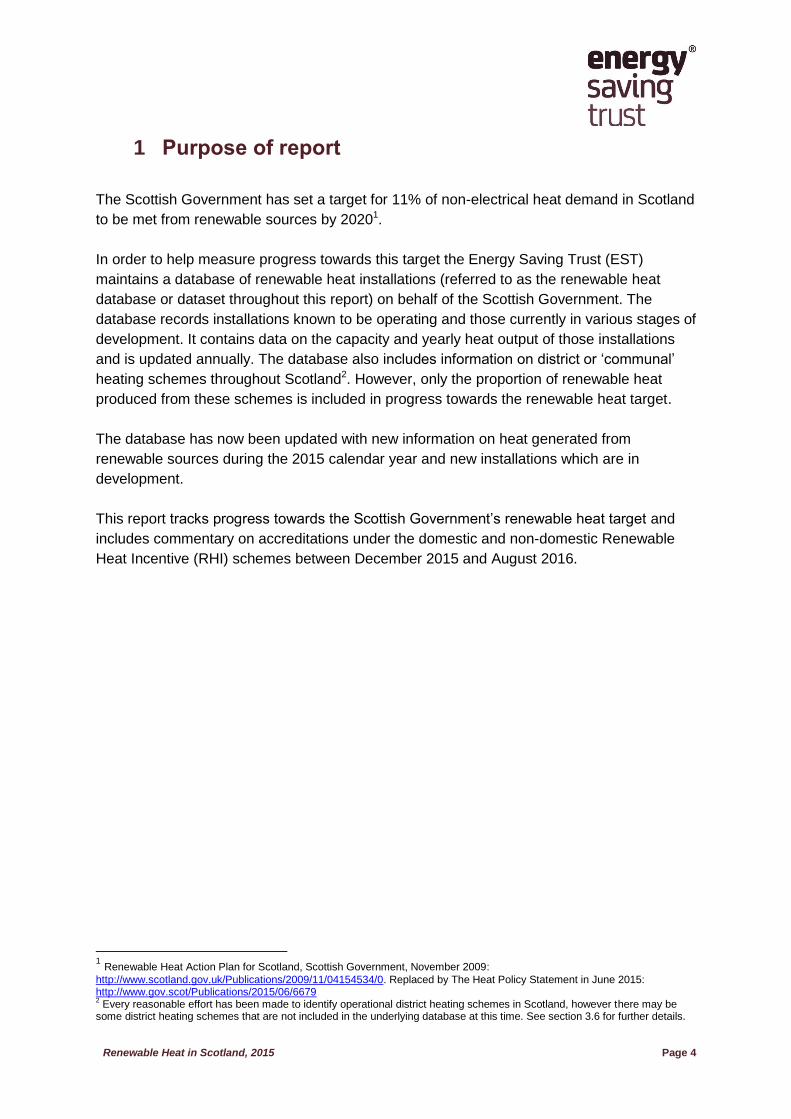
1 Purpose of report
The Scottish Government has set a target for 11% of non-electrical heat demand in Scotland
to be met from renewable sources by 20201.
In order to help measure progress towards this target the Energy Saving Trust (EST)
maintains a database of renewable heat installations (referred to as the renewable heat
database or dataset throughout this report) on behalf of the Scottish Government. The
database records installations known to be operating and those currently in various stages of
development. It contains data on the capacity and yearly heat output of those installations
and is updated annually. The database also includes information on district or ‘communal’
heating schemes throughout Scotland2. However, only the proportion of renewable heat
produced from these schemes is included in progress towards the renewable heat target.
The database has now been updated with new information on heat generated from
renewable sources during the 2015 calendar year and new installations which are in
development.
This report tracks progress towards the Scottish Government’s renewable heat target and
includes commentary on accreditations under the domestic and non-domestic Renewable
Heat Incentive (RHI) schemes between December 2015 and August 2016.
1 Renewable Heat Action Plan for Scotland, Scottish Government, November 2009:
http://www.scotland.gov.uk/Publications/2009/11/04154534/0. Replaced by The Heat Policy Statement in June 2015: http://www.gov.scot/Publications/2015/06/6679 2 Every reasonable effort has been made to identify operational district heating schemes in Scotland, however there may be
some district heating schemes that are not included in the underlying database at this time. See section 3.6 for further details.
Renewable Heat in Scotland, 2015 Page 5
2 Summary of key findings
We estimate that:
In 2015 Scotland generated an estimated 5.3 - 5.6% of its non-electrical heat
demand from renewable sources, up from 3.8% in 2014, continuing the year on
year increases seen since 2008/09.
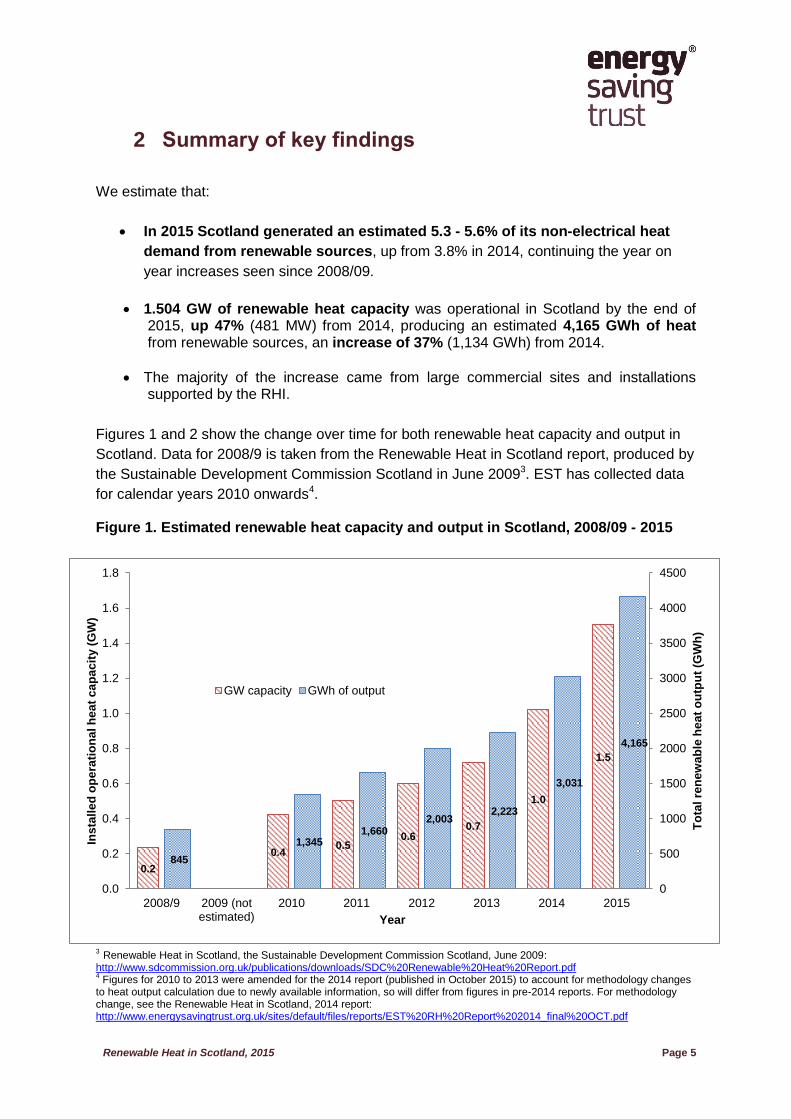
1.504 GW of renewable heat capacity was operational in Scotland by the end of 2015, up 47% (481 MW) from 2014, producing an estimated 4,165 GWh of heat from renewable sources, an increase of 37% (1,134 GWh) from 2014.
The majority of the increase came from large commercial sites and installations supported by the RHI.
Figures 1 and 2 show the change over time for both renewable heat capacity and output in
Scotland. Data for 2008/9 is taken from the Renewable Heat in Scotland report, produced by
the Sustainable Development Commission Scotland in June 20093. EST has collected data
for calendar years 2010 onwards4. Figure 1. Estimated renewable heat capacity and output in Scotland, 2008/09 - 2015
3 Renewable Heat in Scotland, the Sustainable Development Commission Scotland, June 2009: http://www.sdcommission.org.uk/publications/downloads/SDC%20Renewable%20Heat%20Report.pdf 4 Figures for 2010 to 2013 were amended for the 2014 report (published in October 2015) to account for methodology changes
to heat output calculation due to newly available information, so will differ from figures in pre-2014 reports. For methodology change, see the Renewable Heat in Scotland, 2014 report: http://www.energysavingtrust.org.uk/sites/default/files/reports/EST%20RH%20Report%202014_final%20OCT.pdf
0.2
0.4 0.5
0.6 0.7
1.0
1.5
845
1,345 1,660
2,003 2,223
3,031
4,165
0
500
1000
1500
2000
2500
3000
3500
4000
4500
0.0
0.2
0.4
0.6
0.8
1.0
1.2
1.4
1.6
1.8
2008/9 2009 (notestimated)
2010 2011 2012 2013 2014 2015
To
tal re
ne
wa
ble
he
at
ou
tpu
t (G
Wh
)
Ins
tall
ed
op
era
tio
na
l h
ea
t c
ap
ac
ity (
GW
)
Year
GW capacity GWh of output
Renewable Heat in Scotland, 2015 Page 6
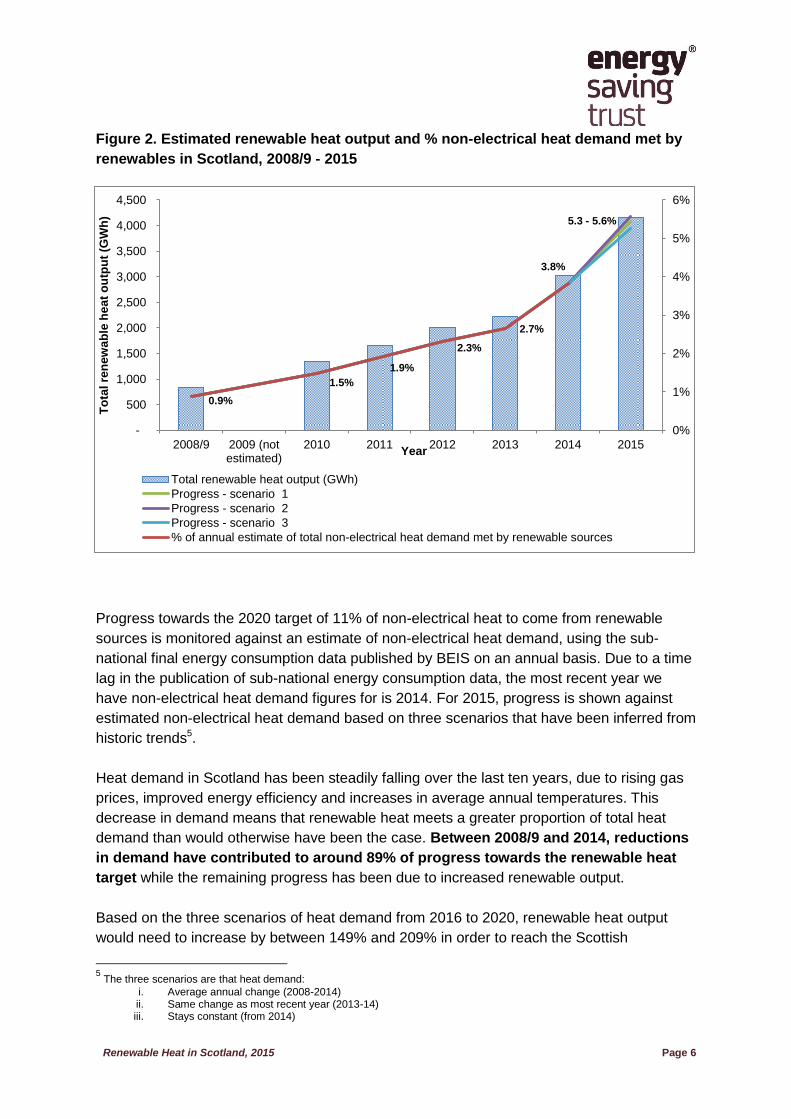
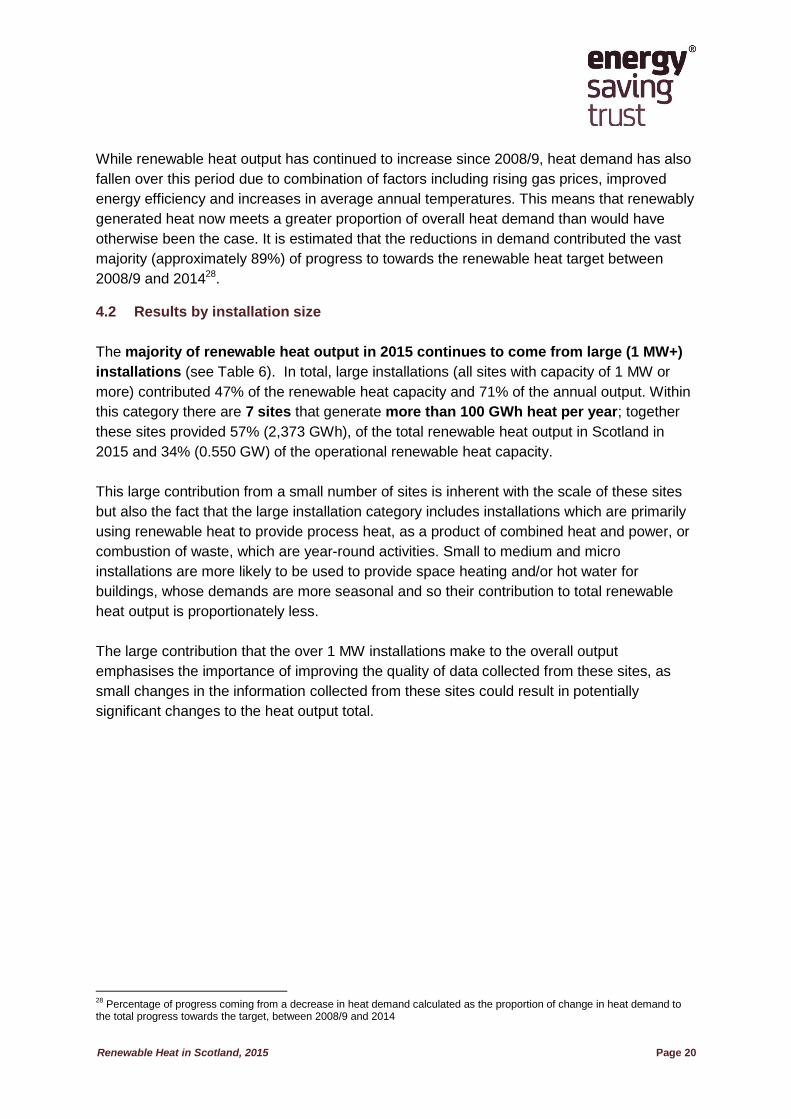
Figure 2. Estimated renewable heat output and % non-electrical heat demand met by
renewables in Scotland, 2008/9 - 2015
Progress towards the 2020 target of 11% of non-electrical heat to come from renewable
sources is monitored against an estimate of non-electrical heat demand, using the sub-
national final energy consumption data published by BEIS on an annual basis. Due to a time
lag in the publication of sub-national energy consumption data, the most recent year we
have non-electrical heat demand figures for is 2014. For 2015, progress is shown against
estimated non-electrical heat demand based on three scenarios that have been inferred from
historic trends5.
Heat demand in Scotland has been steadily falling over the last ten years, due to rising gas
prices, improved energy efficiency and increases in average annual temperatures. This
decrease in demand means that renewable heat meets a greater proportion of total heat
demand than would otherwise have been the case. Between 2008/9 and 2014, reductions
in demand have contributed to around 89% of progress towards the renewable heat
target while the remaining progress has been due to increased renewable output.
Based on the three scenarios of heat demand from 2016 to 2020, renewable heat output
would need to increase by between 149% and 209% in order to reach the Scottish
5 The three scenarios are that heat demand:
i. Average annual change (2008-2014) ii. Same change as most recent year (2013-14) iii. Stays constant (from 2014)
0.9%
1.5%
1.9%
2.3%
2.7%
3.8%
0%
1%
2%
3%
4%
5%
6%
-
500
1,000
1,500
2,000
2,500
3,000
3,500
4,000
4,500
2008/9 2009 (notestimated)
2010 2011 2012 2013 2014 2015
To
tal re
ne
wa
ble
he
at
ou
tpu
t (G
Wh
)
Year
Total renewable heat output (GWh)
Progress - scenario 1
Progress - scenario 2
Progress - scenario 3
% of annual estimate of total non-electrical heat demand met by renewable sources
5.3 - 5.6%
Renewable Heat in Scotland, 2015 Page 7
Government’s target. As large scale schemes can result in significant step changes in
capacity and output any such increase is unlikely to be a smooth curve year on year.
However, if this increase were spread evenly across the remaining 5 years this would be
equivalent to an annual increase in output of between 8% and 16%. This is less than the
average annual increase in output of 26% seen since 2010.
Breakdown of 2015 data
The majority of renewable heat output in Scotland continues to come from large (1 MW+)
installations. In 2015 over two thirds of renewable heat came from large installations,
despite contributing less than half of the total renewable capacity. This is because large
installations often provide process heat year round, compared to the smaller installations
which generally have more seasonal demands such as providing space and water heating.
The capacity from large installations increased by 45% over 2015, while the total capacities
of small to medium (>45 kW and <1 MW) and micro (<45 kW) installations also increased,
by 51% and 44% respectively.
Most of Scotland’s renewable heat output comes from biomass combustion (including
biomass combined heat and power). In 2015 biomass combustion supplied almost 90%
of renewable heat in Scotland. Heat pump and solar thermal installations, which are
mostly used to provide water and space heating on small scales accounted for around 6%,
with the remainder generated from waste sources.
By the end of December 2015 9,030 domestic RHI installations were accredited in
Scotland, with 87% of these installed in off grid areas. Systems in Scotland accounted
for approximately 20% of the total number of accredited systems under both the domestic
and non-domestic RHI schemes as of December 20156. This is significantly above the
proportion of installations to be expected on a pro rata basis when compared to the size of
the population in Scotland as a portion of Great Britain as a whole.
6 More up to date RHI data is published regularly by the department of Business, Energy and Industrial Strategy. A summary of
the latest RHI data is included in this report (Section 5.2) as an indication of further capacity in development which has come on line in 2016. This data shows that as of the end of August 2016, 10,510 installations had been accredited under the domestic RHI and 3,120 full applications had been made under the non-domestic RHI.
Renewable Heat in Scotland, 2015 Page 8
3 Methodology
3.1 Approach taken
Two main outputs are required from the renewable heat database:
The first is an estimate of operational renewable heat capacity. Capacity refers to the
maximum instantaneous power output of a renewable heating system such as a biomass
boiler and is usually measured in kilowatt therms (kWth) or megawatt therms (MWth),
depending on the size of the installation. Total heat capacity is presented in this report as
gigawatts (GW)7 or megawatts (MW), rather than as GWth or MWth, to avoid confusion with
the units of heat output (GWh or MWh). Individual installations are classified in three
capacity categories:
Large (1 MW+)
Small to Medium (45 kW – 1 MW)
Micro (≤ 45 kW)
The second output required from the database is an estimate of useful renewable heat
energy produced over the reported year (1 January 2015 to 31 December 2015). Useful
heat is the heat delivered to the end user or process taking into account the technology
efficiency and losses. This is referred to throughout the report as useful heat output and is
recorded in megawatt hours (MWh) for each installation in the database, with the totals in
this report given in gigawatt hours (GWh).8
Please note, as the terms above are used repeatedly within the main body of the report, a brief
summary has been included. For a fuller explanation of terminology used please refer to Appendix 1.
Technical terms used.
Useful heat output is hard to measure without access to site-level metered data (provided
metering is in place). Sites accredited under either the non-domestic Renewable Heat
7 1 GW = 1,000 MW = 1,000,000 kW.
8 1 GWh = 1,000 MWh = 1,000,000 kWh.
Useful heat output - Heat delivered to an end user or process, taking into account losses
and system efficiency.
Actual heat output - The total amount of heat produced by a site, accounting for losses
and system efficiency. Actual heat output includes heat that is not delivered to an end user
or process.
Potential heat output - The total amount of heat that could potentially be generated by the
site if it operated at peak capacity for the total number of ‘peak running hours’ or at the
installation’s assumed capacity.
Renewable Heat in Scotland, 2015 Page 9
Incentive (RHI) or Combined Heat and Power Quality Assurance (CHPQA) will monitor the
amount of heat they generate and the amount of heat consumed by an end user, either on
site or connected via a heat network, as part of their obligations under these schemes. The
data held by the CHPQA is confidential and is therefore not available at site level unless
provided by the sites themselves. As has also been the case in previous years, due to
current RHI legislation, full access to the non-domestic RHI data was not available for the
database update.
As site level data for systems accredited under the non-domestic RHI scheme was not
available for the 2015 database update, the Department for Business, Energy and Industrial
Strategy (BEIS)9 provided aggregated data for the scheme to the EST for inclusion in this
report. Analysis was carried out by BEIS on the RHI dataset and the EST dataset in order to
provide a summary of the renewable heat capacity and useful heat output not already
captured by the EST dataset. Together the capacity and ‘heat paid for’10 summaries
provided by BEIS and those calculated from the EST dataset provide the most accurate
measure of renewable heat capacity and useful heat output in Scotland available to date.
Further details of the process undertaken to carry out this analysis are available in section
6.1 and in Appendix 3. Aggregated data for the domestic RHI scheme was not provided, as
the majority of these installations should have been captured within the MCS Installation
Database (MID) extract provided by Gemserv.
In previous years the Forestry Commission Scotland (FCS) has conducted a woodfuel usage
survey to determine the amount of woodfuel being used for heat generation purposes in
Scotland. As with the 2014 database update, we asked the FCS to share updated capacity
and heat output data for large biomass sites (both combined heat and power and heat only)
with a capacity greater than or equal to 1 MW. Metered data was provided by most of the
largest sites. For the sites that could not provide metered heat data, the amount of woodfuel
consumed for heat generation purposes has been used to derive an estimate of actual (or
‘total’) heat output, based on the assumed energy content of the woodfuel and site
efficiencies.
With some exceptions11, the remaining data has been collated from sources where heat
output (either ‘actual’ or ‘useful’) for the site is not necessarily known. In these situations
heat output needs to be estimated. Where possible, heat output estimates are based on the
quantity, type and energy content of fuels used in the relevant year at the site along with
assumed (or known) operating efficiencies. This information is used to estimate actual heat
output during 2015 but will be greater than the useful heat output. This figure may also be
different to estimates of potential heat output, which are usually based on the heat capacity
of an installation and an assumed number of peak operating hours. Potential heat output
may therefore be higher than useful or actual heat output.
9 As of July 2016, the Department for Business, Energy and Industrial Strategy (BEIS) has taken over responsibility of
legislation previously overseen by the Department of Energy and Climate Change (DECC). 10
The RHI data does not allow for annual heat output figures to be reported, but can show the amount of heat paid for per site under the scheme. This has been used as a proxy for ‘useful heat output’ as defined above as the RHI can only support heat that is used for an ‘eligible purpose’. 11
For example, where we have a known contact at the site who can provide the correct information.

Renewable Heat in Scotland, 2015 Page 10
The information available on each installation varies, depending upon the data sources
used. Where they are supplied, ‘useful heat output’ is used for the figures in this report;
alternatively ‘actual heat output’ is used and finally ‘potential heat output’ where neither of
the previous values are available.
Where information on capacity is not available, this is estimated based on known variables
(often reported actual or useful heat output) and assumptions about typical running hours,
based on installation size and the type of application the heat is used for (i.e. space heating
or process heat). Where capacity is known, but not output, annual heat output is estimated
based on assumptions about typical running hours per year. Further information about the
assumptions used is provided in section 3.4. In all cases only the renewable portion of the
heat output has been included in the figures reported.
3.2 Technologies included
The following technologies produce heat from renewable sources and are included in our
estimate of progress towards the target (more detailed descriptions of these technologies
can be found in Appendix 1):
Biomass (wood) primary combustion.
Biomass (wood) combined heat and power (CHP).
Solar thermal panels.
Heat pumps: water source, air source and ground source.
Energy from waste (EfW), including
- Anaerobic digestion (AD)12.
- Landfill gas capture.
- Biomass primary combustion of biodegradable material (other than wood).
- Advanced thermal treatment (ATT), using pyrolysis and/or gasification.
- Biomethane gas to grid injection after anaerobic digestion and processing.
Deep geothermal13.
Had examples been found, fuel cell biomass could also have been included.
Technologies which are not included in our estimate of progress towards the target, as they
produce heat which is not renewable, are:
Non-biomass combined heat and power (CHP) running on mains gas or other fossil
fuel.
Exhaust air heat recovery (EAHR) where the initial heat is not provided from a
renewable source.
Energy from waste: installations where the only fuel is clinical (hospital) waste14.
12
Excluding the parasitic heat used to maintain the anaerobic digestion process. 13
There are currently no known deep geothermal technologies in operation; however feasibility studies for 4 projects have been submitted to the Geothermal Energy Challenge Fund. These have been recorded as ‘in scoping’ in the database.
Renewable Heat in Scotland, 2015 Page 11
The following technologies can be considered sources of renewable heat, but are not
currently captured in the renewable heat database:
Passive renewable heating, for example solar gain. This is excluded due to the
difficulty of assessing its contribution to heating demand.
Wind or hydro-produced electricity which is used to provide heat. These technologies
are excluded to avoid double counting of progress towards renewables targets, as
the energy produced counts towards the Scottish Government’s target for renewable
electricity generation.
3.3 Data sources used
EST has maintained and updated the renewable heat database for the Scottish Government
on an annual basis since 2011. The heat output estimate for 2015 contained in this report
has been generated by a further update of the information held in the database. Efforts have
been focused on updating information from the installations with the largest capacities and
including data from the non-domestic RHI database.
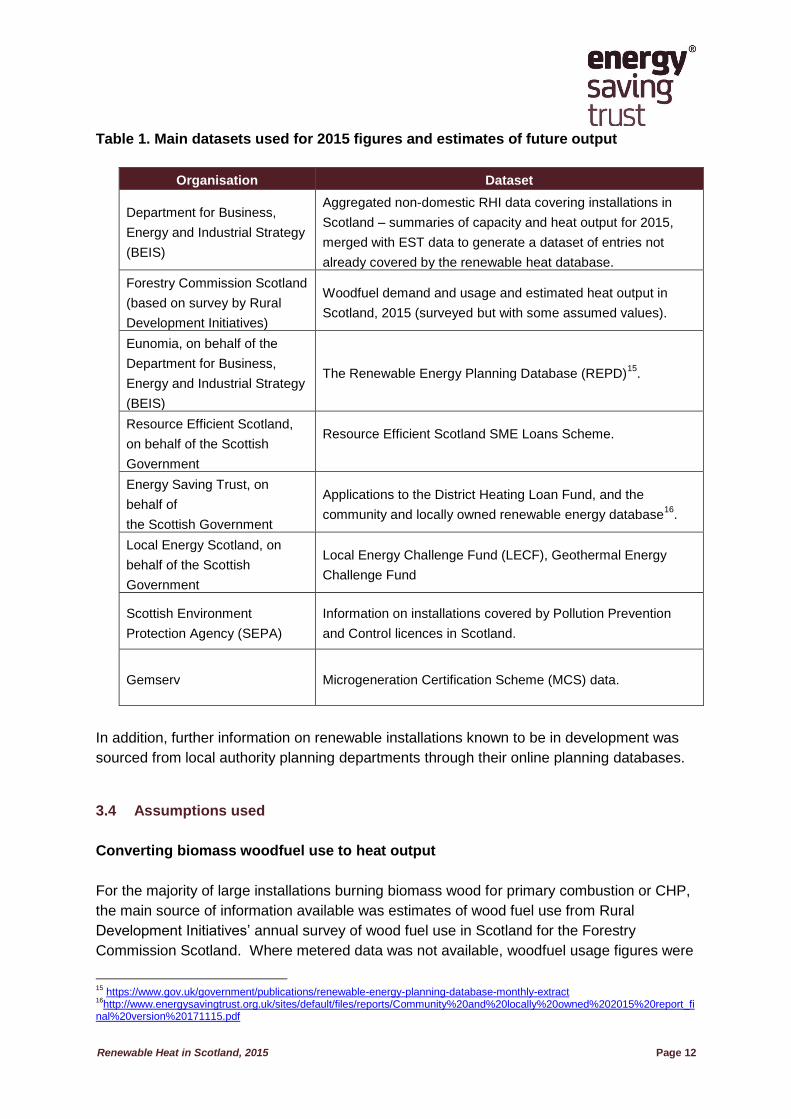
Multiple sources of data have been used to update the renewable heat database for 2015.
The main sources used and the organisations which supplied them, are listed in Table 1. In
addition, other organisations and individuals connected with specific installations were also
contacted and provided useful information.
The data sets from the Forestry Commission Scotland (via Rural Development Initiatives)
contain estimates of all wood fuel usage for the year 2015, for large sites only.
14
In line with assumptions used in the Department for Business, Energy and Industrial Strategy (BEIS) RESTATS methodology, clinical waste is considered non-biodegradable and therefore non-renewable. Renewable Energy Statistics: Data Sources and Methodologies, Department for Business, Energy & Industrial Strategy: https://www.gov.uk/government/collections/renewables-statistics
Renewable Heat in Scotland, 2015 Page 12
Table 1. Main datasets used for 2015 figures and estimates of future output
Organisation Dataset
Department for Business,
Energy and Industrial Strategy
(BEIS)
Aggregated non-domestic RHI data covering installations in
Scotland – summaries of capacity and heat output for 2015,
merged with EST data to generate a dataset of entries not
already covered by the renewable heat database.
Forestry Commission Scotland
(based on survey by Rural
Development Initiatives)
Woodfuel demand and usage and estimated heat output in
Scotland, 2015 (surveyed but with some assumed values).
Eunomia, on behalf of the
Department for Business,
Energy and Industrial Strategy
(BEIS)
The Renewable Energy Planning Database (REPD)15
.
Resource Efficient Scotland,
on behalf of the Scottish
Government
Resource Efficient Scotland SME Loans Scheme.
Energy Saving Trust, on
behalf of
the Scottish Government
Applications to the District Heating Loan Fund, and the
community and locally owned renewable energy database16
.
Local Energy Scotland, on
behalf of the Scottish
Government
Local Energy Challenge Fund (LECF), Geothermal Energy
Challenge Fund
Scottish Environment
Protection Agency (SEPA)
Information on installations covered by Pollution Prevention
and Control licences in Scotland.
Gemserv Microgeneration Certification Scheme (MCS) data.
In addition, further information on renewable installations known to be in development was
sourced from local authority planning departments through their online planning databases.
3.4 Assumptions used
Converting biomass woodfuel use to heat output
For the majority of large installations burning biomass wood for primary combustion or CHP,
the main source of information available was estimates of wood fuel use from Rural
Development Initiatives’ annual survey of wood fuel use in Scotland for the Forestry
Commission Scotland. Where metered data was not available, woodfuel usage figures were
15
https://www.gov.uk/government/publications/renewable-energy-planning-database-monthly-extract 16
http://www.energysavingtrust.org.uk/sites/default/files/reports/Community%20and%20locally%20owned%202015%20report_final%20version%20171115.pdf
Renewable Heat in Scotland, 2015 Page 13
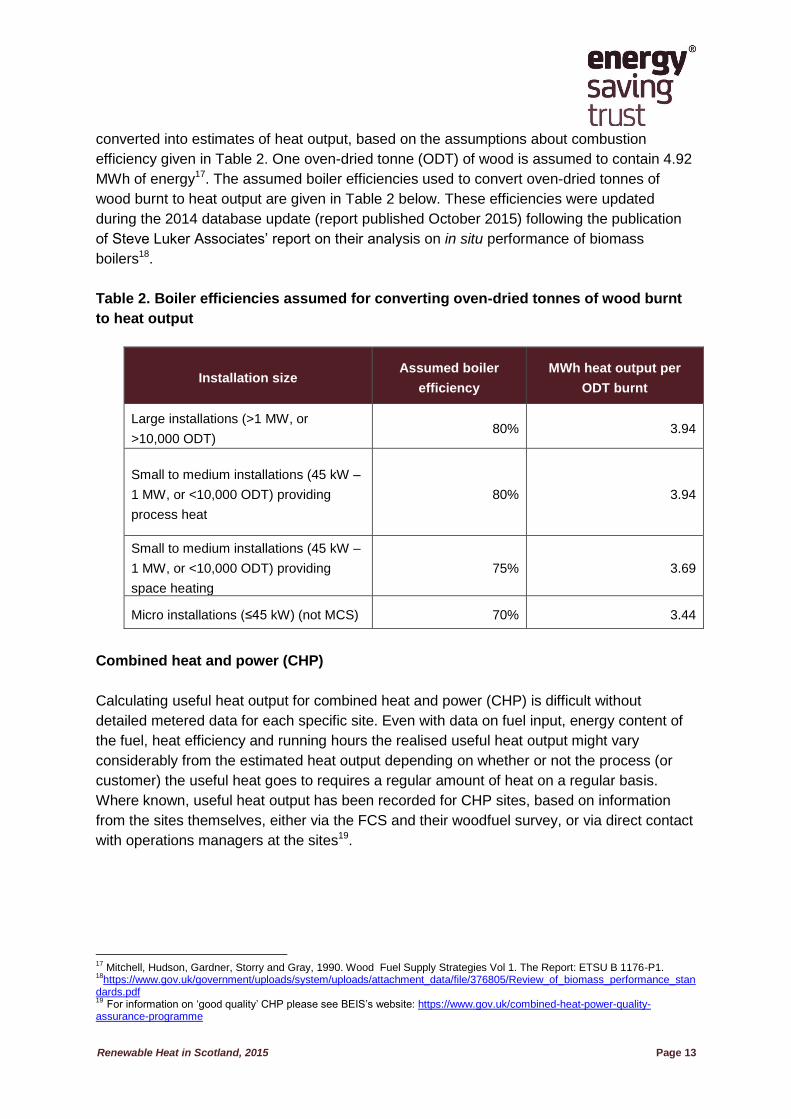
converted into estimates of heat output, based on the assumptions about combustion
efficiency given in Table 2. One oven-dried tonne (ODT) of wood is assumed to contain 4.92
MWh of energy17. The assumed boiler efficiencies used to convert oven-dried tonnes of
wood burnt to heat output are given in Table 2 below. These efficiencies were updated
during the 2014 database update (report published October 2015) following the publication
of Steve Luker Associates’ report on their analysis on in situ performance of biomass
boilers18.
Table 2. Boiler efficiencies assumed for converting oven-dried tonnes of wood burnt
to heat output
Combined heat and power (CHP)
Calculating useful heat output for combined heat and power (CHP) is difficult without
detailed metered data for each specific site. Even with data on fuel input, energy content of
the fuel, heat efficiency and running hours the realised useful heat output might vary
considerably from the estimated heat output depending on whether or not the process (or
customer) the useful heat goes to requires a regular amount of heat on a regular basis.
Where known, useful heat output has been recorded for CHP sites, based on information
from the sites themselves, either via the FCS and their woodfuel survey, or via direct contact
with operations managers at the sites19.
17
Mitchell, Hudson, Gardner, Storry and Gray, 1990. Wood Fuel Supply Strategies Vol 1. The Report: ETSU B 1176-P1. 18
https://www.gov.uk/government/uploads/system/uploads/attachment_data/file/376805/Review_of_biomass_performance_standards.pdf 19 For information on ‘good quality’ CHP please see BEIS’s website: https://www.gov.uk/combined-heat-power-quality-assurance-programme
Installation size Assumed boiler
efficiency
MWh heat output per
ODT burnt
Large installations (>1 MW, or
>10,000 ODT) 80% 3.94
Small to medium installations (45 kW –
1 MW, or <10,000 ODT) providing
process heat
80% 3.94
Small to medium installations (45 kW –
1 MW, or <10,000 ODT) providing
space heating
75% 3.69
Micro installations (≤45 kW) (not MCS)
70% 3.44
Renewable Heat in Scotland, 2015 Page 14
Where the actual useful heat output of the fuel is not known the following formula was used:
Estimated heat output (MWh) = Total fuel input (ODT) x Energy content of fuel (MWh/ODT) x
Thermal efficiency of CHP plant (%)
Where the thermal efficiency of the CHP plant was unknown, a thermal efficiency of 48%
was used. This is the average thermal efficiency in 2015, taken from chapter 7 of the Digest
of UK Energy Statistics (DUKES) 201620.
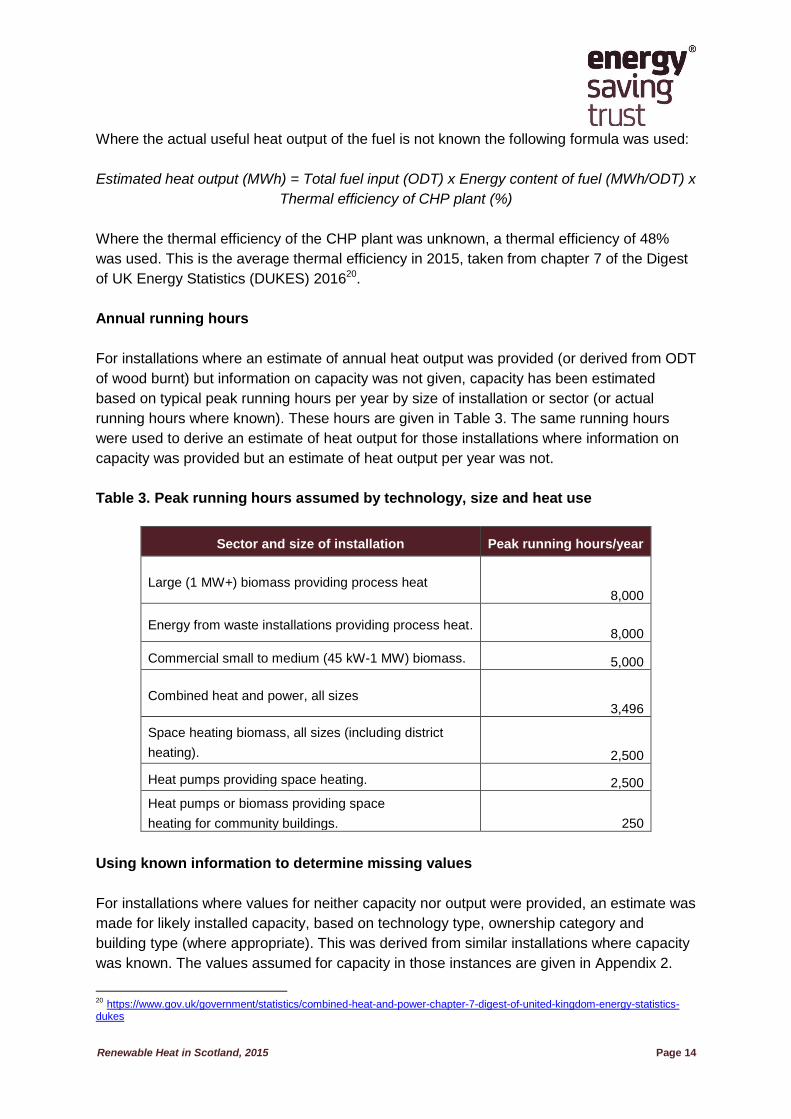
Annual running hours
For installations where an estimate of annual heat output was provided (or derived from ODT
of wood burnt) but information on capacity was not given, capacity has been estimated
based on typical peak running hours per year by size of installation or sector (or actual
running hours where known). These hours are given in Table 3. The same running hours
were used to derive an estimate of heat output for those installations where information on
capacity was provided but an estimate of heat output per year was not.
Table 3. Peak running hours assumed by technology, size and heat use
Sector and size of installation Peak running hours/year
Large (1 MW+) biomass providing process heat
8,000
Energy from waste installations providing process heat. 8,000
Commercial small to medium (45 kW-1 MW) biomass. 5,000
Combined heat and power, all sizes 3,496
Space heating biomass, all sizes (including district
heating). 2,500
Heat pumps providing space heating. 2,500
Heat pumps or biomass providing space
heating for community buildings. 250
Using known information to determine missing values
For installations where values for neither capacity nor output were provided, an estimate was
made for likely installed capacity, based on technology type, ownership category and
building type (where appropriate). This was derived from similar installations where capacity
was known. The values assumed for capacity in those instances are given in Appendix 2.
20 https://www.gov.uk/government/statistics/combined-heat-and-power-chapter-7-digest-of-united-kingdom-energy-statistics-dukes
Renewable Heat in Scotland, 2015 Page 15
For solar thermal panels, information was sometimes only provided in m2 of panel area. The
following assumptions were used to derive capacity and/or output, where this was not
provided:
Capacity per m2: 0.7 kW, from the Solar Trade Association.
Useful heat output per m2: 0.441 MWh, derived from SAP 2012 calculations for all
regions in Scotland21.
Energy from waste
For the 2015 update of the database, the biodegradable content of municipal solid waste
(MSW) was revised down from 63.5% to 50% to account for increased recycling rates. This
is in line with changes to the assumptions used in BEIS’s RESTATS methodology22.
Therefore an installation producing heat from burning MSW will have 50% of its heat
capacity and output recorded as renewable in the database.
For anaerobic digestion (AD) facilities, 30% of the heat output has been removed from the
total figure for useful renewable heat production, as this is estimated to be the parasitic heat
requirement of the AD process.
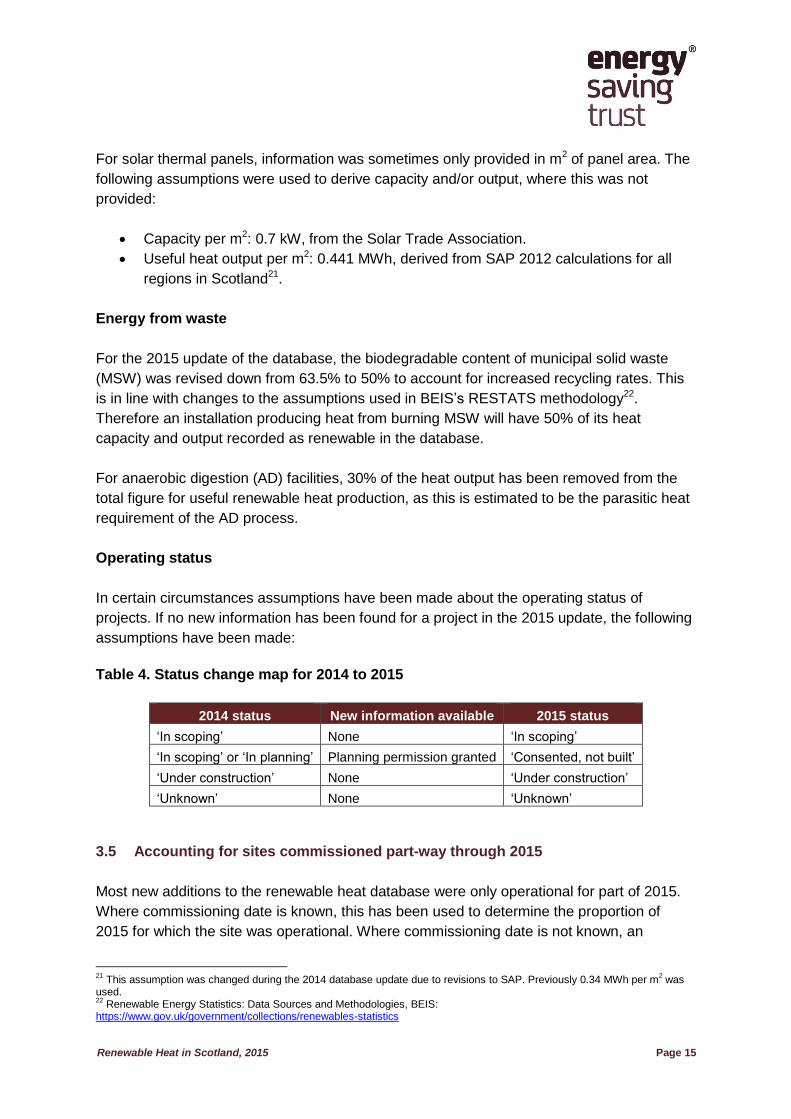
Operating status
In certain circumstances assumptions have been made about the operating status of
projects. If no new information has been found for a project in the 2015 update, the following
assumptions have been made:
Table 4. Status change map for 2014 to 2015
2014 status New information available 2015 status
‘In scoping’ None ‘In scoping’
‘In scoping’ or ‘In planning’ Planning permission granted ‘Consented, not built’
‘Under construction’ None ‘Under construction’
‘Unknown’ None ‘Unknown’
3.5 Accounting for sites commissioned part-way through 2015
Most new additions to the renewable heat database were only operational for part of 2015.
Where commissioning date is known, this has been used to determine the proportion of
2015 for which the site was operational. Where commissioning date is not known, an
21
This assumption was changed during the 2014 database update due to revisions to SAP. Previously 0.34 MWh per m2 was
used. 22
Renewable Energy Statistics: Data Sources and Methodologies, BEIS: https://www.gov.uk/government/collections/renewables-statistics

Renewable Heat in Scotland, 2015 Page 16
estimate has been used, based on when the data was collated and what information was
given at the time. The estimated annual heat output for each site has been multiplied by the
portion of 2015 for which it was operational.
3.6 Data collection for district heating schemes
For district or ‘communal’ heating schemes, the number of non-domestic buildings or
domestic dwellings connected to each scheme is recorded. Information on any extensions
which are planned are also included in the database, where these are known. Information on
whether or not an installation is providing district heating was not available from all sources
used to update the database (e.g. from the RHI and REPD datasets). For this reason it is not
currently possible to use the dataset to estimate the extent of district heating in Scotland.
Data is collected on both renewable and non-renewable district heating schemes23; however
only the proportion of renewable heat produced from these schemes is included in progress
towards the renewable heat target.
23
Every reasonable effort has been made to identify operational district heating schemes in Scotland, however there may be some district heating schemes that are not included in the underlying database at this time.
Renewable Heat in Scotland, 2015 Page 17
4 Renewable heat capacity and renewable heat output in 2015
4.1 Results for 2015
In 2015, 4,165 GWh of heat was produced from renewable sources, from an installed
capacity of 1.504 GW.
In 2015 Scotland produced enough heat from renewable sources to meet between an
estimated 5.3% and 5.6% of non-electrical heat demand. The final estimate will be
reported in October 2017 when the 2015 heat demand data is available.
Progress towards the 2020 target of 11% of non-electrical heat to come from renewable
sources is monitored against the non-electrical heat component of the final energy
consumption data published by BEIS on an annual basis. This monitoring methodology was
first used in the 2012 report (published June 2013). See Appendix 4 for more information on
the difference between the current and previous methodologies and how non-electrical heat
demand in Scotland is calculated.
In order to show progress towards the renewable heat target in this report, three non-
electrical heat demand scenarios have been estimated for 2015. These scenarios are based
on published final sub-national energy consumption figures from BEIS24 and have allowed us
to present the progress towards the renewable heat target shown in Table 5. The three
scenarios calculated were:
Scenario 1: Assuming heat demand between 2014 and 2015 reduces by the average
annual reduction seen between 2008 and 2014.
Scenario 2: Applying the 2013-14 percentage heat demand reduction for 2014-15
Scenario 3: Assuming heat demand does not change from 2014.
Table 5 also shows progress against the previous measure for reference.
24
See 2005-2014 figures here: https://www.gov.uk/government/statistical-data-sets/total-final-energy-consumption-at-regional-and-local-authority-level-2005-to-2010
Renewable Heat in Scotland, 2015 Page 18
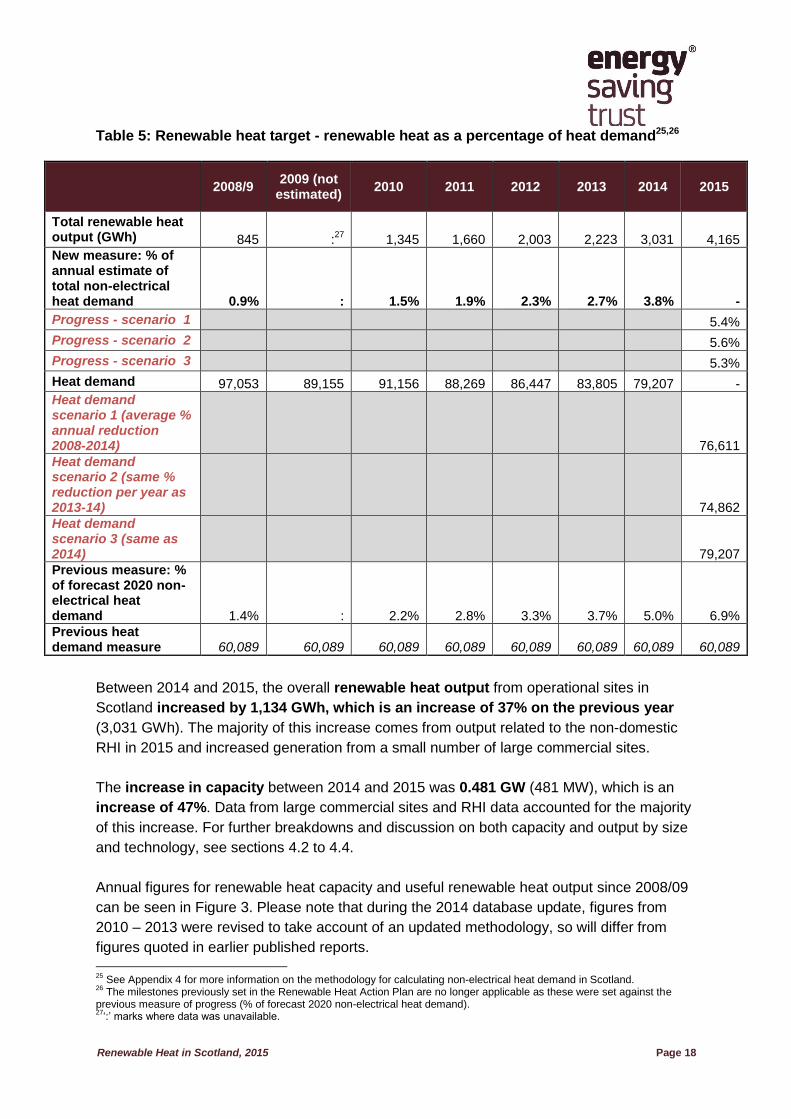
Table 5: Renewable heat target - renewable heat as a percentage of heat demand25,26
2008/9
2009 (not estimated)
2010 2011 2012 2013 2014 2015
Total renewable heat output (GWh) 845 :
27 1,345 1,660 2,003 2,223 3,031
4,165
New measure: % of annual estimate of total non-electrical heat demand 0.9% : 1.5% 1.9% 2.3% 2.7% 3.8% -
Progress - scenario 1 5.4%
Progress - scenario 2 5.6%
Progress - scenario 3 5.3%
Heat demand 97,053 89,155 91,156 88,269 86,447 83,805 79,207 -
Heat demand scenario 1 (average % annual reduction 2008-2014)
76,611
Heat demand scenario 2 (same % reduction per year as 2013-14)
74,862
Heat demand scenario 3 (same as 2014)
79,207
Previous measure: % of forecast 2020 non-electrical heat demand 1.4% : 2.2% 2.8% 3.3% 3.7% 5.0% 6.9%
Previous heat demand measure 60,089 60,089 60,089 60,089 60,089 60,089 60,089 60,089
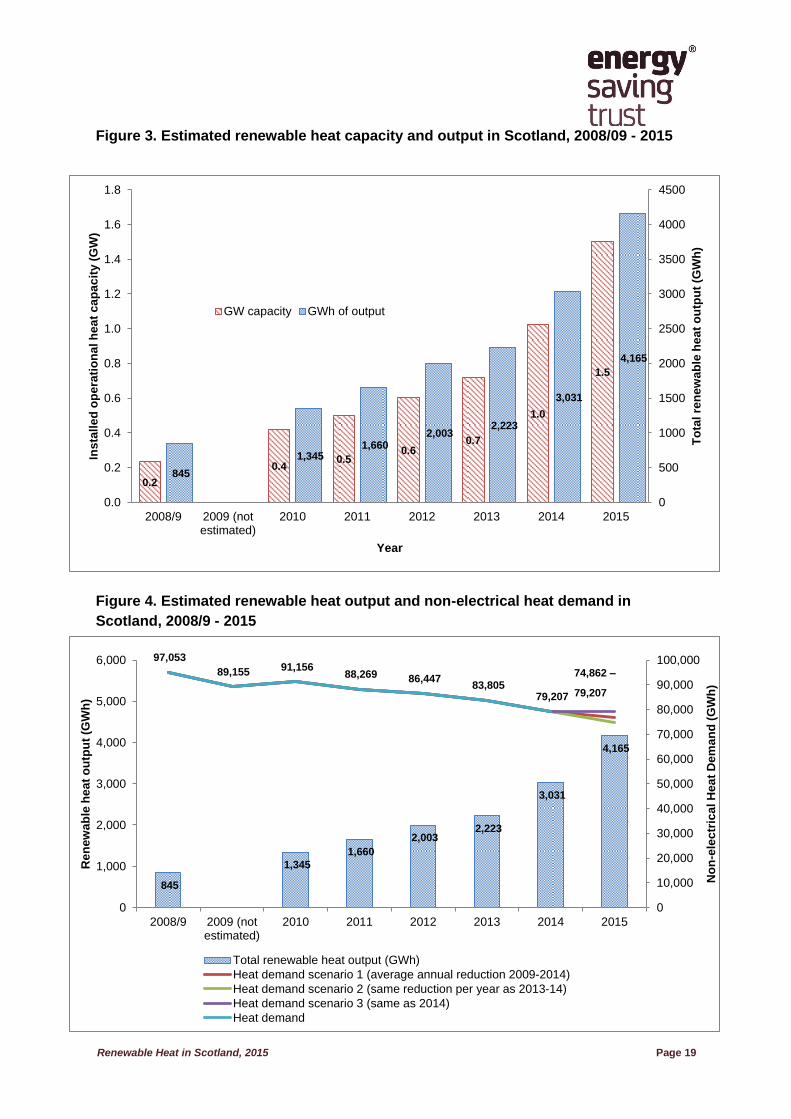
Between 2014 and 2015, the overall renewable heat output from operational sites in
Scotland increased by 1,134 GWh, which is an increase of 37% on the previous year
(3,031 GWh). The majority of this increase comes from output related to the non-domestic
RHI in 2015 and increased generation from a small number of large commercial sites.
The increase in capacity between 2014 and 2015 was 0.481 GW (481 MW), which is an
increase of 47%. Data from large commercial sites and RHI data accounted for the majority
of this increase. For further breakdowns and discussion on both capacity and output by size
and technology, see sections 4.2 to 4.4.
Annual figures for renewable heat capacity and useful renewable heat output since 2008/09
can be seen in Figure 3. Please note that during the 2014 database update, figures from
2010 – 2013 were revised to take account of an updated methodology, so will differ from
figures quoted in earlier published reports.
25
See Appendix 4 for more information on the methodology for calculating non-electrical heat demand in Scotland. 26
The milestones previously set in the Renewable Heat Action Plan are no longer applicable as these were set against the previous measure of progress (% of forecast 2020 non-electrical heat demand). 27
‘:’ marks where data was unavailable.
Renewable Heat in Scotland, 2015 Page 19
Figure 3. Estimated renewable heat capacity and output in Scotland, 2008/09 - 2015
Figure 4. Estimated renewable heat output and non-electrical heat demand in
Scotland, 2008/9 - 2015
0.2
0.4 0.5
0.6 0.7
1.0
1.5
845
1,345 1,660
2,003 2,223
3,031
4,165
0
500
1000
1500
2000
2500
3000
3500
4000
4500
0.0
0.2
0.4
0.6
0.8
1.0
1.2
1.4
1.6
1.8
2008/9 2009 (notestimated)
2010 2011 2012 2013 2014 2015
To
tal re
ne
wa
ble
he
at
ou
tpu
t (G
Wh
)
Ins
tall
ed
op
era
tio
na
l h
ea
t c
ap
ac
ity (
GW
)
Year
GW capacity GWh of output
845
1,345
1,660
2,003 2,223
3,031
4,165
97,053
89,155 91,156 88,269 86,447
83,805 79,207
0
10,000
20,000
30,000
40,000
50,000
60,000
70,000
80,000
90,000
100,000
0
1,000
2,000
3,000
4,000
5,000
6,000
2008/9 2009 (notestimated)
2010 2011 2012 2013 2014 2015
No
n-e
lec
tric
al H
ea
t D
em
an
d (
GW
h)
Ren
ew
ab
le h
ea
t o
utp
ut
(GW
h)
Total renewable heat output (GWh)
Heat demand scenario 1 (average annual reduction 2009-2014)
Heat demand scenario 2 (same reduction per year as 2013-14)
Heat demand scenario 3 (same as 2014)
Heat demand
74,862 –
79,207
Renewable Heat in Scotland, 2015 Page 20
While renewable heat output has continued to increase since 2008/9, heat demand has also
fallen over this period due to combination of factors including rising gas prices, improved
energy efficiency and increases in average annual temperatures. This means that renewably
generated heat now meets a greater proportion of overall heat demand than would have
otherwise been the case. It is estimated that the reductions in demand contributed the vast
majority (approximately 89%) of progress to towards the renewable heat target between
2008/9 and 201428.
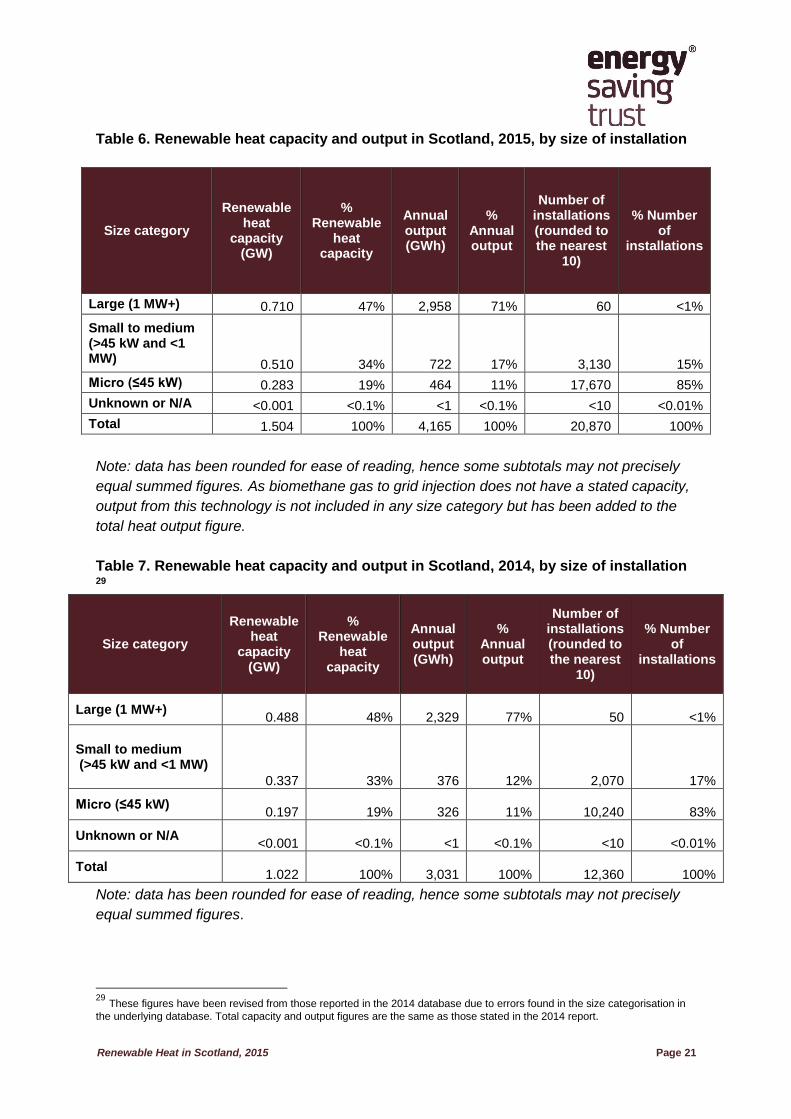
4.2 Results by installation size
The majority of renewable heat output in 2015 continues to come from large (1 MW+)
installations (see Table 6). In total, large installations (all sites with capacity of 1 MW or
more) contributed 47% of the renewable heat capacity and 71% of the annual output. Within
this category there are 7 sites that generate more than 100 GWh heat per year; together
these sites provided 57% (2,373 GWh), of the total renewable heat output in Scotland in
2015 and 34% (0.550 GW) of the operational renewable heat capacity.
This large contribution from a small number of sites is inherent with the scale of these sites
but also the fact that the large installation category includes installations which are primarily
using renewable heat to provide process heat, as a product of combined heat and power, or
combustion of waste, which are year-round activities. Small to medium and micro
installations are more likely to be used to provide space heating and/or hot water for
buildings, whose demands are more seasonal and so their contribution to total renewable
heat output is proportionately less.
The large contribution that the over 1 MW installations make to the overall output
emphasises the importance of improving the quality of data collected from these sites, as
small changes in the information collected from these sites could result in potentially
significant changes to the heat output total.
28
Percentage of progress coming from a decrease in heat demand calculated as the proportion of change in heat demand to the total progress towards the target, between 2008/9 and 2014
Renewable Heat in Scotland, 2015 Page 21
Table 6. Renewable heat capacity and output in Scotland, 2015, by size of installation
Size category
Renewable heat
capacity (GW)
% Renewable
heat capacity
Annual output (GWh)
% Annual output
Number of installations (rounded to the nearest
10)
% Number of
installations
Large (1 MW+) 0.710 47% 2,958 71% 60 <1%
Small to medium (>45 kW and <1 MW) 0.510 34% 722 17% 3,130 15%
Micro (≤45 kW) 0.283 19% 464 11% 17,670 85%
Unknown or N/A <0.001 <0.1% <1 <0.1% <10 <0.01%
Total 1.504 100% 4,165 100% 20,870 100%
Note: data has been rounded for ease of reading, hence some subtotals may not precisely
equal summed figures. As biomethane gas to grid injection does not have a stated capacity,
output from this technology is not included in any size category but has been added to the
total heat output figure.
Table 7. Renewable heat capacity and output in Scotland, 2014, by size of installation
29
Size category
Renewable heat
capacity (GW)
% Renewable
heat capacity
Annual output (GWh)
% Annual output
Number of installations (rounded to the nearest
10)
% Number of
installations
Large (1 MW+) 0.488 48%
2,329 77% 50 <1%
Small to medium (>45 kW and <1 MW)
0.337 33%
376 12% 2,070 17%
Micro (≤45 kW) 0.197 19%
326 11% 10,240 83%
Unknown or N/A <0.001 <0.1%
<1 <0.1% <10 <0.01%
Total 1.022 100%
3,031 100% 12,360 100%
Note: data has been rounded for ease of reading, hence some subtotals may not precisely
equal summed figures.
29
These figures have been revised from those reported in the 2014 database due to errors found in the size categorisation in
the underlying database. Total capacity and output figures are the same as those stated in the 2014 report.
Renewable Heat in Scotland, 2015 Page 22
Key points from Tables 6 and 7 are:
In 2015, small to medium (>45 kW and <1 MW) systems made up 15% of the
renewable heat installations in Scotland (by number). Capacity from these systems
has increased by 51% between 2014 and 2015 to 0.510 GW, while output has
almost doubled. There is clearly a larger increase in heat output compared to the
increase in generating capacity over the same period; discernible from the RHI data
available to us. However, in the absence of RHI data at the site specific level it is difficult
to provide much analysis or draw conclusions. Possible explanations for the difference
could be the high heat demand of some sites, a delay between the dates when systems
are installed and when systems start being paid for the heat they generate, and the
positive stimulus provided to heat production through the availability of the RHI as an
incentive mechanism.
Micro heat capacity increased by 44% between 2014 and 2015, while output
increased by 42%. Since 2008/9 capacity has increased by more than 500% (from
0.045 GW) and output has more than tripled (from 139 GWh). This shows the impact of
the domestic RHI (and RHPP scheme) on this sector within Scotland. The increase in
output between 2008/9 and 2015 seems small compared to the increase in capacity over
the same time period. This is to be expected for micro heat installations as they have
lower running hours than systems that are used for commercial or industrial purposes. In
addition, it may reflect the fact that that a large number of micro installations have only
been operational for part of 2015.
The total capacity of large installations increased by 45% between 2014 and 2015,
while output increased by 27%. The smaller increase in output compared to capacity is
likely to be partly due to the increased use of back up fossil fuel heating systems driven
by lower fossil fuel prices. Some large installations were also not operational for all of
2015. Since 2008/9, both capacity and output have more than quadrupled (from 0.164
GW capacity and 637 GWh output).
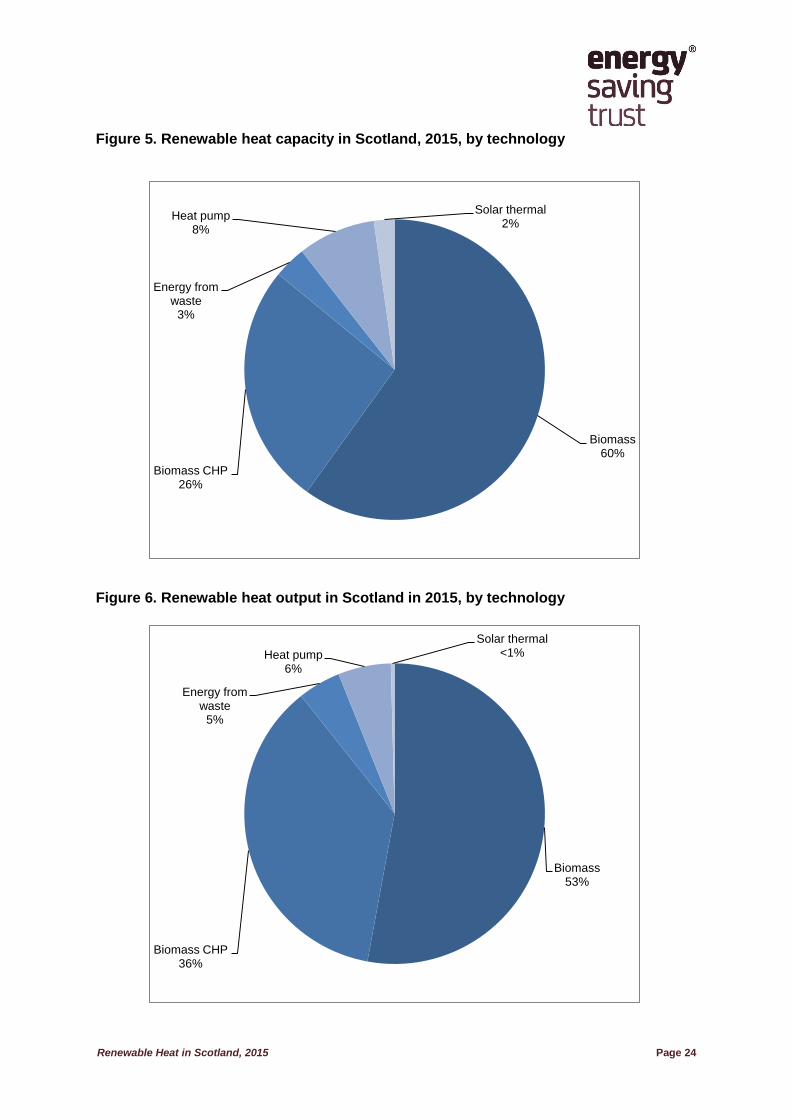
4.3 Results by technology
The majority of both output and capacity in 2015 came from biomass primary
combustion and biomass combined heat and power (see Table 8, and Figures 5 and 6).
86% of renewable heat capacity, and 89% of renewable heat output came from installations
which used biomass primary combustion or biomass combined heat and power. This is a
continuation of the trends seen in both the publically available domestic and non-domestic
RHI reports30, as well as from previous years’ renewable heat in Scotland reports31.
30
See BEIS’s website: https://www.gov.uk/government/collections/renewable-heat-incentive-statistics for monthly updates on both schemes. 31
http://www.energysavingtrust.org.uk/reports
Renewable Heat in Scotland, 2015 Page 23
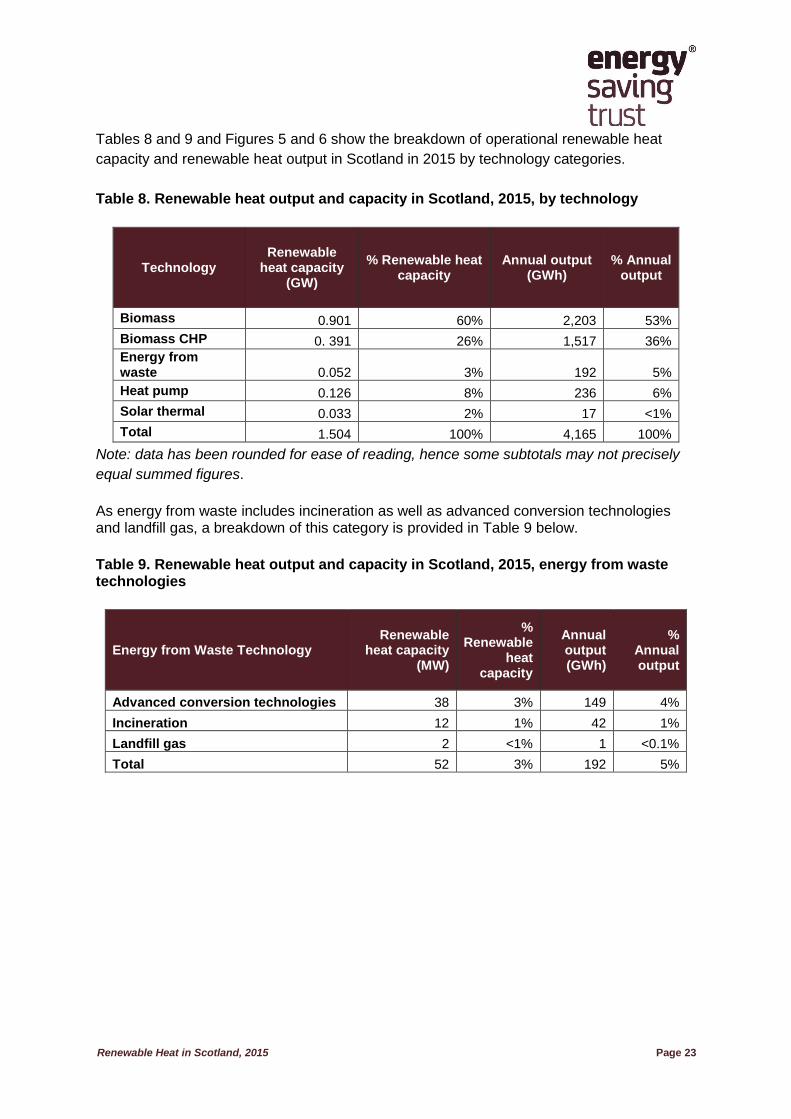
Tables 8 and 9 and Figures 5 and 6 show the breakdown of operational renewable heat
capacity and renewable heat output in Scotland in 2015 by technology categories.
Table 8. Renewable heat output and capacity in Scotland, 2015, by technology
Technology Renewable
heat capacity (GW)
% Renewable heat capacity
Annual output (GWh)
% Annual output
Biomass 0.901 60% 2,203 53%
Biomass CHP 0. 391 26% 1,517 36%
Energy from waste 0.052 3% 192 5%
Heat pump 0.126 8% 236 6%
Solar thermal 0.033 2% 17 <1%
Total 1.504 100% 4,165 100%
Note: data has been rounded for ease of reading, hence some subtotals may not precisely
equal summed figures.
As energy from waste includes incineration as well as advanced conversion technologies and landfill gas, a breakdown of this category is provided in Table 9 below.
Table 9. Renewable heat output and capacity in Scotland, 2015, energy from waste technologies
Energy from Waste Technology Renewable
heat capacity (MW)
% Renewable
heat capacity
Annual output (GWh)
% Annual output
Advanced conversion technologies 38 3% 149 4%
Incineration 12 1% 42 1%
Landfill gas 2 <1% 1 <0.1%
Total 52 3% 192 5%
Renewable Heat in Scotland, 2015 Page 24
Figure 5. Renewable heat capacity in Scotland, 2015, by technology
Figure 6. Renewable heat output in Scotland in 2015, by technology
Biomass 60%
Biomass CHP 26%
Energy from waste
3%
Heat pump 8%
Solar thermal 2%
Biomass 53%
Biomass CHP 36%
Energy from waste
5%
Heat pump 6%
Solar thermal <1%
Renewable Heat in Scotland, 2015 Page 25
While energy from waste has only seen a slight increase in capacity and output between
2014 and 2015 (with capacity increasing by 9 MW and output increasing by 21 GWh), it still
has an important role in Scotland’s renewable heat production. Some progress worth noting
is that of the Keithick Biogas ‘biomethane to gas grid injection’ (BtG). Keithick BtG was
commissioned in December 2014, and operations increased during 2015. Once running at
full capacity, the site is expected to produce 3 million cubic metres of biomethane each
year32 and could contribute up to 32 GWh33 of renewable heat in Scotland34.
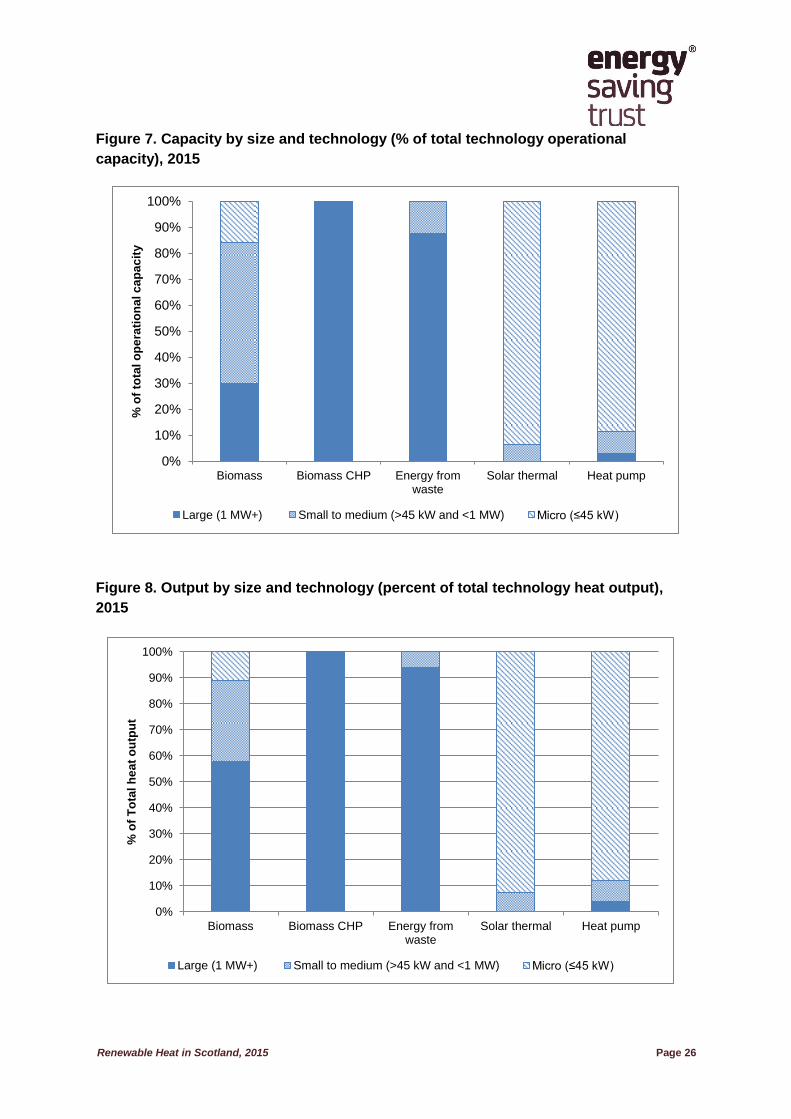
4.4 Results by size and technology
As in 2014, biomass primary combustion is still the renewable heat technology within the
database with the most noticeable spread over the different size categories (large, small to
medium, and micro). Almost all biomass CHP and energy from waste sites in 2015 are within
the ‘large’ size bracket, whereas solar thermal and heat pumps in 2015 are almost entirely
within the ‘micro’ size bracket. This is likely due to solar thermal systems and heat pumps
being generally more suitable for space and/or water heating which currently in Scotland is
usually generated on a smaller scale.
A breakdown of technology and size (as percent of the overall total for each technology) is
shown in Figures 7 and 8 below.
32
http://www.ionacapital.co.uk/page/113/Keithick-Biogas-Limited.htm 33
Equates to 0.8% of current renewable heat output. 34
Assuming an average gross calorific value (GCV) of biomethane to be 38 megajoules per cubic metre (38MJ/m3). Formula used to calculate MWh is: (3,000,000 cubic metres x 38 MJ/m3) ÷ (3,600 MWh/MJ) = 31,666 MWh, which is equivalent to approximately 32 GWh.
Renewable Heat in Scotland, 2015 Page 26
Figure 7. Capacity by size and technology (% of total technology operational
capacity), 2015
Figure 8. Output by size and technology (percent of total technology heat output),
2015
0%
10%
20%
30%
40%
50%
60%
70%
80%
90%
100%
Biomass Biomass CHP Energy fromwaste
Solar thermal Heat pump
% o
f to
tal o
pe
rati
on
al c
ap
ac
ity
Large (1 MW+) Small to medium (>45 kW and <1 MW) Micro (≤45 kW)
0%
10%
20%
30%
40%
50%
60%
70%
80%
90%
100%
Biomass Biomass CHP Energy fromwaste
Solar thermal Heat pump
% o
f T
ota
l h
ea
t o
utp
ut
Large (1 MW+) Small to medium (>45 kW and <1 MW) Micro (≤45 kW)
Renewable Heat in Scotland, 2015 Page 27
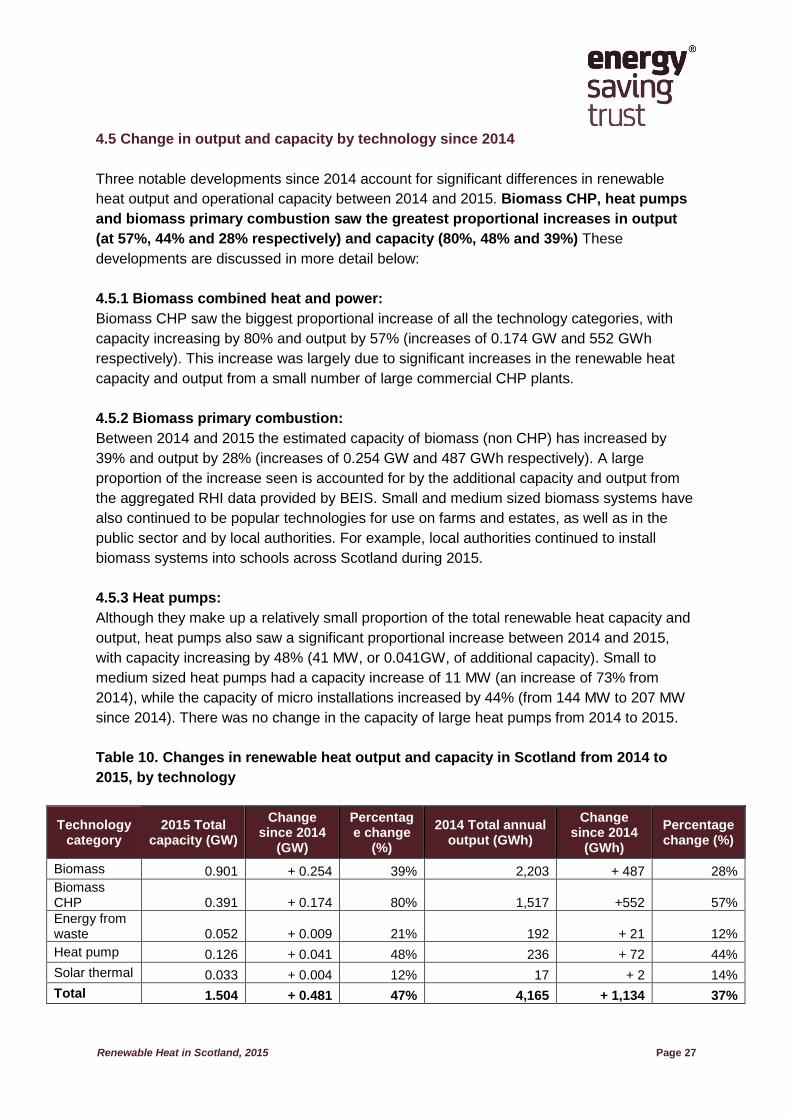
4.5 Change in output and capacity by technology since 2014
Three notable developments since 2014 account for significant differences in renewable
heat output and operational capacity between 2014 and 2015. Biomass CHP, heat pumps
and biomass primary combustion saw the greatest proportional increases in output
(at 57%, 44% and 28% respectively) and capacity (80%, 48% and 39%) These
developments are discussed in more detail below:
4.5.1 Biomass combined heat and power:
Biomass CHP saw the biggest proportional increase of all the technology categories, with
capacity increasing by 80% and output by 57% (increases of 0.174 GW and 552 GWh
respectively). This increase was largely due to significant increases in the renewable heat
capacity and output from a small number of large commercial CHP plants.
4.5.2 Biomass primary combustion:
Between 2014 and 2015 the estimated capacity of biomass (non CHP) has increased by
39% and output by 28% (increases of 0.254 GW and 487 GWh respectively). A large
proportion of the increase seen is accounted for by the additional capacity and output from
the aggregated RHI data provided by BEIS. Small and medium sized biomass systems have
also continued to be popular technologies for use on farms and estates, as well as in the
public sector and by local authorities. For example, local authorities continued to install
biomass systems into schools across Scotland during 2015.
4.5.3 Heat pumps:
Although they make up a relatively small proportion of the total renewable heat capacity and
output, heat pumps also saw a significant proportional increase between 2014 and 2015,
with capacity increasing by 48% (41 MW, or 0.041GW, of additional capacity). Small to
medium sized heat pumps had a capacity increase of 11 MW (an increase of 73% from
2014), while the capacity of micro installations increased by 44% (from 144 MW to 207 MW
since 2014). There was no change in the capacity of large heat pumps from 2014 to 2015.
Table 10. Changes in renewable heat output and capacity in Scotland from 2014 to
2015, by technology
Technology category
2015 Total capacity (GW)
Change since 2014
(GW)
Percentage change
(%)
2014 Total annual output (GWh)
Change since 2014
(GWh)
Percentage change (%)
Biomass 0.901 + 0.254 39% 2,203 + 487 28%
Biomass CHP 0.391 + 0.174 80% 1,517 +552 57%
Energy from waste 0.052 + 0.009 21% 192 + 21 12%
Heat pump 0.126 + 0.041 48% 236 + 72 44%
Solar thermal 0.033 + 0.004 12% 17 + 2 14%
Total 1.504 + 0.481 47% 4,165 + 1,134 37%

Renewable Heat in Scotland, 2015 Page 28
Note: data has been rounded for ease of reading, hence some subtotals may not precisely
equal summed figures.
4.6 Capacity and output by local authority area
The database captures information on the local authority area for most operational sites that
are in the large (1 MW+) or small and medium (>45 kW and <1 MW) size categories.
Information for each local authority is not available for micro (≤45 kW) installations as
location information for these records has not been disclosed to EST from MCS (used from
2012 onwards), and is not available for aggregated data from previous schemes (used for
2008/9-2011). A local authority breakdown of the aggregated RHI data was not available for
this report.
The key findings from analysis of the non-micro and non-RHI aggregated installations by
local authority area are:
Fife accounted for at least 24% of Scotland’s total renewable heat output in 2015
(988 GWh) and had 15% of the overall operational capacity (0.232 GW)
56% of the 2015 heat output came from just 4 areas (Fife, Highland, Stirling and
North Ayrshire), each of which contributed over 300 GWh of renewable heat in 2015.
These 4 areas had a combined capacity of 0.542 GW (36% of the total renewable
capacity in Scotland).
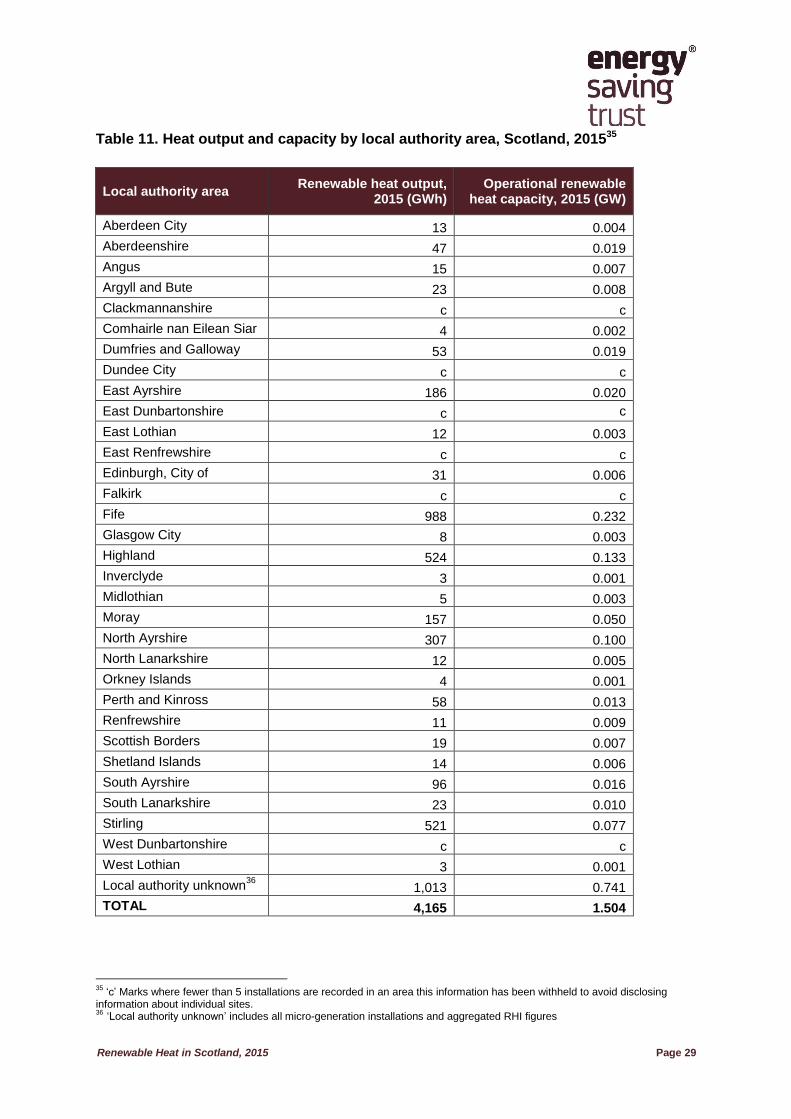
Renewable Heat in Scotland, 2015 Page 29
Table 11. Heat output and capacity by local authority area, Scotland, 201535
Local authority area Renewable heat output,
2015 (GWh) Operational renewable
heat capacity, 2015 (GW)
Aberdeen City 13 0.004
Aberdeenshire 47 0.019
Angus 15 0.007
Argyll and Bute 23 0.008
Clackmannanshire c c
Comhairle nan Eilean Siar 4 0.002
Dumfries and Galloway 53 0.019
Dundee City c c
East Ayrshire 186 0.020
East Dunbartonshire c c
East Lothian 12 0.003
East Renfrewshire c c
Edinburgh, City of 31 0.006
Falkirk c c
Fife 988 0.232
Glasgow City 8 0.003
Highland 524 0.133
Inverclyde 3 0.001
Midlothian 5 0.003
Moray 157 0.050
North Ayrshire 307 0.100
North Lanarkshire 12 0.005
Orkney Islands 4 0.001
Perth and Kinross 58 0.013
Renfrewshire 11 0.009
Scottish Borders 19 0.007
Shetland Islands 14 0.006
South Ayrshire 96 0.016
South Lanarkshire 23 0.010
Stirling 521 0.077
West Dunbartonshire c c
West Lothian 3 0.001
Local authority unknown36
1,013 0.741
TOTAL 4,165 1.504
35
‘c’ Marks where fewer than 5 installations are recorded in an area this information has been withheld to avoid disclosing information about individual sites. 36 ‘Local authority unknown’ includes all micro-generation installations and aggregated RHI figures
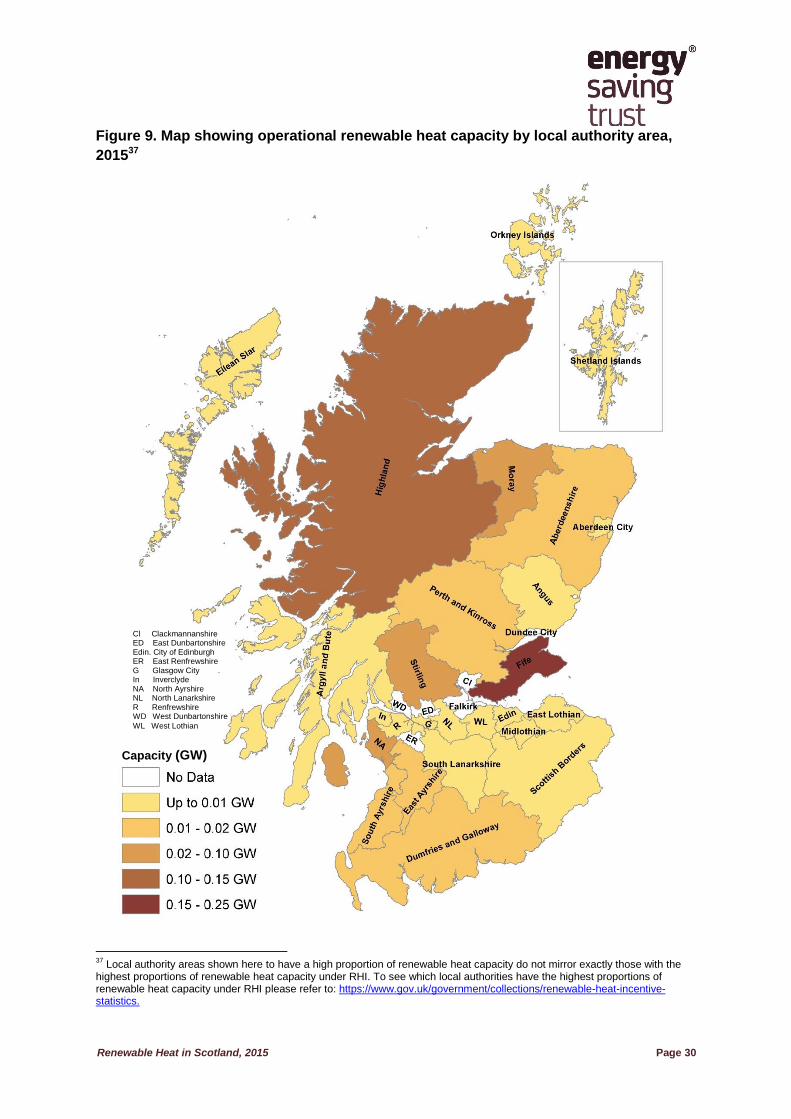
Renewable Heat in Scotland, 2015 Page 30
Figure 9. Map showing operational renewable heat capacity by local authority area,
201537
37
Local authority areas shown here to have a high proportion of renewable heat capacity do not mirror exactly those with the highest proportions of renewable heat capacity under RHI. To see which local authorities have the highest proportions of renewable heat capacity under RHI please refer to: https://www.gov.uk/government/collections/renewable-heat-incentive-statistics.
Cl Clackmannanshire ED East Dunbartonshire Edin. City of Edinburgh ER East Renfrewshire G Glasgow City In Inverclyde NA North Ayrshire NL North Lanarkshire R Renfrewshire WD West Dunbartonshire
WL West Lothian
Capacity (GW)
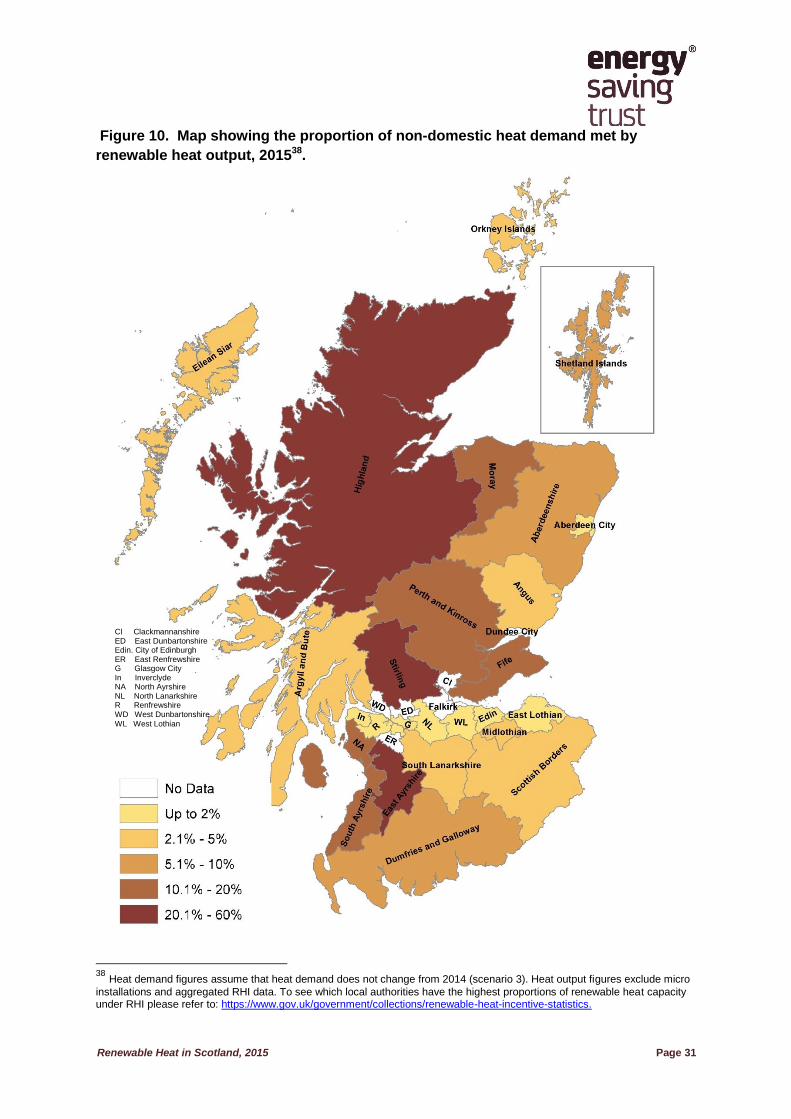
Renewable Heat in Scotland, 2015 Page 31
Figure 10. Map showing the proportion of non-domestic heat demand met by
renewable heat output, 201538.
38
Heat demand figures assume that heat demand does not change from 2014 (scenario 3). Heat output figures exclude micro
installations and aggregated RHI data. To see which local authorities have the highest proportions of renewable heat capacity under RHI please refer to: https://www.gov.uk/government/collections/renewable-heat-incentive-statistics.
Cl Clackmannanshire ED East Dunbartonshire Edin. City of Edinburgh ER East Renfrewshire G Glasgow City In Inverclyde NA North Ayrshire NL North Lanarkshire R Renfrewshire WD West Dunbartonshire
WL West Lothian

Renewable Heat in Scotland, 2015 Page 32
Aggregated RHI scheme data provided by BEIS to EST does not show local authority area
as doing so would risk disclosing information about individual sites (combined with the other
data provided). Therefore, Table 11 above does not include 24% of the overall heat output
and 49% of the overall capacity reported for 2015 as this is not assigned to a local authority.
Rather than include two tables with similar but apparently differing information, the decision
has been taken not to include the breakdown of the number and capacity of accreditations
under the non-domestic RHI by local authority in this report. This data is however available
separately from BEIS39.
As mentioned above, the renewable heat database does not record local authority area for
microgeneration technologies. However, BEIS do publish tables of domestic RHI
accreditation numbers by local authority area. The data for Scotland from the December
2015 data is given below in Table 12.
39
Please refer to: https://www.gov.uk/government/collections/renewable-heat-incentive-statistics.
Renewable Heat in Scotland, 2015 Page 33
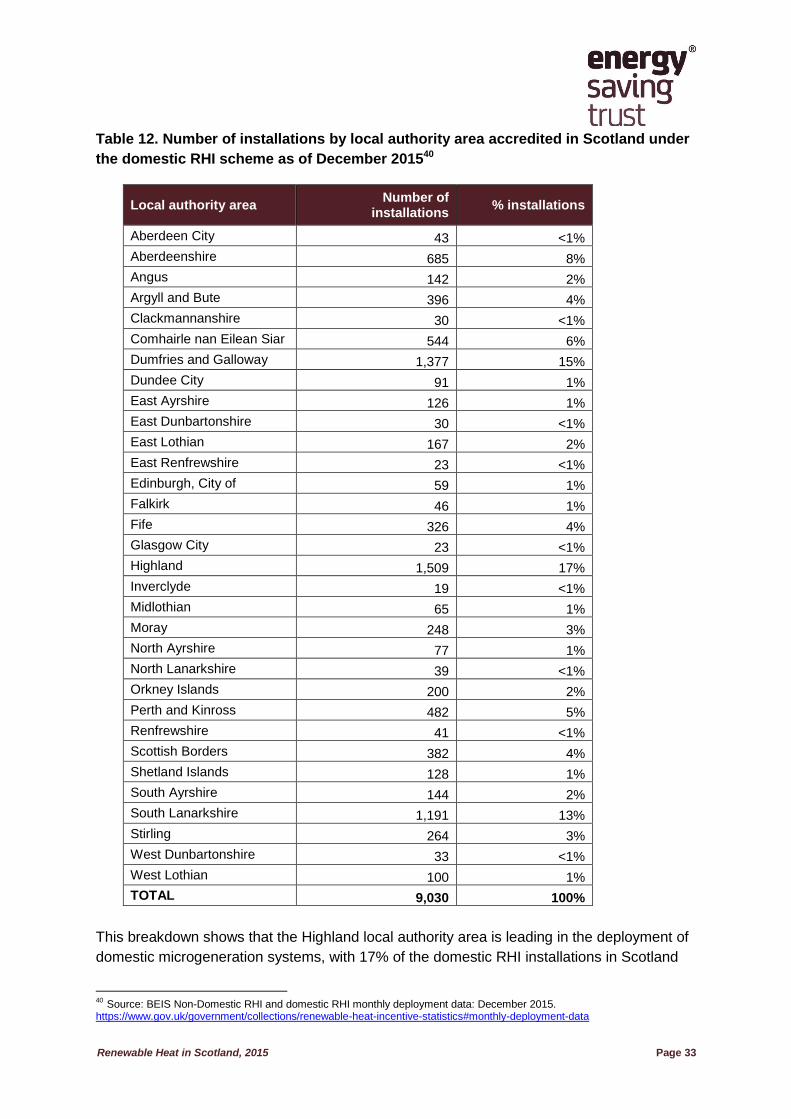
Table 12. Number of installations by local authority area accredited in Scotland under
the domestic RHI scheme as of December 201540
This breakdown shows that the Highland local authority area is leading in the deployment of
domestic microgeneration systems, with 17% of the domestic RHI installations in Scotland
40 Source: BEIS Non-Domestic RHI and domestic RHI monthly deployment data: December 2015. https://www.gov.uk/government/collections/renewable-heat-incentive-statistics#monthly-deployment-data
Local authority area Number of
installations % installations
Aberdeen City 43 <1%
Aberdeenshire 685 8%
Angus 142 2%
Argyll and Bute 396 4%
Clackmannanshire 30 <1%
Comhairle nan Eilean Siar 544 6%
Dumfries and Galloway 1,377 15%
Dundee City 91 1%
East Ayrshire 126 1%
East Dunbartonshire 30 <1%
East Lothian 167 2%
East Renfrewshire 23 <1%
Edinburgh, City of 59 1%
Falkirk 46 1%
Fife 326 4%
Glasgow City 23 <1%
Highland 1,509 17%
Inverclyde 19 <1%
Midlothian 65 1%
Moray 248 3%
North Ayrshire 77 1%
North Lanarkshire 39 <1%
Orkney Islands 200 2%
Perth and Kinross 482 5%
Renfrewshire 41 <1%
Scottish Borders 382 4%
Shetland Islands 128 1%
South Ayrshire 144 2%
South Lanarkshire 1,191 13%
Stirling 264 3%
West Dunbartonshire 33 <1%
West Lothian 100 1%
TOTAL 9,030 100%
Renewable Heat in Scotland, 2015 Page 34
located in this area. Other areas with large numbers of microgeneration systems are
Dumfries and Galloway and South Lanarkshire. Both areas had over 1000 domestic RHI
accredited systems as of December 2015, and held 15% and 13% of the total accredited
domestic installations in Scotland respectively. As of December 2015, Scotland as a whole
had 20% of the 45,111 accredited domestic RHI systems in Great Britain.
Figures do not provide a full picture of renewable heat being supplied to homes by each
local authority area. For example; domestic RHI figures do not include homes supplied by
renewable heat through district heating or homes with microgeneration renewable
technologies installed before 15 July 2009.
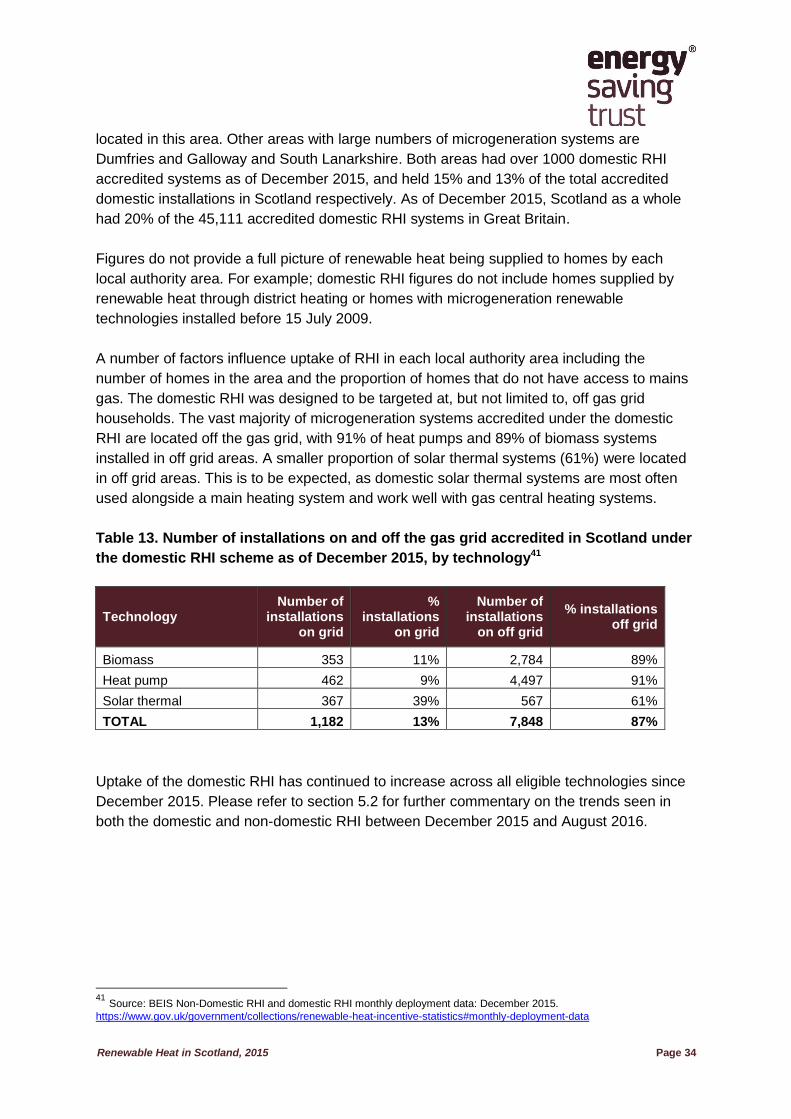
A number of factors influence uptake of RHI in each local authority area including the
number of homes in the area and the proportion of homes that do not have access to mains
gas. The domestic RHI was designed to be targeted at, but not limited to, off gas grid
households. The vast majority of microgeneration systems accredited under the domestic
RHI are located off the gas grid, with 91% of heat pumps and 89% of biomass systems
installed in off grid areas. A smaller proportion of solar thermal systems (61%) were located
in off grid areas. This is to be expected, as domestic solar thermal systems are most often
used alongside a main heating system and work well with gas central heating systems.
Table 13. Number of installations on and off the gas grid accredited in Scotland under
the domestic RHI scheme as of December 2015, by technology41
Technology Number of
installations on grid
% installations
on grid
Number of installations
on off grid
% installations off grid
Biomass 353 11% 2,784 89%
Heat pump 462 9% 4,497 91%
Solar thermal 367 39% 567 61%
TOTAL 1,182 13% 7,848 87%
Uptake of the domestic RHI has continued to increase across all eligible technologies since
December 2015. Please refer to section 5.2 for further commentary on the trends seen in
both the domestic and non-domestic RHI between December 2015 and August 2016.
41
Source: BEIS Non-Domestic RHI and domestic RHI monthly deployment data: December 2015.
https://www.gov.uk/government/collections/renewable-heat-incentive-statistics#monthly-deployment-data
Renewable Heat in Scotland, 2015 Page 35
5 Further renewable heat capacity in development
5.1 Overview of pipeline projects in the renewable heat database
This report also tracks projections of both expected capacity and heat output over the
coming years. The database has been structured to record the current status of each
project, namely:
Under construction - where the project is in the build phase.
Consented, not built - where a planning application and other required permissions
have been granted but construction is not yet underway.
In planning – where a planning application or otherwise has been submitted, but with
no formal approval yet received.
In scoping - where the project is in its initial phase.
It is estimated that as of December 2015:
0.340 GW of renewable heat capacity was in one of the development stages,
potentially contributing a further 1,468 GWh of renewable heat output in the future.
If all the projects in development were completed the total renewable heat capacity in
Scotland would be 1.843 GW and output could increase to 5,633 GWh per year - a
23% increase in capacity and 35% increase in output.
Although these figures can be used to provide an estimate of the future renewable heat
output in Scotland, there is inherently a large degree of uncertainty around such figures as
projects may be altered or cancelled during the development phases. Furthermore it is likely
that a large proportion of developing projects are not captured within the scope of this
database, particularly for smaller installations and installations that are not required to go
through formal planning permission. These two uncertainties should be taken into account
when the data presented here are interpreted.
Renewable Heat in Scotland, 2015 Page 36
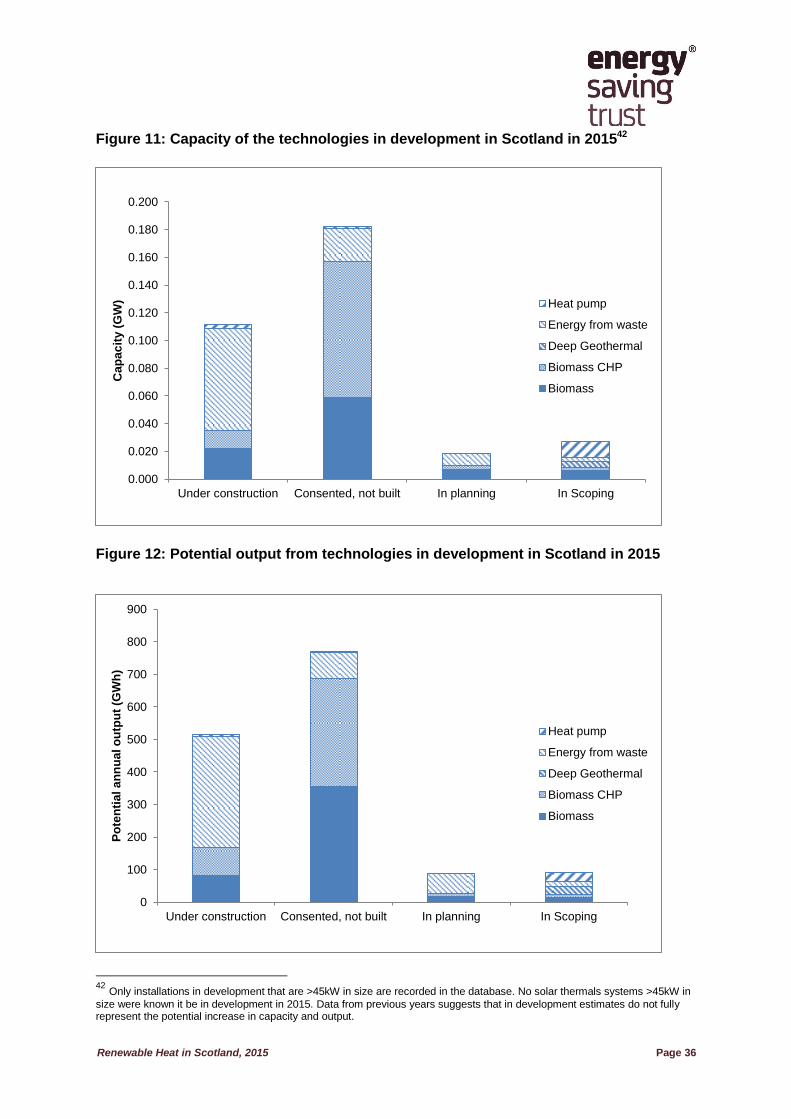
Figure 11: Capacity of the technologies in development in Scotland in 201542
Figure 12: Potential output from technologies in development in Scotland in 2015
42
Only installations in development that are >45kW in size are recorded in the database. No solar thermals systems >45kW in
size were known it be in development in 2015. Data from previous years suggests that in development estimates do not fully represent the potential increase in capacity and output.
0.000
0.020
0.040
0.060
0.080
0.100
0.120
0.140
0.160
0.180
0.200
Under construction Consented, not built In planning In Scoping
Ca
pa
cit
y (
GW
) Heat pump
Energy from waste
Deep Geothermal
Biomass CHP
Biomass
0
100
200
300
400
500
600
700
800
900
Under construction Consented, not built In planning In Scoping
Po
ten
tia
l a
nn
ua
l o
utp
ut
(GW
h)
Heat pump
Energy from waste
Deep Geothermal
Biomass CHP
Biomass

Renewable Heat in Scotland, 2015 Page 37
Projects ‘under construction’ have a total capacity of 0.111 GW and an estimated heat
output of 516 GWh. The majority of this comes from 7 energy from waste sites. This includes
Polmadie energy from waste site near Glasgow, which has been under construction since
2013 and Dunbar energy from waste plant, which is due to become operational in 2017.
The ‘consented, not built’ projects have a total capacity of 0.182 GW with an estimated heat
output of 772 GWh. While energy from waste projects still makes up a significant proportion
of capacity and output, the highest contributing technologies in this category are biomass
CHP with 0.099 GW capacity and biomass heat only with 0.059 GW capacity.
0.019 GW of heat capacity was in the ‘planning’ phase as of December 2015, which could
generate 89 GWh of heat output. The highest contributors in planning are biomass projects,
with many small to medium installations planned for schools and small district heating
networks.
The projects currently in scoping could provide another 0.028 GW of heat capacity, leading
to approximately 92 GWh of heat output. Included in these figures are 4 deep geothermal
projects that were awarded grants through the Geothermal Energy Challenge Fund in 2015
to ‘explore the technical feasibility, economic viability and environmental sustainability of the
emerging technology’43. Feasibility studies for the projects were submitted to the Low
Carbon Infrastructure Transition Programme in spring 2016 and can be viewed on the
Scottish Government website44.
Also in scoping are two district heating projects that were awarded development funding
through the Local Energy Challenge Fund in 201645. The River Tay Heat Pump District
Heating project intends to use a 2 MW water source heat pump to heat dwellings, business
plots and council buildings, while the Large Scale ASHP District Heating Exemplar project,
led by Glasgow Housing Association, plans to use a 700 kW air source heat pump to heat
350 dwellings in multi-storey buildings built in the 1970s.
It is important to note that figures from the ‘in scoping’ category should be treated with
extreme caution as:
It is not known how many of these projects will ultimately become operational and
key details may change as different options are explored.
Numbers are likely to be a huge underestimate as not all projects in scoping will have
been captured in the renewable heat database. In particular the Renewable Energy
Planning database (REPD) no longer monitors projects with a capacity less than 1
MW. This has had a detrimental impact on our ability to monitor the small and
medium scale projects (>45 kW and <1 MW) that, as seen in section 4 above make
up a significant portion of the renewable heat capacity and output in Scotland.
43 http://news.scotland.gov.uk/News/Geothermal-energy-projects-awarded-quarter-million-19ed.aspx 44
http://www.gov.scot/Topics/Business-Industry/Energy/Action/lowcarbon/LCITP/geothermal 45
http://www.localenergyscotland.org/funding-resources/funding/local-energy-challenge-fund/development-projects-2015/
Renewable Heat in Scotland, 2015 Page 38
5.2 Trends seen in the RHI monthly statistics
During the first eight months of 2016, there was an increase in both the number of full
accreditations46 under the non-domestic RHI scheme and in accreditations under the
domestic scheme.
Trends in the domestic RHI scheme47:
There was a 16% increase in accreditations for systems in Scotland under the
domestic RHI between December 2015 and August 2016. (An increase of 1,480,
from 9,030 as of 31 December 2015 to 10,510 as of 31 August 2016)
The technology with the biggest increase in accreditations under the domestic RHI
was air source heat pumps, with a 21% increase (from 4,140 as of December
2015 to 5,030 as of August 2016).
The number of domestic ground source heat pumps accredited under the domestic
RHI from December 2015 to August 2016 has grown 15%, from 820 in December
2015 to 940 systems in August 2016.
Biomass systems and solar thermal installations have seen lower rates of
uptake, with biomass accreditations increasing by 12% (from 3,140 to 3,510) and
solar thermal accreditations increasing by 10% (from 930 to 1,030) between
December 2015 and August 2016.
As of August 2016, systems in Scotland accounted for 21% of the total number of
accredited systems under the domestic RHI scheme.
Trends in the non-domestic RHI scheme48:
There was an 11% increase in the number of non-domestic RHI ‘full applications’ in
Scotland between December 2015 and August 2016, with a 24% increase in
capacity. (An increase from 2,820 full applications in December 2015 to 3,120 in
August 2016, and a capacity increase of 122 MW, from 507 MW to 629 MW)
The general trend across all countries (England, Wales and Scotland) was that the
biggest growth between December 2015 and August 2016 was in CHP systems and
biogas systems. GB wide the number of CHP full applications increased from only 2
in December 2015 to 18 in August 2016, while the number of full applications for
biogas increased from 150 to 580 over the same period (an increase of 295%).
46
Under the non-domestic RHI ‘Full application’ refers to applications that are not preliminary. This means that the site will have been commissioned, but can be either accredited or currently going through the accreditation process. 47
Numbers of installations have been rounded to the nearest 10 for ease of reading 48
For the non-domestic scheme a breakdown of the capacity and heat paid for under different technology categories is not available by region, so determining the trend in Scotland is less clear than with the domestic scheme.
Renewable Heat in Scotland, 2015 Page 39
Between December 2015 and August 2016, the number of full applications for
medium solid biomass installations increased by 59% across all of GB, while full
applications for biomethane installations increased by 47%.
As of August 2016 systems in Scotland accounted for 19% of the total number of
full applications and 20% of the total the installed capacity under the non-
domestic RHI scheme.
These figures demonstrate the continued impact both the non-domestic and domestic RHI
schemes have on renewable heat in Scotland.
5.3 Emerging technologies and innovative projects in the pipeline
Following on from the commissioning of the ‘biomethane to gas grid injection’ (BtG) at
Keithick Biogas in late 2014, it is likely that other AD plants around Scotland may be
converting, or may begin to convert, some or all of their capacity to BtG. As with Keithick
Biogas, sites converting from AD to BtG will not add to the overall heat capacity, so as these
sites start to inject gas the contribution will only be noticeable in the figures for heat output.
Although there will be some low conversion losses, gas to grid injection should avoid higher
heat losses from combusting gas on site (or flaring the excess gas and wasting the energy),
and should make a contribution to decarbonisation of the gas grid.
There are also a wide range of innovative projects being funded through various challenge
funds. Together, these projects not only aim to show how different renewable technologies
can be used but also aim to reduce heat demand through the installation of energy efficiency
measures and behavioural change. Many of the projects are not yet at a stage where heat
capacity and estimated output can be included in the figures presented in this report. A
summary of some of the relevant projects is given below to show the range of projects
currently being supported:
5.3.1 District Heating Loan Fund
The Scottish Government’s District Heating Loan Fund has part-funded a significant number
of district heating schemes in Scotland to date and continues to provide a vital funding
stream for both low carbon and renewable projects that may be seen as high risk by other
lenders. Information on projects awarded funding can be found at:
http://www.energysavingtrust.org.uk/scotland/grants-loans/district-heating-loan
5.3.2 Local Energy Challenge Fund
The Scottish Government together with Local Energy Scotland has launched the Local
Energy Challenge Fund. This fund provides grant and loan funding for major demonstration

Renewable Heat in Scotland, 2015 Page 40
projects providing transformative and innovative local energy solutions. These projects aim
to have high impact not only in terms of helping to achieve Scottish Government renewable
targets but also in showcasing new ways of using renewables.
As mentioned in section 5.1, two district heating projects currently funded through the Local
Energy Challenge Fund are already in scoping and are recorded in the database. Another
innovative project receiving development funding is the Montrose Local Energy Project. This
will process and dry used animal bedding to produce a new fuel source in the form of pellets.
While this will not directly generate renewable heat, it is possible that the availability of this
new fuel source may encourage the uptake of compatible renewable heating systems in the
local area.
5.3.3 Low Carbon Infrastructure Transition Programme
Launched in March 2015, the Low Carbon Infrastructure Transition Programme (LCITP) is a
collaborative partnership led by the Scottish Government, working with Scottish Enterprise,
Highlands and Islands Enterprise, Scottish Futures Trust and Resource Efficient Scotland.
With a budget of £76m, this programme focuses on supporting the acceleration of low
carbon infrastructure projects (including district heating) across the public, private and
community sectors to develop investment grade business cases to help projects secure
public and private capital finance. To date, LCITP has provided financial supported to 46 low
carbon projects covering a wide range of technologies.
A number of the feasibility studies, supported through the programme, are available on the
LCITP website: www.gov.scot/Topics/Business-Industry/Energy/Action/lowcarbon/LCITP
5.3.4 Scotland’s Energy Efficiency Programme Pilot
The Infrastructure Investment Plan reaffirmed the designation of energy efficiency as a
National Infrastructure Priority. The cornerstone of this will be Scotland’s Energy Efficiency
Programme which will commence in 2018 with substantial annual public funding. It will be a
co-ordinated programme to improve the energy efficiency of homes and buildings in the
commercial, public and industrial sectors with an estimated overall investment of up to
£10bn.
The Programme for Government 2016-17 (PfG) committed over half a billion pounds to
SEEP over the next four years, setting out a clear commitment to develop this very
significant energy efficiency and low carbon heating generation programme with substantial
annual public funding. Scottish Government are working with councils to pilot integrated
action on domestic and non-domestic energy efficiency with investment of over £9 million of
funding in 11 local authorities to support pilots in 2016-17 with further funding being made
available next year. A summary list of the pilots to date can be viewed at:
http://news.scotland.gov.uk/News/Action-on-fuel-poverty-2c06.aspx
Renewable Heat in Scotland, 2015 Page 41
5.4 Other developments from 2015 onwards
From the summary of findings it is clear that operational heat capacity in Scotland is growing
faster than the annual heat output from the operational sites. This implies that, although
some systems will not be needed all year round, there is some underuse of the potential
heat available which could potentially be exported to other heat users. Further strategic
development of heat networks (where feasible) will allow authorities to identify and utilise
excess heat, improve operational efficiencies, strengthen heat security and accelerate
Scotland towards its renewable heat targets.
In January 2016 the Scottish Government worked with the Scottish Environment Protection
Agency (SEPA) to collect data on excess waste heat from industrial sites to inform policy
development. Data on waste heat was requested on a voluntary basis via the Scottish
Pollution Release Inventory (SPRI) questionnaire, issued to industries regulated by SEPA
under the Pollution Prevention and Control (Scotland) Regulations 2012 (as amended).
Responses were received from several organisations, and to supplement this data the
exercise will be repeated in January 2017 with more guidance and engagement with
industry.
Renewable Heat in Scotland, 2015 Page 42
6 Uncertainty levels associated with the methodology used, and recommendations for future updates
In any analysis of this kind where incomplete data are gathered from a variety of sources,
certain assumptions have to be made to fill in gaps in the data. Assumptions made for
particular technologies or sectors are discussed in this section, as well as the following
general advice on the robustness of these figures:
As in previous years there is a chance that installations could have been either
missed or double counted. Estimates of future output and capacity from installations
still in development should also be treated with caution, as these projects may not
come to fruition for a variety of reasons, and the stated capacity and heat output for
projects still in development may be subject to change.
Realised heat output from future installations may also not match predictions of
future output based on installed capacity and peak running hours.
It is worth noting that many heat installations currently in development propose to
export heat to nearby heat users; however, the heat networks necessary to transport
this heat have yet to be constructed, and in some cases there is not yet a heat user
located nearby. Use of the renewable heat will therefore depend firstly upon a
suitable heat user being identified or established nearby; and secondly how much
heat that user requires, either for process heat or space heating.
6.1 Estimating heat capacity and renewable heat output for non-domestic RHI
accredited installations
The non-domestic Renewable Heat Incentive (RHI) launched in 2011, making its first
payments for heat generated in 2012. The scheme is administered by Ofgem on behalf of
the Department for Business, Energy and Industrial Strategy (BEIS). Previous reports have
recommended that access to the RHI database be given to EST or the Scottish Government
to ensure that all installations are captured in the renewable heat in Scotland database and
that the respective output is included in the target monitoring figures. While some progress
has been made on this action, legislative changes would be required to enable the non-
domestic RHI database to be made available to the Scottish Government or EST for this
purpose.
The RHI continues to incentivise the uptake of renewable heat technologies, a large number
of which are small to medium biomass boilers. The renewable heat database is likely to
capture most large scale installations through the use of the Renewable Energy Planning
Database (REPD), and a large proportion of micro installations through the receipt of
anonymised data from the Microgeneration Installations Database (MID) (see section 5.2
below). The RHI data is likely to be the largest single source of site-level information on
Renewable Heat in Scotland, 2015 Page 43
medium installations and this information is hard to find efficiently through other sources
without a high risk of double counting. Current site-level information in the renewable heat
database on medium sized installations is therefore more likely to be uncertain (in terms of
useful renewable heat output) and likely to be underreported. It has therefore become
increasingly important to be able to cross-reference the renewable heat database with the
RHI database as the RHI continues to see an increase in interest in this size range of
biomass boilers49. An extract of the non-domestic RHI database was not available at the
time of compiling the data for this report. In order to ensure that this work could make use of
the RHI dataset, BEIS instead carried out analysis on the EST and RHI databases. By doing
so they were able to provide EST with aggregated figures for the capacity, heat output and
number of RHI accredited installations that are not already accounted for in the renewable
heat database. Full details of the work carried out and the steps taken to avoid double
counting are available in Appendix 3.
The additional capacity, eligible heat output and numbers of installations identified by BEIS
have been added to the total figures shown in this report.
6.2 Estimating micro installations: capacity and output
As in previous years, Germserv have supplied an updated data extract from the MCS
Installation Database (MID). Gemserv are the administrators of the Microgeneration
Certification Scheme (MCS) which is a quality assurance scheme for microgeneration
technologies and installers. Under this scheme MCS installers must register each installation
on the MID otherwise it will not be recognised as an MCS installation. The MID therefore
provides exact numbers of solar thermal, ground source heat pumps, air source heat pumps
and biomass systems that are installed by MCS certified installers.
The current data in the renewable heat database for micro installations now includes MCS
accreditation data from 2012-2015 (inclusive). For the 2011 report the number of micro
installations was estimated as MCS data from the MID was not available to EST until 2012.
The data used in the 2011 report came from a range of sources such as: EPC data, Building
Services Research and Information Association (BSRIA), Energy Saving Trust grant and
loan schemes, Heating and Hotwater Industry Council (HHIC) estimates and Stove Industry
Alliance sales estimates for Scotland. Pre-2012 MCS data has not been included in the
renewable heat database to avoid double counting.
Micro-renewable heat installations must be MCS certified (or equivalent) to be eligible for
support under the RHI schemes (both domestic and non-domestic). Therefore it is assumed
that data for Scotland from the MID covers all micro heat systems accredited under the RHI.
However, there are likely to be micro-renewable heat generating systems operational in
Scotland that are not MCS accredited (either because they do not require scheme funding or
would not be eligible for scheme funding). This means that the number, capacity and heat
49 https://www.gov.uk/government/collections/renewable-heat-incentive-statistics
Renewable Heat in Scotland, 2015 Page 44
output for micro systems (smaller than 45 kW) are all likely to be underestimated. At the time
of writing there were no data available that would provide the missing information without
risking double counting.
6.3 Potential useful heat output that is not currently utilised
In previous reports the potential for unused heat from industrial sites currently using less
heat than they produce has not been quantified. It is still beyond the current scope of this
report to cover this subject, as the detailed data required and the agreed methodology are
not yet available. (Data required would include: energy consumed onsite; detailed heat and
electrical output; unused ‘useful heat’ including the form of heat available, for example warm
or hot water, steam, hot air. There is also a methodology required for quantifying the size
and value of nearby potential heat loads in relation to the type and scale of heat available.)
6.4 Recommendations for future updates
6.4.1 Recommendation 1 – RHI data
This is the second year in which RHI data has been merged with the renewable heat
database to provide a more comprehensive picture of the deployment of renewable
heat technologies in Scotland. It will not realistically be possible to publish an
accurate report on progress towards the Scottish Government’s 2020 targets in
future years without the UK Government continuing to provide analytical support. An
alternative could be for the Scottish Government to receive RHI data which may be
used for this purpose. This alternative would result in a potentially more efficient
process and more accurate report andwould provide the detail required by the
Scottish Government to inform and direct policy action on the ground.
6.4.2 Recommendation 2 – energy from waste data
Given the estimated current and potential contribution of energy from waste to
renewable heat output, the database would benefit from greater information sharing
between organisations involved in the development of energy from waste projects, as
far as is possible within the limits of commercial confidentiality. On site data from
operational projects regarding biodegradable content and quantity of the waste used
for heat generation (or as feedstock for conversion to biofuels via AD, BtG,
gasification or pyrolysis processes) as well as metered heat output data would help
to ensure greater certainty in the calculations used to estimate the useful heat output
figures included in this report. In addition, improved data about changes to the
fraction of biodegradable material within the municipal waste stream over time would
improve the evidence base of the contribution made by installations producing heat
from burning municipal solid waste. Access to such data would also provide the
information needed to more accurately estimate the potential contribution of projects
in the pipeline to the Scottish Government’s heat targets.
Renewable Heat in Scotland, 2015 Page 45
6.4.3 Recommendation 3 – CHP data
Considerable effort has been made to ensure accuracy of ‘useful heat output’ data
from complex sites, both heat only and combined heat and power. Given the site-by-
site complexities in large scale generation (including what the heat is used for) it is
recommended that future revisions of the database and report continue to improve
the information that heat output figures are based on by using information on heat
output directly from the operator where possible.
6.4.4 Recommendation 4 – unused ‘useful heat’
It is recommended that the Scottish Government continues to carry out work, with
partners including SEPA, to quantify the amount of waste heat from industrial sites
(see section 5.4) . This could help inform future estimates of available unused but
useful heat which, as mentioned in section 6.3 above, is currently beyond the scope
of the database.
6.4.5 Recommendation 5 – calorific value of woodfuel
For the 2015 update of the database one oven-dried tonne (ODT) of wood was
assumed to contain 4.92 MWh of energy50. It is recommended that that further
research into the calorific value of woodfuel is carried out before the 2016 database
update to ensure this assumption is in line with current research, or to update the
assumption if required.
6.4.6 Recommendation 6 – assessment of pipeline projects
As discussed in section 5.1 there is currently a large amount of uncertainty
surrounding the capacity and potential output from projects which are in the pipeline
and are yet to be commissioned. It is recommended for future reports that potential
alternative ways of predicting the impact of future developments are investigated.
The way in which in development data is presented could also be considered further,
to ensure that projections of future capacity and output are as meaningful as
possible.
50
Mitchell, Hudson, Gardner, Storry and Gray, 1990. Wood Fuel Supply Strategies Vol 1. The Report: ETSU B 1176-P1.
Renewable Heat in Scotland, 2015 Page 46
Appendix 1. Technical terms used
7.1 References to ‘heat output’
The following terms have been used in the report when talking about heat output from heat
generating installations:
Heat output
Where used in this report ‘heat output’ refers to the heat output from a site. This may be
potential, actual or useful heat output.
Useful heat output
Heat delivered to an end user or process, taking into account losses.
Actual heat output
The total amount of heat produced by a site, accounting for losses and efficiency. Actual
heat output includes heat that is not delivered to an end user or process.
Potential heat output
The total amount of heat could potentially be generated by the site if it operated at peak
capacity for the total number of ‘peak running hours’ stated in Table 3; alternatively the total
heat output potentially generated by a site if it operated at the assumed capacity stated in
Table 14.
Renewable heat output
Refers to the renewable heat output from a site. This term is used for clarity where it may not
be clear if the heat output being discussed is renewable, for example with energy from waste
sites.
7.2 Renewable energy technologies
The following technologies are considered to produce heat from renewable sources, and are
included in the database:
Biomass (wood) primary combustion
Wood is burnt to directly produce heat for space or water heating, or to provide heat for an
industrial process. The wood fuel may be chips, pellets or logs, or waste wood, sawdust or
offcuts. In some installations the wood fuel may be supplemented by, or be a supplement to,
other non-renewable fuels such as coal. These cases are referred to as ‘co-firing’, and the
renewable heat capacity and renewable heat output of installations when co-firing occurs are
estimated to be a proportion of the total capacity and heat, based on the mix of different
renewable and non-renewable fuels used.
Renewable Heat in Scotland, 2015 Page 47
Biomass (wood) combined heat and power (CHP)
Biomass is burnt in order to generate electricity. Heat is produced as a by-product, which
can then be used for process heat, or supplying space or water heating.
Solar thermal panels
Panels which produce hot water using the sun’s heat. The systems can be designed so that
the hot water produced also contributes to space heating demand (‘solar space heating’) but
it is more commonly used to provide only hot water.
Heat pumps: water source, air source and ground source
Technologies to extract low-grade heat from the external environment (the ground, air or a
water body) and through a compression system produce heat for space or water heating or
both. Although heat pumps rely on electricity to operate, their high co-efficient of
performance (COP) means they extract more heat energy from the environment than they
use in electricity. ‘Exhaust air heat pumps’ (which, in addition to extracting heat from the
external air, also draw warmth from warm stale air leaving a building) have been included
within the category air source heat pumps. However, units which are purely exhaust air heat
recovery, without also extracting heat from the air outside, have not. Cooling provided by
heat pumps has not been included in the database.
Energy from waste (EfW)
Heat energy produced from the treatment of organic biodegradable waste other than wood.
This category includes the following technologies:
- Anaerobic digestion (AD):
Organic matter is broken down in the absence of oxygen to produce methane gas. The
methane is then burnt to produce heat, or burnt in a combined heat and power unit to
generate both heat and electricity. In some cases it can be upgraded to biomethane gas
and injected into a gas grid. In some applications, the heat produced is used solely to
maintain the anaerobic digestion process, which requires some heat input. Useful renewable
heat has been classed as heat produced (and used) beyond that fed back into the anaerobic
digestion process to maintain it, which is sometimes called the parasitic heat load.
- Landfill gas capture:
Landfill gas (methane from rotting organic matter in landfill) is captured and burnt to produce
heat or used in a combined heat and power unit.
- Biomass primary combustion:
This category covers installations where materials other than wood, such as municipal solid
waste and animal carcasses, are burnt directly to produce heat. For installations burning

Renewable Heat in Scotland, 2015 Page 48
municipal solid waste, a proportion of the heat capacity and output is estimated to be
renewable, based on the biodegradable proportion of the waste burnt.
- Advanced thermal treatment (ATT), using pyrolysis or gasification or both
Treatment of waste at high temperatures either in the complete absence of oxygen
(pyrolysis) or a limited amount of oxygen (gasification) to produce gases which can be burnt
to generate heat or heat and electricity.
- Biomethane injection to the gas grid (BtG)
This is the same technology as anaerobic digestion up to the point of having a biomethane
(biogas) product. The resultant biomethane is not combusted on site but is ‘upgraded’51 to
allow it to be injected into the gas grid, whilst ensuring it has similar properties to fossil
natural gas. This technology will therefore allow the biomethane to displace fossil natural gas
in the grid.
Deep geothermal
Heat from deep underground is extracted by pumping water into a deep well, allowing it to
heat up using the heat of the rocks, then abstracting the water via another well.
Had examples been found, fuel cell biomass could also have been included:
Fuel cell biomass
Fuel cells running on biomass could be used to produce useful heat.
Technologies which are not included in the database, as they do not produce renewable
heat, are:
Non-biomass combined heat and power (CHP)
Combined heat and power units running on gas (or other fossil fuels) to produce electricity
and heat. Because the heat from such units comes from fossil fuel sources, it has not been
counted towards ‘renewable heat’ targets in this report.
Exhaust air heat recovery (EAHR)
Systems for recovering the heat from warm stale air leaving a building, which is used to
warm incoming air. This can help to reduce space heating requirements. However, because
the heat being recovered for the building will normally have come from fossil fuels in the first
instance, rather than being drawn from a renewable source, these systems have not been
included as providing renewable heat.
51 ‘Upgrading’ consists of: removing carbon dioxide and other impurities and adding propane to ensure similar energy content to natural gas already in the gas network. The gas is then odorised and compressed before being injected into the gas grid.

Renewable Heat in Scotland, 2015 Page 49
Energy from waste: installations where the only fuel is hospital waste
DUKES52 considers hospital waste as non-biodegradable, so installations burning only
hospital waste are not counted as producing renewable heat. However, installations which
burn other wastes that are considered biodegradable such as municipal waste, in addition to
hospital waste, have been included in the database.
The following renewable heat technologies are not included in the renewable heat database:
Passive renewable heating
This is where building design is used to ensure buildings benefit from features such as solar
gain through large areas of south-facing glazing. Such design features can help a building
meet its heat demand; however, they have not been included in this report or database, as
the heat resource provided is very hard to assess.
Wind or hydro to heat (electricity) Wind to heat installations (where wind turbines produce electricity which is used to directly
charge electric storage heaters for space heating) can be an important source of low-carbon
heating in remote rural locations in Scotland. However, the electricity produced by these
systems is already counted towards renewable electricity targets for Scotland, so estimates
of heat from these systems have not been included in the renewable heat figures reported
here.
52
Renewable Energy Statistics: Data Sources and Methodologies, Department for Business, Energy and Industrial Strategy: https://www.gov.uk/government/chttps://www.gov.uk/government/collections/renewables-statisticsollections/renewables-statistics
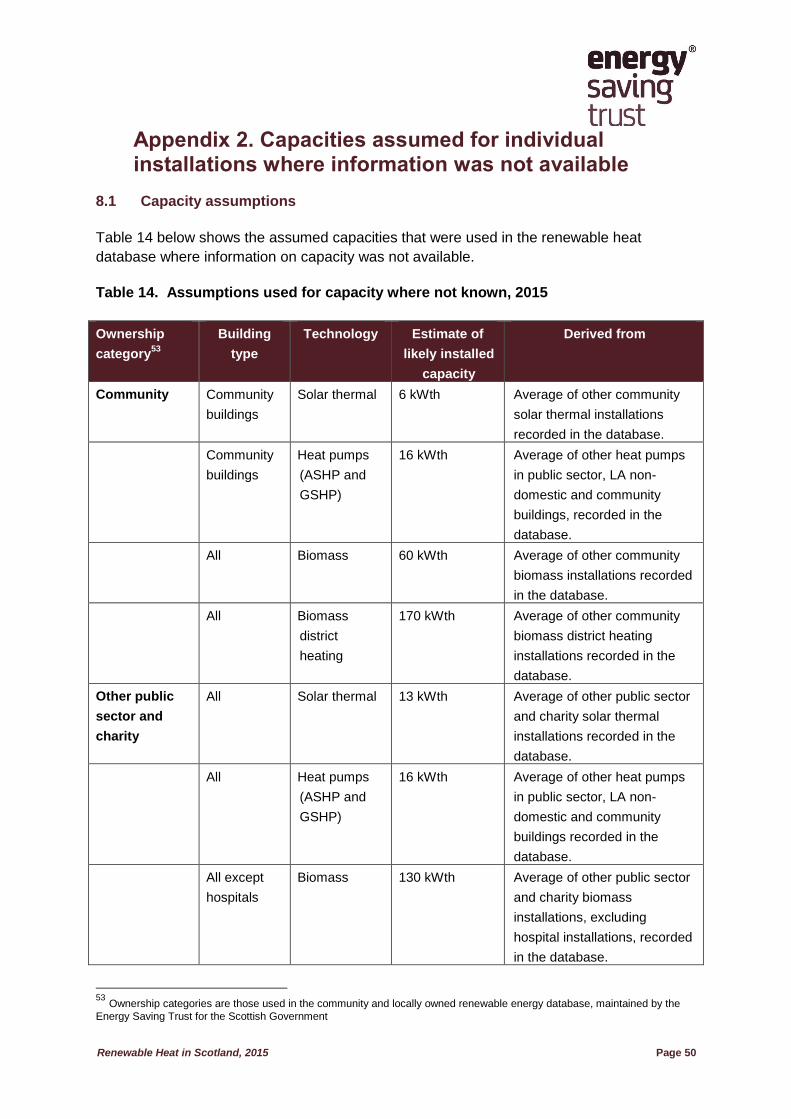
Renewable Heat in Scotland, 2015 Page 50
Appendix 2. Capacities assumed for individual installations where information was not available
8.1 Capacity assumptions
Table 14 below shows the assumed capacities that were used in the renewable heat
database where information on capacity was not available.
Table 14. Assumptions used for capacity where not known, 2015
Ownership
category53
Building
type
Technology Estimate of
likely installed
capacity
Derived from
Community Community
buildings
Solar thermal 6 kWth Average of other community
solar thermal installations
recorded in the database.
Community
buildings
Heat pumps
(ASHP and
GSHP)
16 kWth Average of other heat pumps
in public sector, LA non-
domestic and community
buildings, recorded in the
database.
All Biomass 60 kWth Average of other community
biomass installations recorded
in the database.
All Biomass
district
heating
170 kWth Average of other community
biomass district heating
installations recorded in the
database.
Other public
sector and
charity
All Solar thermal 13 kWth Average of other public sector
and charity solar thermal
installations recorded in the
database.
All Heat pumps
(ASHP and
GSHP)
16 kWth Average of other heat pumps
in public sector, LA non-
domestic and community
buildings recorded in the
database.
All except
hospitals
Biomass 130 kWth Average of other public sector
and charity biomass
installations, excluding
hospital installations, recorded
in the database.
53
Ownership categories are those used in the community and locally owned renewable energy database, maintained by the
Energy Saving Trust for the Scottish Government
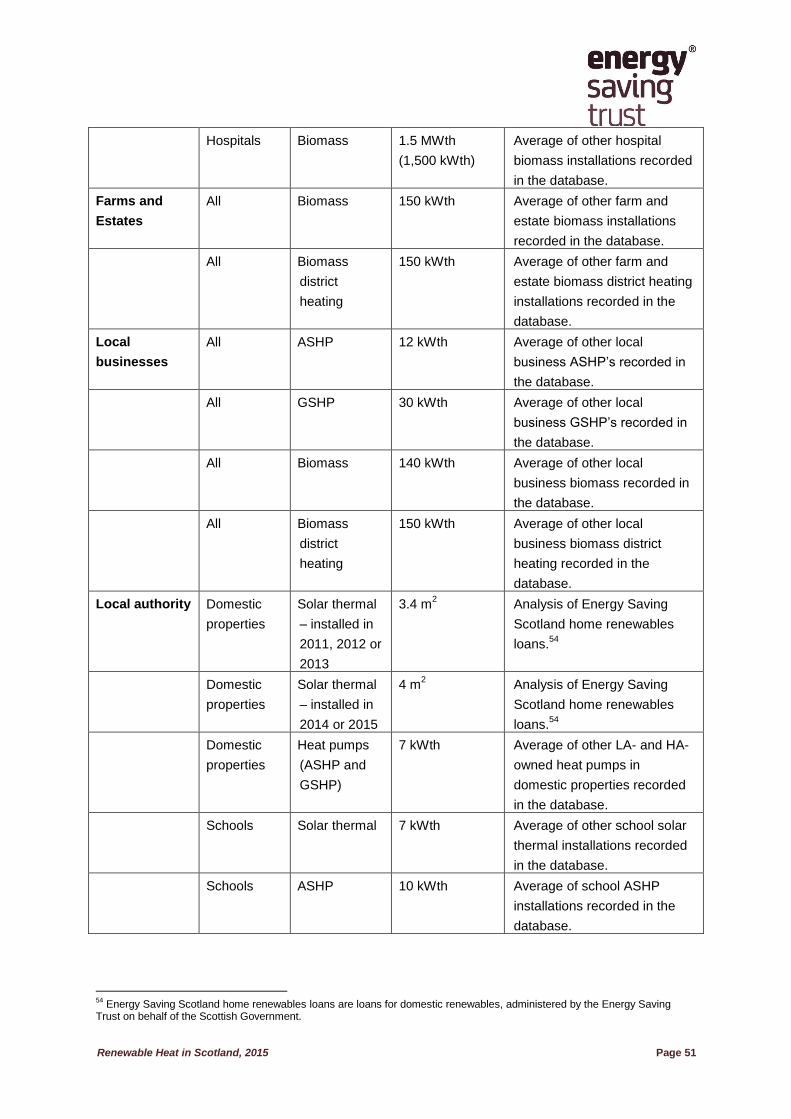
Renewable Heat in Scotland, 2015 Page 51
Hospitals Biomass 1.5 MWth
(1,500 kWth)
Average of other hospital
biomass installations recorded
in the database.
Farms and
Estates
All Biomass 150 kWth Average of other farm and
estate biomass installations
recorded in the database.
All Biomass
district
heating
150 kWth Average of other farm and
estate biomass district heating
installations recorded in the
database.
Local
businesses
All ASHP 12 kWth Average of other local
business ASHP’s recorded in
the database.
All GSHP 30 kWth Average of other local
business GSHP’s recorded in
the database.
All Biomass 140 kWth Average of other local
business biomass recorded in
the database.
All Biomass
district
heating
150 kWth Average of other local
business biomass district
heating recorded in the
database.
Local authority Domestic
properties
Solar thermal
– installed in
2011, 2012 or
2013
3.4 m2 Analysis of Energy Saving
Scotland home renewables
loans.54
Domestic
properties
Solar thermal
– installed in
2014 or 2015
4 m2 Analysis of Energy Saving
Scotland home renewables
loans.54
Domestic
properties
Heat pumps
(ASHP and
GSHP)
7 kWth Average of other LA- and HA-
owned heat pumps in
domestic properties recorded
in the database.
Schools Solar thermal 7 kWth Average of other school solar
thermal installations recorded
in the database.
Schools ASHP 10 kWth Average of school ASHP
installations recorded in the
database.
54
Energy Saving Scotland home renewables loans are loans for domestic renewables, administered by the Energy Saving Trust on behalf of the Scottish Government.
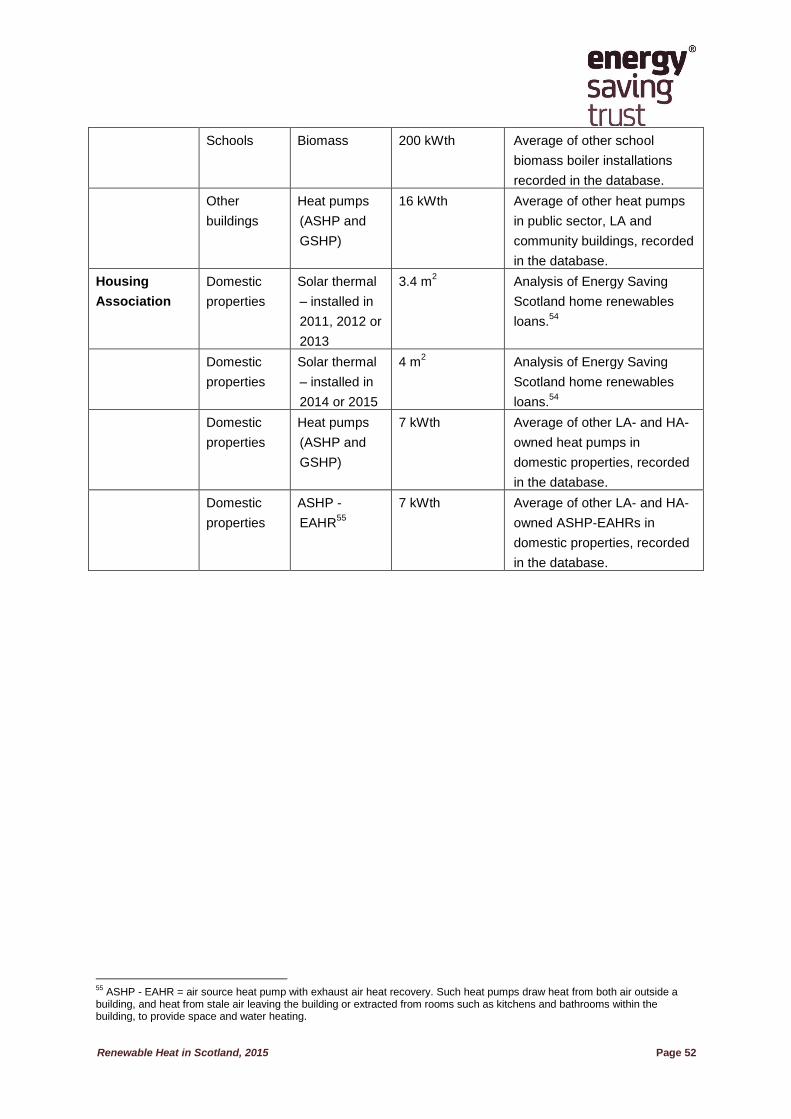
Renewable Heat in Scotland, 2015 Page 52
Schools Biomass 200 kWth Average of other school
biomass boiler installations
recorded in the database.
Other
buildings
Heat pumps
(ASHP and
GSHP)
16 kWth Average of other heat pumps
in public sector, LA and
community buildings, recorded
in the database.
Housing
Association
Domestic
properties
Solar thermal
– installed in
2011, 2012 or
2013
3.4 m2 Analysis of Energy Saving
Scotland home renewables
loans.54
Domestic
properties
Solar thermal
– installed in
2014 or 2015
4 m2 Analysis of Energy Saving
Scotland home renewables
loans.54
Domestic
properties
Heat pumps
(ASHP and
GSHP)
7 kWth Average of other LA- and HA-
owned heat pumps in
domestic properties, recorded
in the database.
Domestic
properties
ASHP -
EAHR55
7 kWth Average of other LA- and HA-
owned ASHP-EAHRs in
domestic properties, recorded
in the database.
55
ASHP - EAHR = air source heat pump with exhaust air heat recovery. Such heat pumps draw heat from both air outside a building, and heat from stale air leaving the building or extracted from rooms such as kitchens and bathrooms within the building, to provide space and water heating.
Renewable Heat in Scotland, 2015 Page 53
Appendix 3. Merging the renewable heat database with the non-domestic RHI database
9.1 Background
The non-domestic Renewable Heat Incentive (RHI) is a renewable heat incentive scheme
that opened to applicants in November 2011 (with scope for legacy applicants to apply for
accreditation). The non-domestic scheme is designed to incentivise uptake of renewable
heat technologies in mainly non-domestic applications but does include district heating for
residential schemes56. The RHI is administered by Ofgem on behalf of BEIS.
No site-level detail on the installations accredited (or awaiting accreditation) under the
scheme has been shared with the Scottish Government or the Energy Saving Trust to date.
Some of the systems accredited under the RHI will already be known about by the Energy
Saving Trust from other data sources such as the FCS woodfuel surveys. However, it is
likely that these data sources only capture a proportion of the uptake of renewable heat
technologies, particularly in the small to medium technology size bracket (>45 kW and <1
MW). A substantial proportion of the micro (45 kW or less) installs in Scotland will be
captured by the Microgeneration Installations Database (MID) data extract provided by
Gemserv, and the larger installs are relatively easy to track through the REPD, publications
of funding allocation to renewable heating projects, press releases and relevant organisation
contacts. Small and medium sized projects are harder to track especially now as the REPD
no longer monitors projects with a capacity of less than 1 MW. It has therefore become
increasingly important to reconcile the renewable heat database and the non-domestic RHI
database, to ensure the accuracy of the Scottish Government’s target monitoring.
At the time of collating data for this report, BEIS were unable to share full site-level
information on non-domestic RHI installations (due to legal reasons) but did undertake some
analysis on the two datasets in order to estimate:
The capacity of renewable systems accredited under the RHI where no match exists
in the renewable heat database.
The eligible heat output of systems accredited under the RHI where no match exists
in the renewable heat database.
9.2 Methodology
The analysis undertaken by BEIS was done using an extract of the renewable heat database
as of 27 May 2016.57 For all sites with a capacity of 0.5 MW (500 kW) or higher, the data
56
Community and district heating include systems that link more than one property to the heat network. These may still be domestic applications but they are not eligible for support under the Domestic RHI scheme. 57
Any personal data was removed from the EST extract in compliance with the Data Protection Act 2008; any data provided to EST as otherwise confidential was also removed from the database before sharing with DECC.
Renewable Heat in Scotland, 2015 Page 54
was manually cross-referenced to ensure accurate matching of sites with the largest
capacity. The remaining data was then matched, with a positive result (match between both
datasets) requiring an exact match between site names, or two of any of the other variables
(postcode, address or organisation name).
For all systems on the RHI database where no match was found in the renewable heat
database, the capacity and ‘heat paid for’ were aggregated and provided by for the calendar
year 2015.
The variables provided by BEIS were:
Operational capacity by technology and tariff band.
‘Heat paid for’ under the RHI scheme, by technology and tariff band. It should be
noted that this will not be an exact match for ‘heat produced’ but is the closest proxy
available. As the RHI only pays for heat that is used for an eligible purpose58, it can
be directly translated into ‘useful renewable heat output’ for the purposes of this
report.
Where the aggregated figures were based on 5 or fewer sites the respective information has
been withheld to ensure information about particular sites was not disclosed.
9.3 Uncertainties and duplication
In order to ensure no duplication with the MID data provided by Gemserv, any micro (≤45
kW) systems in the RHI dataset were removed before the capacity and heat totals were
aggregated.
As not all data were manually matched, the aggregates provided by BEIS may still include
output and capacity for sites that are already listed in the renewable heat database. This will
be because either a match wasn’t found or because the record was not sent to BEIS (due to
being confidential or personal data). To avoid double counting, the records were assessed
against the risk of double-counting by using the descriptors given in Table 15 below.
58
Please see the RHI guidance for further details: https://www.ofgem.gov.uk/environmental-programmes/non-domestic-renewable-heat-incentive-rhi/eligibility-non-domestic-rhi

Renewable Heat in Scotland, 2015 Page 55
Table 15. Risk indicators assigned to renewable heat database records
Risk Descriptor
Very
low
The record is for a microgeneration system (capacity ≤45 kW). All
microgeneration systems were removed from the RHI data after merging to avoid
double counting.
Or
The record has a capacity of 0.5 MW or more. These records were all checked
manually for a match.
Or
The site is accredited under the Renewables Obligation (RO) scheme and claims
the Combined Heat and Power uplift under that scheme59
. These sites cannot
claim support under the RHI as well.
Low The record was sent to BEIS for merging with the renewable heat database and
has good location information in the renewable heat database.
Or
The renewable heat database records that the system was commissioned before
November 2009, which would mean that the site is too old to claim RHI support.
The technology is unlikely to be supported by the RHI, as there are very few
technologies in the RHI database (i.e. for CHP systems).
The system is not yet operational
Medium The record was sent to BEIS but has no, or poor, location information in the
renewable heat database.
Or
The record was not sent to BEIS, is not a micro technology and was
commissioned between 2009 late 2011. These systems may be double counted
as they will not have been included in the analysis carried out by BEIS. They are
not, however ‘High’ risk as they may not have taken advantage of applying to the
RHI as a legacy applicant.
High The record was not sent to BEIS, is not a micro technology and commissioned
late 2011 and is an RHI-eligible technology. These systems will not have been
included in the BEIS analysis but are more likely to have applied for RHI support
following the launch of the scheme.
The risk of each record being double-counted was labelled as ‘High’, ‘Medium’, ‘Low’ or’
Very low’. The ‘High’ and ‘Medium’ records have been excluded from the overall figures.60
The aggregated RHI figures were then added to the relevant renewable heat database
summary figures to provide total capacity and heat figures for Scotland.
59
For details please see https://www.ofgem.gov.uk/sites/default/files/docs/2015/02/guidance_volume_one_-_july_2015_-.pdf 60
These sites are still recorded in the renewable heat database for reference.
Renewable Heat in Scotland, 2015 Page 56
Appendix 4. Measurement of heat demand in Scotland
This Appendix sets out:
How Scottish Government derived the original 11% renewable heat target.
How until the 2012 report (monitoring progress to 2011) the Scottish Government monitored progress on renewable heat as a percentage of projected 2020 heat demand.
An explanation of how improved data and an updated methodology is being used to monitor renewable heat as a percentage of annual non-electrical heat demand in Scotland.
10.1 Background
Heat has been estimated to account for more than half of Scotland’s total energy use.61 Switching from fossil fuel to renewable heat sources has the potential to reduce greenhouse gas emissions, and make a significant contribution to Scotland’s overall renewable energy target. The 2009 Renewable Heat Action Plan62 set a target of delivering 11% of Scotland’s projected 2020 (non-electrical)63 heat demand from renewable sources.
In 2006, the Scottish Energy Study64 described Scotland's current energy supply, energy consumption and energy-related CO2 emissions during 2002 and was the first major study of energy supply and demand to be conducted in Scotland for more than a decade. At that time, the discrete study provided the most robust data source available for estimates of energy consumption in Scotland. However, it was not feasible to monitor heat demand on an annual basis. This study produced estimates for 2002 and subsequently a figure for 2020 heat demand was derived from these estimates. Therefore, to date, the heat target has been monitored using the latest annual renewable heat output estimate against this forecast 2020 figure for heat demand.
10.2 Derivation of the 11% heat target
The target figure of 11% for renewable heat by 2020 was derived using the estimated contributions that renewable electricity and renewable transport would make to the overall 2020 renewable energy target. Based on the requirements of the other sectors it was estimated that renewable heat must contribute 6,420 GWh of output in order for Scotland to meet its 2020 Renewable Energy Target. Total heat energy demand in Scotland in 2020 was estimated to be 60,089 GWh using data from the Scottish Energy Study. Therefore, the target was set at 11% (See Table 16).
61
Energy in Scotland 2016, Scottish Government, http://www.gov.scot/Topics/Statistics/Browse/Business/Energy/EIS2016 62
Renewable Heat Action Plan (2009). http://www.scotland.gov.uk/Publications/2009/11/04154534/0 63
To avoid double counting we measure the non-electrical heat component against the heat target, acknowledging that the demand for heating delivered by electricity will be included as part of the renewable electricity target. The Scottish Household Condition Survey (2013) estimates that around 14% of households in Scotland use electricity as their primary heating fuel. 64
Scottish Energy Study, Vol 1 (2006). http://www.scotland.gov.uk/Publications/2006/01/19092748/0
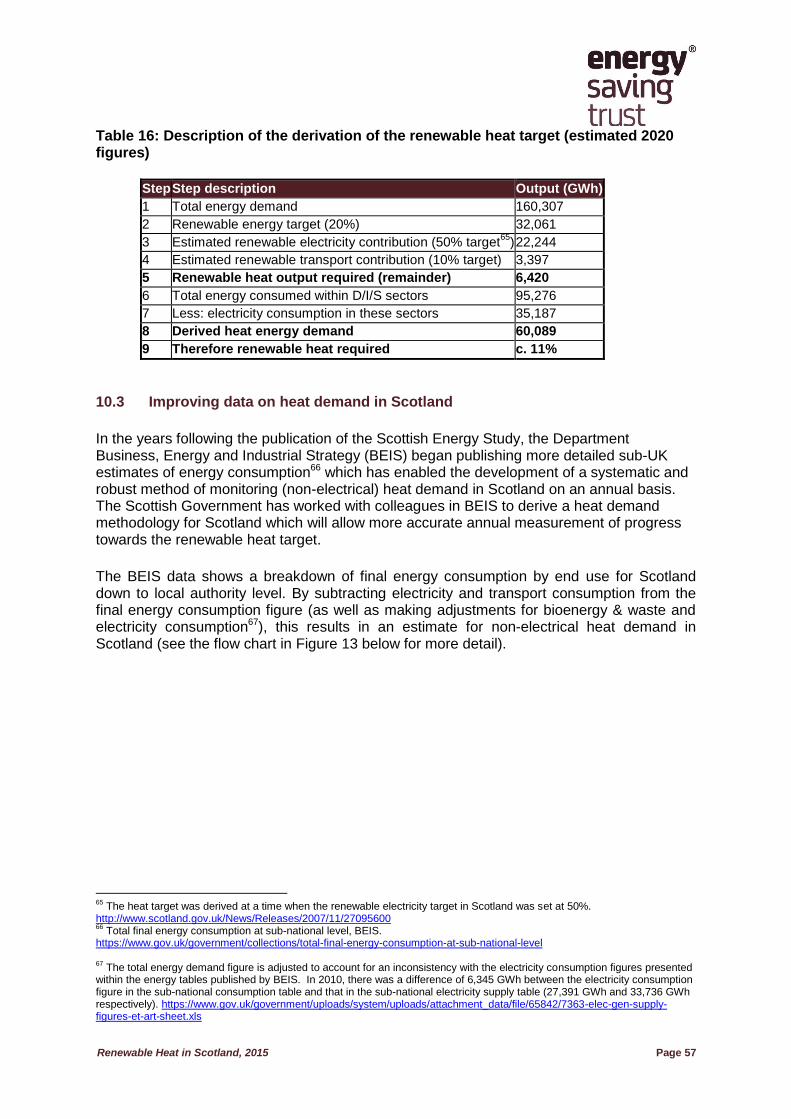
Renewable Heat in Scotland, 2015 Page 57
Table 16: Description of the derivation of the renewable heat target (estimated 2020 figures)
Step Step description Output (GWh)
1 Total energy demand 160,307
2 Renewable energy target (20%) 32,061
3 Estimated renewable electricity contribution (50% target65
) 22,244
4 Estimated renewable transport contribution (10% target) 3,397
5 Renewable heat output required (remainder) 6,420
6 Total energy consumed within D/I/S sectors 95,276
7 Less: electricity consumption in these sectors 35,187
8 Derived heat energy demand 60,089
9 Therefore renewable heat required c. 11%
10.3 Improving data on heat demand in Scotland
In the years following the publication of the Scottish Energy Study, the Department Business, Energy and Industrial Strategy (BEIS) began publishing more detailed sub-UK estimates of energy consumption66 which has enabled the development of a systematic and robust method of monitoring (non-electrical) heat demand in Scotland on an annual basis. The Scottish Government has worked with colleagues in BEIS to derive a heat demand methodology for Scotland which will allow more accurate annual measurement of progress towards the renewable heat target.
The BEIS data shows a breakdown of final energy consumption by end use for Scotland down to local authority level. By subtracting electricity and transport consumption from the final energy consumption figure (as well as making adjustments for bioenergy & waste and electricity consumption67), this results in an estimate for non-electrical heat demand in Scotland (see the flow chart in Figure 13 below for more detail).
65
The heat target was derived at a time when the renewable electricity target in Scotland was set at 50%. http://www.scotland.gov.uk/News/Releases/2007/11/27095600 66
Total final energy consumption at sub-national level, BEIS. https://www.gov.uk/government/collections/total-final-energy-consumption-at-sub-national-level 67
The total energy demand figure is adjusted to account for an inconsistency with the electricity consumption figures presented within the energy tables published by BEIS. In 2010, there was a difference of 6,345 GWh between the electricity consumption figure in the sub-national consumption table and that in the sub-national electricity supply table (27,391 GWh and 33,736 GWh respectively). https://www.gov.uk/government/uploads/system/uploads/attachment_data/file/65842/7363-elec-gen-supply-figures-et-art-sheet.xls
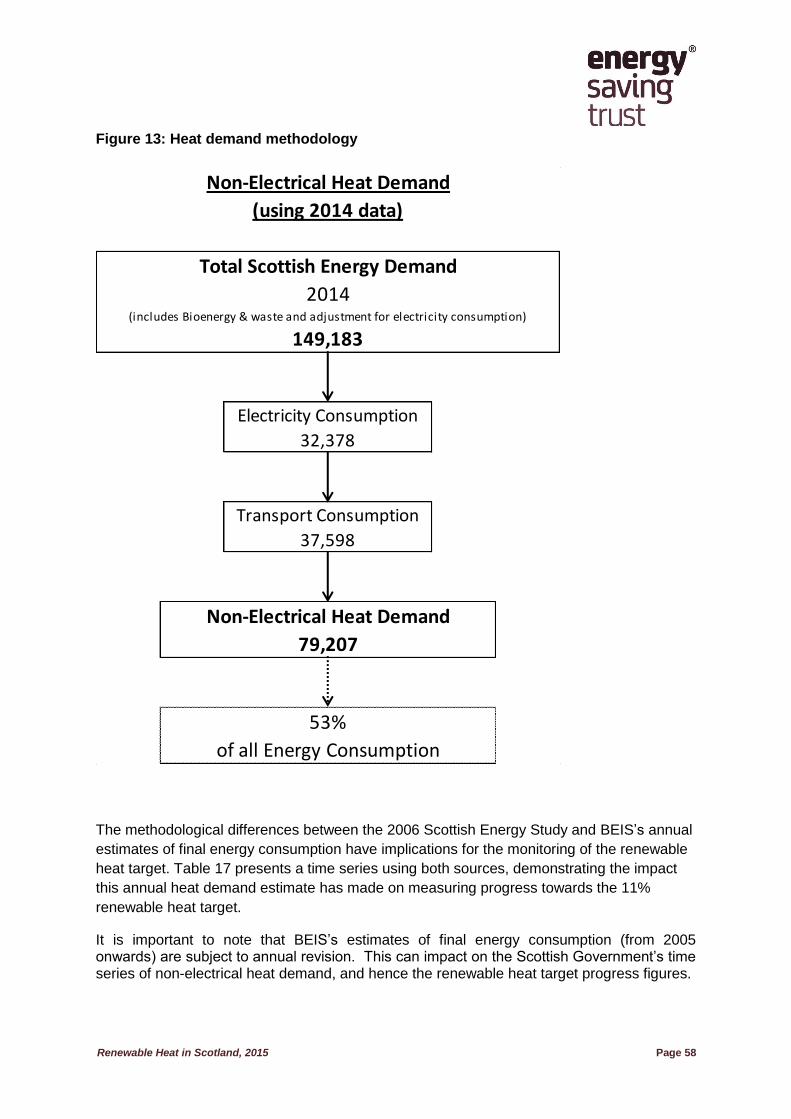
Renewable Heat in Scotland, 2015 Page 58
Figure 13: Heat demand methodology
The methodological differences between the 2006 Scottish Energy Study and BEIS’s annual
estimates of final energy consumption have implications for the monitoring of the renewable
heat target. Table 17 presents a time series using both sources, demonstrating the impact
this annual heat demand estimate has made on measuring progress towards the 11%
renewable heat target.
It is important to note that BEIS’s estimates of final energy consumption (from 2005 onwards) are subject to annual revision. This can impact on the Scottish Government’s time series of non-electrical heat demand, and hence the renewable heat target progress figures.
Non-Electrical Heat Demand
(using 2014 data)
Total Scottish Energy Demand
2014(includes Bioenergy & waste and adjustment for electricity consumption)
149,183
Electricity Consumption
32,378
Transport Consumption
37,598
Non-Electrical Heat Demand
79,207
53%
of all Energy Consumption
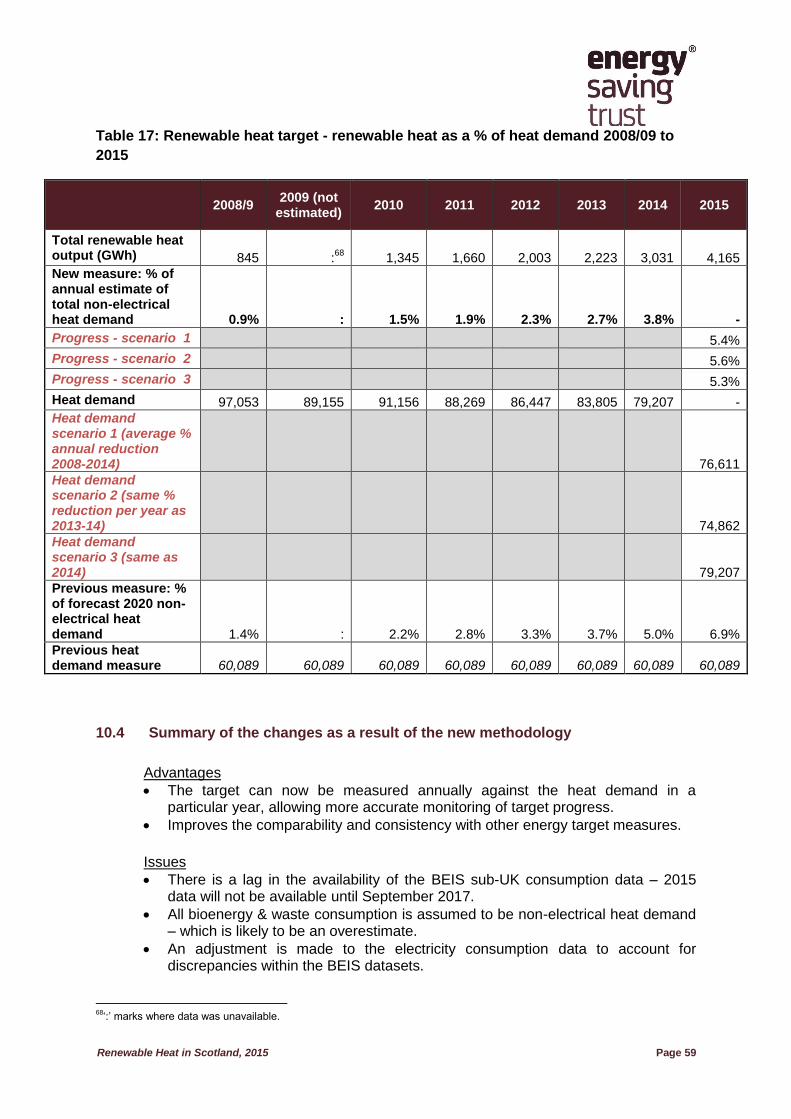
Renewable Heat in Scotland, 2015 Page 59
Table 17: Renewable heat target - renewable heat as a % of heat demand 2008/09 to
2015
2008/9
2009 (not estimated)
2010 2011 2012 2013 2014 2015
Total renewable heat output (GWh) 845 :
68 1,345 1,660 2,003 2,223 3,031
4,165
New measure: % of annual estimate of total non-electrical heat demand 0.9% : 1.5% 1.9% 2.3% 2.7% 3.8% -
Progress - scenario 1 5.4%
Progress - scenario 2 5.6%
Progress - scenario 3 5.3%
Heat demand 97,053 89,155 91,156 88,269 86,447 83,805 79,207 -
Heat demand scenario 1 (average % annual reduction 2008-2014)
76,611
Heat demand scenario 2 (same % reduction per year as 2013-14)
74,862
Heat demand scenario 3 (same as 2014)
79,207
Previous measure: % of forecast 2020 non-electrical heat demand 1.4% : 2.2% 2.8% 3.3% 3.7% 5.0% 6.9%
Previous heat demand measure 60,089 60,089 60,089 60,089 60,089 60,089 60,089 60,089
10.4 Summary of the changes as a result of the new methodology
Advantages
The target can now be measured annually against the heat demand in a particular year, allowing more accurate monitoring of target progress.
Improves the comparability and consistency with other energy target measures.
Issues
There is a lag in the availability of the BEIS sub-UK consumption data – 2015 data will not be available until September 2017.
All bioenergy & waste consumption is assumed to be non-electrical heat demand – which is likely to be an overestimate.
An adjustment is made to the electricity consumption data to account for discrepancies within the BEIS datasets.
68
‘:’ marks where data was unavailable.

Renewable Heat in Scotland, 2015 Page 60
To ensure transparency the Scottish Government has published both measures in parallel, for a transitional period, as the evidence base regarding heat use in Scotland is continuously being improved.
For any queries or feedback on the new measure, or on the measurement of heat demand in
Scotland in general, please contact [email protected]


![Energy Saving in Public Transport Using Renewable Energy · 2017. 10. 5. · environment [2]. Within this economically managed part of the energy sector, renewable energy sources](https://img.pdfslide.us/doc/110x75/60caf1725f64f429805f972e/energy-saving-in-public-transport-using-renewable-energy-2017-10-5-environment.jpg)