Embed Size (px)
Citation preview

Rangan Banerjee
Forbes Marshall Chair Professor
Department of Energy Science and Engineering
IIT Bombay
Lecture to NTPC Senior Management, Lonavla, 11 June 2016
Renewable Energy Technology for the
Power sector: Status and Future

What is Renewable Energy?
I) Energy that is available naturallyII) Energy that does not result in carbon dioxide
emissionsIII) Energy that has no losses of conversionIV) All of the aboveV) None of the above
2

Which of the following is true?
I) Coal and oil are sources of renewable energy
II) Hydrogen energy is renewableIII) Fission based nuclear energy is renewableIV) More than one of the above optionsV) None of the above
Give reasons
3

4
Are our electricity supply systems sustainable?

Global Trends – Unbounded Growth?
GEA Ch 3 5

What is sustainable Development?
6
Development that meets the needs of the present without compromising the ability of future generations to meet their own needs.Brundtlant Report WCED 1987Development without cheating ourchildren

Rockstrom et al, Nature 2009 7

Long term global temperature record
Rockstrom et al, Nature 2009 8
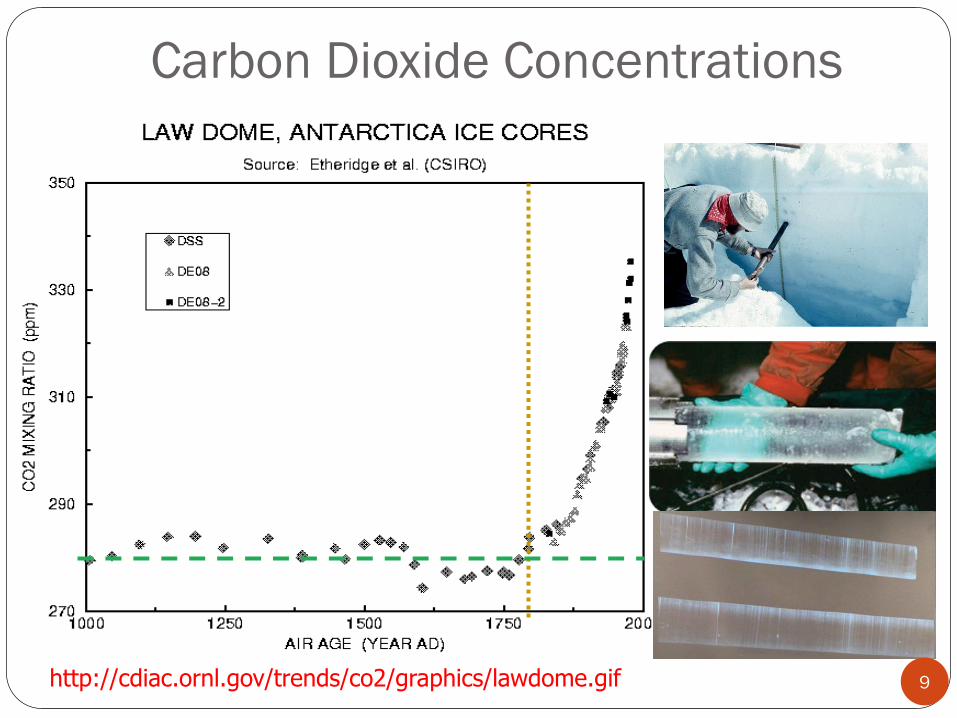
Carbon Dioxide Concentrations
http://cdiac.ornl.gov/trends/co2/graphics/lawdome.gif 9

Carbon Dioxide Concentrations
http://blog.ucsusa.org/wp-content/uploads/2014/03/mlo_full_record.png10

www.ipcc.ch11

Carbon Dioxide Emissions
Kaya identity: Total CO2 Emissions
= (CO2/E)(E/GDP)(GDP/Pop)Pop
CO2/E – Carbon Intensity
E/GDP- Energy Intensity of Economy
Mitigation – increase sinks, reduce sources- aforestation, fuel mix,energy efficiency, renewables,nuclear, carbon sequestration
Adaptation
12

Source: IPCC, 2011 13

Energy Consumption and Air Pollution
SO2
NOx
CO
SPM
CO2
CFC
Modification of Atmospheric
properties/processes
Photochemical Smog
Precipitation Acidity
Visibility
Corrosion Potential
Radiation Balance Alteration
Ultraviolet energy absorption
14

Source : Energy After Rio: UNDP Publication 15

Environmental Impacts
Adverse Health Impacts- Local
Local perturbations to Global Disruptions as human energy use
increased
Human Disruption Index (DI) = Ratio of Human generated flow of
a given pollutant to the natural or baseline flow
16
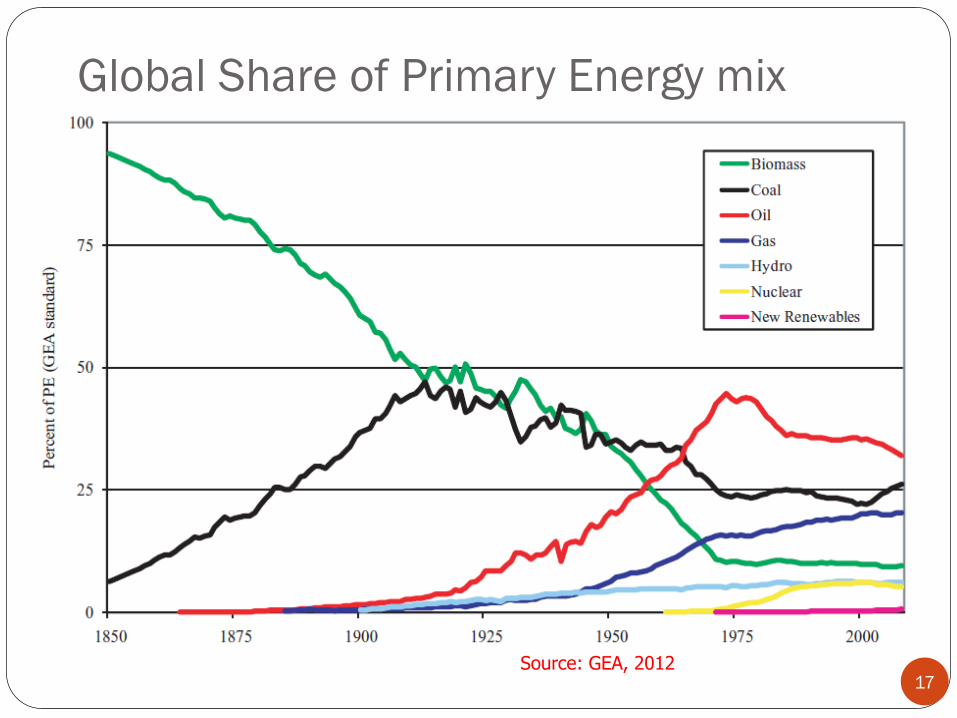
Global Share of Primary Energy mix
Source: GEA, 201217

Estimated Renewable Energy Share of Global
Electricity Production, End–2015
18Source: Renewables, Global Status Report (GSR) 2016

Renewable Power Capacities* in World, EU-28, BRICS and
Top Seven Countries, End-2015
19
*Not including HydropowerThe five BRICS countries are Brazil, the Russian Federation, India, China and South Africa
Source: Renewables, Global Status Report (GSR) 2016

Investment in Power Capacity – Renewable, Fossil Fuel and
Nuclear, 2008-2015, $BN
20Source: Bloomberg New Energy Finance, 2016

21
# What will be the future supply mix for the Electricity sector?
How much can renewables supply?

History Of Electric Power Generation
100 kW DC
Power
Systems
Edison
1880
1882
Darjeeling Power
Station 13 kW
Hydro power
station
1896
1948
2015
1914
19811
900
1931
1965
2000
1895
Emambagh
Power Station –
CESC – Thermal
power station
1,362
MW
19471899
1964-69
Tarapur –
1st Nuclear
power plant
(2x160MW
=320MW)
Westinghouse,
Tesla-AC
power plant
TATA
Power
4000 MW
Power
plant,
Gujarat
2013
Damodar
Valley
Corporation &
Electricity
Supply Act
formed by
Govt. of India
Total
Installed
capacity-
1713MW
(15kWh/
capita)
1950
JNNSM
2010
Rajastan –
Atomic Power
Plant(300MW
+4x220MW)
Kaiga
Generating
Station-
(4x220MW
)
Kudankulam
-1000 MW
2014
22

Historical Household Electrification
Rates
GEA, Chapter 19 23

India Trends
24
1985 2010 CAGR (%)
Population (million) 765.1 1150 1.6
GDP ( PPP Billion 2005 US $ ) 792 3763 6.4
Energy use (EJ) 10.8 29.0 3.6
Electricity use (Billion units) 157 811 6.8
Oil imports (million tonnes) 4 189 16.7
Share of energy imports 8% ~30% -
Installed power generation capacity 46,769 159,650 5.0
% of households un electrified Not known 40 -
Renewable power installed capacity
(excl large hydro) 0 17,297 MW -
Share of Nuclear Generation 2.7% 3.5% -

Installed Capacity - India
303070 MW All India installed capacity
Source: GOI, Ministry of Power, India (powermin.nic.in)
43086 MW Total Renewable installed capacity
2016 (as on 30.04.16)
Coal, 185993Nuclear,
5780
Natural Gas, 24509
Hydro (Res.), 41267
Diesel, 919
Renewables (Res.), 43086
Wind power, 26867
Small Hydro power, 4275
Biomass & Bagasse,
4831
Waste to Power, 115
Solar Power , 6998
Source: MNRE, Govt. of India (www.mnre.gov.in)
25

Renewable Energy Options
Wind
Solar Small
Hydro Biomass
Tidal
Energy
Wave Energy
Ocean Thermal
Energy
Solar Thermal
Solar
Photovoltaic
Geothermal*
26

End-uses
Cooking Transport Electricity HeatingCooling
Cooling Motive
Power
Lighting Heating
27

Solar Power : Potential and Cost
Solar Insolation and area required
= 2500 sq.km
= 625 sq.km Source: World Energy Outlook – 2008, International Energy Agency
28

29
0.000
0.200
0.400
0.600
0.800
1.000
1.200
1970 1975 1980 1985 1990 1995 2000 2005 2010
Ele
ct.
in
t/G
DP
Year
Electricity Intensity of GDP Trend#2

Renewable Share in Power
0
2
4
6
8
10
12
14
2001 2002 2003 2004 2005 2006 2007 2008 2009 2010 2011 2012 2013
Year
Sh
are
of
tota
l %
Renewable Installed Capacity
Renewable Generation
Nuclear generation Nuclear Installed Capacity
30
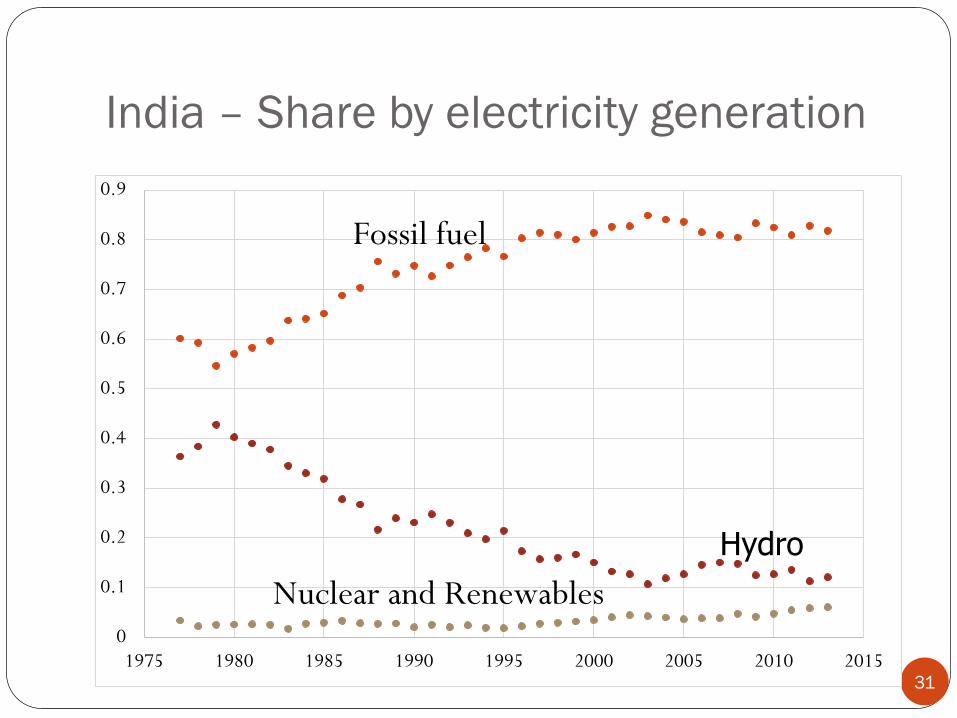
India – Share by electricity generation
31
0
0.1
0.2
0.3
0.4
0.5
0.6
0.7
0.8
0.9
1975 1980 1985 1990 1995 2000 2005 2010 2015
Fossil fuel
Nuclear and Renewables
Hydro

32
Renewable installed capacity and
generation
Source: Ministry of New and Renewable Energy (MNRE), GOI www.mnre.gov.in
Installed
Capacity*
Estimated
Capacity factor
Estimated
Generation
(GWh) (MW)
Wind 26867 14% 32950
Biomass & Bagasse 4831 70% 29624
Small Hydro 4275 40% 14980
Waste to Energy 115 50% 504
Solar Power 6988 20% 12243
Total 43076 25% 90300
*as on 30.04.2016
32

Power Generation – Supply mix
Thermal
Nuclear
Renewables and Hydro
33

Supply Scenarios for 2035 (BAU- Moderate) -
Electricity- High Coal (A)
Supply Scenario (BAU)
Projections for 2035 Coal
Natural
Gas Diesel Nuclear Hydro
Renewab
les Total
% Electricity Supply
Share 66% 12% 2% 3% 11% 6% 100%
Electricity Supply/ year
(in billion kWh) 2524 459 76 115 421 229 3824
Average Load Factor 70% 70% 16% 70% 38% 26%
Installed Capacity (in
GW) 412 75 55 19 126 101 787
34
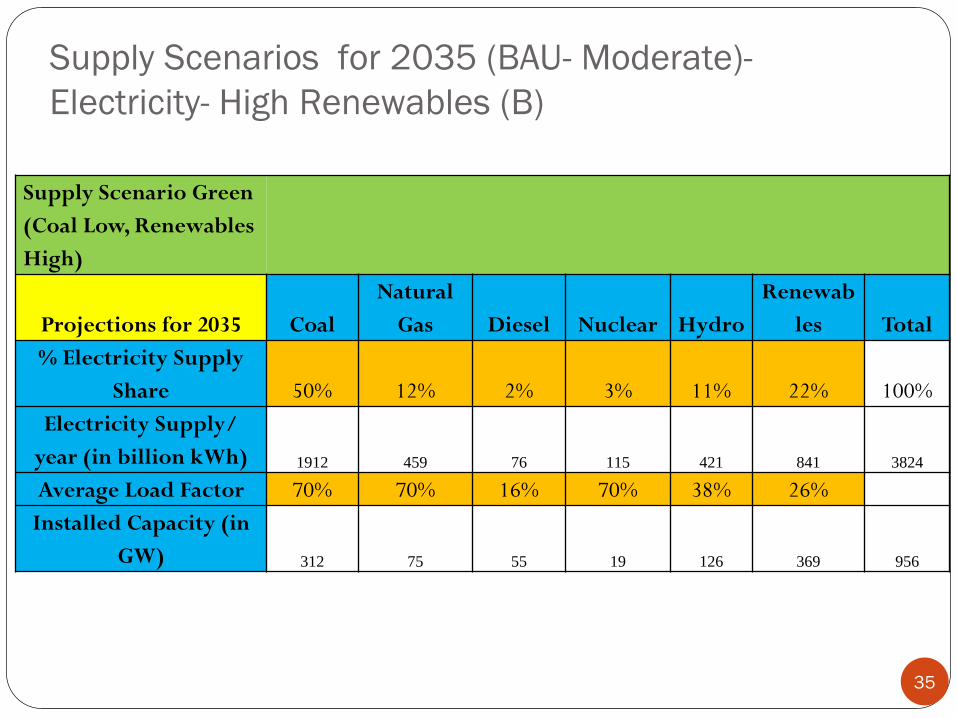
Supply Scenarios for 2035 (BAU- Moderate)-
Electricity- High Renewables (B)
Supply Scenario Green
(Coal Low, Renewables
High)
Projections for 2035 Coal
Natural
Gas Diesel Nuclear Hydro
Renewab
les Total
% Electricity Supply
Share 50% 12% 2% 3% 11% 22% 100%
Electricity Supply/
year (in billion kWh) 1912 459 76 115 421 841 3824
Average Load Factor 70% 70% 16% 70% 38% 26%
Installed Capacity (in
GW) 312 75 55 19 126 369 956
35

Supply Scenarios for 2035 (BAU- Moderate)-
Electricity- High Nuclear (C)
Supply Scenario Green
(Coal Low, Nuclear High,
Renewables Moderately
High )
Projections for 2035 Coal
Natural
Gas Diesel Nuclear Hydro
Renewabl
es Total
% Electricity Supply
Share 40% 12% 2% 13% 11% 22% 100%
Electricity Supply/ year
(in billion kWh) 1530 459 76 497 421 841 3824
Average Load Factor 70% 70% 16% 70% 38% 26%
Installed Capacity (in
GW) 249 75 55 81 126 369 956
36

37
AustraliaSwitzerlandGermany
United States
China
India
Pakistan
Zimbabwe
0.000
0.100
0.200
0.300
0.400
0.500
0.600
0.700
0.800
0.900
1.000
0 5000 10000 15000
Hum
an D
evelo
pm
en
t In
dex (
HD
I)
Annual Electricity consumption/ capita (kWh)
HDI and Electricity consumption (2013)
World
2035India

Wind Power
26900 MW installed
Single machine upto 2.1 MW
Average capacity factor 14%
Capital cost Rs 60 million/MW, Rs5-6/kWh (cost effective if site CF >20%)
India 103000 MW (potential estimated )
Growth rate 30% per yearSatara, Maharashtra
38

Wind farms
39
Largest 1550 MW Onshore Texas
Vestas 8 MW164 m rotor diameter
The world's second full-scale floating wind turbine WindFloat, operating at rated capacity (2 MW) approximately 5 km offshore of Aguçadoura, Portugal

Small Hydro Power
Classification - Capacity
-Micro less than 100 kW
Mini 100 kW - 3 MW Small 3 MW - 15 MW
Micro and Mini - usually isolated,
Small grid connected
Heads as low as 3 m viable
Capital Cost Rs 50-60 millions/MW ,
Rs 3.50-4.50/kWh
Growth rate 7%/year
200 kW Chizami village, Nagaland
Aleo (3MW) Himachal Pradesh40

Geothermal/OTEC/Tidal/Wave
World Cost Estimates
Geothermal COMMERCIAL 8240 MW 4c/kWh
$2000/kW
No Indian experience
50 MW plant J & K planned
Tidal PROTOTYPE 240 MW
FRANCE
LF 20%
No Indian experience (3.6MW planned Sunderbans)
OTEC PROTOTYPE 50 kW
210 kW
NELHA
India 1MW gross plant under construction
Wave Energy
PROTOTYPE < 1MW
Grid Connected
India 150kW plant Thiruvananthpuram
41

Map of India showing the geothermal provinces
42

OTEC plant schematic
43

Mooring Arrangement
44

BIOMASS
THERMOCHEMICAL BIOCHEMICAL
COMBUSTION GASIFICATION PYROLYSIS
RANKINE CYCLE
PRODUCER GAS
ATMOSPHERIC PRESSURISED
FERMENTATIONDIGESTION
BIOGAS ETHANOL
Duel Fuel SIPGEGas Turbines
Biomass Conversion Routes
45

Sihwa Tidal power plant South Korea
46
10 units of 26 MW each
Runner diameter 7.5 mBasin area 56 km2Annual generation 550 GWh250 million US$ in 2005
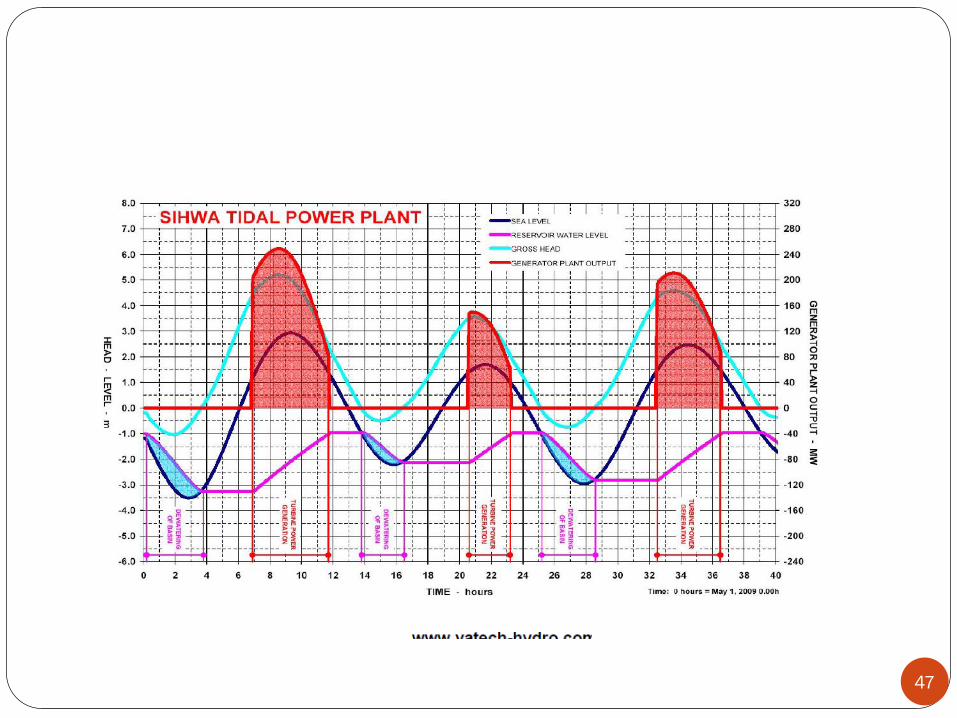
47

Pelamis
48
Wave energy converter- Scotland, Portugalwww.oceanpd.com
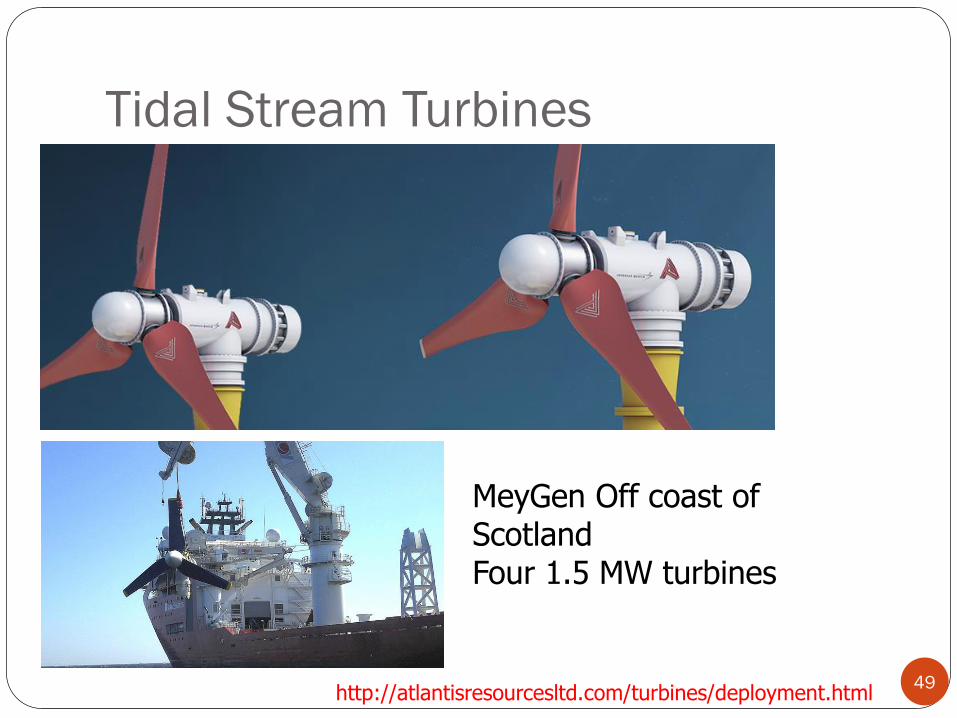
Tidal Stream Turbines
49http://atlantisresourcesltd.com/turbines/deployment.html
MeyGen Off coast of Scotland Four 1.5 MW turbines
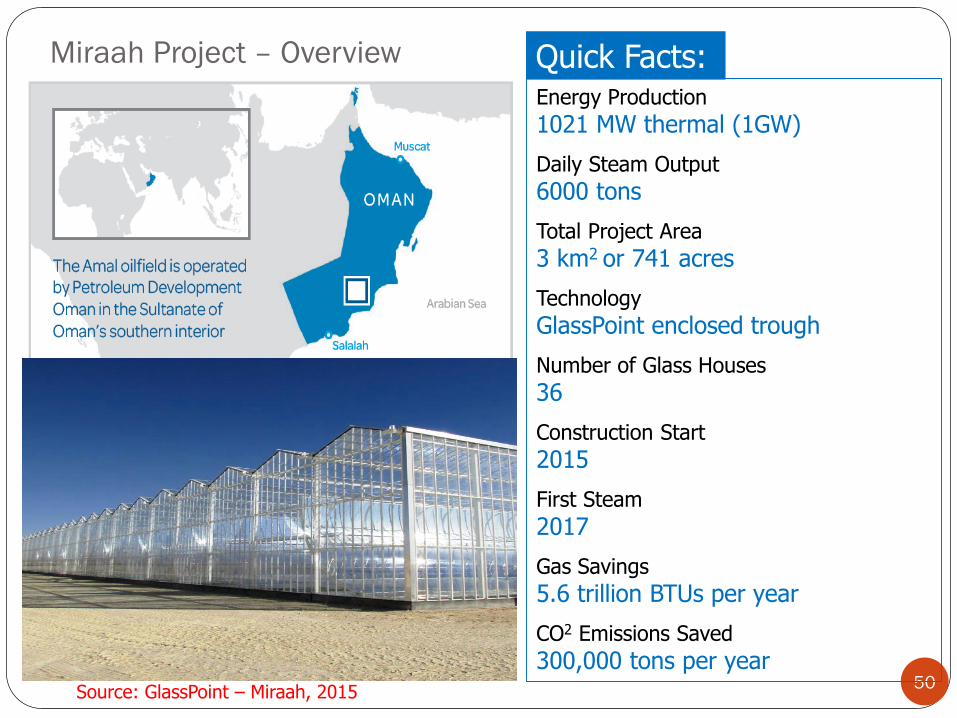
Miraah Project – Overview
50
Energy Production
1021 MW thermal (1GW)
Daily Steam Output
6000 tons
Total Project Area
3 km2 or 741 acres
Technology
GlassPoint enclosed trough
Number of Glass Houses
36
Construction Start
2015
First Steam
2017
Gas Savings
5.6 trillion BTUs per year
CO2 Emissions Saved
300,000 tons per year
Quick Facts:
Source: GlassPoint – Miraah, 2015

51glasspoint.com/miraah
Sealed from Dust and sand
Fully automated operation

Biomass Power
Higher Capacity factors than other renewables
Fuelwood, agricultural residues, animal waste
Atmospheric gasification with dual fuel engine -
1 MW gasifier - largest installation
Combustion – 5-18 MW
Rs 5-6/kWh
Kaganti Power Ltd. Raichur Distt. A.P. 7.5 MW
100 kWe Pfutseromi village, Nagaland
52

Biomass Gasifier Example
Arashi HiTech Biopower,
Coimbatore
1 MW grid connected
100% producer gas engines
Two gasifiers – coconut
shells, modified to include
other biomass
Chilling producer gas with
VARS operated on waste heat
53

Biogas 45-70% CH4 rest CO2
Calorific value 16-25MJ/m3
Digestor- well containing animal waste slurry
Dome - floats on slurry- acts as gas holder
Spent Slurry -sludge- fertiliser
Anaerobic Digestion- bacterial action
Family size plants 2m3/day
Community Size plants 12- 150 m3/day
Rs 12-14000 for a 2m3 unit
Cooking, Electricity, running engine
Pura, Karnataka 54

0.5T/hr
Feed water
Process
Process
2 ata
~
STEAM
TURBINE
2.5 MW
6 ata
BAGASSE
58 T/hr 22 ata
330o C
4.5T/hr 27T/hr
26T/hr
Schematic of typical 2500 tcd Sugar factory
Flashed
Condensate
PRDS
PRDS
MILLING
0.5T/hr
FEED
WATER
BOILER
55

Feed water
Con
dens
er
2 ata
PROCESS
75 TPH, 65
ata, 480O
C
Process
Process
4.5 TPH
~
6 ata
BAGASSE (Alternate fuel)
2 ata
BFP
13 MW
BOILER
1.0 MW
Mill
drives
9.5 MW
Power export
2.5 MW
Captive
load
PROCESS
PROPOSED PLANT CONFIGURATION: OPTION 2
STEAM
TURBINE
CONDENSER
ESS
56

1 MW Solar Plant – IIT Bombay
http://www.indiaprwire.com/pressrelease/education/20140128287038.htm57

Peroskvite Cells
58
Source: Oxford PV

Peroskvite Cells
59
Source: Oxford PV

Building Integrated PV
60
Roofed walkway with HeliaFilm® at the Seletar
Airport Singapore
Entrance canopy of CleanTech Park 2,
Singapore
30 m2
flexible 7%
Organic PV 12%

61

Artificial Photosynthesis
62
Fig. 1 Schematic representation of light-driven water electrolysis approaches.
(A) Fully integrated, wireless, PEC; (B) partially integrated, wired, PEC;
(C) non-integrated, modular, PEC.
Bonke et al Energy Environ. Sci., 2015, 8, 2791

Printed PV
63
VICOSC’s new solar cell printer installed at CSIRO

64
Power Density and Area
http://www.indiaenvironmentportal.org.in/files/file/solar%20energy%20in%20India.pdf
http://www.vaclavsmil.com/wp-content/uploads/docs/smil-article-power-density-primer.pdf

65
Mitavachan and Srinivasan, Current Science, 2012

66
Mitavachan and Srinivasan, 2012

67
Comparison of Supply technologies
GenerationTechnology
SIZERANGE(GW)
COSTCrores/ MW
Rs/kWh
CAPACITY FACTOR
AREA(m2/GWh)
CO2
Equivalent(gC02/kWh)
WATERl/MWh
COAL 0.1-4 5-6 3.5 0.8-0.9 200-400 820 1000
CCGT 0.1-1.5 4-5 3 0.5 -0.8 100 490 500
SOLAR PV 0.001-0.75
5-7 5.5 0.25 385 48 100
SOLARTHERMAL
0.01-0.5 10-15 12 0.25-0.29 300 48 3500
HYDRO 2.4-0.1 5-6 2.5-3.0
0.38-0.5 1374 24 17000
NUCLEAR 9.9-0.44 6.5-8 6-7 0.8-0.9 120 12 1000
WIND 1-0.1 6 4.5 -5.0
0.25 125 11 0
http://www.indiaenvironmentportal.org.in/files/file/solar%20energy%20in%20India.pdf

Cost of Electricity ($/MWh)
3 R
s./k
Wh
6 R
s./k
Wh
9 R
s./k
Wh
Bloomberg, 2015 68

0
50
100
150
200
250
300
350
20
00
20
02
20
04
20
06
20
08
20
10
20
12
20
14
20
16
20
18
20
20
Tota
l In
stal
led
Cap
acit
y o
f So
lar
and
Win
d E
ne
rgy
(GW
)
China USA India Japan Germany
Existing Capacity (GW) Targets for the Future (GW)
69

Gujarat Wind – March 3, 2016
70

PV Output Variability
Apt et al, 2011 71

Jan 1, 2015
June 2, 2015
Solar Output Variation
72

Gujarat Solar –March 3, 2016
73

Understanding variations in supply
0.00
20.00
40.00
60.00
80.00
100.00
120.00
140.00
160.00
180.00
6:3
0
7:0
0
7:3
0
8:0
0
8:3
0
9:0
0
9:3
0
10:0
0
10:3
0
11:0
0
11:3
0
12:0
0
12:3
0
13:0
0
13:3
0
14:0
0
14:3
0
15:0
0
15:3
0
16:0
0
16:3
0
17:0
0
17:3
0
18:0
0
18:3
0
19:0
0
MW
Time of the Day
Chiraka (Gujarat)Solar Generation
11/4/2012
13/4/2012
29/4/2012
74

Source: A.Dave, et al, 2016 75

76Source: A.Dave, et al, 2016

Learning Curve for Renewables
77IPCC, 2012

Plan Layout
78
78

A portion of the ELU map of Ward A of MCGM
Corresponding Satellite Imagery for the area from Google Earth
Analyzed in QGIS 1.8.0To determine-Building Footprint Ratios- Usable PV AreasFor Sample Buildings
Source: R. Singh and Banerjee, 2015 79
0
0.5
1
1.5
2
2.5
0:0
1-
1:0
0
1:0
1-
2:0
0
2:0
1-
3:0
0
3:0
1-
4:0
0
4:0
1-
5:0
0
5:0
1-
6:0
0
6:0
1-
7:0
0
7:0
1-
8:0
0
8:0
1-
9:0
0
9:0
1-1
0:0
0
10:0
1-1
1:0
0
11:0
1-1
2:0
0
12:0
1-1
3:0
0
13:0
1-1
4:0
0
14:0
1-1
5:0
0
15:0
1-1
6:0
0
16:0
1-1
7:0
0
17:0
1-1
8:0
0
18:0
1-1
9:0
0
19:0
1-2
0:0
0
20:0
1-2
1:0
0
21:0
1-2
2:0
0
22:0
1-2
3:0
0
23:0
1-2
4:0
0
MU
s
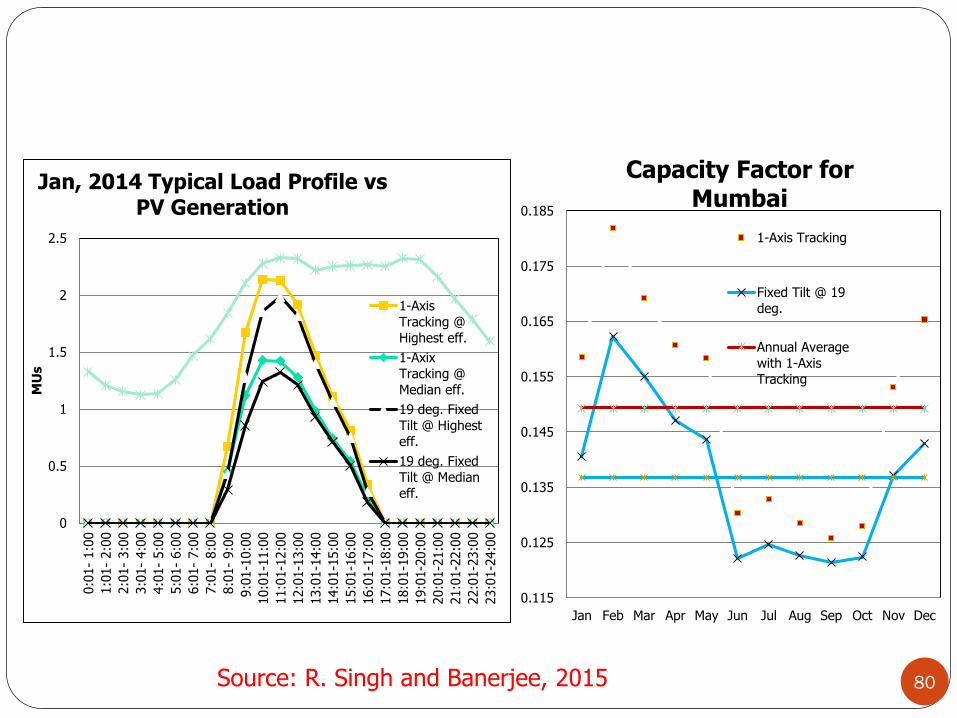
Jan, 2014 Typical Load Profile vsPV Generation
1-AxisTracking @Highest eff.
1-AxixTracking @Median eff.
19 deg. FixedTilt @ Highesteff.
19 deg. FixedTilt @ Medianeff.
0.115
0.125
0.135
0.145
0.155
0.165
0.175
0.185
Jan Feb Mar Apr May Jun Jul Aug Sep Oct Nov Dec
Capacity Factor for Mumbai
1-Axis Tracking
Fixed Tilt @ 19deg.
Annual Averagewith 1-AxisTracking
80Source: R. Singh and Banerjee, 2015

5000
5500
6000
6500
7000
7500
8000
8500
9000
9500
0 4 8 12 16 20 24
Jan-07
june
july
august
sept
0
200
400
600
800
1000
1200
1400
1600
1800
2000
0 4 8 12 16 20 24
hours
Po
we
r g
en
era
ted
in
MW
january
June
July
August
September
Wind Generation
Total Generation
Tamil Nadu 2006-7
81

0
500
1000
1500
2000
2500
0 4 8 12 16 20 24
Hours
Po
wer
gen
era
ted
in
MW January
June
September
Mean value
0
200
400
600
800
1000
1200
JAN FEB MAR APR MAY JUN JUL AUG SEP OCT NOV DEC
Months
Win
d e
ne
rgy g
en
era
ted
(M
U)
Hourly variation of wind power
Monthly variation of wind energy generated
82

Nokh (Godawari): 50 MW
Dhursar 125 MW Reliance/ Areva Megha, AP, 50 MW83

Miraah Project – Overview
84Source: GlassPoint – Miraah, 2015
Energy Production
1021 MW thermal (1GW)
Daily Steam Output
6000 tons
Total Project Area
3 km2 or 741 acres
Technology
GlassPoint enclosed trough
Number of Glass Houses
36
Construction Start
2015
First Steam
2017
Gas Savings
5.6 trillion BTUs per year
CO2 Emissions Saved
300,000 tons per year
Quick Facts:

85glasspoint.com/miraah
Sealed from Dust and sand
Fully automated operation

Strategy
86
0% 100 %
Completely
Indigenous
Import Complete plant
Prototype
50 %
National Test Facility
National Testing facility – Facilitate technology
development

Objectives
National Test Facility (for solar thermal applications) • Development of facility for component testing and characterization.
• Scope of experimentation for the continuous development of technologies.
1MW Solar Thermal Power Plant• Design & Development of a 1 MW plant.
• Generation of Electricity for supply to the grid.
• Development of technologies for component and system cost reduction.
Development of Simulation Package• Simulation software for scale-up and testing.
• Compatibility for various solar applications.
87

KG DS
Planned Mode
88

Time Line
Jan. 2010
Nov. 2012
Evaluation Version (v1.0)
Released
Foundation Stone
Preliminary Version (v0.0)
Released
Sep. 2011
Final Version Ready
Aug. 2014
Sep. 7, 2009
Project Start
Jul. 2011
Steam Generation
from LFR
Oct. 2012
Jun. 21, 2013
Mar. 14, 2014
Steam Blowing
Turbine Rolling
Grid Synchronisation
Grid Feeding,Test Rig Ready
May 2014
Mar. 6, 2015
Project End
89

90
Test Rig
Test Building
Dish Concentrator
90

User Interface: Main Window
91

Generation of user defined PFD using Simulator
Typical 50 MWe Solar Thermal Power Plant
Direct Steam Generation Process Heat Application
92

Simplified Process Flow Diagram
Cooling Water45 bar, 105°C1.09 kg/s
0.1 bar, 45.5°C1.78 kg/s
42 bar, 350°C1.93 kg/s
46.3 bar, 171°C2.22 kg/s
Steam Separator
44 bar, 256.1°C0.84 kg/s (Sat. Steam)
Pump-I
Preheater
Steam Generator
Pump-II
High Temperature Vessel
Low Temperature Vessel
17.5 bar, 232°C8.53 kg/s
13 bar, 393°C8.53 kg/s
PTC Field (8175m2)
Superheater
Pump-III
DeareatorPump-V
Pump-IV
Turbine
1 MWe
LFR Field (7020m2)
Pump-VI
Source: ISES, 201393
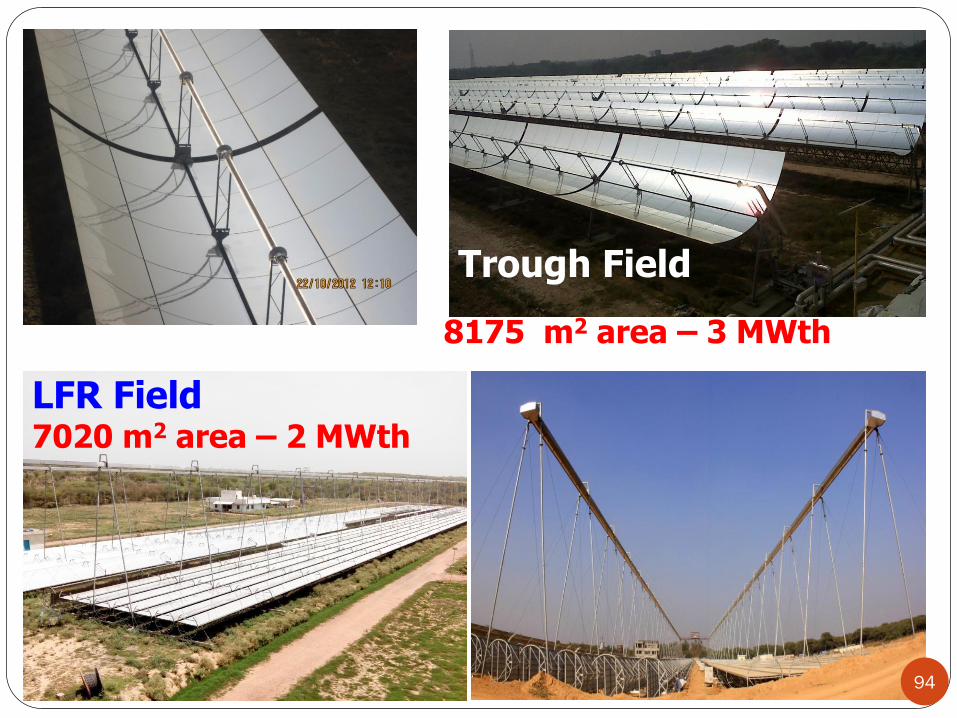
8175 m2 area – 3 MWth
Trough Field
LFR Field7020 m2 area – 2 MWth
94 94

9
5
95

9
6
96

Plant Performance
0
100
200
300
400
500
600
700
800
10.00 11.00 12.00 13.00 14.00 15.00 16.00
DN
I
Time (h)
4th June 2014
DNI
Minute by minute DNI data for 4th June 2014
0
100
200
300
400
500
600
10.00 11.00 12.00 13.00 14.00 15.00 16.00
Pow
er O
utp
ut (k
W)
Time (h)
4th June 2014
Minute by minute turbine power output data for 4th June 2014
97

Overall
Specialisation- Sub Tasks – Difficult from scratch
1 MW – too small for CSP with present route
Industry interest in CSP research – declined- change in priorities-
budgets
Catalysed CSP development – few consortium partners
Testing of one concentrator, new HTF fluid
Simulator – Evaluation licenses-Tata Power, Fichtner
98

Prototype for 24 x 7 Solar Thermal Power
Development of indigenous heliostat
Development of improved LFR with
steam storage using PCM
Development of molten salt loop and
stratified storage
Temperature
°C
1 290 Flow
2 550 Flow
3 550 No Flow
4 290 No Flow
Heat transfer fluid is molten salt
flow
condition
Heat Exchanger
Stratifiedmolten salt
Storage
Solar tower
1
2
3
4
Molten saltPump for tower
Molten saltPump for H.X
Water
Superheatedsteam
DESE- IIT Bombay
Partners: Clique Consultants, Mumbai
KGDS Renewable Energy, Coimbatore
Sponsored by NETRA –NTPC Ltd
99

Power Plant Operation
100
LFR-1
Heliostat
LFR-2Steam
drumPCM
Molten
SaltTurbine G
Condensor
Heat
Exchanger
Deaerator
100

Present objectives:
Prototype Development
Prototype development and testing of critical components
1. Development of Linear Fresnel Reflector (LFR) System and Phase Change Material (PCM) based Thermal Energy Storage with Steam Accumulator
(~ 1000 sq.m LFR with ~ 555 kWh storage)
2. Heliostat reflector development with tracking and flux measurement (8 x 100 sq.m)
3. Molten Salt Loop with Central Receiver, Salt Storage and Heat Exchanger
(~ 1 MWh storage, delivery of steam @425°C, 40 bar)
101101

TEAM SHUNYASOLAR DECATHLON EUROPE 2014
109

House in Versailles – 26th June, 2014
Team Shunya
70 students 13 disciplines 12 faculty 110

House assembly process
111
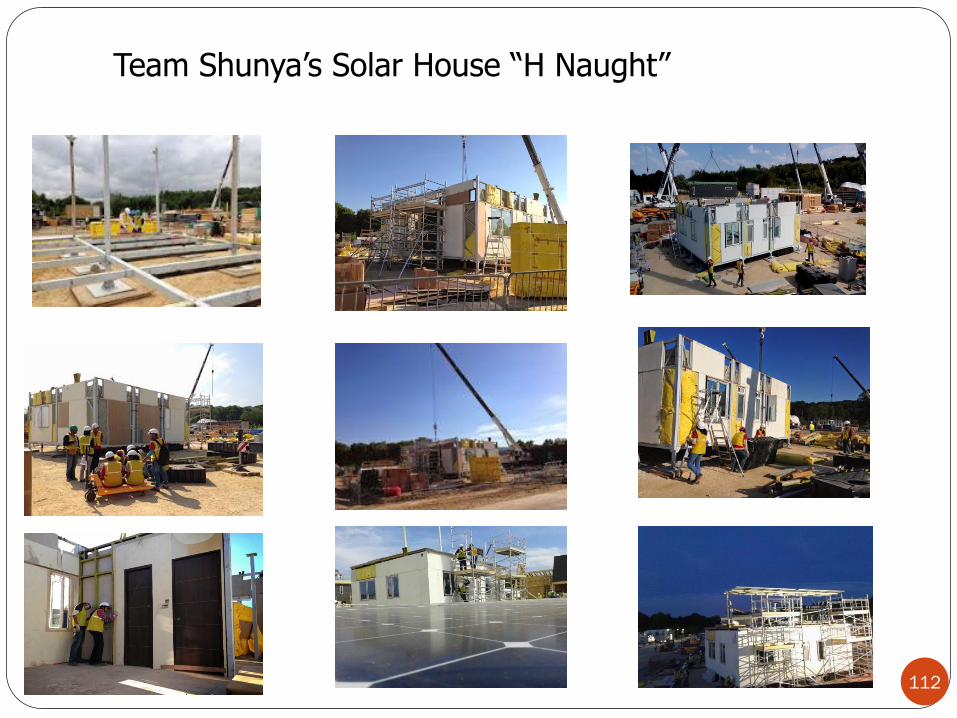
Team Shunya’s Solar House “H Naught”
112

Selco Case study
113
For profit company – Solar Home systems –
started 1996 – sold about 100,000 SHS
90% of products – credit schemes
Partnership with 9 banks – interest rates
between 12-17%
Financing Institutions pay 85% of the
amount- monthly payments of Rs 300- 400
over a period of 5 years
Financing/ repayment options – tailormade
to end users – paddy farmers – repayment
schedule based on crop cycle, street vendors
– daily payments – Rs 10
Funding from REEP – meet margin amount
for poor customers, reduce interest rate
Source: SELCO, 2011

End-Note Solar – Margins to Mainstream
Solar Thermal Facility – goal to enable design and development of future indigenous cost effective plants,Facility developed , not sure about future usage,
Sub-critical technology development efforts
Need for strategic technology development initiative nationally –Industry, researchers, Govt
Rapid deployment – Solar PV – need to enhance , indigenous PV industry, emphasis on roof-top PV, system studies, forecasting
Variability and Intermittency
Hybridisation, Storage, Demand Response
Innovation, Technology Development
Capital Requirements, Land , water
Centralised vs Decentralised114

References
115
GEA, 2012 Chapter 3, & 19 : Global Energy Assessment - Toward a Sustainable
Future, Cambridge University Press, Cambridge, UK and New York, NY, USA and
the International Institute for Applied Systems Analysis, Laxenburg, Austria.
T. Kanitkar et al 2015: Tejal Kanitkar, Banerjee, R. Banerjee and T. Jayaraman,
Impact of economic structure on mitigation targets for developing countries,
Volume 26, June 2015, 56–61, June 2015.
A. Dave, T.Kanitkar and R.Banerjee Analysing Implications of India's Renewable
Energy Targets, 2016 (under review)
Ministry of New and Renewable Energy (MNRE), Government of India, New
Delhi, website: www.mnre.gov.in
Ministry of Power, Government of India, http://powermin.nic.in/
R. Singh and Banerjee, 2015: Singh, R., and Banerjee, R., Estimation of rooftop
solar photovoltaic potential of a city, Solar Energy, Vol. 115, 589-602, May 2015.
Rockstrom et al, Nature 2009
http://cdiac.ornl.gov/trends/co2/graphics/lawdome.gif
http://blog.ucsusa.org/wp-content/uploads/2014/03/mlo_full_record.png
www.ipcc.ch
IPCC, 2011 & 2012,
https://www.ipcc.ch/publications_and_data/publications_and_data_reports.shtml

References
116
Energy After Rio: UNDP Publication
World Energy Outlook – 2008, International Energy Agency
http://www.indiaenvironmentportal.org.in/files/file/solar%20energy%20in%20India.pdf
Mitavachan and Srinivasan, 2012, Is land really a constraint for the utilization of
solar energy in India? Current Science, 103(02) General Articles, 25 July 2012.
http://www.indiaprwire.com/pressrelease/education/20140128287038.htm
Apt et al, 2011
ISES, 2013: Desai N.B., Bandyopadhyay S., Nayak J.K., Banerjee R., Kedare S.B.,
“Simulation of 1 MWe Solar Thermal Power Plant.” Energy Procedia, (57) 507-516, (2014)
ISES Solar World Congress, SWC 2013, Cancun, Mexico, November 3-7, 2013
www.oceanpd.com
http://atlantisresourcesltd.com/turbines/deployment.html
Oxford PV: Next Generation Solar Power, January 2015
Bonke et al Energy Environ. Sci., 2015, 8, 2791
Selco 2011: http://www.selco-india.com/
GSR, 2016: Renewable 2016 Global Status Report, Renewables Energy Policy Network,
For the 21st Century (REN 21)
Bloomberg New Energy Finance, 2016: Global Trends in Renewable Energy Investment
2016
GlassPoint – Miraah, 2015, GlassPoint Solar, Inc. www.glasspoint.com

117
Acknowledgment
Balkrishna SurveTejal Kanitkar
Thank you
[email protected]@gmail.com
Solar power team+ Team Shunya
Rhythm Singh Pankaj Kumar