Embed Size (px)
Citation preview
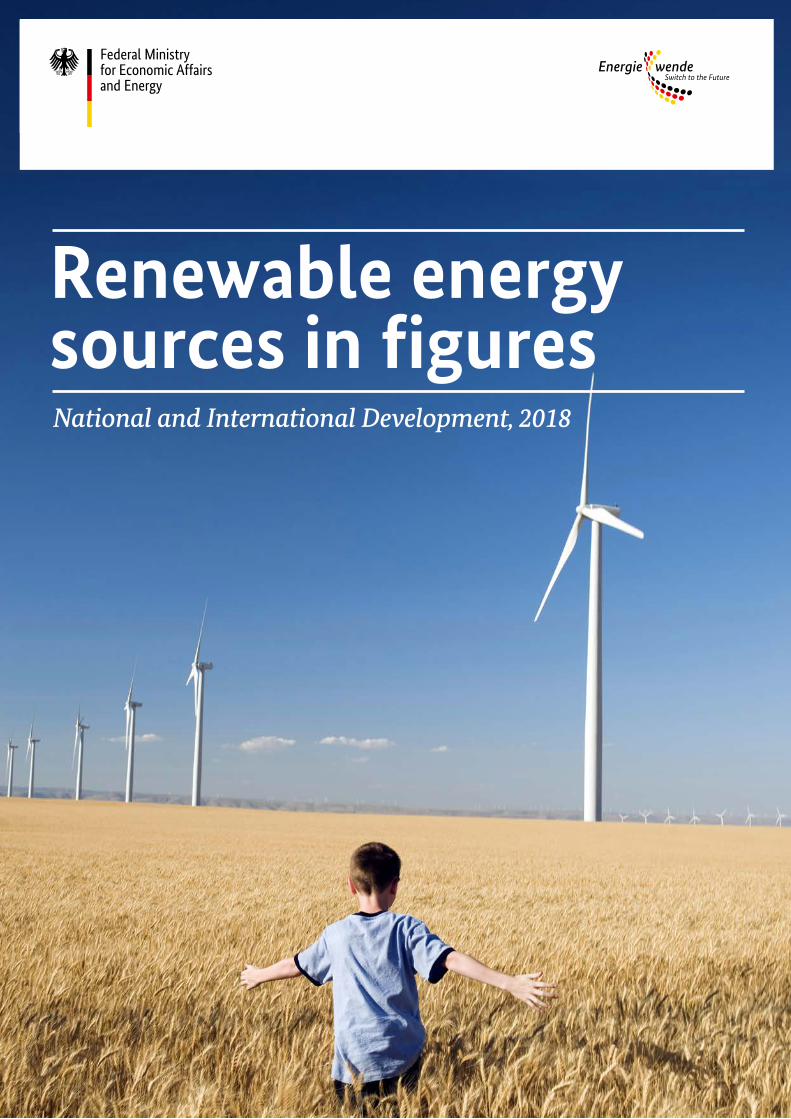
Renewable energy sources in figuresNational and International Development, 2018
Imprint
Published byFederal Ministry for Economic Affairs and Energy (BMWi)Public Relations11019 Berlinwww.bmwi.de
Expert supportCentre for Solar Energy and Hydrogen Research Baden-Württemberg (ZSW), Stuttgart,German Environment Agency (UBA), Department V 1.5, Dessau-Roßlau
Current as atOctober 2019
DesignPRpetuum GmbH, 80801 Munich
Image creditErik Isakson / Getty Images / Cover
You can obtain this and other brochures from:Federal Ministry for Economic Affairs and Energy (BMWi)Public RelationsE-mail: [email protected]
Central ordering service:Tel.: +49 30 182 722 721Fax: +49 30 18102 722 721
This brochure is published as part of the public relations work of the Federal Ministry for Economic Affairs and Energy. It is distributed free of charge and is not intended for sale. The distribution of this brochure at campaign events or at information stands run by political parties is prohibited, and politicalparty-related information or advertising shall not be inserted in, printed on, or affixed to this publication.
Renewable energy sources in figuresNational and International Development, 2018
Table of contents
2
Introduction ...................................................................................................................................................................................................................................................................................................................................................................................................................................................................................................................................4
Working Group on Renewable Energy Statistics............................................................................................................................................................................................................................................................................................................................................................6
Part I: The energy transition in Germany ................................................................................................................................................................................................................................................................................................................................................................................7
Climate Action Act adopted . . . . . . . . . . . . . . . . . . . . . . . . . . . . . . . . . . . . . . . . . . . . . . . . . . . . . . . . . . . . . . . . . . . . . . . . . . . . . . . . . . . . . . . . . . . . . . . . . . . . . . . . . . . . . . . . . . . . . . . . . . . . . . . . . . . . . . . . . . . . . . . . . . . . . . . . . . . . . . . . . . . . . . . . . . . . . . . . . . . . . . . . . . . . . . . . . . . . . . . . . . . . . . .8
Monitoring the energy transition . . . . . . . . . . . . . . . . . . . . . . . . . . . . . . . . . . . . . . . . . . . . . . . . . . . . . . . . . . . . . . . . . . . . . . . . . . . . . . . . . . . . . . . . . . . . . . . . . . . . . . . . . . . . . . . . . . . . . . . . . . . . . . . . . . . . . . . . . . . . . . . . . . . . . . . . . . . . . . . . . . . . . . . . . . . . . . . . . . . . . . . . . . . . . . . . .8
Energy transition targets and the status quo . . . . . . . . . . . . . . . . . . . . . . . . . . . . . . . . . . . . . . . . . . . . . . . . . . . . . . . . . . . . . . . . . . . . . . . . . . . . . . . . . . . . . . . . . . . . . . . . . . . . . . . . . . . . . . . . . . . . . . . . . . . . . . . . . . . . . . . . . . . . . . . . . . . . . . . . . . . . . . . . . . . . . . .9
Expansion of renewable energy . . . . . . . . . . . . . . . . . . . . . . . . . . . . . . . . . . . . . . . . . . . . . . . . . . . . . . . . . . . . . . . . . . . . . . . . . . . . . . . . . . . . . . . . . . . . . . . . . . . . . . . . . . . . . . . . . . . . . . . . . . . . . . . . . . . . . . . . . . . . . . . . . . . . . . . . . . . . . . . . . . . . . . . . . . . . . . . . . . . . . . . . . . . . . . . . .10
Electricity . . . . . . . . . . . . . . . . . . . . . . . . . . . . . . . . . . . . . . . . . . . . . . . . . . . . . . . . . . . . . . . . . . . . . . . . . . . . . . . . . . . . . . . . . . . . . . . . . . . . . . . . . . . . . . . . . . . . . . . . . . . . . . . . . . . . . . . . . . . . . . . . . . . . . . . . . . . . . . . . . . . . . . . . . . . . . . . . . . . . . . . . . . . . . . . . . . . . . . . . . . . . . . . . . . . . . . . . . . . . . . . . . . . . . . . . . . . . . . . . . . . . . .10
Heat . . . . . . . . . . . . . . . . . . . . . . . . . . . . . . . . . . . . . . . . . . . . . . . . . . . . . . . . . . . . . . . . . . . . . . . . . . . . . . . . . . . . . . . . . . . . . . . . . . . . . . . . . . . . . . . . . . . . . . . . . . . . . . . . . . . . . . . . . . . . . . . . . . . . . . . . . . . . . . . . . . . . . . . . . . . . . . . . . . . . . . . . . . . . . . . . . . . . . . . . . . . . . . . . . . . . . . . . . . . . . . . . . . . . . . . . . . . . . . . . . . . . . . . . . . . . . . . . . . .16
Transport . . . . . . . . . . . . . . . . . . . . . . . . . . . . . . . . . . . . . . . . . . . . . . . . . . . . . . . . . . . . . . . . . . . . . . . . . . . . . . . . . . . . . . . . . . . . . . . . . . . . . . . . . . . . . . . . . . . . . . . . . . . . . . . . . . . . . . . . . . . . . . . . . . . . . . . . . . . . . . . . . . . . . . . . . . . . . . . . . . . . . . . . . . . . . . . . . . . . . . . . . . . . . . . . . . . . . . . . . . . . . . . . . . . . . . . . . . . . . . . . . . . . . . .21
Emissions prevented through the use of renewable energy sources . . . . . . . . . . . . . . . . . . . . . . . . . . . . . . . . . . . . . . . . . . . . . . . . . . . . . . . . . . . . . . . . . . . . . . . . . . . . . . . . . . . . . . . . . . . . . . . . . . . . . . . . . . . . . .24
Reduction in the use of fossil fuels thanks to renewable energy . . . . . . . . . . . . . . . . . . . . . . . . . . . . . . . . . . . . . . . . . . . . . . . . . . . . . . . . . . . . . . . . . . . . . . . . . . . . . . . . . . . . . . . . . . . . . . . . . . . . . . . . . . . . . . . . . . . . . . .26
The Renewable Energy Sources Act . . . . . . . . . . . . . . . . . . . . . . . . . . . . . . . . . . . . . . . . . . . . . . . . . . . . . . . . . . . . . . . . . . . . . . . . . . . . . . . . . . . . . . . . . . . . . . . . . . . . . . . . . . . . . . . . . . . . . . . . . . . . . . . . . . . . . . . . . . . . . . . . . . . . . . . . . . . . . . . . . . . . . . . . . . . . . . . . . . . . . . . . . .27
Volumes of electricity pursuant to the Renewable Energy Sources Act (RES Act) . . . . . . . . . . . . . . . . . . . . . . . . . . . . . . . . . . . . . . . . . . . . . . . . . . . . . . . . . . . . . . . . . . . . . . . . . . . . . . .27
Landlord-to-tenant electricity: inviting the energy transition into your home . . . . . . . . . . . . . . . . . . . . . . . . . . . . . . . . . . . . . . . . . . . . . . . . . . . . . . . . . . . . . . . . . . . . . . . . . . . . . . . . . . . .28
The renewable energy surcharge (EEG surcharge) . . . . . . . . . . . . . . . . . . . . . . . . . . . . . . . . . . . . . . . . . . . . . . . . . . . . . . . . . . . . . . . . . . . . . . . . . . . . . . . . . . . . . . . . . . . . . . . . . . . . . . . . . . . . . . . . . . . . . . . . . . . . . . . . . . . . . . . . . . . . . . . . . . . . . . . .29
Economic impetus from the construction and operation of renewable energy installations . . . . . . . . . . . . . . . . . . . . . . . . . . . . . . . . . . . . . . . . . . . . . . . . . . . .31
Employment in the renewable energy sector in Germany . . . . . . . . . . . . . . . . . . . . . . . . . . . . . . . . . . . . . . . . . . . . . . . . . . . . . . . . . . . . . . . . . . . . . . . . . . . . . . . . . . . . . . . . . . . . . . . . . . . . . . . . . . . . . . . . . . . . . . . . . . . . . . . . . . . .34
Promotion of renewable energy in the heating sector . . . . . . . . . . . . . . . . . . . . . . . . . . . . . . . . . . . . . . . . . . . . . . . . . . . . . . . . . . . . . . . . . . . . . . . . . . . . . . . . . . . . . . . . . . . . . . . . . . . . . . . . . . . . . . . . . . . . . . . . . . . . . . . . . . . . . . . . . . . . .36
Promotion of renewable energy in transport . . . . . . . . . . . . . . . . . . . . . . . . . . . . . . . . . . . . . . . . . . . . . . . . . . . . . . . . . . . . . . . . . . . . . . . . . . . . . . . . . . . . . . . . . . . . . . . . . . . . . . . . . . . . . . . . . . . . . . . . . . . . . . . . . . . . . . . . . . . . . . . . . . . . . . . . . . . . . . . . . . .37
Promotion of renewable energy research and development . . . . . . . . . . . . . . . . . . . . . . . . . . . . . . . . . . . . . . . . . . . . . . . . . . . . . . . . . . . . . . . . . . . . . . . . . . . . . . . . . . . . . . . . . . . . . . . . . . . . . . . . . . . . . . . . . . . . . . . . . . . . . . . .38
Data platforms of the Federal Network Agency . . . . . . . . . . . . . . . . . . . . . . . . . . . . . . . . . . . . . . . . . . . . . . . . . . . . . . . . . . . . . . . . . . . . . . . . . . . . . . . . . . . . . . . . . . . . . . . . . . . . . . . . . . . . . . . . . . . . . . . . . . . . . . . . . . . . . . . . . . . . . . . . . . . . . . . . . . . . . .40
3TABLE OF CONTENTS 3
Part II: Renewable energy in the European Union ......................................................................................................................................................................................................................................................................................................................................42
Estimate of the shares of renewable energy in Germany in 2018 according to Directive 2009/28/EC . . . . . . . . . . . . . . . . . . . . . . . . . . . . . . . .46
Renewables-based electricity generation in the EU . . . . . . . . . . . . . . . . . . . . . . . . . . . . . . . . . . . . . . . . . . . . . . . . . . . . . . . . . . . . . . . . . . . . . . . . . . . . . . . . . . . . . . . . . . . . . . . . . . . . . . . . . . . . . . . . . . . . . . . . . . . . . . . . . . . . . . . . . . . . . . . . . . . . .47
Wind energy use . . . . . . . . . . . . . . . . . . . . . . . . . . . . . . . . . . . . . . . . . . . . . . . . . . . . . . . . . . . . . . . . . . . . . . . . . . . . . . . . . . . . . . . . . . . . . . . . . . . . . . . . . . . . . . . . . . . . . . . . . . . . . . . . . . . . . . . . . . . . . . . . . . . . . . . . . . . . . . . . . . . . . . . . . . . . . . . . . . . . . . . . . . . . . . . . . . . . . . . . . . . . . . . . . . . . . . . . . . . . . . . . . . . . .49
Solar energy use – electricity generation . . . . . . . . . . . . . . . . . . . . . . . . . . . . . . . . . . . . . . . . . . . . . . . . . . . . . . . . . . . . . . . . . . . . . . . . . . . . . . . . . . . . . . . . . . . . . . . . . . . . . . . . . . . . . . . . . . . . . . . . . . . . . . . . . . . . . . . . . . . . . . . . . . . . . . . . . . . . . . . . . . . . . . . . . . . . . .53
Solar energy use – heat supply . . . . . . . . . . . . . . . . . . . . . . . . . . . . . . . . . . . . . . . . . . . . . . . . . . . . . . . . . . . . . . . . . . . . . . . . . . . . . . . . . . . . . . . . . . . . . . . . . . . . . . . . . . . . . . . . . . . . . . . . . . . . . . . . . . . . . . . . . . . . . . . . . . . . . . . . . . . . . . . . . . . . . . . . . . . . . . . . . . . . . . . . . . . . . . . . . . . .54
Renewable energy sources in the transport sector . . . . . . . . . . . . . . . . . . . . . . . . . . . . . . . . . . . . . . . . . . . . . . . . . . . . . . . . . . . . . . . . . . . . . . . . . . . . . . . . . . . . . . . . . . . . . . . . . . . . . . . . . . . . . . . . . . . . . . . . . . . . . . . . . . . . . . . . . . . . . . . . . . . . . . .56
Part III: Global use of renewable energy sources ..................................................................................................................................................................................................................................................................................................................................................58
Electricity generation from renewable energy sources . . . . . . . . . . . . . . . . . . . . . . . . . . . . . . . . . . . . . . . . . . . . . . . . . . . . . . . . . . . . . . . . . . . . . . . . . . . . . . . . . . . . . . . . . . . . . . . . . . . . . . . . . . . . . . . . . . . . . . . . . . . . . . . . . . . . . . . . . . . . .59
Renewable energy sources in the other sectors . . . . . . . . . . . . . . . . . . . . . . . . . . . . . . . . . . . . . . . . . . . . . . . . . . . . . . . . . . . . . . . . . . . . . . . . . . . . . . . . . . . . . . . . . . . . . . . . . . . . . . . . . . . . . . . . . . . . . . . . . . . . . . . . . . . . . . . . . . . . . . . . . . . . . . . . . . . . .61
Investment and jobs . . . . . . . . . . . . . . . . . . . . . . . . . . . . . . . . . . . . . . . . . . . . . . . . . . . . . . . . . . . . . . . . . . . . . . . . . . . . . . . . . . . . . . . . . . . . . . . . . . . . . . . . . . . . . . . . . . . . . . . . . . . . . . . . . . . . . . . . . . . . . . . . . . . . . . . . . . . . . . . . . . . . . . . . . . . . . . . . . . . . . . . . . . . . . . . . . . . . . . . . . . . . . . . . . . . . . . . . . . .62
Annex ...............................................................................................................................................................................................................................................................................................................................................................................................................................................................................................................................................................64
International networks for renewable energy sources . . . . . . . . . . . . . . . . . . . . . . . . . . . . . . . . . . . . . . . . . . . . . . . . . . . . . . . . . . . . . . . . . . . . . . . . . . . . . . . . . . . . . . . . . . . . . . . . . . . . . . . . . . . . . . . . . . . . . . . . . . . . . . . . . . . . . . . . . . . . .64
Information on methodology . . . . . . . . . . . . . . . . . . . . . . . . . . . . . . . . . . . . . . . . . . . . . . . . . . . . . . . . . . . . . . . . . . . . . . . . . . . . . . . . . . . . . . . . . . . . . . . . . . . . . . . . . . . . . . . . . . . . . . . . . . . . . . . . . . . . . . . . . . . . . . . . . . . . . . . . . . . . . . . . . . . . . . . . . . . . . . . . . . . . . . . . . . . . . . . . . . . . . .68
Conversion factors ..................................................................................................................................................................................................................................................................................................................................................................................................................................................................................................71
List of abbreviations ........................................................................................................................................................................................................................................................................................................................................................................................................................................................................................72
List of sources .......................................................................................................................................................................................................................................................................................................................................................................................................................................................................................................................73
4
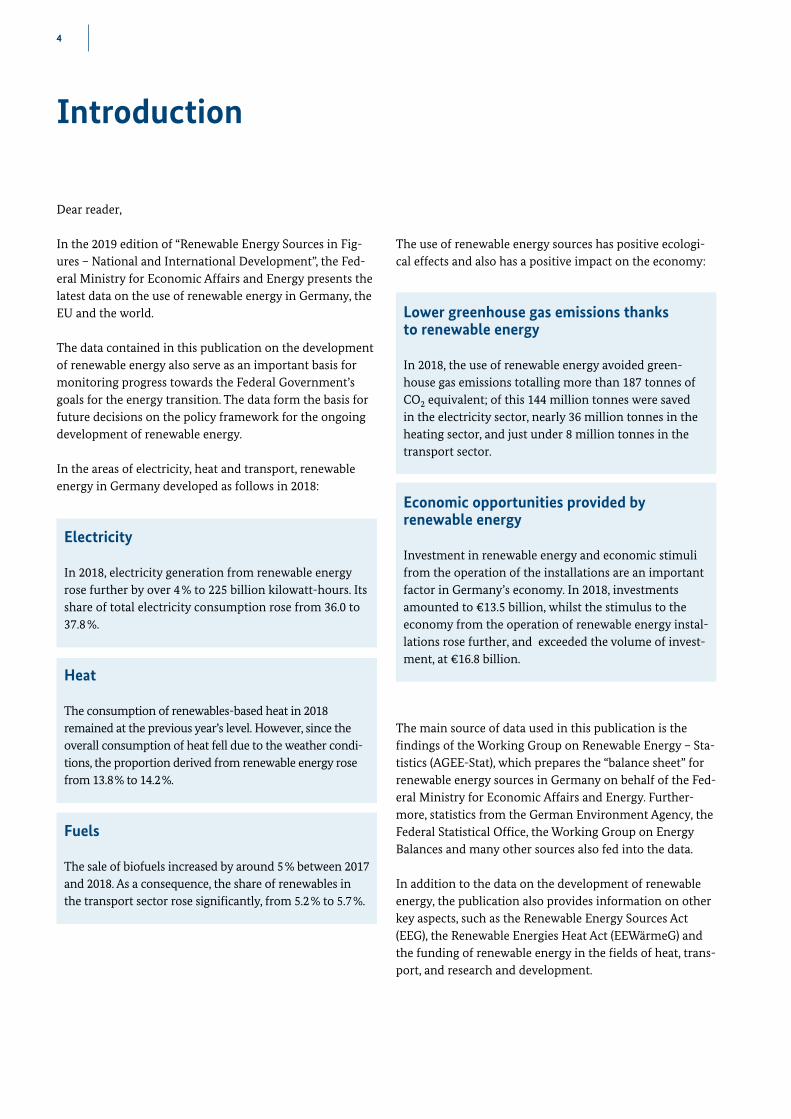
The use of renewable energy sources has positive ecologi-cal effects and also has a positive impact on the economy:
Lower greenhouse gas emissions thanks to renewable energy
In 2018, the use of renewable energy avoided green-house gas emissions totalling more than 187 tonnes of CO2 equivalent; of this 144 million tonnes were saved in the electricity sector, nearly 36 million tonnes in the heating sector, and just under 8 million tonnes in the transport sector .
Economic opportunities provided by renewable energy
Investment in renewable energy and economic stimuli from the operation of the installations are an important factor in Germany’s economy . In 2018, investments amounted to €13 .5 billion, whilst the stimulus to the economy from the operation of renewable energy instal-lations rose further, and exceeded the volume of invest-ment, at €16 .8 billion .
The main source of data used in this publication is the findings of the Working Group on Renewable Energy – Sta-tistics (AGEE-Stat), which prepares the “balance sheet” for renewable energy sources in Germany on behalf of the Fed-eral Ministry for Economic Affairs and Energy . Further-more, statistics from the German Environment Agency, the Federal Statistical Office, the Working Group on Energy Balances and many other sources also fed into the data .
In addition to the data on the development of renewable energy, the publication also provides information on other key aspects, such as the Renewable Energy Sources Act (EEG), the Renewable Energies Heat Act (EEWärmeG) and the funding of renewable energy in the fields of heat, trans-port, and research and development .
Introduction
Dear reader,
In the 2019 edition of “Renewable Energy Sources in Fig-ures – National and International Development”, the Fed-eral Ministry for Economic Affairs and Energy presents the latest data on the use of renewable energy in Germany, the EU and the world .
The data contained in this publication on the development of renewable energy also serve as an important basis for monitoring progress towards the Federal Government’s goals for the energy transition . The data form the basis for future decisions on the policy framework for the ongoing development of renewable energy .
In the areas of electricity, heat and transport, renewable energy in Germany developed as follows in 2018:
Electricity
In 2018, electricity generation from renewable energy rose further by over 4 % to 225 billion kilowatt-hours . Its share of total electricity consumption rose from 36 .0 to 37 .8 % .
Heat
The consumption of renewables-based heat in 2018 remained at the previous year’s level . However, since the overall consumption of heat fell due to the weather condi-tions, the proportion derived from renewable energy rose from 13 .8 % to 14 .2 % .
Fuels
The sale of biofuels increased by around 5 % between 2017 and 2018 . As a consequence, the share of renewables in the transport sector rose significantly, from 5 .2 % to 5 .7 % .
INTRODUCTION 5
Not only does it document their development in Germany, it also provides a great deal of information about the use of renewable energy sources in the European Union, which has also set ambitious goals in the context of the legislative package “Clean Energy for All Europeans” . Finally, the bro-chure covers the global development of renewable energy .
All of the information presented in this publication reflects the situation as of the editorial deadline for this brochure (August 2019), meaning certain figures are provisional . Alongside this brochure, on its website the Federal Ministry for Economic Affairs and Energy provides regularly updated time series and a large number of diagrams showing the development of renewable energy sources in Germany since 1990 . Complete sets of data from 1990 can be found there – whilst most of them have been abridged in this bro-chure to make them easier to follow . These time series and diagrams will be updated at the end of 2019/start of 2020 (cf . https://www .erneuerbare-energien .de/EE/Navigation/DE/Service/Erneuerbare_Energien_in_Zahlen/Zeitreihen/ zeitreihen .html and www .erneuerbare-energien .de/EE/Redaktion/DE/Bilderstrecken/entwicklung-der-erneuer-baren-energien-in-deutschland-im-jahr-englisch .html) .
For more information about renewable energy and the energy transition in Germany, please visit the Ministry’s websites at https://www .bmwi .de/Navigation/EN/Home/home .html and www .erneuerbare-energien .de (in German only) .
Yours sincerely,
The Federal Ministry for Economic Affairs and Energy
Berlin, October 2019
6
Since February 2004, the Work-ing Group on Renewable Energy Statistics (AGEE-Stat) has generated comprehensive
and up-to date statistics and data on the development of renewable energy sources in Germany . AGEE-Stat works on behalf of the Federal Ministry for Economic Affairs and Energy . The AGEE-Stat’s findings are incorporated into this publication .
AGEE-Stat is an independent expert body with members from various ministries, agencies and academic institu-tions .
The following institutions are currently AGEE-Stat mem-bers:
●● the Federal Ministry for Economic Affairs and Energy (BMWi)
●● the Federal Ministry for the Environment, Nature Conservation and Nuclear Safety (BMU)
●● the Federal Ministry of Food and Agriculture (BMEL)
●● the German Environment Agency (UBA)
●● the Federal Statistical Office (StBA)
●● the Federal Network Agency (BNetzA)
●● the Agency for Renewable Resources (FNR)
●● the Centre for Solar Energy and Hydrogen Research Baden-Wuerttemberg (ZSW) as a representative of the Working Group on Energy Balances (AGEB)
AGEE-Stat is supported in its work by a consortium of aca-demic institutions . The project partners are the Leipzig Institute for Energy (IE Leipzig) as the coordinator, and the Fraunhofer Institute for Solar Energy Systems ISE (Fh-ISE),
the German Biomass Research Centre (DBFZ), the German Energy Agency (dena), Ingenieurbüro Floecksmühle, the Hamburg Institute (HIC) and UL International GmbH .
Since 2016, the German Environment Agency in Dessau has been tasked with directing and coordinating the Work-ing Group . The relevant office is located in Department V “Climate change mitigation, Energy, German Emissions Trading Office” and is assistant by officials from Unit V 1 .5 “Energy data, office of AGEE-Stat” .
AGEE-Stat’s activities focus on continuously developing and assuring the quality of the statistics on the use of renewable energy sources in Germany . The Working Group also has the task of
●● creating a basis for meeting the Federal Government’s various national, EU and international reporting obliga-tions on renewable energy and
●● providing the public with information on renewable energy data and development .
AGEE-Stat conducts a wide range of research and publishes its findings in order to improve the data pool and the scien-tific calculation methods that are used . The group’s work is supported by workshops and expert consultations on selected topics .
Further information on AGEE-Stat and renewable energy in Germany can be found in the form of diagrams, time series and monthly and quarterly reports on the websites of the Federal Ministry for Economic Affairs and Energy at www .erneuerbare-energien .de (in German only) and of the office of AGEE-Stat in the German Environment Agency at https://www .umweltbundesamt .de/en/topics/climate- energy/renewable-energies/renewable-energies-the- figures .
Working Group on Renewable Energy Statistics
7
The share of renewables in electricity consumption has grown steadily over the last few years – from around 6 % in 2000 to almost 38 % in 2018 . The Renewable Energy Sources Act stipulates the goal of attaining a share of 40-45 % by 2025 . The Federal Government is aiming – particularly in the context of the challenges of improving the synchroni-sation of renewable energy and grid capacity – to increase the proportion of renewable energy in the electricity sector in order to attain the target anchored in the Coalition Agreement of roughly 65 % by 2030 . A crucial role here is played by the capacity of the power grids to take up elec-tricity . It is necessary to step up the expansion of renew-ables not least to replace coal-fired power and to cover the additional demand for electricity so that the climate targets can be met in the transport, building and industrial sectors .
The successful expansion of the use of renewable energy is rooted in the Renewable Energy Sources Act, which entered into force in 2000 and has since been revised several times, and which originally aimed to facilitate market access for young technologies like wind energy and photovoltaics by guaranteeing their purchase at fixed rates . It took these technologies out of their niches and made them into a pillar of Germany’s electricity supply .
Since the most recent revision, the 2017 Renewable Energy Sources Act, the remuneration rates for renewable electric-ity have no longer been set by the government, but have been determined by auctions on the market . The only exception is for installations with a capacity of up to 750 kW, so that stakeholder diversity is maintained, particularly in the field of photovoltaics . The 2017 Renewable Energy Sources Act is thus intended to be the key to achieving effective annual quantitative steering and to bring renew-ables even closer to the market .
Even just the results of the first few auctions confirmed that the reform is an important step towards an economi-cally balanced energy transition . Average funding awards have dropped, particularly in the case of photovoltaics . For example, the funding awarded for PV fell by more than
50 % from 9 .17 ct/kWh in the first round of the pilot auc-tion in April 2015 to 4 .33 ct/kWh in the auction in February 2018 . In the case of onshore wind energy, the average volume- weighted funding awards dropped in 2017 from 5 .71 ct/kWh in the first round to 4 .28 ct/kWh and 3 .82 ct/kWh in the second and third rounds . Whilst the price-setting for PV is still working well, the remuneration rates for wind energy bounced back in the last few auction rounds and reached the maximum prices set in the auctions . The rea-sons for this are to be found in the under-subscribing of the volumes up for auction due to a current lack of author-ised projects .
In the first three auction rounds of 2017, the overwhelming majority of funding awards for onshore wind energy went to citizen-owned energy companies, i . e . to projects which did not yet have the necessary authorisation under the Fed-eral Immission Control Act . Also, the citizens’ energy com-panies were granted a longer implementation period than other bidders . This enabled such bidders to set very low remuneration rates and obtain funding awards . In order to tackle this distortion of competition and other undesirable developments, the legislature adapted the special rules applying to the citizen-owned energy companies . Since 2018, only citizen-owned energy companies with approved projects have been allowed to participate in the tenders . Also, the implementation period was harmonised .
The 2017 Renewable Energy Sources Act also introduced funding for landlord-to-tenant electricity, which came into effect on 25 July 2017 . Landlord-to-tenant electricity is electricity that is generated by a solar installation on the rooftop of a residential building and then passed on to final consumers (particularly tenants) living within this building or in a residential building or ancillary facilities located within close proximity of this building, and that are con-nected directly to the installation rather than via the public grid . This type of supply has the advantage of eliminating certain costs, such as grid charges, grid surcharges, electric-ity tax and concession fees . Under this legislation, a bonus is available for every single kilowatt-hour of landlord-to-
Part I:The energy transition in Germany
The energy transition is Germany’s long-term cross-sectoral strategy for transforming our energy supply to make it secure, economic and environmentally compatible. This involves the fundamental restructuring of Germany’s energy supply, moving it away from nuclear and fossil fuels and towards renewable energy and increased energy efficiency. We have already come a long way: around 38 % of our electricity derived from the wind, sun and co, in 2018. The Federal Government is committed to making the energy transition a driver for energy efficiency, modernisation, innovation and digitisation in our electricity and heating sectors. This also applies to the transport sector.
PART I : THE ENERGY TRANSITION IN GERMANY8
tenant electricity that is generated . This makes supplying electricity to tenants more attractive and profitable for landlords, whilst at the same reducing tenants’ electricity bills . Landlord-to-tenant electricity supply thus helps to develop renewables in Germany .
A good way to follow the changes in the German electricity market caused by the expansion of renewable energy can be found on the SMARD platform (information about elec-tricity market data), as the Federal Network Agency pro-vides a good and easy-to-understand depiction of the energy transition here . The platform provides information on the electricity market – almost in real time . This includes infor-mation on renewable energy sources . SMARD makes this data available in a form that is transparent, intelligible, and well-structured . This means that different groups of users can follow the progress of the energy transition at all times . Experts can also make use of numerous tools for in-depth analysis .
The Federal Government has also taken various measures for the heating market and transport with a view to pursu-ing the aims of the Energy Concept . For example, the major instrument for heating/cooling is the Renewable Energies Heat Act, alongside which the Market Incentive Programme also provides an additional source of funding for these areas . In the transport sector, the use of renewable energy is governed largely by the provisions set out in the Biofuel Quota Act . When it comes to the use of green electricity in transport, mention should also be made of the Electric Mobility Strategy and, from 2016, the purchase premium for electric vehicles .
By 2020, renewables are to account for 14 % of final energy consumption for heating and cooling under the provisions of the Renewable Energies Heat Act, and for 10 % of final energy consumption in the transport sector in keeping with the requirements of EU Directive 2009/28/EC .
In September 2018, the Federal Cabinet adopted the 7th Energy Research Programme entitled “Innovations for the Energy Transition”, under which the Federal Government is providing €6 .8 billion for projects between 2018 and 2022 . In this context, assistance is aimed primarily at technolo-gies that meet the requirements of the energy transition .
Climate Action Act adopted
The federal cabinet adopted a draft Climate Action Act on 9 October 2019 . This means that the Federal Government is the first government in the world to anchor in law its bind-ing national climate target of cutting greenhouse gas emis-sions by at least 55 % by 2030 . In order to attain this goal, annual carbon reduction targets and emission volumes for the building, transport, industrial and agriculture sectors
have been stipulated and will be reviewed each year . For the energy industry, the crucial years are 2022 and 2030, in line with the recommendations by the Commission for Growth, Structural Change and Employment . If a sector fails to meet its targets, the Federal Government will immediately respond to this .
The 2030 Climate Action Programme, which is being adopted at the same time, lists the measures which the Fed-eral Government intends to use to meet its 2030 climate target . These include the introduction of carbon pricing for transport and buildings, the phase-out of coal by 2038 at the latest, and the expansion of renewable energy to 65 % by 2030 in a manner compatible with the grid, the funding for renovation of buildings, electric mobility, cheaper train tickets and reduced burdens on long-distance commuters . Mitigating climate change is a challenge for society as a whole . It therefore needs to be designed in a socially acceptable way .
Monitoring the energy transition
The Federal Government’s Energy for the Future monitor-ing process regularly reviews the progress made in the transformation of Germany’s energy system, providing answers to questions including: Where does the energy transition stand, what measures have already been imple-mented and what impact are they having? Will we achieve our targets, or do we need to do some fine-tuning? The central task of the monitoring process is to analyse the reams of statistical information on energy that have been collected and then condense it and make it easy to under-stand . This involves an assessment of measures that have already been taken and work to pinpoint areas in which further efforts need to be made . In this way, each annual report provides an overview of the energy transition and the stage that it is at this point in time .
The Federal Ministry for Economic Affairs and Energy has been appointed lead ministry for the monitoring process for the energy transition . The Monitoring Report for each year is approved by the Federal Cabinet and transmitted to the Bundestag and the Bundesrat . Also involved in the process is an independent commission of four renowned energy experts, who provide a scientific opinion on the Monitoring Report: their scientific opinion is published alongside the Federal Government’s report .
In principle, instead of the Monitoring Report, the more detailed Progress Report on the Energy Transition is pre-sented every three years . The annual Monitoring Report is incorporated into the Progress Report, which allows the annual reporting to take place at its usual time . The Federal Government published the second Progress Report on 6 June 2019 . The progress reports contain more detailed
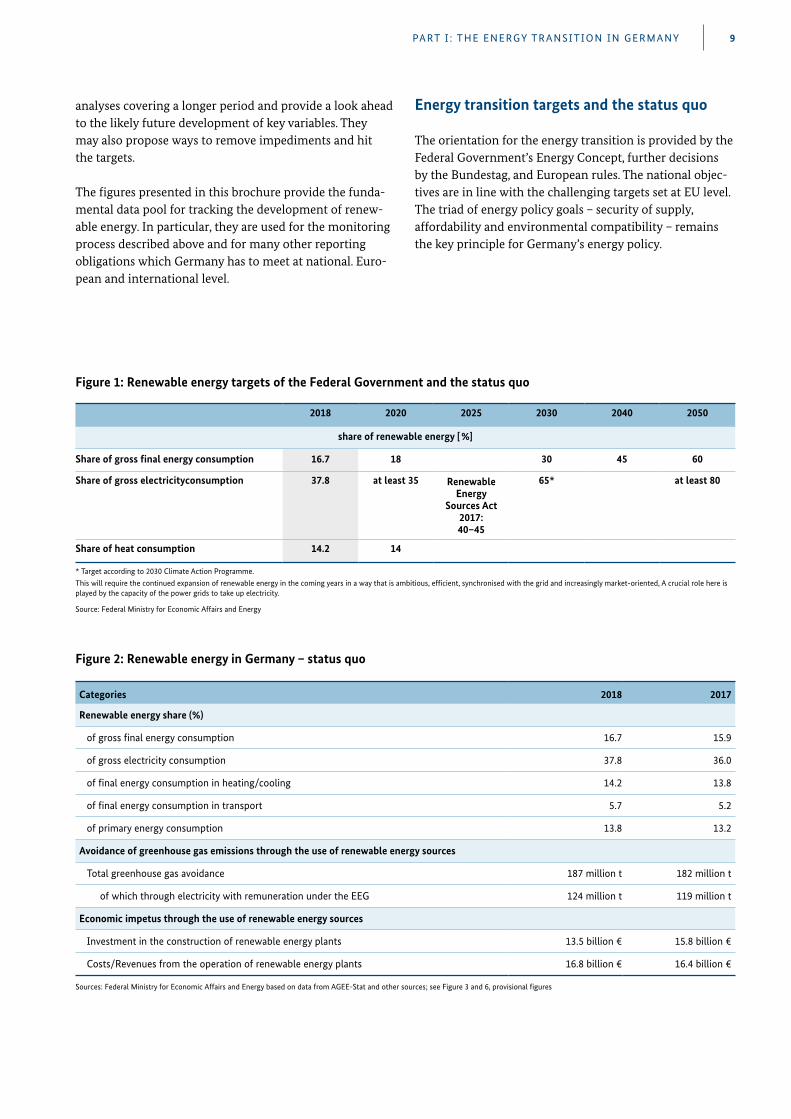
2018 2020 2025 2030 2040 2050
share of renewable energy [ %]
Share of gross final energy consumption 16.7 18 30 45 60
Share of gross electricityconsumption 37.8 at least 35 Renewable Energy
Sources Act 2017: 40–45
65*
at least 80
Share of heat consumption 14.2 14
* Target according to 2030 Climate Action Programme.This will require the continued expansion of renewable energy in the coming years in a way that is ambitious, efficient, synchronised with the grid and increasingly market-oriented, A crucial role here is played by the capacity of the power grids to take up electricity.
PART I : THE ENERGY TRANSITION IN GERMANY 9
Figure 1: Renewable energy targets of the Federal Government and the status quo
Source: Federal Ministry for Economic Affairs and Energy
Categories 2018 2017
Renewable energy share (%)
of gross final energy consumption 16.7 15.9
of gross electricity consumption 37.8 36.0
of final energy consumption in heating/cooling 14.2 13.8
of final energy consumption in transport 5.7 5.2
of primary energy consumption 13.8 13.2
Avoidance of greenhouse gas emissions through the use of renewable energy sources
Total greenhouse gas avoidance 187 million t 182 million t
of which through electricity with remuneration under the EEG 124 million t 119 million t
Economic impetus through the use of renewable energy sources
Investment in the construction of renewable energy plants 13.5 billion € 15.8 billion €
Costs/Revenues from the operation of renewable energy plants 16.8 billion € 16.4 billion €
Figure 2: Renewable energy in Germany – status quo
Sources: Federal Ministry for Economic Affairs and Energy based on data from AGEE-Stat and other sources; see Figure 3 and 6, provisional figures
analyses covering a longer period and provide a look ahead to the likely future development of key variables . They may also propose ways to remove impediments and hit the targets .
The figures presented in this brochure provide the funda-mental data pool for tracking the development of renew-able energy . In particular, they are used for the monitoring process described above and for many other reporting obligations which Germany has to meet at national . Euro-pean and international level .
Energy transition targets and the status quo
The orientation for the energy transition is provided by the Federal Government’s Energy Concept, further decisions by the Bundestag, and European rules . The national objec-tives are in line with the challenging targets set at EU level . The triad of energy policy goals – security of supply, affordability and environmental compatibility – remains the key principle for Germany’s energy policy .
PART I : THE ENERGY TRANSITION IN GERMANY10
Expansion of renewable energy
Electricity
Further increase in electricity generation from renewable energy sources
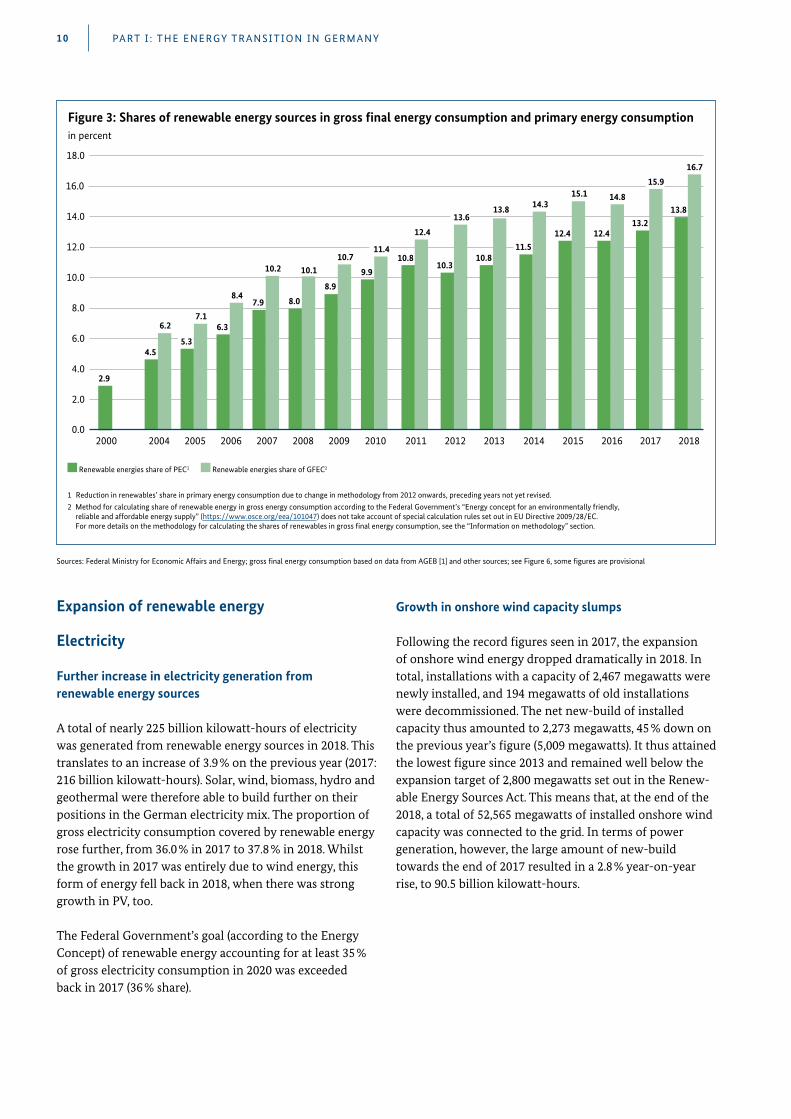
A total of nearly 225 billion kilowatt-hours of electricity was generated from renewable energy sources in 2018 . This translates to an increase of 3 .9 % on the previous year (2017: 216 billion kilowatt-hours) . Solar, wind, biomass, hydro and geothermal were therefore able to build further on their positions in the German electricity mix . The proportion of gross electricity consumption covered by renewable energy rose further, from 36 .0 % in 2017 to 37 .8 % in 2018 . Whilst the growth in 2017 was entirely due to wind energy, this form of energy fell back in 2018, when there was strong growth in PV, too .
The Federal Government’s goal (according to the Energy Concept) of renewable energy accounting for at least 35 % of gross electricity consumption in 2020 was exceeded back in 2017 (36 % share) .
Growth in onshore wind capacity slumps
Following the record figures seen in 2017, the expansion of onshore wind energy dropped dramatically in 2018 . In total, installations with a capacity of 2,467 megawatts were newly installed, and 194 megawatts of old installations were decommissioned . The net new-build of installed capacity thus amounted to 2,273 megawatts, 45 % down on the previous year’s figure (5,009 megawatts) . It thus attained the lowest figure since 2013 and remained well below the expansion target of 2,800 megawatts set out in the Renew-able Energy Sources Act . This means that, at the end of the 2018, a total of 52,565 megawatts of installed onshore wind capacity was connected to the grid . In terms of power generation, however, the large amount of new-build towards the end of 2017 resulted in a 2 .8 % year-on-year rise, to 90 .5 billion kilowatt-hours .
Renewable energies share of PEC1 Renewable energies share of GFEC2
1 Reduction in renewables’ share in primary energy consumption due to change in methodology from 2012 onwards, preceding years not yet revised.2 Method for calculating share of renewable energy in gross energy consumption according to the Federal Government’s “Energy concept for an environmentally friendly,
reliable and affordable energy supply” (https://www.osce.org/eea/101047) does not take account of special calculation rules set out in EU Directive 2009/28/EC. For more details on the methodology for calculating the shares of renewables in gross �nal energy consumption, see the “Information on methodology” section.
18.0
14.0
12.0
10.0
8.0
6.0
4.0
2.0
2000
2.9
2006
6.3
8.4
2007
7.9
10.2
2008
8.0
10.1
2009
8.9
10.7
2010
9.9
11.4
2011
10.8
12.4
2013
10.8
13.8
2015
12.4
15.1
2016
12.4
14.816.0
2017
13.2
15.9
2005
5.3
7.1
0.02014
14.3
11.5
2004
4.5
6.2
2012
10.3
13.6
2018
13.8
16.7
Figure 3: Shares of renewable energy sources in gross final energy consumption and primary energy consumptionin percent
Sources: Federal Ministry for Economic Affairs and Energy; gross final energy consumption based on data from AGEB [1] and other sources; see Figure 6, some figures are provisional
PART I : THE ENERGY TRANSITION IN GERMANY 11
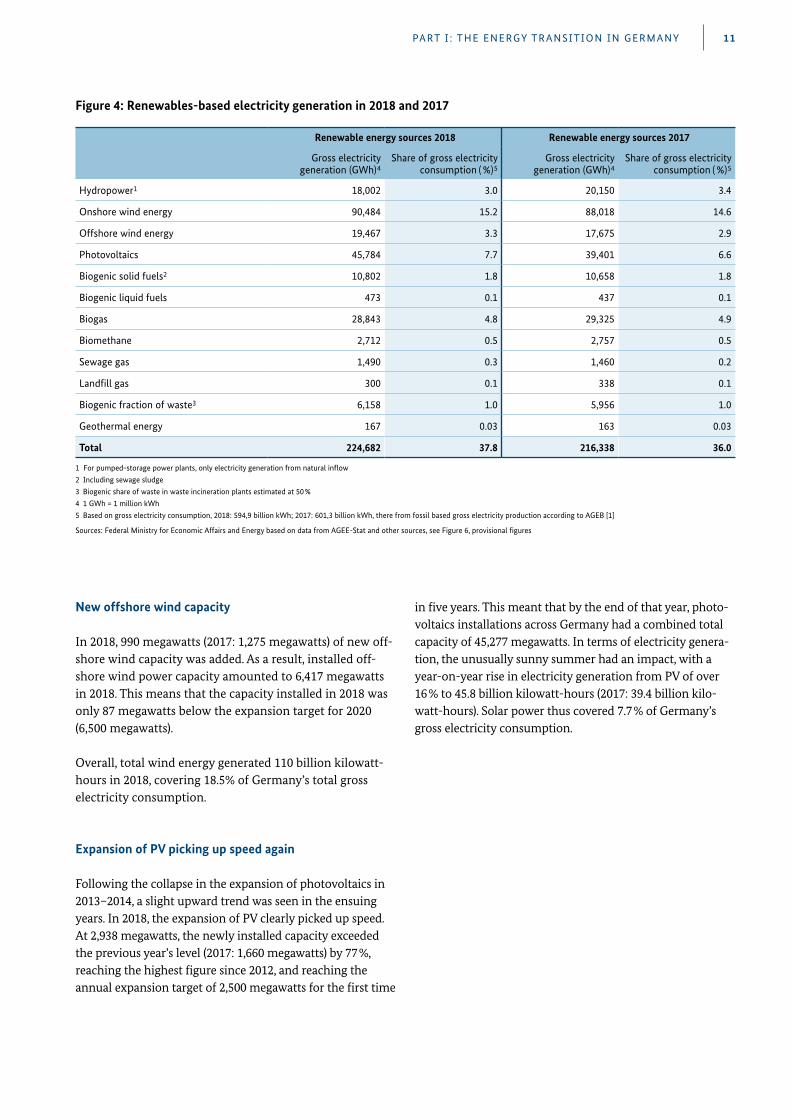
Renewable energy sources 2018 Renewable energy sources 2017
Gross electricity generation (GWh)4
Share of gross electricity consumption ( %)5
Gross electricity generation (GWh)4
Share of gross electricity consumption ( %)5
Hydropower1 18,002 3.0 20,150 3.4
Onshore wind energy 90,484 15.2 88,018 14.6
Offshore wind energy 19,467 3.3 17,675 2.9
Photovoltaics 45,784 7.7 39,401 6.6
Biogenic solid fuels2 10,802 1.8 10,658 1.8
Biogenic liquid fuels 473 0.1 437 0.1
Biogas 28,843 4.8 29,325 4.9
Biomethane 2,712 0.5 2,757 0.5
Sewage gas 1,490 0.3 1,460 0.2
Landfill gas 300 0.1 338 0.1
Biogenic fraction of waste3 6,158 1.0 5,956 1.0
Geothermal energy 167 0.03 163 0.03
Total 224,682 37.8 216,338 36.0
1 For pumped-storage power plants, only electricity generation from natural inflow2 Including sewage sludge3 Biogenic share of waste in waste incineration plants estimated at 50 %4 1 GWh = 1 million kWh5 Based on gross electricity consumption, 2018: 594,9 billion kWh; 2017: 601,3 billion kWh, there from fossil based gross electricity production according to AGEB [1]
Sources: Federal Ministry for Economic Affairs and Energy based on data from AGEE-Stat and other sources, see Figure 6, provisional figures
Figure 4: Renewables-based electricity generation in 2018 and 2017
New offshore wind capacity
In 2018, 990 megawatts (2017: 1,275 megawatts) of new off-shore wind capacity was added . As a result, installed off-shore wind power capacity amounted to 6,417 megawatts in 2018 . This means that the capacity installed in 2018 was only 87 megawatts below the expansion target for 2020 (6,500 megawatts) .
Overall, total wind energy generated 110 billion kilowatt- hours in 2018, covering 18 .5% of Germany’s total gross electricity consumption .
Expansion of PV picking up speed again
Following the collapse in the expansion of photovoltaics in 2013–2014, a slight upward trend was seen in the ensuing years . In 2018, the expansion of PV clearly picked up speed . At 2,938 megawatts, the newly installed capacity exceeded the previous year’s level (2017: 1,660 megawatts) by 77 %, reaching the highest figure since 2012, and reaching the annual expansion target of 2,500 megawatts for the first time
in five years . This meant that by the end of that year, photo-voltaics installations across Germany had a combined total capacity of 45,277 megawatts . In terms of electricity genera-tion, the unusually sunny summer had an impact, with a year-on-year rise in electricity generation from PV of over 16 % to 45 .8 billion kilowatt-hours (2017: 39 .4 billion kilo-watt-hours) . Solar power thus covered 7 .7 % of Germany’s gross electricity consumption .
PART I : THE ENERGY TRANSITION IN GERMANY12
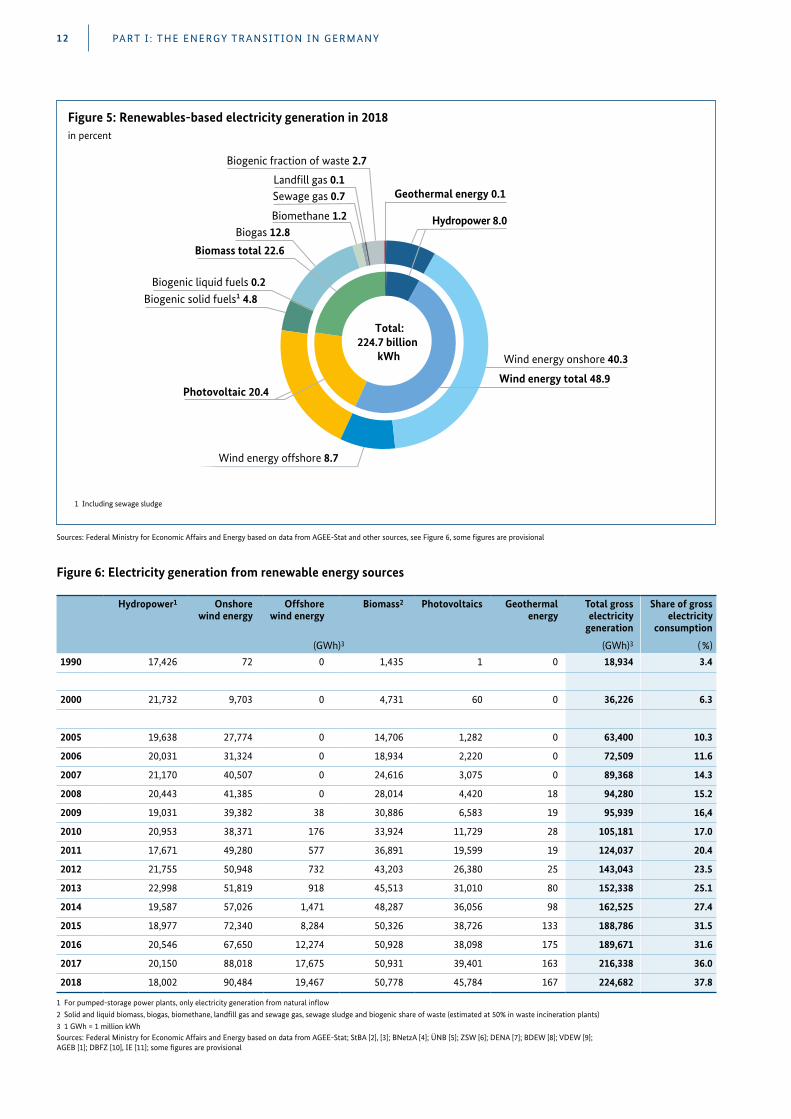
Hydropower 8.0
Land�ll gas 0.1
Biogenic solid fuels¹ 4.8
Wind energy onshore 40.3
Biogenic liquid fuels 0.2
Biogas 12.8
Biomethane 1.2
Sewage gas 0.7 Geothermal energy 0.1
Photovoltaic 20.4
Wind energy offshore 8.7
Biomass total 22.6
Wind energy total 48.9
Biogenic fraction of waste 2.7
Total:224.7 billion
kWh
1 Including sewage sludge
Figure 5: Renewables-based electricity generation in 2018in percent
Sources: Federal Ministry for Economic Affairs and Energy based on data from AGEE-Stat and other sources, see Figure 6, some figures are provisional
Hydropower1 Onshore wind energy
Offshore wind energy
Biomass2 Photovoltaics Geothermal energy
Total gross electricity
generation
Share of gross electricity
consumption
(GWh)3 (GWh)3 ( %)
1990 17,426 72 0 1,435 1 0 18,934 3.4
2000 21,732 9,703 0 4,731 60 0 36,226 6.3
2005 19,638 27,774 0 14,706 1,282 0 63,400 10.3
2006 20,031 31,324 0 18,934 2,220 0 72,509 11.6
2007 21,170 40,507 0 24,616 3,075 0 89,368 14.3
2008 20,443 41,385 0 28,014 4,420 18 94,280 15.2
2009 19,031 39,382 38 30,886 6,583 19 95,939 16,4
2010 20,953 38,371 176 33,924 11,729 28 105,181 17.0
2011 17,671 49,280 577 36,891 19,599 19 124,037 20.4
2012 21,755 50,948 732 43,203 26,380 25 143,043 23.5
2013 22,998 51,819 918 45,513 31,010 80 152,338 25.1
2014 19,587 57,026 1,471 48,287 36,056 98 162,525 27.4
2015 18,977 72,340 8,284 50,326 38,726 133 188,786 31.5
2016 20,546 67,650 12,274 50,928 38,098 175 189,671 31.6
2017 20,150 88,018 17,675 50,931 39,401 163 216,338 36.0
2018 18,002 90,484 19,467 50,778 45,784 167 224,682 37.8
1 For pumped-storage power plants, only electricity generation from natural inflow2 Solid and liquid biomass, biogas, biomethane, landfill gas and sewage gas, sewage sludge and biogenic share of waste (estimated at 50% in waste incineration plants)3 1 GWh = 1 million kWhSources: Federal Ministry for Economic Affairs and Energy based on data from AGEE-Stat; StBA [2], [3]; BNetzA [4]; ÜNB [5]; ZSW [6]; DENA [7]; BDEW [8]; VDEW [9]; AGEB [1]; DBFZ [10], IE [11]; some figures are provisional
Figure 6: Electricity generation from renewable energy sources
PART I : THE ENERGY TRANSITION IN GERMANY 13
200
150
100
50
Hydropower Biomass1 Wind energy Photovoltaic
1 Solid and liquid biomass, biogas, biomethane, land�ll gas and sewage gas, sewage sludge and biogenic share of waste2 Electricity generation of the respective technologies in previous years see Figure 6.Geothermal power plants are not shown here because of the very small share involved
1990 2000 2006 2007 2008 2009 2010 2011 2012 2013 2014 2015 2016
18.9
250
2005
63.472.5
89.4 94.3 95.9105.2
124.0
143.0152.3
162.5
188.8 189.7
36.2
2017
216.3
020182
224.7
18.0
50.8
110.0
45.8
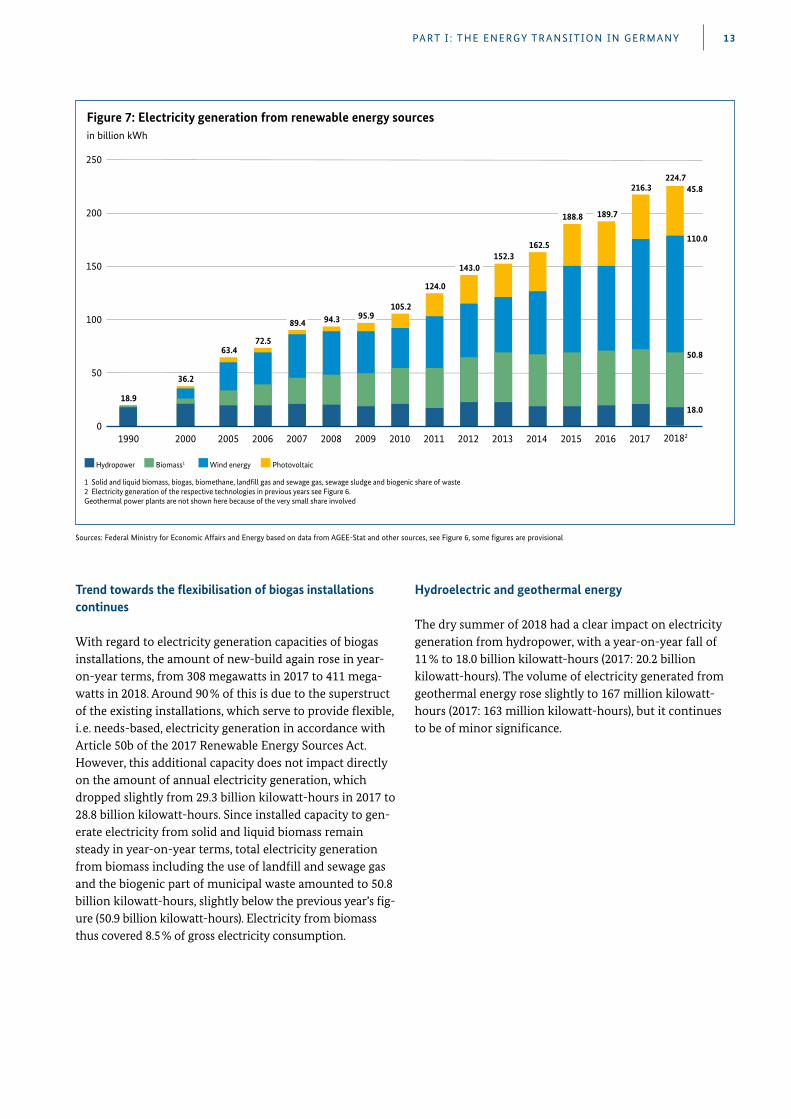
Figure 7: Electricity generation from renewable energy sourcesin billion kWh
Sources: Federal Ministry for Economic Affairs and Energy based on data from AGEE-Stat and other sources, see Figure 6, some figures are provisional
Trend towards the flexibilisation of biogas installations continues
With regard to electricity generation capacities of biogas installations, the amount of new-build again rose in year-on-year terms, from 308 megawatts in 2017 to 411 mega-watts in 2018 . Around 90 % of this is due to the superstruct of the existing installations, which serve to provide flexible, i . e . needs-based, electricity generation in accordance with Article 50b of the 2017 Renewable Energy Sources Act . However, this additional capacity does not impact directly on the amount of annual electricity generation, which dropped slightly from 29 .3 billion kilowatt-hours in 2017 to 28 .8 billion kilowatt-hours . Since installed capacity to gen-erate electricity from solid and liquid biomass remain steady in year-on-year terms, total electricity generation from biomass including the use of landfill and sewage gas and the biogenic part of municipal waste amounted to 50 .8 billion kilowatt-hours, slightly below the previous year’s fig-ure (50 .9 billion kilowatt-hours) . Electricity from biomass thus covered 8 .5 % of gross electricity consumption .
Hydroelectric and geothermal energy
The dry summer of 2018 had a clear impact on electricity generation from hydropower, with a year-on-year fall of 11 % to 18 .0 billion kilowatt-hours (2017: 20 .2 billion kilowatt-hours) . The volume of electricity generated from geothermal energy rose slightly to 167 million kilowatt- hours (2017: 163 million kilowatt-hours), but it continues to be of minor significance .
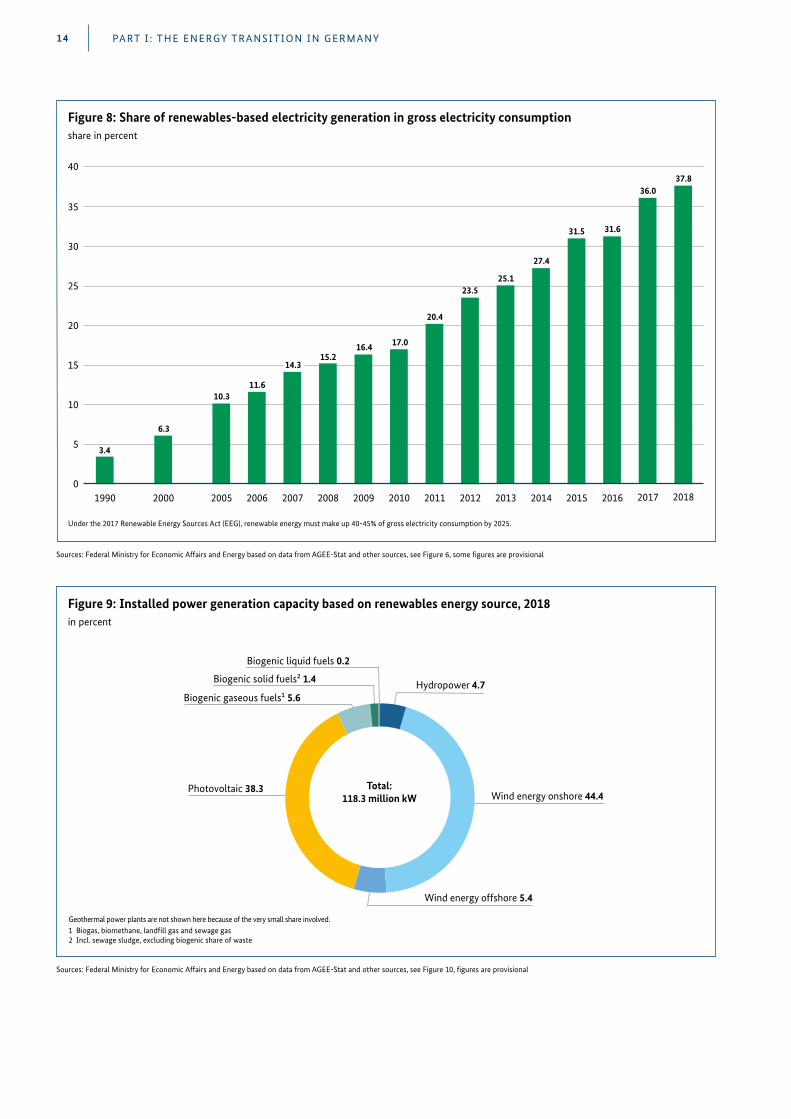
Hydropower 4.7 Biogenic gaseous fuels¹ 5.6
Wind energy onshore 44.4
Biogenic liquid fuels 0.2
Biogenic solid fuels² 1.4
Photovoltaic 38.3
Wind energy offshore 5.4
Total:118.3 million kW
Geothermal power plants are not shown here because of the very small share involved.
1 Biogas, biomethane, land�ll gas and sewage gas2 Incl. sewage sludge, excluding biogenic share of waste
Figure 9: Installed power generation capacity based on renewables energy source, 2018in percent
35
40
30
25
20
15
10
5
2000
6.3
1990
3.4
2005
10.3
2006
11.6
2007
14.3
2008
15.2
2009
16.4
2010
17.0
2011
20.4
2012
23.5
2013
25.1
2014
27.4
2015
31.5
2016
31.6
2017
36.0
Under the 2017 Renewable Energy Sources Act (EEG), renewable energy must make up 40-45% of gross electricity consumption by 2025.
02018
37.8
Figure 8: Share of renewables-based electricity generation in gross electricity consumptionshare in percent
Sources: Federal Ministry for Economic Affairs and Energy based on data from AGEE-Stat and other sources, see Figure 6, some figures are provisional
Sources: Federal Ministry for Economic Affairs and Energy based on data from AGEE-Stat and other sources, see Figure 10, figures are provisional
PART I : THE ENERGY TRANSITION IN GERMANY14
PART I : THE ENERGY TRANSITION IN GERMANY 15
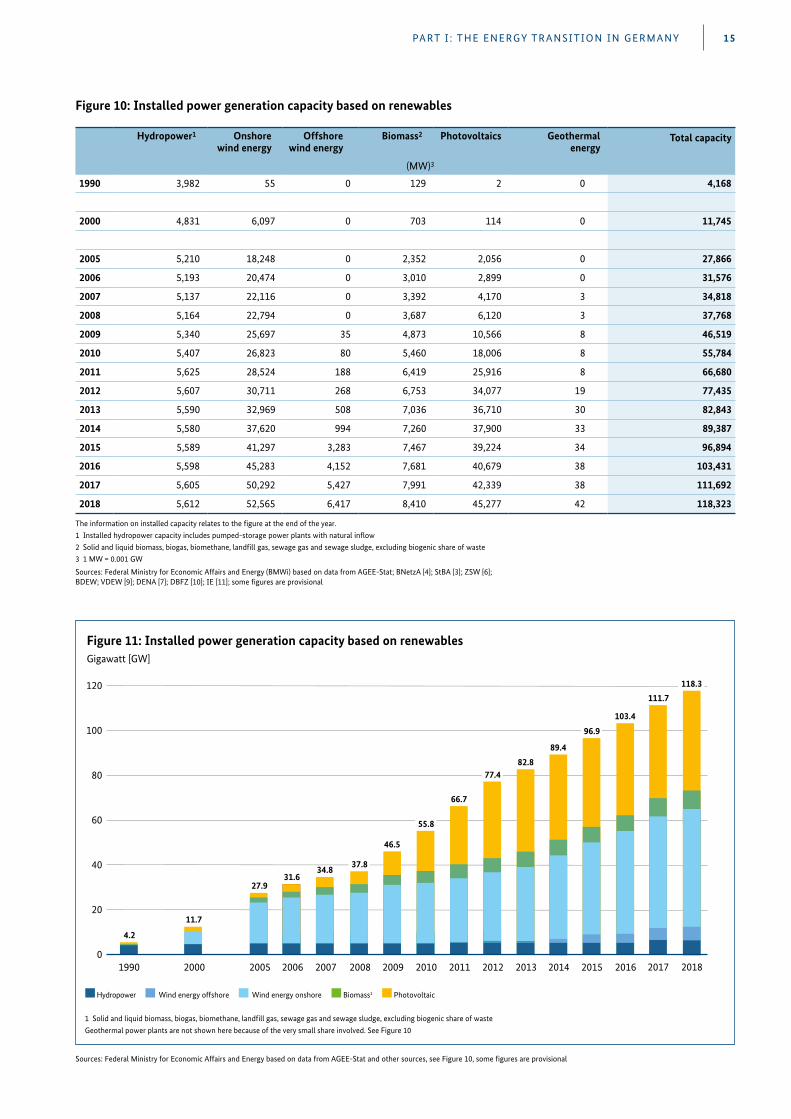
Hydropower1 Onshore wind energy
Offshore wind energy
Biomass2 Photovoltaics Geothermal energy
Total capacity
(MW)3
1990 3,982 55 0 129 2 0 4,168
2000 4,831 6,097 0 703 114 0 11,745
2005 5,210 18,248 0 2,352 2,056 0 27,866
2006 5,193 20,474 0 3,010 2,899 0 31,576
2007 5,137 22,116 0 3,392 4,170 3 34,818
2008 5,164 22,794 0 3,687 6,120 3 37,768
2009 5,340 25,697 35 4,873 10,566 8 46,519
2010 5,407 26,823 80 5,460 18,006 8 55,784
2011 5,625 28,524 188 6,419 25,916 8 66,680
2012 5,607 30,711 268 6,753 34,077 19 77,435
2013 5,590 32,969 508 7,036 36,710 30 82,843
2014 5,580 37,620 994 7,260 37,900 33 89,387
2015 5,589 41,297 3,283 7,467 39,224 34 96,894
2016 5,598 45,283 4,152 7,681 40,679 38 103,431
2017 5,605 50,292 5,427 7,991 42,339 38 111,692
2018 5,612 52,565 6,417 8,410 45,277 42 118,323
The information on installed capacity relates to the figure at the end of the year.1 Installed hydropower capacity includes pumped-storage power plants with natural inflow2 Solid and liquid biomass, biogas, biomethane, landfill gas, sewage gas and sewage sludge, excluding biogenic share of waste3 1 MW = 0.001 GW
Sources: Federal Ministry for Economic Affairs and Energy (BMWi) based on data from AGEE-Stat; BNetzA [4]; StBA [3]; ZSW [6]; BDEW; VDEW [9]; DENA [7]; DBFZ [10]; IE [11]; some figures are provisional
Figure 10: Installed power generation capacity based on renewables
100
80
60
40
20
Hydropower Wind energy offshore Wind energy onshore Biomass1 Photovoltaic
1 Solid and liquid biomass, biogas, biomethane, land�ll gas, sewage gas and sewage sludge, excluding biogenic share of waste Geothermal power plants are not shown here because of the very small share involved. See Figure 10
1990
4.2
120
02000
11.7
2005
27.9
2006
31.6
2007
34.8
2008
37.8
2009
46.5
2010
55.8
2011
66.7
2012
77.4
2013
82.8
2014
89.4
2015
96.9
2016
103.4
111.7
2017 2018
118.3
Figure 11: Installed power generation capacity based on renewablesGigawatt [GW]
Sources: Federal Ministry for Economic Affairs and Energy based on data from AGEE-Stat and other sources, see Figure 10, some figures are provisional
Sources: Federal Ministry for Economic Affairs and Energy based on data from AGEE-Stat and other sources, see Figure 14, provisional data
Heat
Share of renewables in heat consumption rises, mainly due to the weather
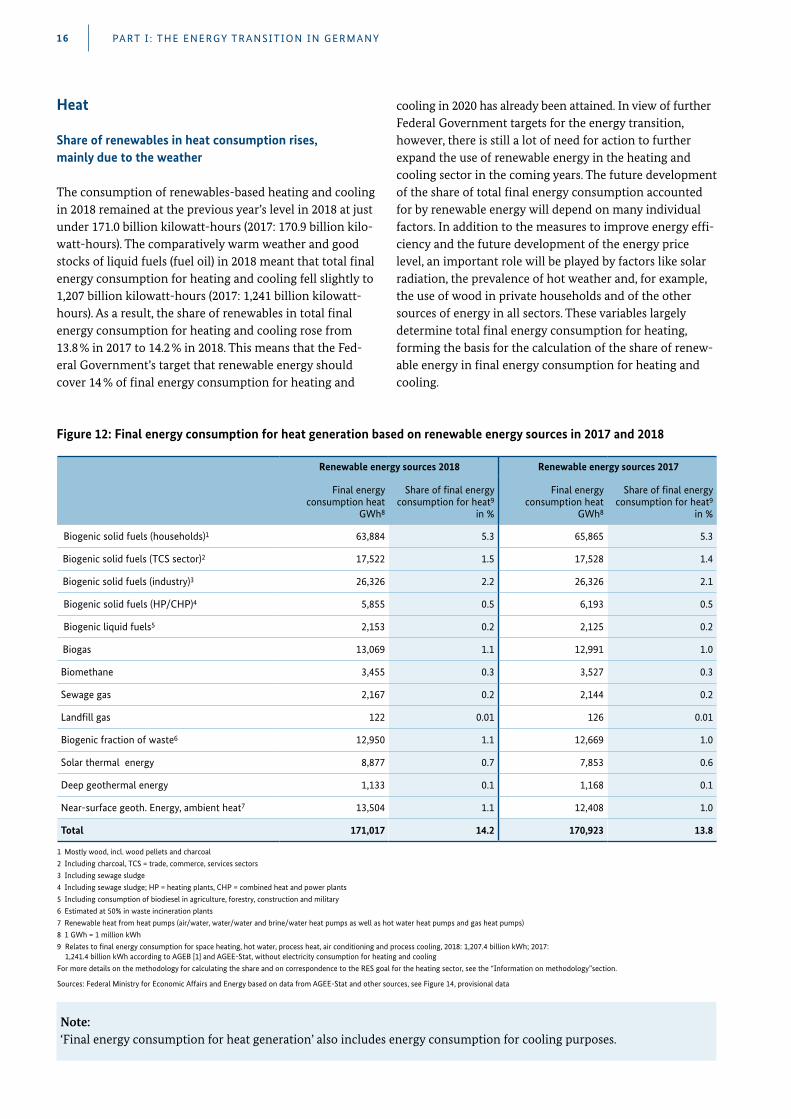
The consumption of renewables-based heating and cooling in 2018 remained at the previous year’s level in 2018 at just under 171 .0 billion kilowatt-hours (2017: 170 .9 billion kilo-watt-hours) . The comparatively warm weather and good stocks of liquid fuels (fuel oil) in 2018 meant that total final energy consumption for heating and cooling fell slightly to 1,207 billion kilowatt-hours (2017: 1,241 billion kilowatt- hours) . As a result, the share of renewables in total final energy consumption for heating and cooling rose from 13 .8 % in 2017 to 14 .2 % in 2018 . This means that the Fed-eral Government’s target that renewable energy should cover 14 % of final energy consumption for heating and
cooling in 2020 has already been attained . In view of further Federal Government targets for the energy transition, however, there is still a lot of need for action to further expand the use of renewable energy in the heating and cooling sector in the coming years . The future development of the share of total final energy consumption accounted for by renewable energy will depend on many individual factors . In addition to the measures to improve energy effi-ciency and the future development of the energy price level, an important role will be played by factors like solar radiation, the prevalence of hot weather and, for example, the use of wood in private households and of the other sources of energy in all sectors . These variables largely determine total final energy consumption for heating, forming the basis for the calculation of the share of renew-able energy in final energy consumption for heating and cooling .
Note: ‘Final energy consumption for heat generation’ also includes energy consumption for cooling purposes .
Renewable energy sources 2018 Renewable energy sources 2017
Final energy consumption heat
GWh8
Share of final energy consumption for heat9
in %
Final energy consumption heat
GWh8
Share of final energy consumption for heat9
in %
Biogenic solid fuels (households)1 63,884 5.3 65,865 5.3
Biogenic solid fuels (TCS sector)2 17,522 1.5 17,528 1.4
Biogenic solid fuels (industry)3 26,326 2.2 26,326 2.1
Biogenic solid fuels (HP/CHP)4 5,855 0.5 6,193 0.5
Biogenic liquid fuels5 2,153 0.2 2,125 0.2
Biogas 13,069 1.1 12,991 1.0
Biomethane 3,455 0.3 3,527 0.3
Sewage gas 2,167 0.2 2,144 0.2
Landfill gas 122 0.01 126 0.01
Biogenic fraction of waste6 12,950 1.1 12,669 1.0
Solar thermal energy 8,877 0.7 7,853 0.6
Deep geothermal energy 1,133 0.1 1,168 0.1
Near-surface geoth. Energy, ambient heat7 13,504 1.1 12,408 1.0
Total 171,017 14.2 170,923 13.8
1 Mostly wood, incl. wood pellets and charcoal2 Including charcoal, TCS = trade, commerce, services sectors3 Including sewage sludge4 Including sewage sludge; HP = heating plants, CHP = combined heat and power plants5 Including consumption of biodiesel in agriculture, forestry, construction and military6 Estimated at 50% in waste incineration plants7 Renewable heat from heat pumps (air/water, water/water and brine/water heat pumps as well as hot water heat pumps and gas heat pumps)8 1 GWh = 1 million kWh9 Relates to final energy consumption for space heating, hot water, process heat, air conditioning and process cooling, 2018: 1,207.4 billion kWh; 2017:
1,241.4 billion kWh according to AGEB [1] and AGEE-Stat, without electricity consumption for heating and coolingFor more details on the methodology for calculating the share and on correspondence to the RES goal for the heating sector, see the “Information on methodology”section.
Figure 12: Final energy consumption for heat generation based on renewable energy sources in 2017 and 2018
PART I : THE ENERGY TRANSITION IN GERMANY16
PART I : THE ENERGY TRANSITION IN GERMANY 17
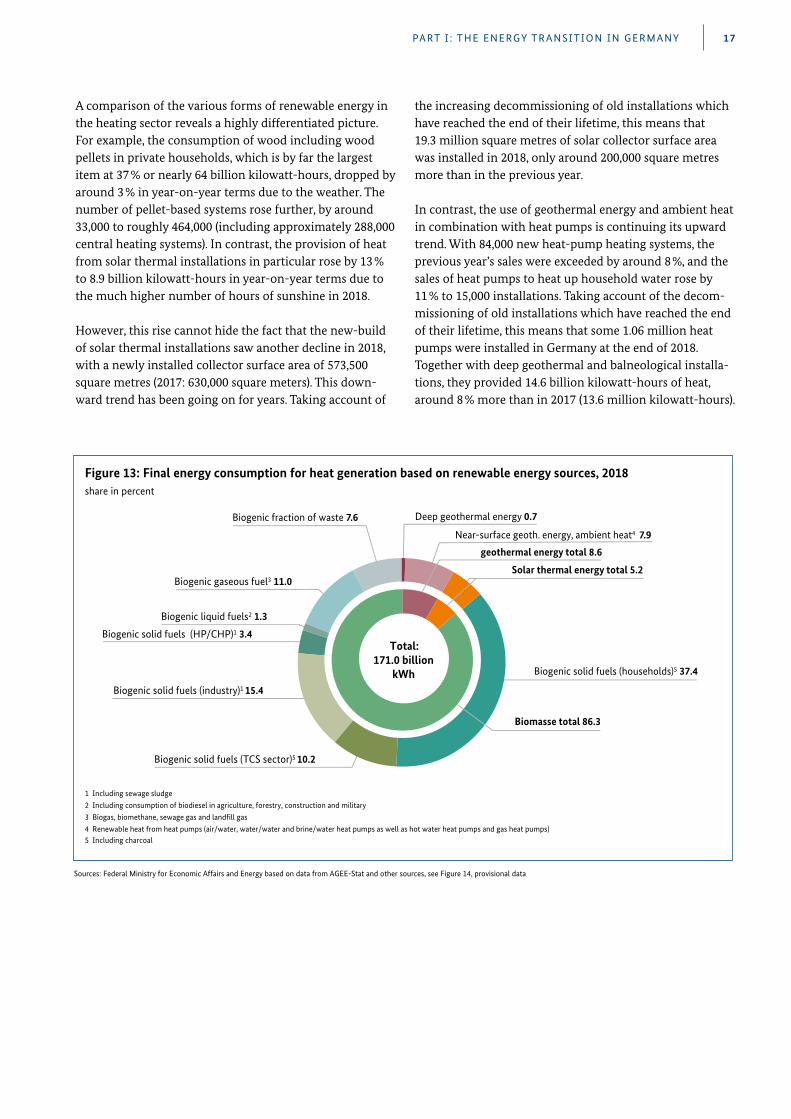
A comparison of the various forms of renewable energy in the heating sector reveals a highly differentiated picture . For example, the consumption of wood including wood pellets in private households, which is by far the largest item at 37 % or nearly 64 billion kilowatt-hours, dropped by around 3 % in year-on-year terms due to the weather . The number of pellet-based systems rose further, by around 33,000 to roughly 464,000 (including approximately 288,000 central heating systems) . In contrast, the provision of heat from solar thermal installations in particular rose by 13 % to 8 .9 billion kilowatt-hours in year-on-year terms due to the much higher number of hours of sunshine in 2018 .
However, this rise cannot hide the fact that the new-build of solar thermal installations saw another decline in 2018, with a newly installed collector surface area of 573,500 square metres (2017: 630,000 square meters) . This down-ward trend has been going on for years . Taking account of
the increasing decommissioning of old installations which have reached the end of their lifetime, this means that 19 .3 million square metres of solar collector surface area was installed in 2018, only around 200,000 square metres more than in the previous year .
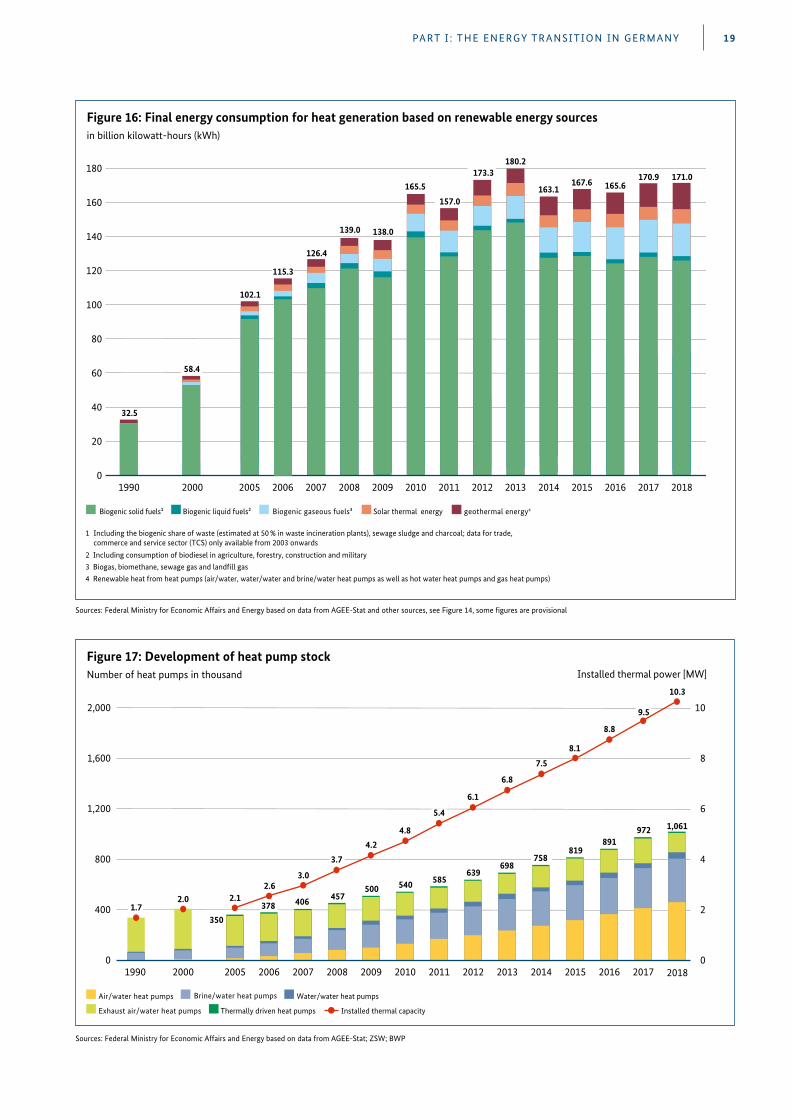
In contrast, the use of geothermal energy and ambient heat in combination with heat pumps is continuing its upward trend . With 84,000 new heat-pump heating systems, the previous year’s sales were exceeded by around 8 %, and the sales of heat pumps to heat up household water rose by 11 % to 15,000 installations . Taking account of the decom-missioning of old installations which have reached the end of their lifetime, this means that some 1 .06 million heat pumps were installed in Germany at the end of 2018 . Together with deep geothermal and balneological installa-tions, they provided 14 .6 billion kilowatt-hours of heat, around 8 % more than in 2017 (13 .6 million kilowatt-hours) .
Biogenic solid fuels (industry)1 15.4
Near-surface geoth. energy, ambient heat4 7.9
Biogenic fraction of waste 7.6
Biogenic solid fuels (HP/CHP)1 3.4
Biogenic solid fuels (households)5 37.4
Biogenic liquid fuels2 1.3
Biogenic gaseous fuel3 11.0
Deep geothermal energy 0.7
Biomasse total 86.3
Solar thermal energy total 5.2
geothermal energy total 8.6
Biogenic solid fuels (TCS sector)5 10.2
Total:171.0 billion
kWh
1 Including sewage sludge2 Including consumption of biodiesel in agriculture, forestry, construction and military3 Biogas, biomethane, sewage gas and land�ll gas4 Renewable heat from heat pumps (air/water, water/water and brine/water heat pumps as well as hot water heat pumps and gas heat pumps) 5 Including charcoal
Figure 13: Final energy consumption for heat generation based on renewable energy sources, 2018share in percent
Sources: Federal Ministry for Economic Affairs and Energy based on data from AGEE-Stat and other sources, see Figure 14, provisional data
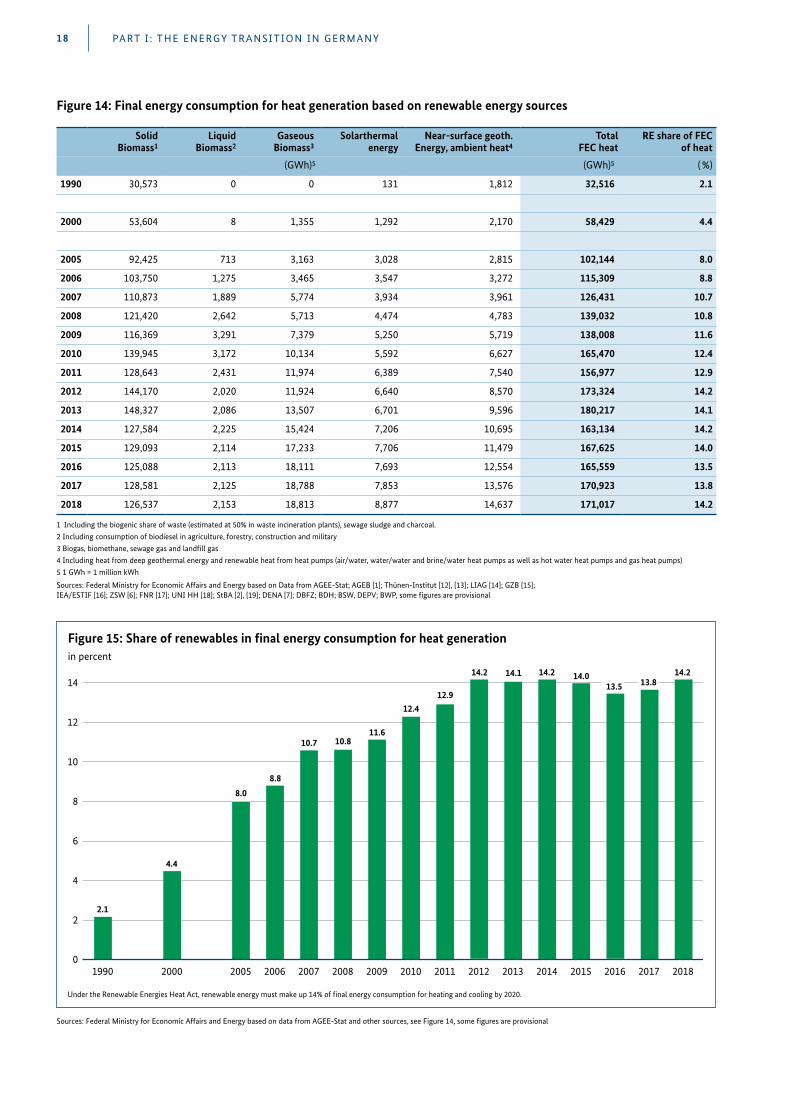
Solid Biomass1
Liquid Biomass2
Gaseous Biomass3
Solarthermal energy
Near-surface geoth. Energy, ambient heat4
Total FEC heat
RE share of FEC of heat
(GWh)5 (GWh)5 ( %)
1990 30,573 0 0 131 1,812 32,516 2.1
2000 53,604 8 1,355 1,292 2,170 58,429 4.4
2005 92,425 713 3,163 3,028 2,815 102,144 8.0
2006 103,750 1,275 3,465 3,547 3,272 115,309 8.8
2007 110,873 1,889 5,774 3,934 3,961 126,431 10.7
2008 121,420 2,642 5,713 4,474 4,783 139,032 10.8
2009 116,369 3,291 7,379 5,250 5,719 138,008 11.6
2010 139,945 3,172 10,134 5,592 6,627 165,470 12.4
2011 128,643 2,431 11,974 6,389 7,540 156,977 12.9
2012 144,170 2,020 11,924 6,640 8,570 173,324 14.2
2013 148,327 2,086 13,507 6,701 9,596 180,217 14.1
2014 127,584 2,225 15,424 7,206 10,695 163,134 14.2
2015 129,093 2,114 17,233 7,706 11,479 167,625 14.0
2016 125,088 2,113 18,111 7,693 12,554 165,559 13.5
2017 128,581 2,125 18,788 7,853 13,576 170,923 13.8
2018 126,537 2,153 18,813 8,877 14,637 171,017 14.2
1 Including the biogenic share of waste (estimated at 50% in waste incineration plants), sewage sludge and charcoal.2 Including consumption of biodiesel in agriculture, forestry, construction and military3 Biogas, biomethane, sewage gas and landfill gas4 Including heat from deep geothermal energy and renewable heat from heat pumps (air/water, water/water and brine/water heat pumps as well as hot water heat pumps and gas heat pumps)5 1 GWh = 1 million kWh
Figure 14: Final energy consumption for heat generation based on renewable energy sources
PART I : THE ENERGY TRANSITION IN GERMANY18
Sources: Federal Ministry for Economic Affairs and Energy based on Data from AGEE-Stat; AGEB [1]; Thünen-Institut [12], [13]; LIAG [14]; GZB [15]; IEA/ESTIF [16]; ZSW [6]; FNR [17]; UNI HH [18]; StBA [2], [19]; DENA [7]; DBFZ; BDH; BSW, DEPV; BWP, some figures are provisional
14
12
10
8
6
4
2
2000
4.4
1990
2.1
2005
8.0
10.7
2007 2009
11.6
2010
12.4
2011
12.9
2012
14.2
2013
14.1
2014
14.2
2015
14.0
Under the Renewable Energies Heat Act, renewable energy must make up 14% of �nal energy consumption for heating and cooling by 2020.
2006
8.8
2008
10.8
2016
13.5 13.8
20170
14.2
2018
Figure 15: Share of renewables in final energy consumption for heat generationin percent
Sources: Federal Ministry for Economic Affairs and Energy based on data from AGEE-Stat and other sources, see Figure 14, some figures are provisional
PART I : THE ENERGY TRANSITION IN GERMANY 19
2010
165.5
Biogenic solid fuels¹ Biogenic liquid fuels² Biogenic gaseous fuels³ Solar thermal energy geothermal energy4
1 Including the biogenic share of waste (estimated at 50 % in waste incineration plants), sewage sludge and charcoal; data for trade, commerce and service sector (TCS) only available from 2003 onwards
2 Including consumption of biodiesel in agriculture, forestry, construction and military3 Biogas, biomethane, sewage gas and land�ll gas4 Renewable heat from heat pumps (air/water, water/water and brine/water heat pumps as well as hot water heat pumps and gas heat pumps)
180
160
140
120
100
80
60
40
20
1990
32.5
2000
58.4
2006
102.1
2005 2007
126.4
2008
139.0
2009
138.0
2011
157.0
2012
173.3
2013
180.2
2014
163.1
2015
167.6
2016
165.6
02017
170.9
2018
171.0
115.3
Figure 16: Final energy consumption for heat generation based on renewable energy sourcesin billion kilowatt-hours (kWh)
Sources: Federal Ministry for Economic Affairs and Energy based on data from AGEE-Stat and other sources, see Figure 14, some figures are provisional
2,000 10
1,600 8
1,200 6
800 4
400 2
Air/water heat pumps Water/water heat pumps
1990 2000 2006 2007 2008 2009 2010 2011 2012 2013 2014 2015 20162005
Exhaust air/water heat pumps Thermally driven heat pumps ● Installed thermal capacity
2.0 2.1378 406 457
500 540 585639
698758
819891
●
●●
●
●
●
●
●
●
●
●
●
2.63.0
3.7
4.2
4.8
5.4
6.1
6.8
7.5
8.1
8.8
350●
Installed thermal power [MW]
●
2017
972
9.5
1.7
●
0 02018
1,061
10.3●
Brine/water heat pumps
Figure 17: Development of heat pump stockNumber of heat pumps in thousand
Sources: Federal Ministry for Economic Affairs and Energy based on data from AGEE-Stat; ZSW; BWP
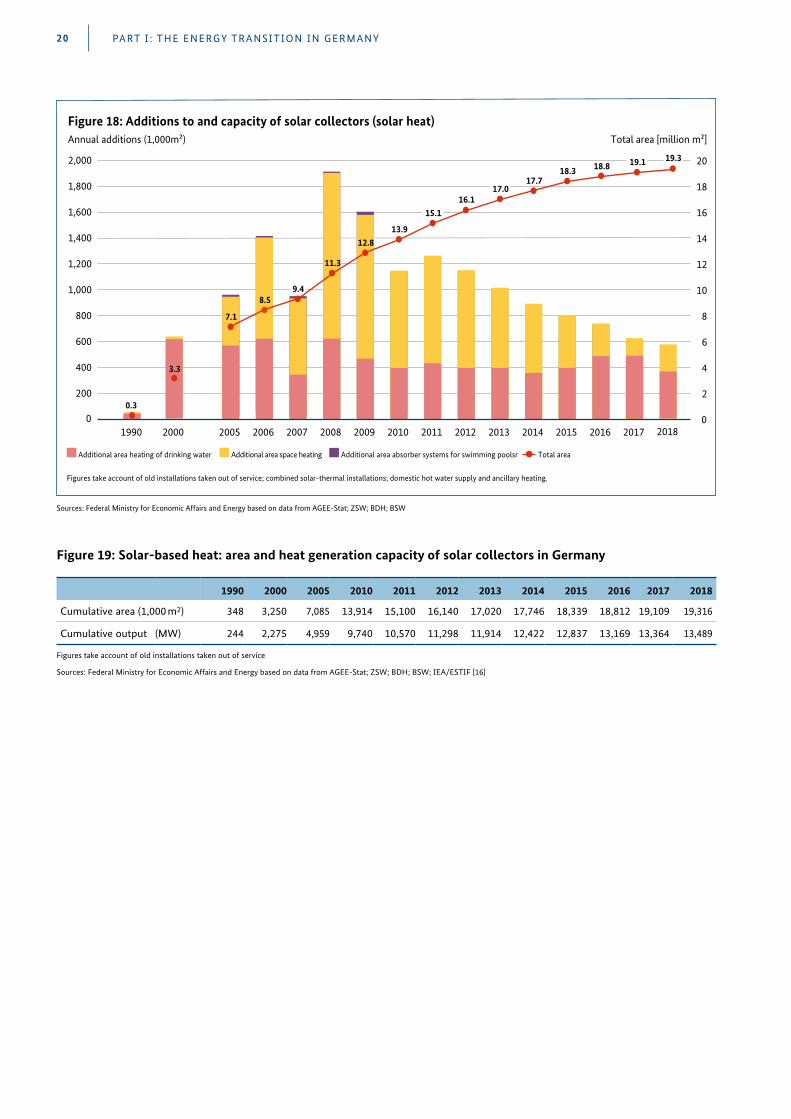
1990 2000 2005 2010 2011 2012 2013 2014 2015 2016 2017 2018
Cumulative area (1,000 m2) 348 3,250 7,085 13,914 15,100 16,140 17,020 17,746 18,339 18,812 19,109 19,316
Cumulative output (MW) 244 2,275 4,959 9,740 10,570 11,298 11,914 12,422 12,837 13,169 13,364 13,489
Figures take account of old installations taken out of service
Sources: Federal Ministry for Economic Affairs and Energy based on data from AGEE-Stat; ZSW; BDH; BSW; IEA/ESTIF [16]
Figure 19: Solar-based heat: area and heat generation capacity of solar collectors in Germany
2,000
1,800
1,600
1,400
1,200
1,000
800
600
400
200
Additional area heating of drinking water Additional area space heating Additional area absorber systems for swimming poolsr ● Total area
Figures take account of old installations taken out of service; combined solar-thermal installations; domestic hot water supply and ancillary heating.
20
18
16
14
12
10
8
6
4
2
1990 2000 2006 2007 2008 2009 2010 2011 2012 2013 2014 2015 2016
0.3
20050 0●
●3.3
●7.1
●8.5
9.4
●11.3
12.8 ●13.9
●
●16.1
17.0 ●17.7 ●
18.3 18.8●
●
●
●
Total area [million m²]
2017
19.1●
2018
●19.3
15.1
Figure 18: Additions to and capacity of solar collectors (solar heat)Annual additions (1,000m²)
Sources: Federal Ministry for Economic Affairs and Energy based on data from AGEE-Stat; ZSW; BDH; BSW
PART I : THE ENERGY TRANSITION IN GERMANY20
PART I : THE ENERGY TRANSITION IN GERMANY 21
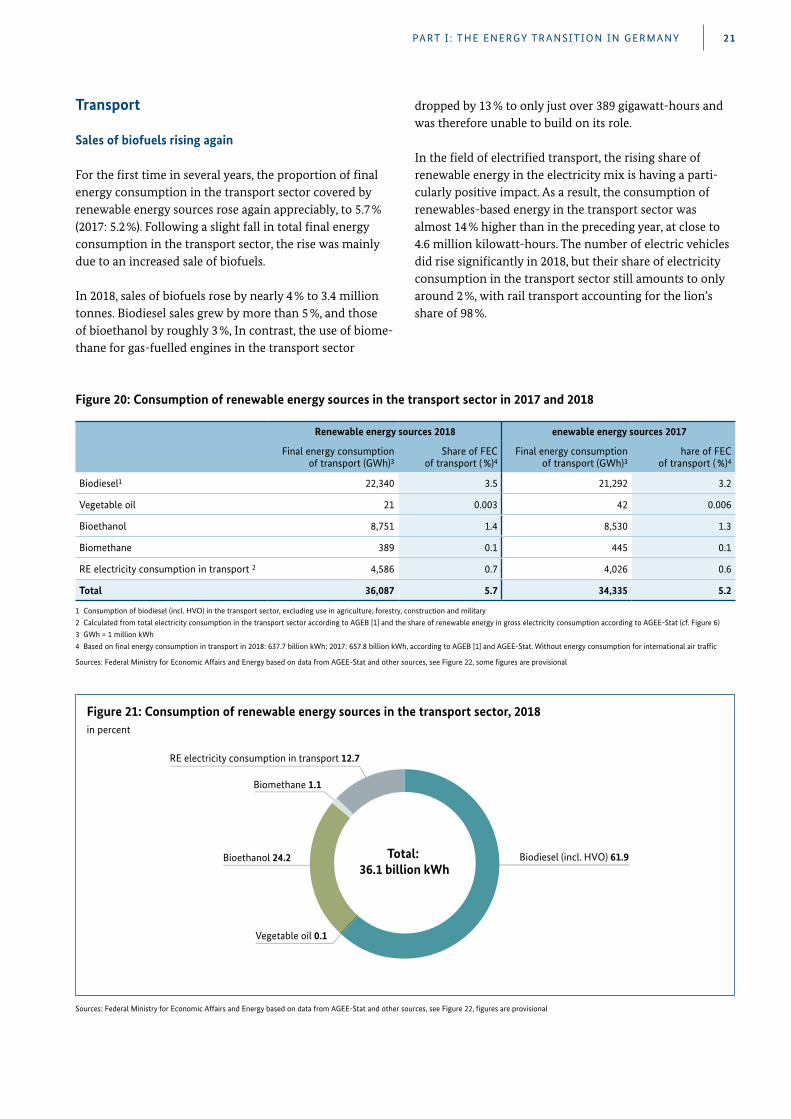
Transport
Sales of biofuels rising again
For the first time in several years, the proportion of final energy consumption in the transport sector covered by renewable energy sources rose again appreciably, to 5 .7 % (2017: 5 .2 %) . Following a slight fall in total final energy consumption in the transport sector, the rise was mainly due to an increased sale of biofuels .
In 2018, sales of biofuels rose by nearly 4 % to 3 .4 million tonnes . Biodiesel sales grew by more than 5 %, and those of bioethanol by roughly 3 %, In contrast, the use of biome-thane for gas-fuelled engines in the transport sector
dropped by 13 % to only just over 389 gigawatt-hours and was therefore unable to build on its role .
In the field of electrified transport, the rising share of renewable energy in the electricity mix is having a parti-cularly positive impact . As a result, the consumption of renewables-based energy in the transport sector was almost 14 % higher than in the preceding year, at close to 4 .6 million kilowatt-hours . The number of electric vehicles did rise significantly in 2018, but their share of electricity consumption in the transport sector still amounts to only around 2 %, with rail transport accounting for the lion’s share of 98 % .
Renewable energy sources 2018 enewable energy sources 2017
Final energy consumption of transport (GWh)3
Share of FEC of transport ( %)4
Final energy consumption of transport (GWh)3
hare of FEC of transport ( %)4
Biodiesel1 22,340 3.5 21,292 3.2
Vegetable oil 21 0.003 42 0.006
Bioethanol 8,751 1.4 8,530 1.3
Biomethane 389 0.1 445 0.1
RE electricity consumption in transport 2 4,586 0.7 4,026 0.6
Total 36,087 5.7 34,335 5.2
1 Consumption of biodiesel (incl. HVO) in the transport sector, excluding use in agriculture, forestry, construction and military2 Calculated from total electricity consumption in the transport sector according to AGEB [1] and the share of renewable energy in gross electricity consumption according to AGEE-Stat (cf. Figure 6)3 GWh = 1 million kWh4 Based on final energy consumption in transport in 2018: 637.7 billion kWh; 2017: 657.8 billion kWh, according to AGEB [1] and AGEE-Stat. Without energy consumption for international air traffic
Figure 20: Consumption of renewable energy sources in the transport sector in 2017 and 2018
Sources: Federal Ministry for Economic Affairs and Energy based on data from AGEE-Stat and other sources, see Figure 22, some figures are provisional
Total: 36.1 billion kWh
Biodiesel (incl. HVO) 61.9 Bioethanol 24.2Bioethanol 24.2
Vegetable oil 0.1
Biomethane 1.1
RE electricity consumption in transport 12.7
Figure 21: Consumption of renewable energy sources in the transport sector, 2018in percent
Sources: Federal Ministry for Economic Affairs and Energy based on data from AGEE-Stat and other sources, see Figure 22, figures are provisional
PART I : THE ENERGY TRANSITION IN GERMANY22
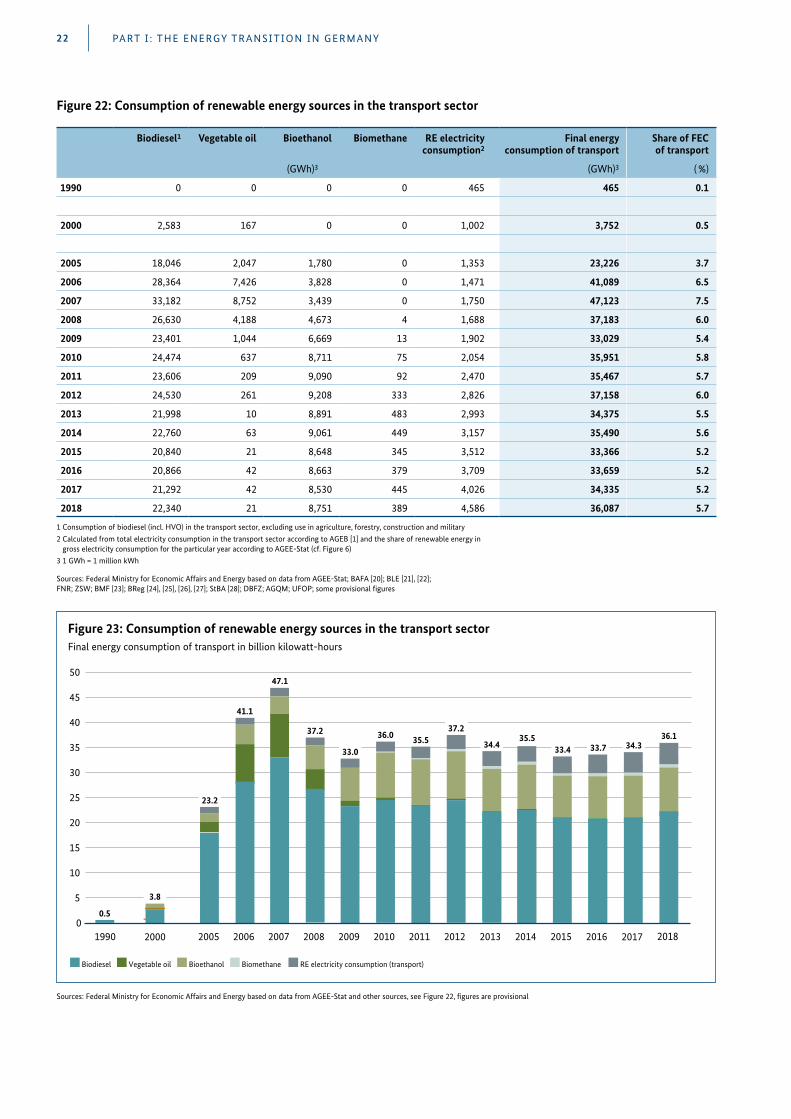
Biodiesel1 Vegetable oil Bioethanol Biomethane RE electricity consumption2
Final energy consumption of transport
Share of FEC of transport
(GWh)3 (GWh)3 ( %)
1990 0 0 0 0 465 465 0.1
2000 2,583 167 0 0 1,002 3,752 0.5
2005 18,046 2,047 1,780 0 1,353 23,226 3.7
2006 28,364 7,426 3,828 0 1,471 41,089 6.5
2007 33,182 8,752 3,439 0 1,750 47,123 7.5
2008 26,630 4,188 4,673 4 1,688 37,183 6.0
2009 23,401 1,044 6,669 13 1,902 33,029 5.4
2010 24,474 637 8,711 75 2,054 35,951 5.8
2011 23,606 209 9,090 92 2,470 35,467 5.7
2012 24,530 261 9,208 333 2,826 37,158 6.0
2013 21,998 10 8,891 483 2,993 34,375 5.5
2014 22,760 63 9,061 449 3,157 35,490 5.6
2015 20,840 21 8,648 345 3,512 33,366 5.2
2016 20,866 42 8,663 379 3,709 33,659 5.2
2017 21,292 42 8,530 445 4,026 34,335 5.2
2018 22,340 21 8,751 389 4,586 36,087 5.7
1 Consumption of biodiesel (incl. HVO) in the transport sector, excluding use in agriculture, forestry, construction and military2 Calculated from total electricity consumption in the transport sector according to AGEB [1] and the share of renewable energy in
gross electricity consumption for the particular year according to AGEE-Stat (cf. Figure 6)3 1 GWh = 1 million kWh
Figure 22: Consumption of renewable energy sources in the transport sector
Sources: Federal Ministry for Economic Affairs and Energy based on data from AGEE-Stat; BAFA [20]; BLE [21], [22]; FNR; ZSW; BMF [23]; BReg [24], [25], [26], [27]; StBA [28]; DBFZ; AGQM; UFOP; some provisional figures
50
45
40
35
30
25
20
15
10
5
1990
41.1
2006
47.1
2007
37.2
2008
33.0
2009
36.0
2010
33.4
2015
23.2
20052000
0.5
3.8
Biodiesel Vegetable oil Bioethanol Biomethane RE electricity consumption (transport)
02012
37.2
34.4
2013
35.5
2014
33.7
2016
35.5
2011
34.3
2017
36.1
2018
Figure 23: Consumption of renewable energy sources in the transport sectorFinal energy consumption of transport in billion kilowatt-hours
Sources: Federal Ministry for Economic Affairs and Energy based on data from AGEE-Stat and other sources, see Figure 22, figures are provisional
PART I : THE ENERGY TRANSITION IN GERMANY 23
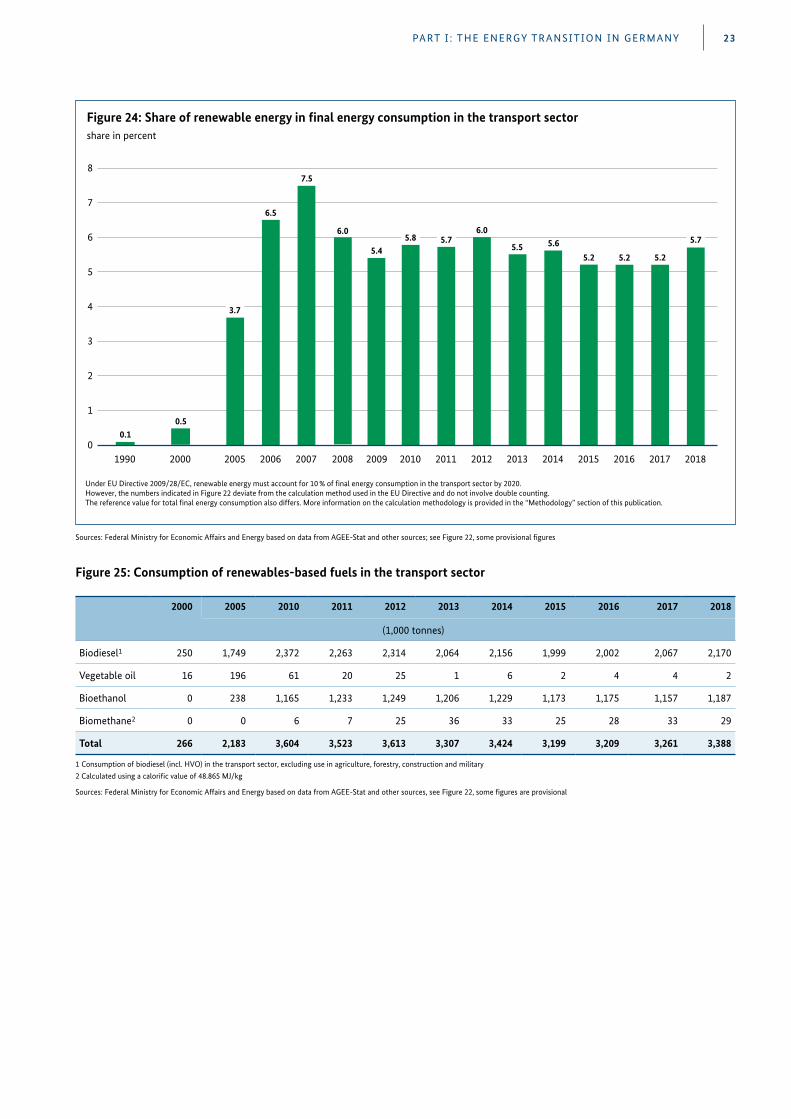
8
7
6
5
4
3
2
1
2000
0.5
1990
0.1
2005
3.7
2006
6.5
2007
7.5
2008
6.0
2009
5.4
2010
5.8
2012
6.0
2013
5.5
2014
5.6
Under EU Directive 2009/28/EC, renewable energy must account for 10 % of �nal energy consumption in the transport sector by 2020. However, the numbers indicated in Figure 22 deviate from the calculation method used in the EU Directive and do not involve double counting. The reference value for total �nal energy consumption also differs. More information on the calculation methodology is provided in the “Methodology” section of this publication.
2015
5.2
2016
5.2
2017
5.2
02011
5.7
2018
5.7
Figure 24: Share of renewable energy in final energy consumption in the transport sectorshare in percent
Sources: Federal Ministry for Economic Affairs and Energy based on data from AGEE-Stat and other sources; see Figure 22, some provisional figures
2000 2005 2010 2011 2012 2013 2014 2015 2016 2017 2018
(1,000 tonnes)
Biodiesel1 250 1,749 2,372 2,263 2,314 2,064 2,156 1,999 2,002 2,067 2,170
Vegetable oil 16 196 61 20 25 1 6 2 4 4 2
Bioethanol 0 238 1,165 1,233 1,249 1,206 1,229 1,173 1,175 1,157 1,187
Biomethane2 0 0 6 7 25 36 33 25 28 33 29
Total 266 2,183 3,604 3,523 3,613 3,307 3,424 3,199 3,209 3,261 3,388
1 Consumption of biodiesel (incl. HVO) in the transport sector, excluding use in agriculture, forestry, construction and military2 Calculated using a calorific value of 48.865 MJ/kg
Sources: Federal Ministry for Economic Affairs and Energy based on data from AGEE-Stat and other sources, see Figure 22, some figures are provisional
Figure 25: Consumption of renewables-based fuels in the transport sector
PART I : THE ENERGY TRANSITION IN GERMANY24
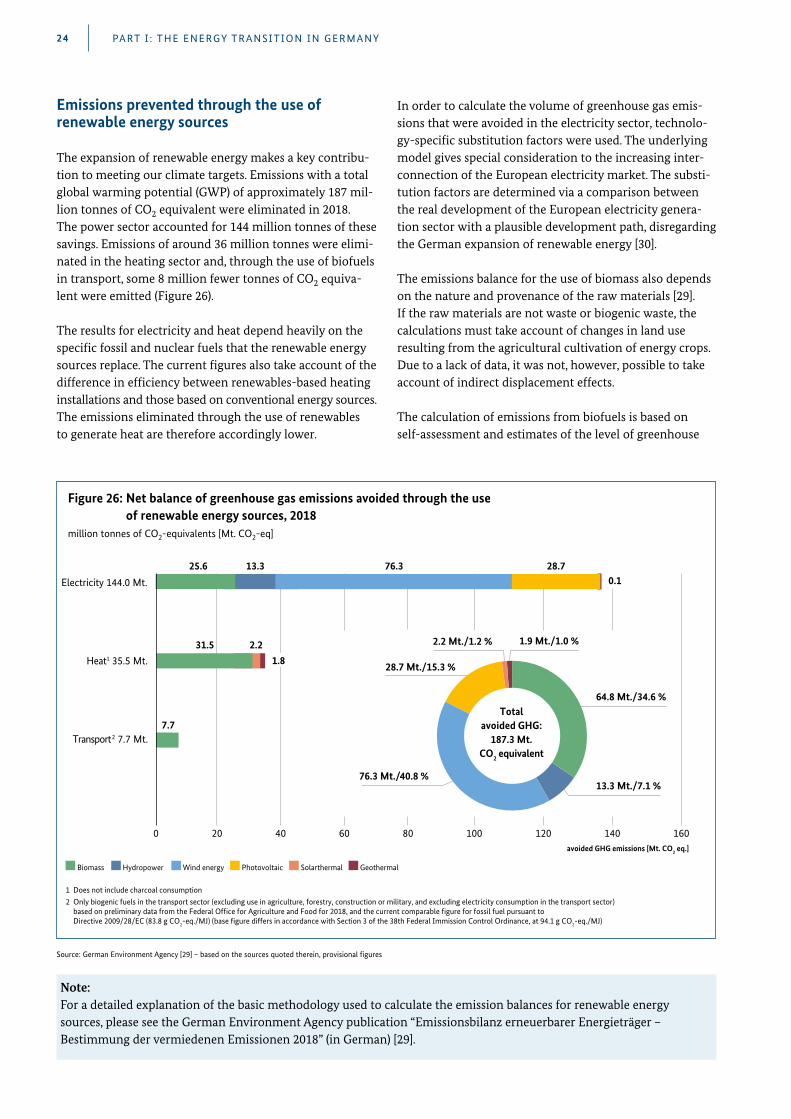
64.8 Mt./34.6 %
13.3 Mt./7.1 %
28.7 Mt./15.3 %
12020 40
Electricity 144.0 Mt.
Heat1 35.5 Mt.
Transport2 7.7 Mt.
Biomass Hydropower Wind energy Photovoltaic Solarthermal Geothermal
60 80 100
25.6 13.3 76.3 28.7
31.5 2.2
7.7 Total
avoided GHG:187.3 Mt.
CO2 equivalent
1.9 Mt./1.0 % 2.2 Mt./1.2 %
76.3 Mt./40.8 %
1600 140
1.8
0.1
1 Does not include charcoal consumption 2 Only biogenic fuels in the transport sector (excluding use in agriculture, forestry, construction or military, and excluding electricity consumption in the transport sector)
based on preliminary data from the Federal Of�ce for Agriculture and Food for 2018, and the current comparable �gure for fossil fuel pursuant to Directive 2009/28/EC (83.8 g CO2-eq./MJ) (base �gure differs in accordance with Section 3 of the 38th Federal Immission Control Ordinance, at 94.1 g CO2-eq./MJ)
avoided GHG emissions [Mt. CO2 eq.]
Emissions prevented through the use of renewable energy sources
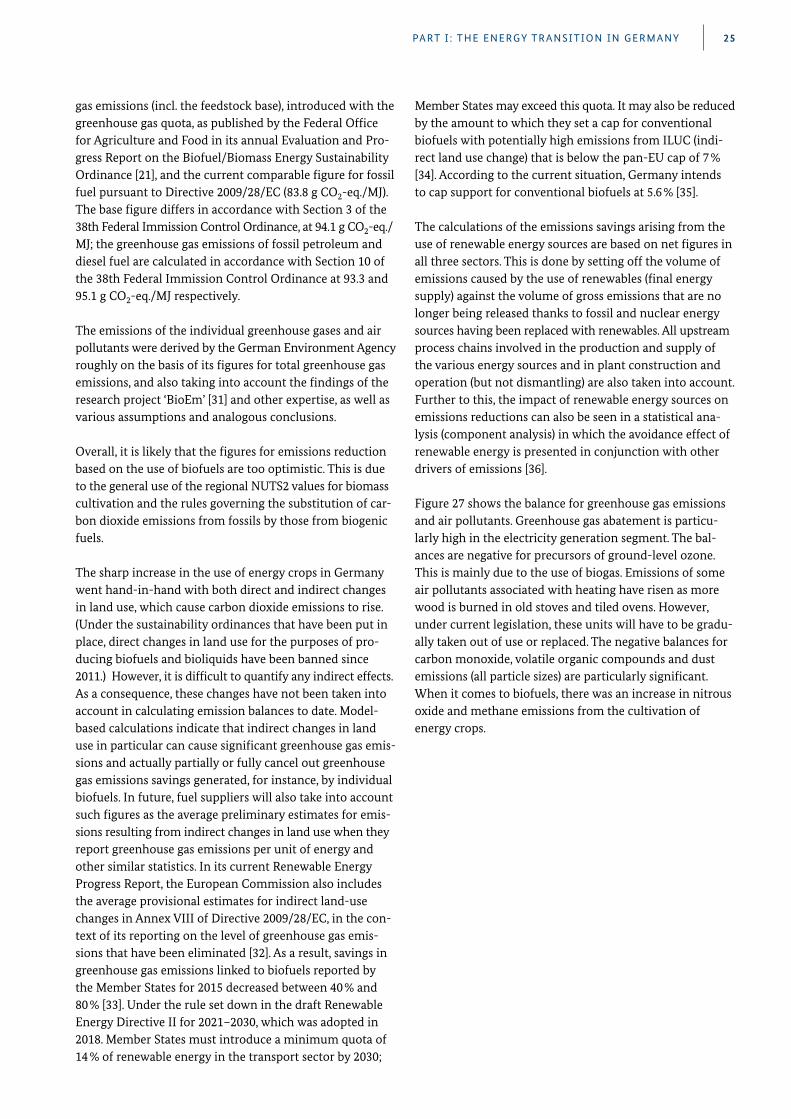
The expansion of renewable energy makes a key contribu-tion to meeting our climate targets . Emissions with a total global warming potential (GWP) of approximately 187 mil-lion tonnes of CO2 equivalent were eliminated in 2018 . The power sector accounted for 144 million tonnes of these savings . Emissions of around 36 million tonnes were elimi-nated in the heating sector and, through the use of biofuels in transport, some 8 million fewer tonnes of CO2 equiva-lent were emitted (Figure 26) .
The results for electricity and heat depend heavily on the specific fossil and nuclear fuels that the renewable energy sources replace . The current figures also take account of the difference in efficiency between renewables-based heating installations and those based on conventional energy sources . The emissions eliminated through the use of renewables to generate heat are therefore accordingly lower .
Note: For a detailed explanation of the basic methodology used to calculate the emission balances for renewable energy sources, please see the German Environment Agency publication “Emissionsbilanz erneuerbarer Energieträger – Bestimmung der vermiedenen Emissionen 2018” (in German) [29] .
Figure 26: Net balance of greenhouse gas emissions avoided through the use of renewable energy sources, 2018
million tonnes of CO2-equivalents [Mt. CO2-eq]
Source: German Environment Agency [29] – based on the sources quoted therein, provisional figures
In order to calculate the volume of greenhouse gas emis-sions that were avoided in the electricity sector, technolo-gy-specific substitution factors were used . The underlying model gives special consideration to the increasing inter-connection of the European electricity market . The substi-tution factors are determined via a comparison between the real development of the European electricity genera-tion sector with a plausible development path, disregarding the German expansion of renewable energy [30] .
The emissions balance for the use of biomass also depends on the nature and provenance of the raw materials [29] . If the raw materials are not waste or biogenic waste, the calculations must take account of changes in land use resulting from the agricultural cultivation of energy crops . Due to a lack of data, it was not, however, possible to take account of indirect displacement effects .
The calculation of emissions from biofuels is based on self-assessment and estimates of the level of greenhouse
PART I : THE ENERGY TRANSITION IN GERMANY 25
gas emissions (incl . the feedstock base), introduced with the greenhouse gas quota, as published by the Federal Office for Agriculture and Food in its annual Evaluation and Pro-gress Report on the Biofuel/Biomass Energy Sustainability Ordinance [21], and the current comparable figure for fossil fuel pursuant to Directive 2009/28/EC (83 .8 g CO2-eq ./MJ) . The base figure differs in accordance with Section 3 of the 38th Federal Immission Control Ordinance, at 94 .1 g CO2-eq ./MJ; the greenhouse gas emissions of fossil petroleum and diesel fuel are calculated in accordance with Section 10 of the 38th Federal Immission Control Ordinance at 93 .3 and 95 .1 g CO2-eq ./MJ respectively .
The emissions of the individual greenhouse gases and air pollutants were derived by the German Environment Agency roughly on the basis of its figures for total greenhouse gas emissions, and also taking into account the findings of the research project ‘BioEm’ [31] and other expertise, as well as various assumptions and analogous conclusions .
Overall, it is likely that the figures for emissions reduction based on the use of biofuels are too optimistic . This is due to the general use of the regional NUTS2 values for biomass cultivation and the rules governing the substitution of car-bon dioxide emissions from fossils by those from biogenic fuels .
The sharp increase in the use of energy crops in Germany went hand-in-hand with both direct and indirect changes in land use, which cause carbon dioxide emissions to rise . (Under the sustainability ordinances that have been put in place, direct changes in land use for the purposes of pro-ducing biofuels and bioliquids have been banned since 2011 .) However, it is difficult to quantify any indirect effects . As a consequence, these changes have not been taken into account in calculating emission balances to date . Model- based calculations indicate that indirect changes in land use in particular can cause significant greenhouse gas emis-sions and actually partially or fully cancel out greenhouse gas emissions savings generated, for instance, by individual biofuels . In future, fuel suppliers will also take into account such figures as the average preliminary estimates for emis-sions resulting from indirect changes in land use when they report greenhouse gas emissions per unit of energy and other similar statistics . In its current Renewable Energy Progress Report, the European Commission also includes the average provisional estimates for indirect land-use changes in Annex VIII of Directive 2009/28/EC, in the con-text of its reporting on the level of greenhouse gas emis-sions that have been eliminated [32] . As a result, savings in greenhouse gas emissions linked to biofuels reported by the Member States for 2015 decreased between 40 % and 80 % [33] . Under the rule set down in the draft Renewable Energy Directive II for 2021–2030, which was adopted in 2018 . Member States must introduce a minimum quota of 14 % of renewable energy in the transport sector by 2030;
Member States may exceed this quota . It may also be reduced by the amount to which they set a cap for conventional biofuels with potentially high emissions from ILUC (indi-rect land use change) that is below the pan-EU cap of 7 % [34] . According to the current situation, Germany intends to cap support for conventional biofuels at 5 .6 % [35] .
The calculations of the emissions savings arising from the use of renewable energy sources are based on net figures in all three sectors . This is done by setting off the volume of emissions caused by the use of renewables (final energy supply) against the volume of gross emissions that are no longer being released thanks to fossil and nuclear energy sources having been replaced with renewables . All upstream process chains involved in the production and supply of the various energy sources and in plant construction and operation (but not dismantling) are also taken into account . Further to this, the impact of renewable energy sources on emissions reductions can also be seen in a statistical ana-lysis (component analysis) in which the avoidance effect of renewable energy is presented in conjunction with other drivers of emissions [36] .
Figure 27 shows the balance for greenhouse gas emissions and air pollutants . Greenhouse gas abatement is particu-larly high in the electricity generation segment . The bal-ances are negative for precursors of ground-level ozone . This is mainly due to the use of biogas . Emissions of some air pollutants associated with heating have risen as more wood is burned in old stoves and tiled ovens . However, under current legislation, these units will have to be gradu-ally taken out of use or replaced . The negative balances for carbon monoxide, volatile organic compounds and dust emissions (all particle sizes) are particularly significant . When it comes to biofuels, there was an increase in nitrous oxide and methane emissions from the cultivation of energy crops .
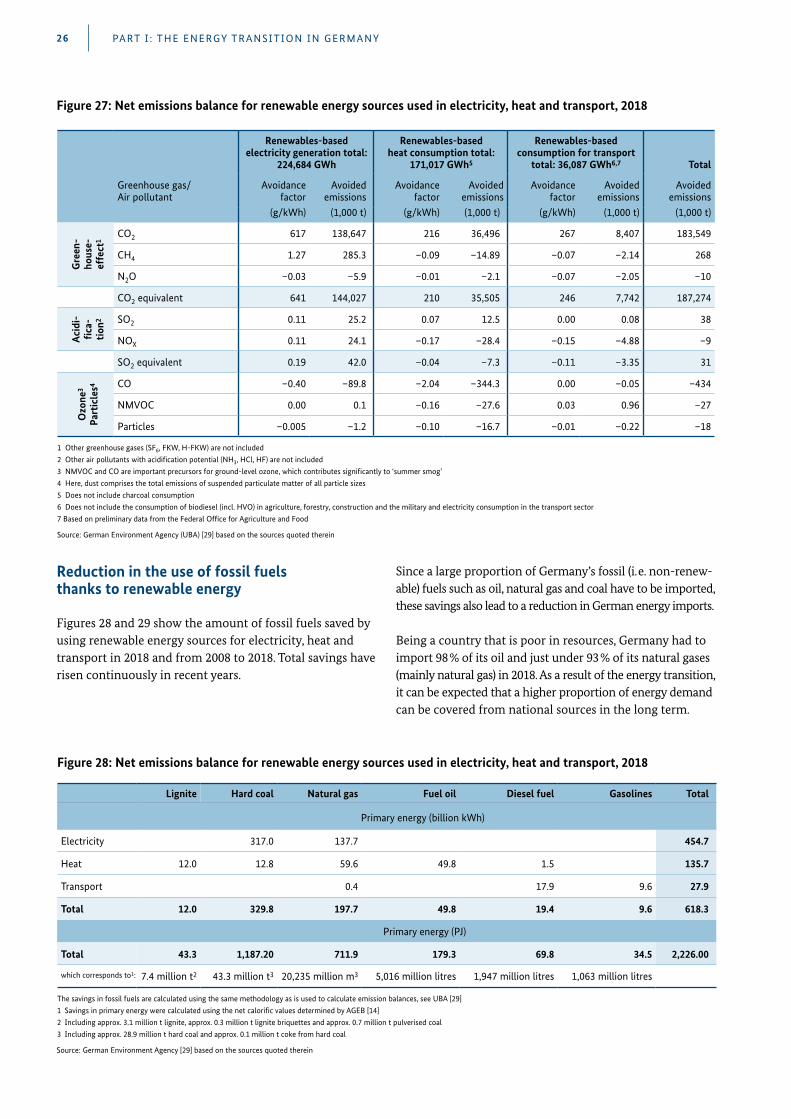
Renewables-basedelectricity generation total:
224,684 GWh
Renewables-basedheat consumption total:
171,017 GWh5
Renewables-basedconsumption for transport
total: 36,087 GWh6,7 Total
Greenhouse gas/ Air pollutant
Avoidance factor
Avoided emissions
Avoidance factor
Avoided emissions
Avoidance factor
Avoided emissions
Avoided emissions
(g/kWh) (1,000 t) (g/kWh) (1,000 t) (g/kWh) (1,000 t) (1,000 t)
Gre
en-
hous
e-
effe
ct1
CO2 617 138,647 216 36,496 267 8,407 183,549
CH4 1.27 285.3 –0.09 –14.89 –0.07 –2.14 268
N2O –0.03 –5.9 –0.01 –2.1 –0.07 –2.05 –10
CO2 equivalent 641 144,027 210 35,505 246 7,742 187,274
Aci
di-
fica
-ti
on2 SO2 0.11 25.2 0.07 12.5 0.00 0.08 38
NOX 0.11 24.1 –0.17 –28.4 –0.15 –4.88 –9
SO2 equivalent 0.19 42.0 –0.04 –7.3 –0.11 –3.35 31
Ozo
ne3
Part
icle
s4 CO –0.40 –89.8 –2.04 –344.3 0.00 –0.05 –434
NMVOC 0.00 0.1 –0.16 –27.6 0.03 0.96 –27
Particles –0.005 –1.2 –0.10 –16.7 –0.01 –0.22 –18
1 Other greenhouse gases (SF6, FKW, H-FKW) are not included2 Other air pollutants with acidification potential (NH3, HCl, HF) are not included3 NMVOC and CO are important precursors for ground-level ozone, which contributes significantly to ‘summer smog’4 Here, dust comprises the total emissions of suspended particulate matter of all particle sizes5 Does not include charcoal consumption6 Does not include the consumption of biodiesel (incl. HVO) in agriculture, forestry, construction and the military and electricity consumption in the transport sector7 Based on preliminary data from the Federal Office for Agriculture and Food
PART I : THE ENERGY TRANSITION IN GERMANY26
Lignite Hard coal Natural gas Fuel oil Diesel fuel Gasolines Total
Primary energy (billion kWh)
Electricity 317.0 137.7 454.7
Heat 12.0 12.8 59.6 49.8 1.5 135.7
Transport 0.4 17.9 9.6 27.9
Total 12.0 329.8 197.7 49.8 19.4 9.6 618.3
Primary energy (PJ)
Total 43.3 1,187.20 711.9 179.3 69.8 34.5 2,226.00
which corresponds to1: 7.4 million t2 43.3 million t3 20,235 million m3 5,016 million litres 1,947 million litres 1,063 million litres
The savings in fossil fuels are calculated using the same methodology as is used to calculate emission balances, see UBA [29]1 Savings in primary energy were calculated using the net calorific values determined by AGEB [14]2 Including approx. 3.1 million t lignite, approx. 0.3 million t lignite briquettes and approx. 0.7 million t pulverised coal3 Including approx. 28.9 million t hard coal and approx. 0.1 million t coke from hard coal
Source: German Environment Agency [29] based on the sources quoted therein
Figure 28: Net emissions balance for renewable energy sources used in electricity, heat and transport, 2018
Source: German Environment Agency (UBA) [29] based on the sources quoted therein
Figure 27: Net emissions balance for renewable energy sources used in electricity, heat and transport, 2018
Reduction in the use of fossil fuels thanks to renewable energy
Figures 28 and 29 show the amount of fossil fuels saved by using renewable energy sources for electricity, heat and transport in 2018 and from 2008 to 2018 . Total savings have risen continuously in recent years .
Since a large proportion of Germany’s fossil (i . e . non-renew-able) fuels such as oil, natural gas and coal have to be imported, these savings also lead to a reduction in German energy imports .
Being a country that is poor in resources, Germany had to import 98 % of its oil and just under 93 % of its natural gases (mainly natural gas) in 2018 . As a result of the energy transition, it can be expected that a higher proportion of energy demand can be covered from national sources in the long term .
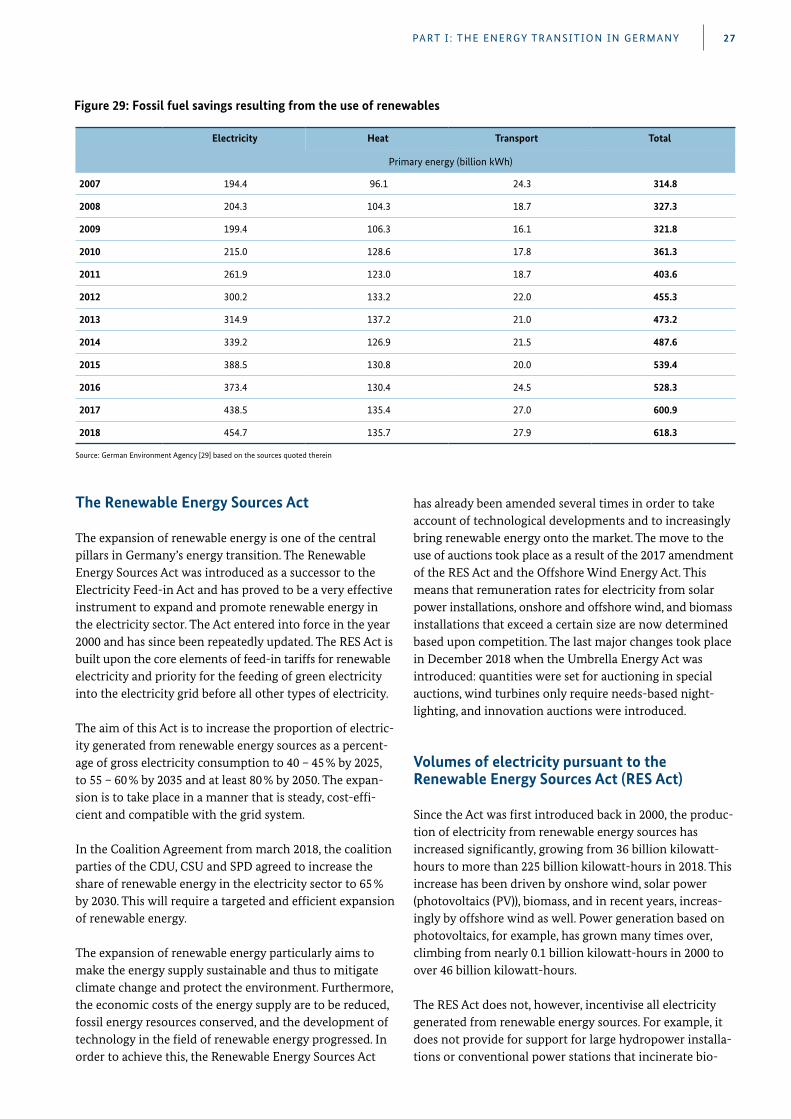
PART I : THE ENERGY TRANSITION IN GERMANY 27
Electricity Heat Transport Total
Primary energy (billion kWh)
2007 194.4 96.1 24.3 314.8
2008 204.3 104.3 18.7 327.3
2009 199.4 106.3 16.1 321.8
2010 215.0 128.6 17.8 361.3
2011 261.9 123.0 18.7 403.6
2012 300.2 133.2 22.0 455.3
2013 314.9 137.2 21.0 473.2
2014 339.2 126.9 21.5 487.6
2015 388.5 130.8 20.0 539.4
2016 373.4 130.4 24.5 528.3
2017 438.5 135.4 27.0 600.9
2018 454.7 135.7 27.9 618.3
Source: German Environment Agency [29] based on the sources quoted therein
Figure 29: Fossil fuel savings resulting from the use of renewables
The Renewable Energy Sources Act
The expansion of renewable energy is one of the central pillars in Germany’s energy transition . The Renewable Energy Sources Act was introduced as a successor to the Electricity Feed-in Act and has proved to be a very effective instrument to expand and promote renewable energy in the electricity sector . The Act entered into force in the year 2000 and has since been repeatedly updated . The RES Act is built upon the core elements of feed-in tariffs for renewable electricity and priority for the feeding of green electricity into the electricity grid before all other types of electricity .
The aim of this Act is to increase the proportion of electric-ity generated from renewable energy sources as a percent-age of gross electricity consumption to 40 – 45 % by 2025, to 55 – 60 % by 2035 and at least 80 % by 2050 . The expan-sion is to take place in a manner that is steady, cost-effi-cient and compatible with the grid system .
In the Coalition Agreement from march 2018, the coalition parties of the CDU, CSU and SPD agreed to increase the share of renewable energy in the electricity sector to 65 % by 2030 . This will require a targeted and efficient expansion of renewable energy .
The expansion of renewable energy particularly aims to make the energy supply sustainable and thus to mitigate climate change and protect the environment . Furthermore, the economic costs of the energy supply are to be reduced, fossil energy resources conserved, and the development of technology in the field of renewable energy progressed . In order to achieve this, the Renewable Energy Sources Act
has already been amended several times in order to take account of technological developments and to increasingly bring renewable energy onto the market . The move to the use of auctions took place as a result of the 2017 amendment of the RES Act and the Offshore Wind Energy Act . This means that remuneration rates for electricity from solar power installations, onshore and offshore wind, and biomass installations that exceed a certain size are now determined based upon competition . The last major changes took place in December 2018 when the Umbrella Energy Act was introduced: quantities were set for auctioning in special auctions, wind turbines only require needs-based night- lighting, and innovation auctions were introduced .
Volumes of electricity pursuant to the Renewable Energy Sources Act (RES Act)
Since the Act was first introduced back in 2000, the produc-tion of electricity from renewable energy sources has increased significantly, growing from 36 billion kilowatt- hours to more than 225 billion kilowatt-hours in 2018 . This increase has been driven by onshore wind, solar power (photovoltaics (PV)), biomass, and in recent years, increas-ingly by offshore wind as well . Power generation based on photovoltaics, for example, has grown many times over, climbing from nearly 0 .1 billion kilowatt-hours in 2000 to over 46 billion kilowatt-hours .
The RES Act does not, however, incentivise all electricity generated from renewable energy sources . For example, it does not provide for support for large hydropower installa-tions or conventional power stations that incinerate bio-
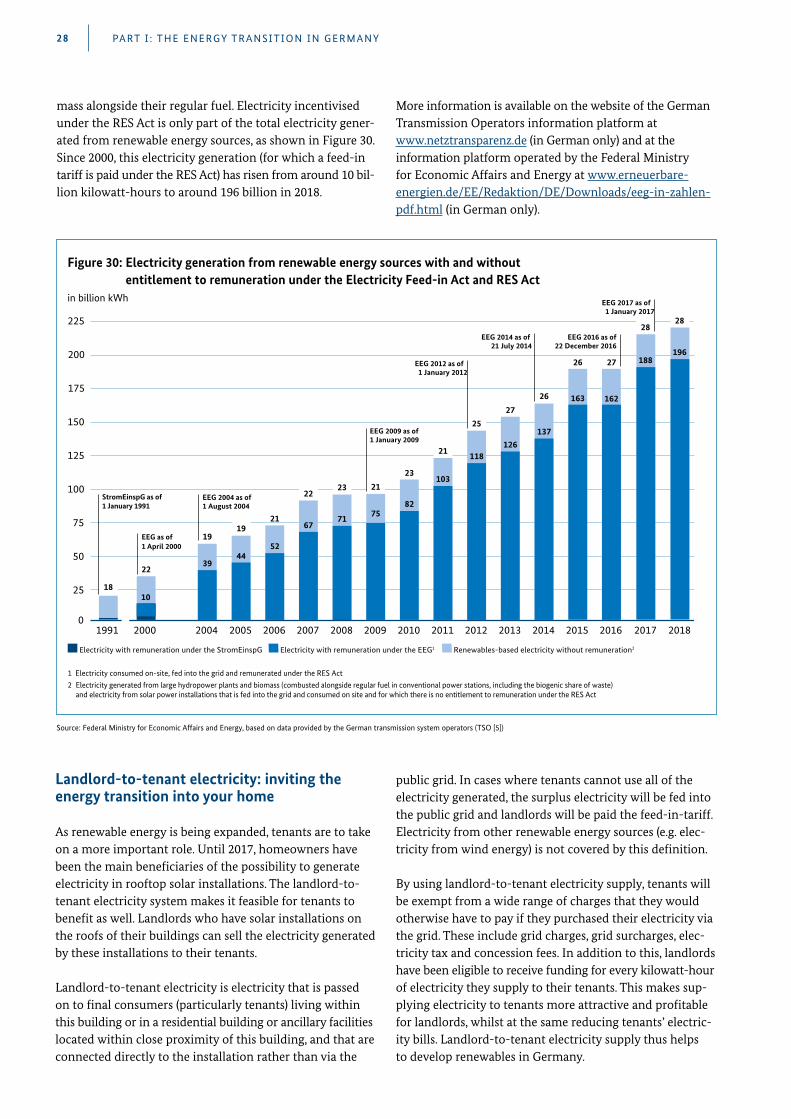
200
175
150
125
100
75
50
25
225
1991 2000
10
Electricity with remuneration under the StromEinspG Electricity with remuneration under the EEG1 Renewables-based electricity without remuneration2
1 Electricity consumed on-site, fed into the grid and remunerated under the RES Act2 Electricity generated from large hydropower plants and biomass (combusted alongside regular fuel in conventional power stations, including the biogenic share of waste)
and electricity from solar power installations that is fed into the grid and consumed on site and for which there is no entitlement to remuneration under the RES Act
22
2005
19
44
2006
21
52
2007
22
67
2008
23
71
2010
23
82
2011
21
103
2013
27
126
StromEinspG as of 1 January 1991
EEG as of 1 April 2000
2012
25
118
EEG 2012 as of1 January 2012
2009
21
75
EEG 2009 as of1 January 2009
2015
26
163
18
2004
EEG 2004 as of1 August 2004
19
39
27
162
2016
EEG 2016 as of22 December 2016
188
2017
EEG 2017 as of1 January 2017
28
2014
26
137
EEG 2014 as of 21 July 2014
0
196
2018
28
Figure 30: Electricity generation from renewable energy sources with and without entitlement to remuneration under the Electricity Feed-in Act and RES Act
in billion kWh
More information is available on the website of the German Transmission Operators information platform at www .netztransparenz .de (in German only) and at the information platform operated by the Federal Ministry for Economic Affairs and Energy at www .erneuerbare- energien .de/EE/Redaktion/DE/Downloads/eeg-in-zahlen-pdf .html (in German only) .
mass alongside their regular fuel . Electricity incentivised under the RES Act is only part of the total electricity gener-ated from renewable energy sources, as shown in Figure 30 . Since 2000, this electricity generation (for which a feed-in tariff is paid under the RES Act) has risen from around 10 bil-lion kilowatt-hours to around 196 billion in 2018 .
Source: Federal Ministry for Economic Affairs and Energy, based on data provided by the German transmission system operators (TSO [5])
PART I : THE ENERGY TRANSITION IN GERMANY28
Landlord-to-tenant electricity: inviting the energy transition into your home
As renewable energy is being expanded, tenants are to take on a more important role . Until 2017, homeowners have been the main beneficiaries of the possibility to generate electricity in rooftop solar installations . The landlord-to- tenant electricity system makes it feasible for tenants to benefit as well . Landlords who have solar installations on the roofs of their buildings can sell the electricity generated by these installations to their tenants .
Landlord-to-tenant electricity is electricity that is passed on to final consumers (particularly tenants) living within this building or in a residential building or ancillary facilities located within close proximity of this building, and that are connected directly to the installation rather than via the
public grid . In cases where tenants cannot use all of the electricity generated, the surplus electricity will be fed into the public grid and landlords will be paid the feed-in-tariff . Electricity from other renewable energy sources (e .g . elec-tricity from wind energy) is not covered by this definition .
By using landlord-to-tenant electricity supply, tenants will be exempt from a wide range of charges that they would otherwise have to pay if they purchased their electricity via the grid . These include grid charges, grid surcharges, elec-tricity tax and concession fees . In addition to this, landlords have been eligible to receive funding for every kilowatt- hour of electricity they supply to their tenants . This makes sup-plying electricity to tenants more attractive and profitable for landlords, whilst at the same reducing tenants’ electric-ity bills . Landlord-to-tenant electricity supply thus helps to develop renewables in Germany .
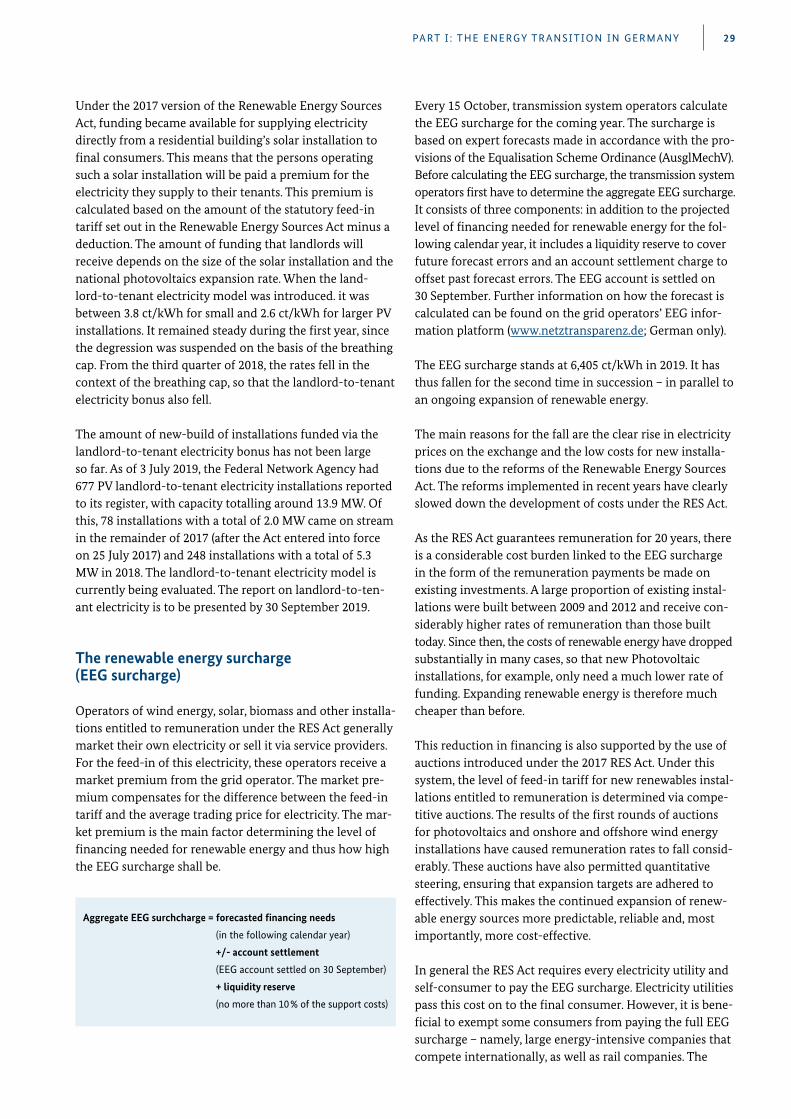
PART I : THE ENERGY TRANSITION IN GERMANY 29
Under the 2017 version of the Renewable Energy Sources Act, funding became available for supplying electricity directly from a residential building’s solar installation to final consumers . This means that the persons operating such a solar installation will be paid a premium for the electricity they supply to their tenants . This premium is calculated based on the amount of the statutory feed-in tariff set out in the Renewable Energy Sources Act minus a deduction . The amount of funding that landlords will receive depends on the size of the solar installation and the national photovoltaics expansion rate . When the land-lord-to-tenant electricity model was introduced . it was between 3 .8 ct/kWh for small and 2 .6 ct/kWh for larger PV installations . It remained steady during the first year, since the degression was suspended on the basis of the breathing cap . From the third quarter of 2018, the rates fell in the context of the breathing cap, so that the landlord-to-tenant electricity bonus also fell .
The amount of new-build of installations funded via the landlord-to-tenant electricity bonus has not been large so far . As of 3 July 2019, the Federal Network Agency had 677 PV landlord-to-tenant electricity installations reported to its register, with capacity totalling around 13 .9 MW . Of this, 78 installations with a total of 2 .0 MW came on stream in the remainder of 2017 (after the Act entered into force on 25 July 2017) and 248 installations with a total of 5 .3 MW in 2018 . The landlord-to-tenant electricity model is currently being evaluated . The report on landlord-to-ten-ant electricity is to be presented by 30 September 2019 .
The renewable energy surcharge (EEG surcharge)
Operators of wind energy, solar, biomass and other installa-tions entitled to remuneration under the RES Act generally market their own electricity or sell it via service providers . For the feed-in of this electricity, these operators receive a market premium from the grid operator . The market pre-mium compensates for the difference between the feed-in tariff and the average trading price for electricity . The mar-ket premium is the main factor determining the level of financing needed for renewable energy and thus how high the EEG surcharge shall be .
Aggregate EEG surchcharge = forecasted financing needs
(in the following calendar year)
+/- account settlement
(EEG account settled on 30 September)
+ liquidity reserve
(no more than 10 % of the support costs)
Every 15 October, transmission system operators calculate the EEG surcharge for the coming year . The surcharge is based on expert forecasts made in accordance with the pro-visions of the Equalisation Scheme Ordinance (AusglMechV) . Before calculating the EEG surcharge, the transmission system operators first have to determine the aggregate EEG surcharge . It consists of three components: in addition to the projected level of financing needed for renewable energy for the fol-lowing calendar year, it includes a liquidity reserve to cover future forecast errors and an account settlement charge to offset past forecast errors . The EEG account is settled on 30 September . Further information on how the forecast is calculated can be found on the grid operators’ EEG infor-mation platform (www .netztransparenz .de; German only) .
The EEG surcharge stands at 6,405 ct/kWh in 2019 . It has thus fallen for the second time in succession – in parallel to an ongoing expansion of renewable energy .
The main reasons for the fall are the clear rise in electricity prices on the exchange and the low costs for new installa-tions due to the reforms of the Renewable Energy Sources Act . The reforms implemented in recent years have clearly slowed down the development of costs under the RES Act .
As the RES Act guarantees remuneration for 20 years, there is a considerable cost burden linked to the EEG surcharge in the form of the remuneration payments be made on existing investments . A large proportion of existing instal-lations were built between 2009 and 2012 and receive con-siderably higher rates of remuneration than those built today . Since then, the costs of renewable energy have dropped substantially in many cases, so that new Photovoltaic installations, for example, only need a much lower rate of funding . Expanding renewable energy is therefore much cheaper than before .
This reduction in financing is also supported by the use of auctions introduced under the 2017 RES Act . Under this system, the level of feed-in tariff for new renewables instal-lations entitled to remuneration is determined via compe-titive auctions . The results of the first rounds of auctions for photovoltaics and onshore and offshore wind energy installations have caused remuneration rates to fall consid-erably . These auctions have also permitted quantitative steering, ensuring that expansion targets are adhered to effectively . This makes the continued expansion of renew-able energy sources more predictable, reliable and, most importantly, more cost-effective .
In general the RES Act requires every electricity utility and self-consumer to pay the EEG surcharge . Electricity utilities pass this cost on to the final consumer . However, it is bene-ficial to exempt some consumers from paying the full EEG surcharge – namely, large energy-intensive companies that compete internationally, as well as rail companies . The
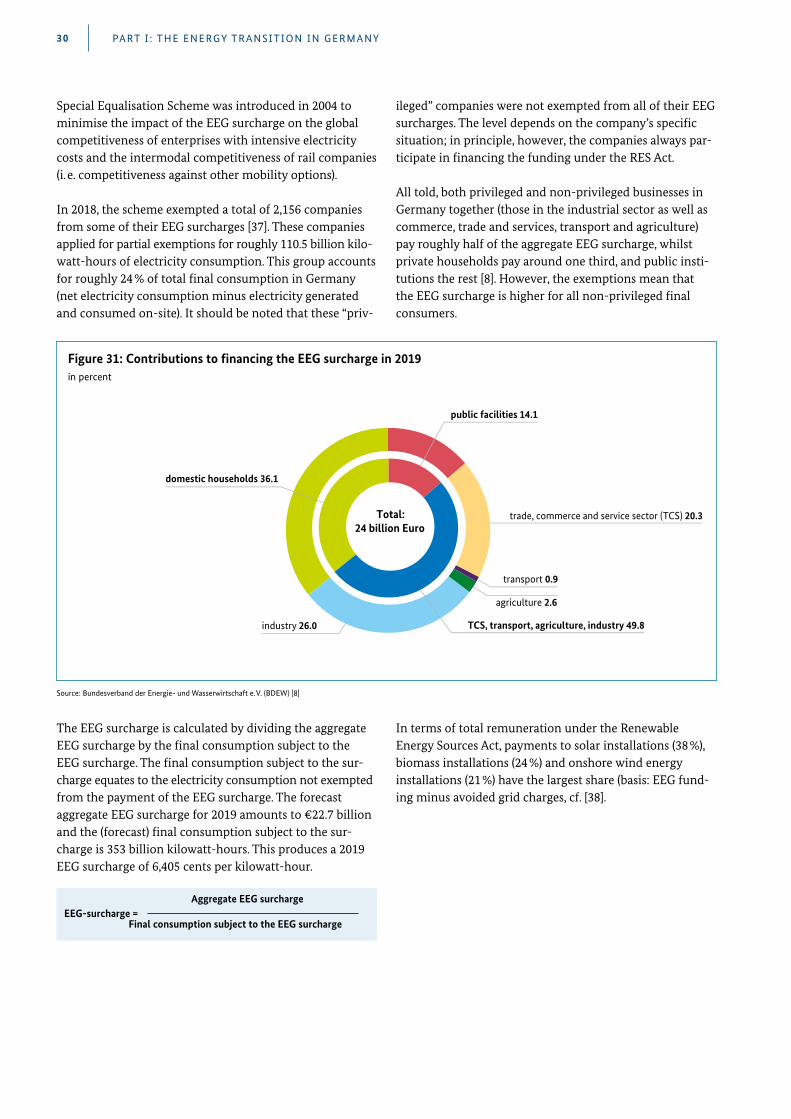
PART I : THE ENERGY TRANSITION IN GERMANY30
Special Equalisation Scheme was introduced in 2004 to minimise the impact of the EEG surcharge on the global competitiveness of enterprises with intensive electricity costs and the intermodal competitiveness of rail companies (i . e . competitiveness against other mobility options) .
In 2018, the scheme exempted a total of 2,156 companies from some of their EEG surcharges [37] . These companies applied for partial exemptions for roughly 110 .5 billion kilo-watt-hours of electricity consumption . This group accounts for roughly 24 % of total final consumption in Germany (net electricity consumption minus electricity generated and consumed on-site) . It should be noted that these “priv-
ileged” companies were not exempted from all of their EEG surcharges . The level depends on the company’s specific situation; in principle, however, the companies always par-ticipate in financing the funding under the RES Act .
All told, both privileged and non-privileged businesses in Germany together (those in the industrial sector as well as commerce, trade and services, transport and agriculture) pay roughly half of the aggregate EEG surcharge, whilst private households pay around one third, and public insti-tutions the rest [8] . However, the exemptions mean that the EEG surcharge is higher for all non-privileged final consumers .
Figure 31: Contributions to financing the EEG surcharge in 2019in percent
trade, commerce and service sector (TCS) 20.3
domestic households 36.1
public facilities 14.1
TCS, transport, agriculture, industry 49.8 industry 26.0
Total:24 billion Euro
transport 0.9
agriculture 2.6
The EEG surcharge is calculated by dividing the aggregate EEG surcharge by the final consumption subject to the EEG surcharge . The final consumption subject to the sur-charge equates to the electricity consumption not exempted from the payment of the EEG surcharge . The forecast aggregate EEG surcharge for 2019 amounts to €22 .7 billion and the (forecast) final consumption subject to the sur-charge is 353 billion kilowatt-hours . This produces a 2019 EEG surcharge of 6,405 cents per kilowatt-hour .
Aggregate EEG surcharge EEG-surcharge = Final consumption subject to the EEG surcharge
In terms of total remuneration under the Renewable Energy Sources Act, payments to solar installations (38 %), biomass installations (24 %) and onshore wind energy installations (21 %) have the largest share (basis: EEG fund-ing minus avoided grid charges, cf . [38] .
Source: Bundesverband der Energie- und Wasserwirtschaft e. V. (BDEW) [8]
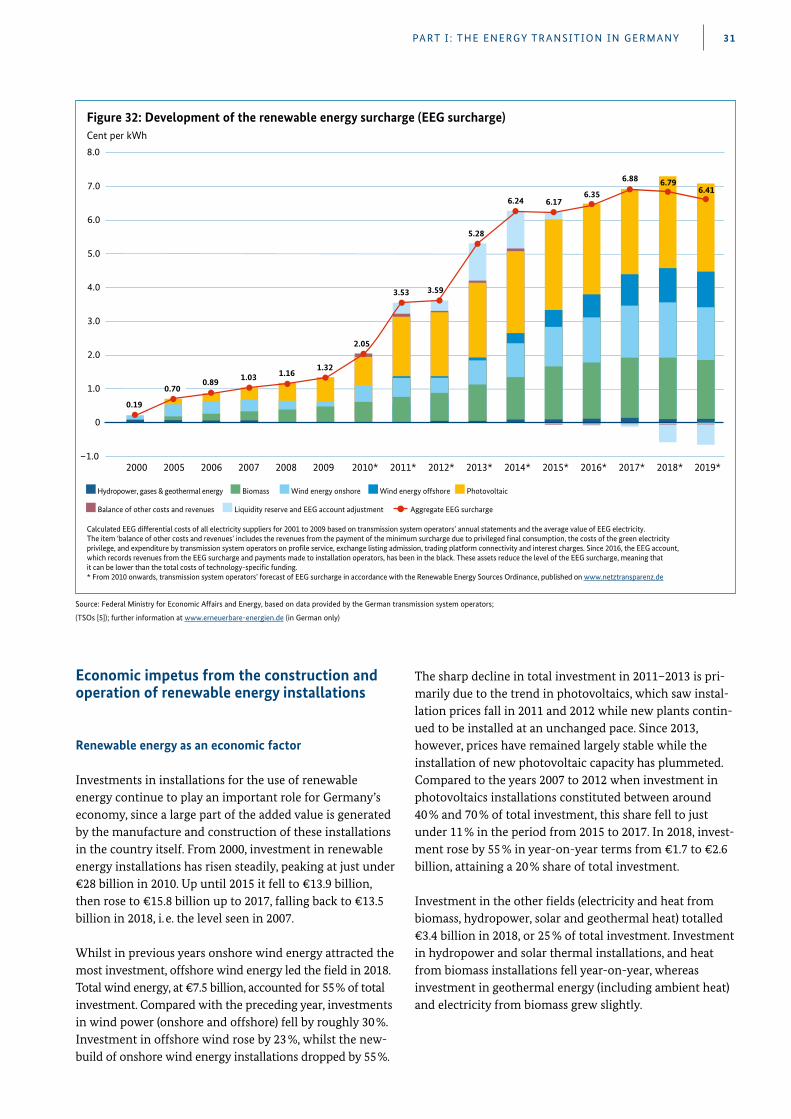
PART I : THE ENERGY TRANSITION IN GERMANY 31
Source: Federal Ministry for Economic Affairs and Energy, based on data provided by the German transmission system operators;
(TSOs [5]); further information at www.erneuerbare-energien.de (in German only)
7.0
6.0
5.0
4.0
3.0
2.0
1.0
8.0
Hydropower, gases & geothermal energy Biomass Wind energy onshore Wind energy offshore Photovoltaic
Balance of other costs and revenues Liquidity reserve and EEG account adjustment ● Aggregate EEG surcharge
Calculated EEG differential costs of all electricity suppliers for 2001 to 2009 based on transmission system operators’ annual statements and the average value of EEG electricity. The item ‘balance of other costs and revenues’ includes the revenues from the payment of the minimum surcharge due to privileged �nal consumption, the costs of the green electricity privilege, and expenditure by transmission system operators on pro�le service, exchange listing admission, trading platform connectivity and interest charges. Since 2016, the EEG account, which records revenues from the EEG surcharge and payments made to installation operators, has been in the black. These assets reduce the level of the EEG surcharge, meaning that it can be lower than the total costs of technology-speci�c funding.* From 2010 onwards, transmission system operators’ forecast of EEG surcharge in accordance with the Renewable Energy Sources Ordinance, published on www.netztransparenz.de
2000
0.19
2005
0.70
2006
0.89
2007
1.03
2008
1.16
2009
1.32
2010*
2.05
2011*
3.53
2012* 2013*
5.28
2014*
6.24
2015*
6.17
2016*
6.35
2017*
6.88
●
●●
● ●●
●
● ●
●
● ●●
●
2018*
●
0
●
2019*
6.796.41
3.59
–1.0
Figure 32: Development of the renewable energy surcharge (EEG surcharge)Cent per kWh
Economic impetus from the construction and operation of renewable energy installations
Renewable energy as an economic factor
Investments in installations for the use of renewable energy continue to play an important role for Germany’s economy, since a large part of the added value is generated by the manufacture and construction of these installations in the country itself . From 2000, investment in renewable energy installations has risen steadily, peaking at just under €28 billion in 2010 . Up until 2015 it fell to €13 .9 billion, then rose to €15 .8 billion up to 2017, falling back to €13 .5 billion in 2018, i . e . the level seen in 2007 .
Whilst in previous years onshore wind energy attracted the most investment, offshore wind energy led the field in 2018 . Total wind energy, at €7 .5 billion, accounted for 55 % of total investment . Compared with the preceding year, investments in wind power (onshore and offshore) fell by roughly 30 % . Investment in offshore wind rose by 23 %, whilst the new-build of onshore wind energy installations dropped by 55 % .
The sharp decline in total investment in 2011–2013 is pri-marily due to the trend in photovoltaics, which saw instal-lation prices fall in 2011 and 2012 while new plants contin-ued to be installed at an unchanged pace . Since 2013, however, prices have remained largely stable while the installation of new photovoltaic capacity has plummeted . Compared to the years 2007 to 2012 when investment in photovoltaics installations constituted between around 40 % and 70 % of total investment, this share fell to just under 11 % in the period from 2015 to 2017 . In 2018, invest-ment rose by 55 % in year-on-year terms from €1 .7 to €2 .6 billion, attaining a 20 % share of total investment .
Investment in the other fields (electricity and heat from biomass, hydropower, solar and geothermal heat) totalled €3 .4 billion in 2018, or 25 % of total investment . Investment in hydropower and solar thermal installations, and heat from biomass installations fell year-on-year, whereas investment in geothermal energy (including ambient heat) and electricity from biomass grew slightly .
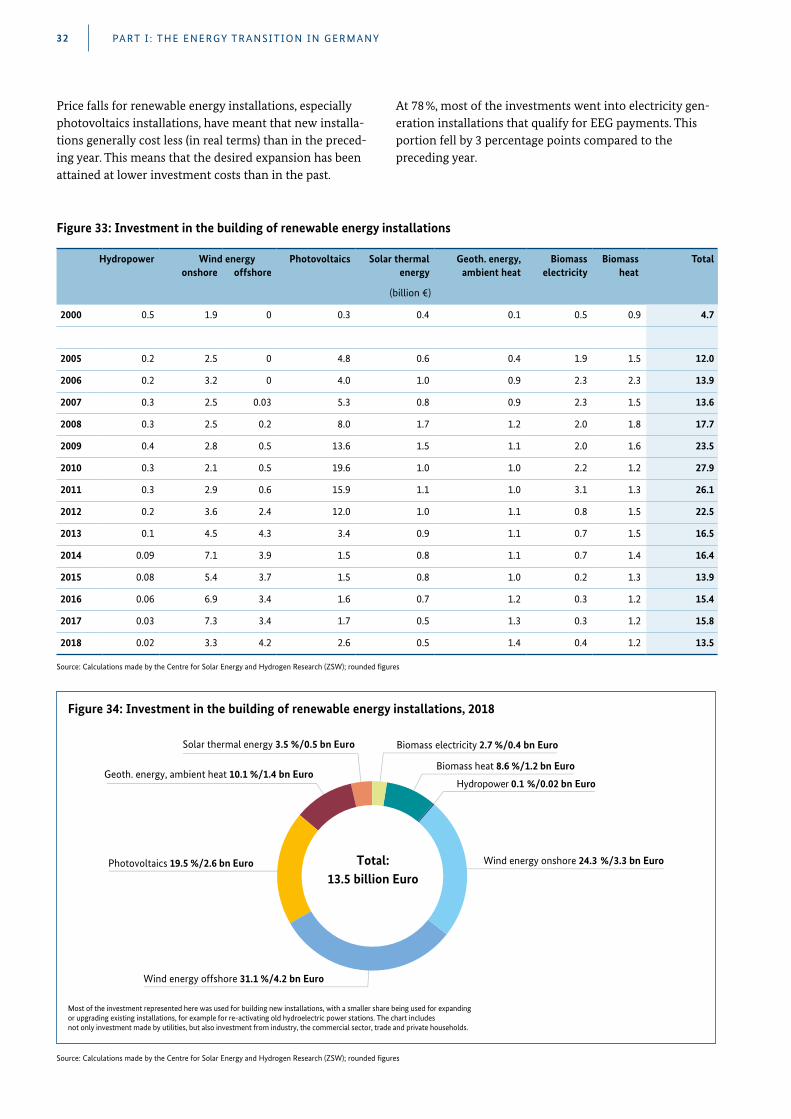
Hydropower Wind energy Photovoltaics Solar thermal Geoth. energy, Biomass Biomass Totalonshore offshore energy ambient heat electricity heat
(billion €)
2000 0.5 1.9 0 0.3 0.4 0.1 0.5 0.9 4.7
2005 0.2 2.5 0 4.8 0.6 0.4 1.9 1.5 12.0
2006 0.2 3.2 0 4.0 1.0 0.9 2.3 2.3 13.9
2007 0.3 2.5 0.03 5.3 0.8 0.9 2.3 1.5 13.6
2008 0.3 2.5 0.2 8.0 1.7 1.2 2.0 1.8 17.7
2009 0.4 2.8 0.5 13.6 1.5 1.1 2.0 1.6 23.5
2010 0.3 2.1 0.5 19.6 1.0 1.0 2.2 1.2 27.9
2011 0.3 2.9 0.6 15.9 1.1 1.0 3.1 1.3 26.1
2012 0.2 3.6 2.4 12.0 1.0 1.1 0.8 1.5 22.5
2013 0.1 4.5 4.3 3.4 0.9 1.1 0.7 1.5 16.5
2014 0.09 7.1 3.9 1.5 0.8 1.1 0.7 1.4 16.4
2015 0.08 5.4 3.7 1.5 0.8 1.0 0.2 1.3 13.9
2016 0.06 6.9 3.4 1.6 0.7 1.2 0.3 1.2 15.4
2017 0.03 7.3 3.4 1.7 0.5 1.3 0.3 1.2 15.8
2018 0.02 3.3 4.2 2.6 0.5 1.4 0.4 1.2 13.5
Biomass heat 8.6 %/1.2 bn Euro
Photovoltaics 19.5 %/2.6 bn Euro
Biomass electricity 2.7 %/0.4 bn Euro
Hydropower 0.1 %/0.02 bn EuroGeoth. energy, ambient heat 10.1 %/1.4 bn Euro
Solar thermal energy 3.5 %/0.5 bn Euro
Wind energy offshore 31.1 %/4.2 bn Euro
Total:13.5 billion Euro
Wind energy onshore 24.3 %/3.3 bn Euro
Most of the investment represented here was used for building new installations, with a smaller share being used for expanding or upgrading existing installations, for example for re-activating old hydroelectric power stations. The chart includes not only investment made by utilities, but also investment from industry, the commercial sector, trade and private households.
Figure 34: Investment in the building of renewable energy installations, 2018
Source: Calculations made by the Centre for Solar Energy and Hydrogen Research (ZSW); rounded figures
PART I : THE ENERGY TRANSITION IN GERMANY32
Price falls for renewable energy installations, especially photovoltaics installations, have meant that new installa-tions generally cost less (in real terms) than in the preced-ing year . This means that the desired expansion has been attained at lower investment costs than in the past .
At 78 %, most of the investments went into electricity gen-eration installations that qualify for EEG payments . This portion fell by 3 percentage points compared to the preceding year .
Figure 33: Investment in the building of renewable energy installations
Source: Calculations made by the Centre for Solar Energy and Hydrogen Research (ZSW); rounded figures
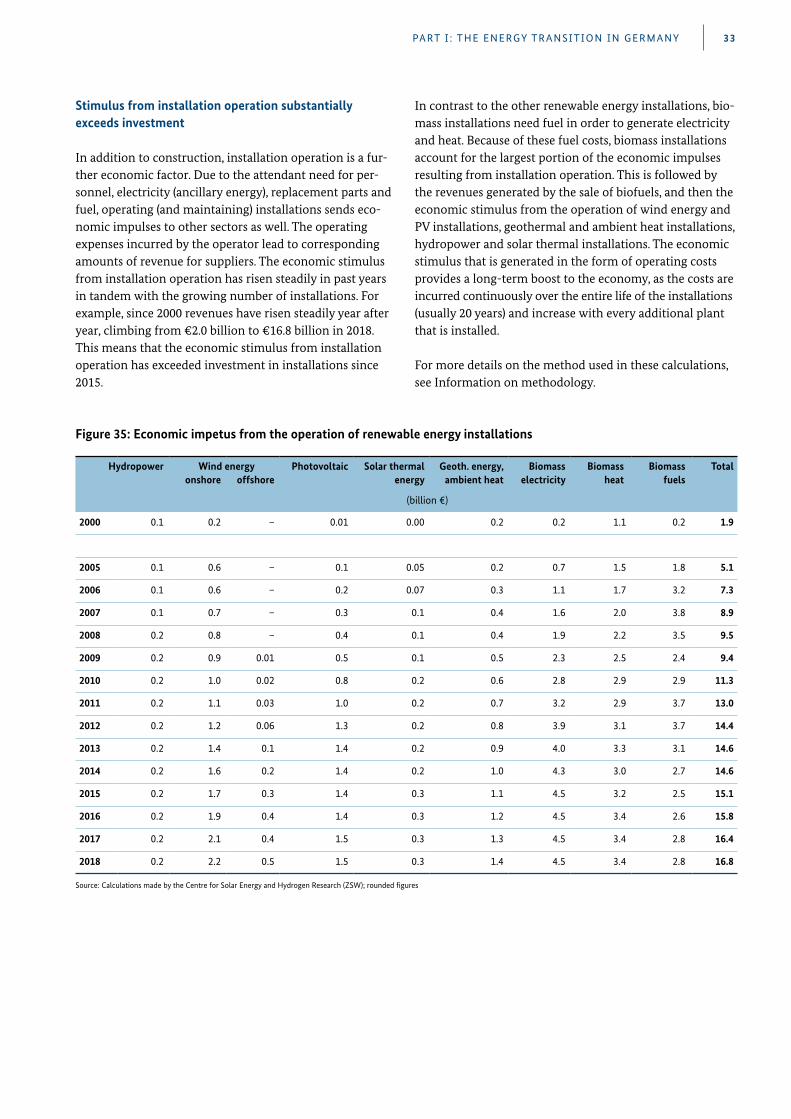
PART I : THE ENERGY TRANSITION IN GERMANY 33
Hydropower Wind energy Photovoltaic Solar thermal Geoth. energy, Biomass Biomass Biomass Totalonshore offshore energy ambient heat electricity heat fuels
(billion €)
2000 0.1 0.2 – 0.01 0.00 0.2 0.2 1.1 0.2 1.9
2005 0.1 0.6 – 0.1 0.05 0.2 0.7 1.5 1.8 5.1
2006 0.1 0.6 – 0.2 0.07 0.3 1.1 1.7 3.2 7.3
2007 0.1 0.7 – 0.3 0.1 0.4 1.6 2.0 3.8 8.9
2008 0.2 0.8 – 0.4 0.1 0.4 1.9 2.2 3.5 9.5
2009 0.2 0.9 0.01 0.5 0.1 0.5 2.3 2.5 2.4 9.4
2010 0.2 1.0 0.02 0.8 0.2 0.6 2.8 2.9 2.9 11.3
2011 0.2 1.1 0.03 1.0 0.2 0.7 3.2 2.9 3.7 13.0
2012 0.2 1.2 0.06 1.3 0.2 0.8 3.9 3.1 3.7 14.4
2013 0.2 1.4 0.1 1.4 0.2 0.9 4.0 3.3 3.1 14.6
2014 0.2 1.6 0.2 1.4 0.2 1.0 4.3 3.0 2.7 14.6
2015 0.2 1.7 0.3 1.4 0.3 1.1 4.5 3.2 2.5 15.1
2016 0.2 1.9 0.4 1.4 0.3 1.2 4.5 3.4 2.6 15.8
2017 0.2 2.1 0.4 1.5 0.3 1.3 4.5 3.4 2.8 16.4
2018 0.2 2.2 0.5 1.5 0.3 1.4 4.5 3.4 2.8 16.8
Source: Calculations made by the Centre for Solar Energy and Hydrogen Research (ZSW); rounded figures
Figure 35: Economic impetus from the operation of renewable energy installations
Stimulus from installation operation substantially exceeds investment
In addition to construction, installation operation is a fur-ther economic factor . Due to the attendant need for per-sonnel, electricity (ancillary energy), replacement parts and fuel, operating (and maintaining) installations sends eco-nomic impulses to other sectors as well . The operating expenses incurred by the operator lead to corresponding amounts of revenue for suppliers . The economic stimulus from installation operation has risen steadily in past years in tandem with the growing number of installations . For example, since 2000 revenues have risen steadily year after year, climbing from €2 .0 billion to €16 .8 billion in 2018 . This means that the economic stimulus from installation operation has exceeded investment in installations since 2015 .
In contrast to the other renewable energy installations, bio-mass installations need fuel in order to generate electricity and heat . Because of these fuel costs, biomass installations account for the largest portion of the economic impulses resulting from installation operation . This is followed by the revenues generated by the sale of biofuels, and then the economic stimulus from the operation of wind energy and PV installations, geothermal and ambient heat installations, hydropower and solar thermal installations . The economic stimulus that is generated in the form of operating costs provides a long-term boost to the economy, as the costs are incurred continuously over the entire life of the installations (usually 20 years) and increase with every additional plant that is installed .
For more details on the method used in these calculations, see Information on methodology .
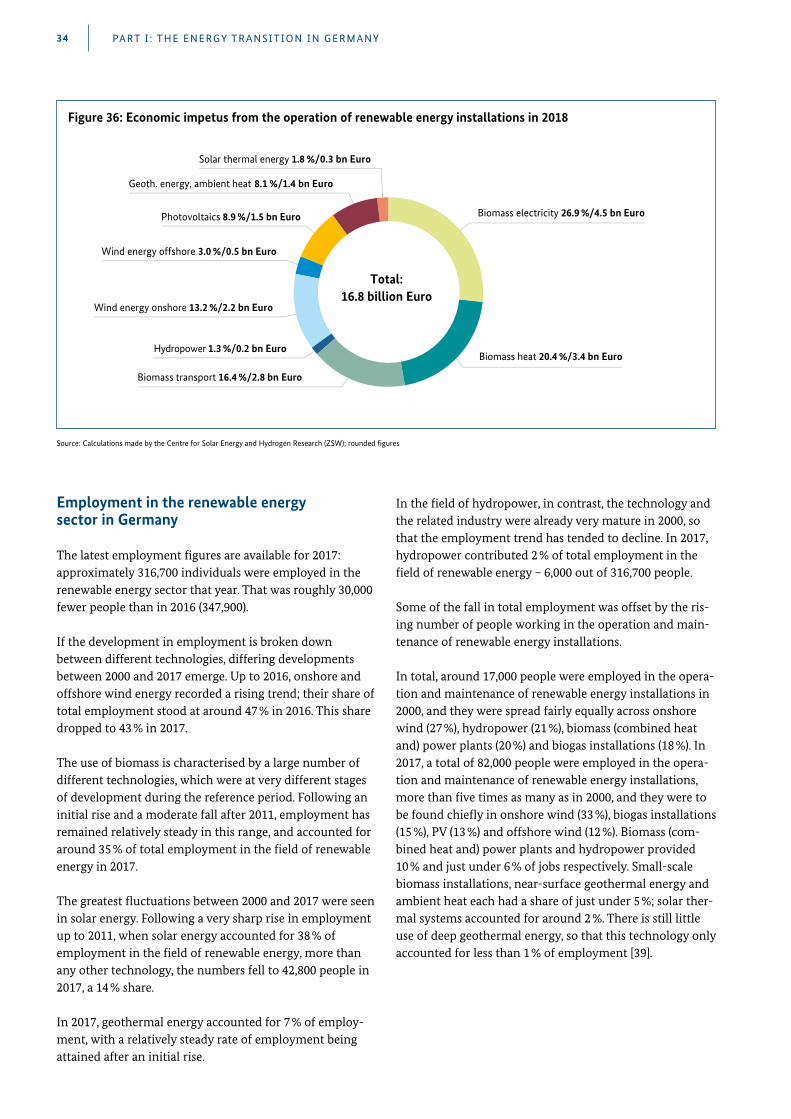
PART I : THE ENERGY TRANSITION IN GERMANY34
Employment in the renewable energy sector in Germany
The latest employment figures are available for 2017: approximately 316,700 individuals were employed in the renewable energy sector that year . That was roughly 30,000 fewer people than in 2016 (347,900) .
If the development in employment is broken down between different technologies, differing developments between 2000 and 2017 emerge . Up to 2016, onshore and offshore wind energy recorded a rising trend; their share of total employment stood at around 47 % in 2016 . This share dropped to 43 % in 2017 .
The use of biomass is characterised by a large number of different technologies, which were at very different stages of development during the reference period . Following an initial rise and a moderate fall after 2011, employment has remained relatively steady in this range, and accounted for around 35 % of total employment in the field of renewable energy in 2017 .
The greatest fluctuations between 2000 and 2017 were seen in solar energy . Following a very sharp rise in employment up to 2011, when solar energy accounted for 38 % of employment in the field of renewable energy, more than any other technology, the numbers fell to 42,800 people in 2017, a 14 % share .
In 2017, geothermal energy accounted for 7 % of employ-ment, with a relatively steady rate of employment being attained after an initial rise .
In the field of hydropower, in contrast, the technology and the related industry were already very mature in 2000, so that the employment trend has tended to decline . In 2017, hydropower contributed 2 % of total employment in the field of renewable energy – 6,000 out of 316,700 people .
Some of the fall in total employment was offset by the ris-ing number of people working in the operation and main-tenance of renewable energy installations .
In total, around 17,000 people were employed in the opera-tion and maintenance of renewable energy installations in 2000, and they were spread fairly equally across onshore wind (27 %), hydropower (21 %), biomass (combined heat and) power plants (20 %) and biogas installations (18 %) . In 2017, a total of 82,000 people were employed in the opera-tion and maintenance of renewable energy installations, more than five times as many as in 2000, and they were to be found chiefly in onshore wind (33 %), biogas installations (15 %), PV (13 %) and offshore wind (12 %) . Biomass (com-bined heat and) power plants and hydropower provided 10 % and just under 6 % of jobs respectively . Small-scale biomass installations, near-surface geothermal energy and ambient heat each had a share of just under 5 %; solar ther-mal systems accounted for around 2 % . There is still little use of deep geothermal energy, so that this technology only accounted for less than 1 % of employment [39] .
Biomass heat 20.4 %/3.4 bn Euro
Photovoltaics 8.9 %/1.5 bn Euro
Wind energy onshore 13.2 %/2.2 bn Euro
Biomass transport 16.4 %/2.8 bn Euro
Biomass electricity 26.9 %/4.5 bn Euro
Hydropower 1.3 %/0.2 bn Euro
Geoth. energy, ambient heat 8.1 %/1.4 bn Euro
Solar thermal energy 1.8 %/0.3 bn Euro
Wind energy offshore 3.0 %/0.5 bn Euro
Total:16.8 billion Euro
Figure 36: Economic impetus from the operation of renewable energy installations in 2018
Source: Calculations made by the Centre for Solar Energy and Hydrogen Research (ZSW); rounded figures
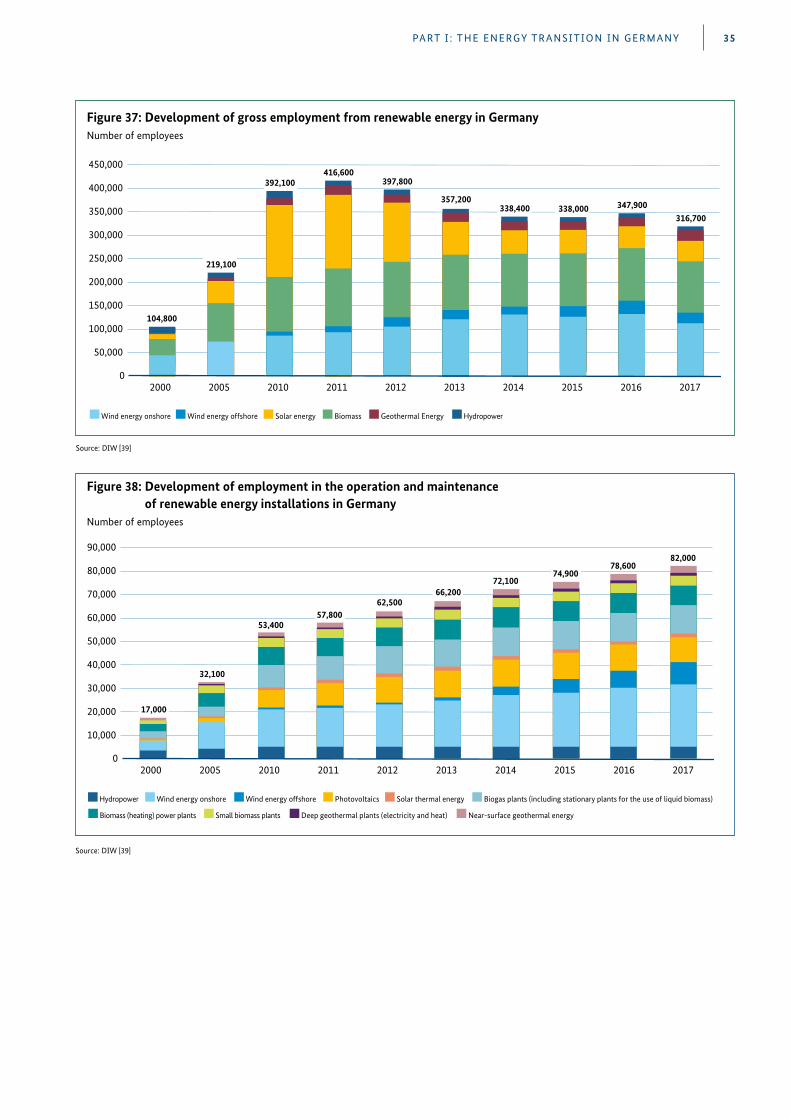
PART I : THE ENERGY TRANSITION IN GERMANY 35
Source: DIW [39]
450,000
50,000
100,000
150,000
200,000
250,000
300,000
350,000
400,000
Hydropower Wind energy onshore Solar energy Geothermal Energy
2000
104,800
2005
219,100
2010 2011
416,600
2012
397,800
2013
357,200
2014
338,400
2016
347,900
02015
338,000
Wind energy offshore
2017
316,700
Biomass
392,100
Figure 37: Development of gross employment from renewable energy in GermanyNumber of employees
Source: DIW [39]
Figure 38: Development of employment in the operation and maintenance of renewable energy installations in Germany
Number of employees
90,000
10,000
20,000
30,000
40,000
50,000
60,000
70,000
80,000
Hydropower Wind energy onshore Photovoltaics
Near-surface geothermal energy
2000 2005
32,100
2010 2011 2012
62,500
2013 2014
72,100
2016
78,600
02015
Wind energy offshore
2017
82,000
Biogas plants (including stationary plants for the use of liquid biomass)
53,400
Solar thermal energy
Biomass (heating) power plants Small biomass plants Deep geothermal plants (electricity and heat)
17,000
57,800
66,200
74,900
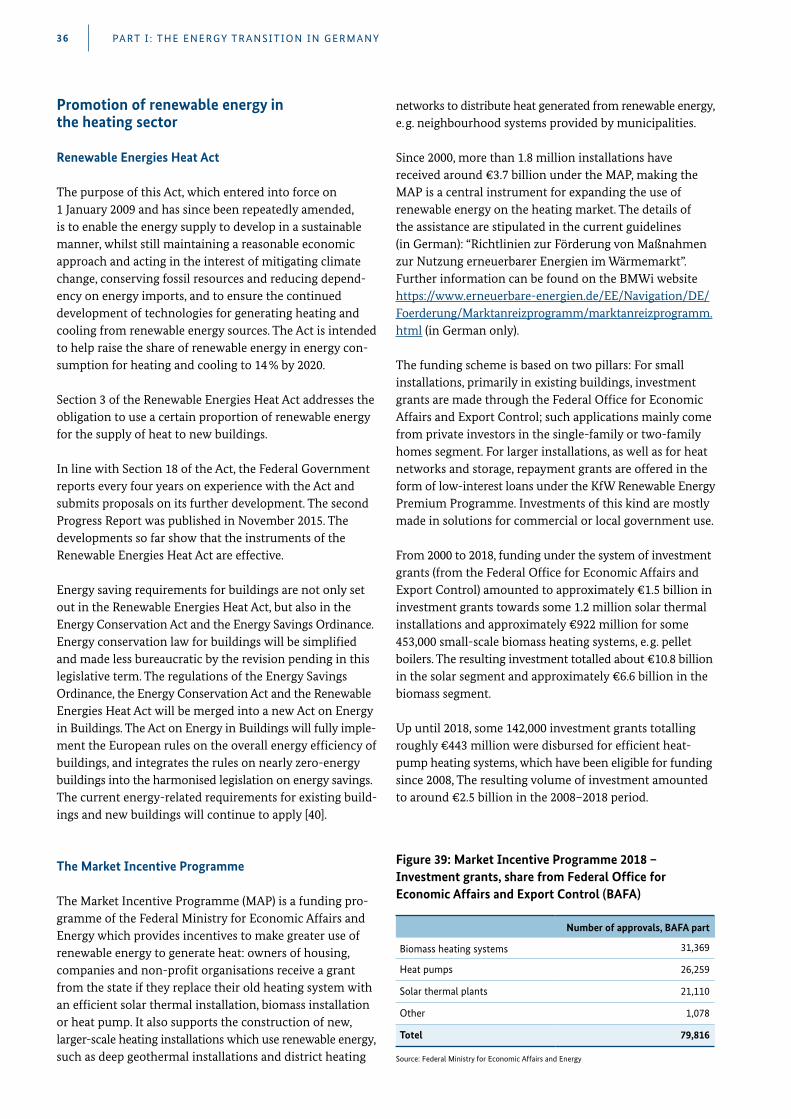
PART I : THE ENERGY TRANSITION IN GERMANY36
networks to distribute heat generated from renewable energy, e . g . neighbourhood systems provided by municipalities .
Since 2000, more than 1 .8 million installations have received around €3 .7 billion under the MAP, making the MAP is a central instrument for expanding the use of renewable energy on the heating market . The details of the assistance are stipulated in the current guidelines (in German): “Richtlinien zur Förderung von Maßnahmen zur Nutzung erneuerbarer Energien im Wärmemarkt” . Further information can be found on the BMWi website https://www .erneuerbare-energien .de/EE/Navigation/DE/Foerderung/Marktanreizprogramm/marktanreizprogramm .html (in German only) .
The funding scheme is based on two pillars: For small installations, primarily in existing buildings, investment grants are made through the Federal Office for Economic Affairs and Export Control; such applications mainly come from private investors in the single-family or two-family homes segment . For larger installations, as well as for heat networks and storage, repayment grants are offered in the form of low-interest loans under the KfW Renewable Energy Premium Programme . Investments of this kind are mostly made in solutions for commercial or local government use .
From 2000 to 2018, funding under the system of investment grants (from the Federal Office for Economic Affairs and Export Control) amounted to approximately €1 .5 billion in investment grants towards some 1 .2 million solar thermal installations and approximately €922 million for some 453,000 small-scale biomass heating systems, e . g . pellet boilers . The resulting investment totalled about €10 .8 billion in the solar segment and approximately €6 .6 billion in the biomass segment .
Up until 2018, some 142,000 investment grants totalling roughly €443 million were disbursed for efficient heat-pump heating systems, which have been eligible for funding since 2008, The resulting volume of investment amounted to around €2 .5 billion in the 2008–2018 period .
Promotion of renewable energy in the heating sector
Renewable Energies Heat Act
The purpose of this Act, which entered into force on 1 January 2009 and has since been repeatedly amended, is to enable the energy supply to develop in a sustainable manner, whilst still maintaining a reasonable economic approach and acting in the interest of mitigating climate change, conserving fossil resources and reducing depend-ency on energy imports, and to ensure the continued development of technologies for generating heating and cooling from renewable energy sources . The Act is intended to help raise the share of renewable energy in energy con-sumption for heating and cooling to 14 % by 2020 .
Section 3 of the Renewable Energies Heat Act addresses the obligation to use a certain proportion of renewable energy for the supply of heat to new buildings .
In line with Section 18 of the Act, the Federal Government reports every four years on experience with the Act and submits proposals on its further development . The second Progress Report was published in November 2015 . The developments so far show that the instruments of the Renewable Energies Heat Act are effective .
Energy saving requirements for buildings are not only set out in the Renewable Energies Heat Act, but also in the Energy Conservation Act and the Energy Savings Ordinance . Energy conservation law for buildings will be simplified and made less bureaucratic by the revision pending in this legislative term . The regulations of the Energy Savings Ordinance, the Energy Conservation Act and the Renewable Energies Heat Act will be merged into a new Act on Energy in Buildings . The Act on Energy in Buildings will fully imple-ment the European rules on the overall energy efficiency of buildings, and integrates the rules on nearly zero-energy buildings into the harmonised legislation on energy savings . The current energy-related requirements for existing build-ings and new buildings will continue to apply [40] .
The Market Incentive Programme
The Market Incentive Programme (MAP) is a funding pro-gramme of the Federal Ministry for Economic Affairs and Energy which provides incentives to make greater use of renewable energy to generate heat: owners of housing, companies and non-profit organisations receive a grant from the state if they replace their old heating system with an efficient solar thermal installation, biomass installation or heat pump . It also supports the construction of new, larger-scale heating installations which use renewable energy, such as deep geothermal installations and district heating Source: Federal Ministry for Economic Affairs and Energy
Figure 39: Market Incentive Programme 2018 – Investment grants, share from Federal Office for Economic Affairs and Export Control (BAFA)
Number of approvals, BAFA part
Biomass heating systems 31,369
Heat pumps 26,259
Solar thermal plants 21,110
Other 1,078
Totel 79,816
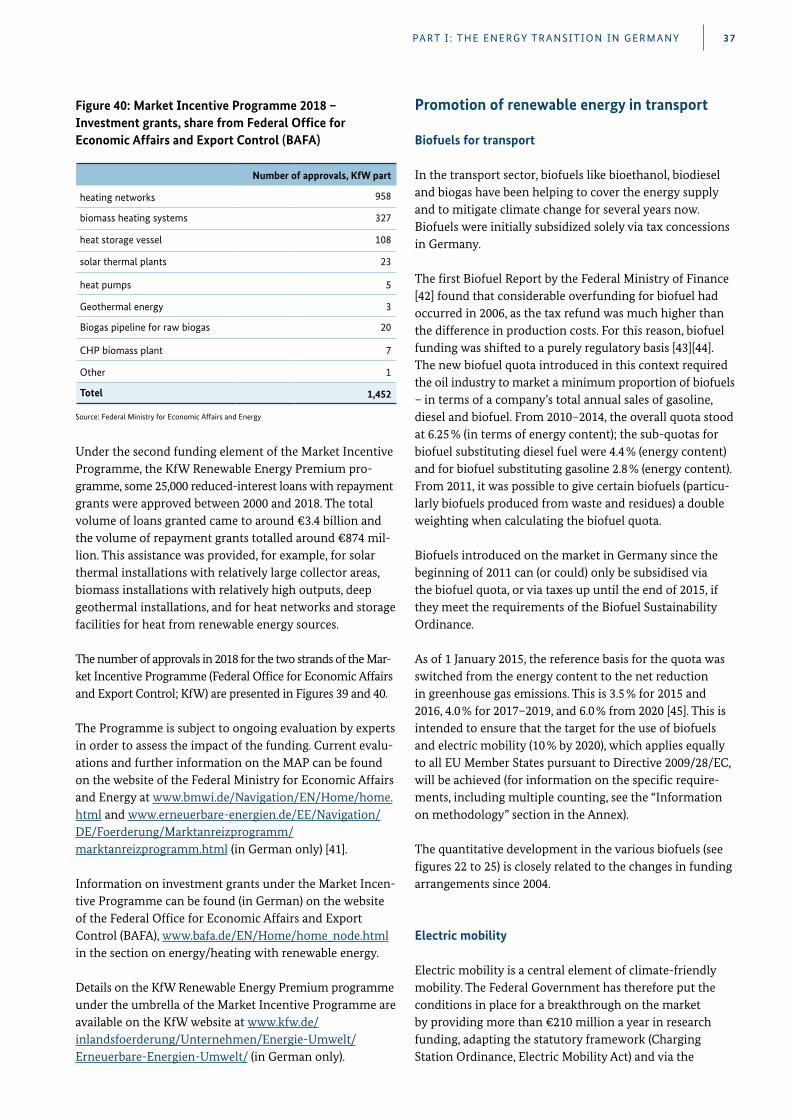
PART I : THE ENERGY TRANSITION IN GERMANY 37
Promotion of renewable energy in transport
Biofuels for transport
In the transport sector, biofuels like bioethanol, biodiesel and biogas have been helping to cover the energy supply and to mitigate climate change for several years now . Biofuels were initially subsidized solely via tax concessions in Germany .
The first Biofuel Report by the Federal Ministry of Finance [42] found that considerable overfunding for biofuel had occurred in 2006, as the tax refund was much higher than the difference in production costs . For this reason, biofuel funding was shifted to a purely regulatory basis [43][44] . The new biofuel quota introduced in this context required the oil industry to market a minimum proportion of biofuels – in terms of a company’s total annual sales of gasoline, diesel and biofuel . From 2010–2014, the overall quota stood at 6 .25 % (in terms of energy content); the sub-quotas for biofuel substituting diesel fuel were 4 .4 % (energy content) and for biofuel substituting gasoline 2 .8 % (energy content) . From 2011, it was possible to give certain biofuels (particu-larly biofuels produced from waste and residues) a double weighting when calculating the biofuel quota .
Biofuels introduced on the market in Germany since the beginning of 2011 can (or could) only be subsidised via the biofuel quota, or via taxes up until the end of 2015, if they meet the requirements of the Biofuel Sustainability Ordinance .
As of 1 January 2015, the reference basis for the quota was switched from the energy content to the net reduction in greenhouse gas emissions . This is 3 .5 % for 2015 and 2016, 4 .0 % for 2017–2019, and 6 .0 % from 2020 [45] . This is intended to ensure that the target for the use of biofuels and electric mobility (10 % by 2020), which applies equally to all EU Member States pursuant to Directive 2009/28/EC, will be achieved (for information on the specific require-ments, including multiple counting, see the “Information on methodology” section in the Annex) .
The quantitative development in the various biofuels (see figures 22 to 25) is closely related to the changes in funding arrangements since 2004 .
Electric mobility
Electric mobility is a central element of climate-friendly mobility . The Federal Government has therefore put the conditions in place for a breakthrough on the market by providing more than €210 million a year in research funding, adapting the statutory framework (Charging Station Ordinance, Electric Mobility Act) and via the
Under the second funding element of the Market Incentive Programme, the KfW Renewable Energy Premium pro-gramme, some 25,000 reduced-interest loans with repayment grants were approved between 2000 and 2018 . The total volume of loans granted came to around €3 .4 billion and the volume of repayment grants totalled around €874 mil-lion . This assistance was provided, for example, for solar thermal installations with relatively large collector areas, biomass installations with relatively high outputs, deep geothermal installations, and for heat networks and storage facilities for heat from renewable energy sources .
The number of approvals in 2018 for the two strands of the Mar-ket Incentive Programme (Federal Office for Economic Affairs and Export Control; KfW) are presented in Figures 39 and 40 .
The Programme is subject to ongoing evaluation by experts in order to assess the impact of the funding . Current evalu-ations and further information on the MAP can be found on the website of the Federal Ministry for Economic Affairs and Energy at www .bmwi .de/Navigation/EN/Home/home .html and www .erneuerbare-energien .de/EE/Navigation/DE/Foerderung/Marktanreizprogramm/ marktanreizprogramm .html (in German only) [41] .
Information on investment grants under the Market Incen-tive Programme can be found (in German) on the website of the Federal Office for Economic Affairs and Export Control (BAFA), www .bafa .de/EN/Home/home_node .html in the section on energy/heating with renewable energy .
Details on the KfW Renewable Energy Premium programme under the umbrella of the Market Incentive Programme are available on the KfW website at www .kfw .de/ inlandsfoerderung/Unternehmen/Energie-Umwelt/ Erneuerbare-Energien-Umwelt/ (in German only) .
Figure 40: Market Incentive Programme 2018 – Investment grants, share from Federal Office for Economic Affairs and Export Control (BAFA)
Source: Federal Ministry for Economic Affairs and Energy
Number of approvals, KfW part
heating networks 958
biomass heating systems 327
heat storage vessel 108
solar thermal plants 23
heat pumps 5
Geothermal energy 3
Biogas pipeline for raw biogas 20
CHP biomass plant 7
Other 1
Totel 1,452
PART I : THE ENERGY TRANSITION IN GERMANY38
market incentive package (environmental bonus for the purchase of electric vehicles, support for the establishment of the charging infrastructure, tax breaks for purchases) .
The Economic Affairs Ministry is promoting the purchase of electric vehicles via the “environmental bonus” . So far, approximately 131,000 applications have been received by the Federal Office for Economic Affairs and Export Control . The environmental bonus was extended in 2019 – at unchanged funding levels – until the end of 2020 (€4,000 for purely battery-driven vehicles, €3,000 for plug-in- hybrid vehicles (PHV), financed half by the Federation and half by industry) .
In the context of the Immediate Action Programme for Clean Air, the Economic Affairs Ministry is providing €176 million for the expansion of charging infrastructure in conjunction with research questions . The Federal Minis-try for Economic Affairs and Energy is pursuing two goals in this respect: the near-term development of charging infrastructures in municipalities, and the monitoring and examination of these measures with regard to weaknesses in grid expansion and grid stability . In addition, the focus is also on charging options for vehicle owners who do not have a charging point where they park, and on charg-ing options for business applications .
This measure is part of the Immediate Action Programme for Clean Air, which the Federation set up to improve urban air quality in November 2017 and is underpinning with €1 billion in funding . The Federal Government has since topped up the programme with an additional half a billion euros, and also added approximately €430 million for hardware retrofits . The measures to electrify transport thus total €743 million . Alongside the Economic Affairs Ministry, the Federal Ministry of Transport and Digital Infrastructure and the Federal Ministry for the Environment . Nature Conservation and Nuclear Safety are also involved in the programme with their own individual action areas .
At present, around 17,400 charging points are publicly accessible, including around 2,100 rapid-charge stations . The Federation has already funded the establishment of some 47,500 charging points (as of March 2019) . The next few months are expected to see a further sharp rise in the number of charging points .
The Federal Network Agency (https://www . bundesnetzagentur .de/EN/Home/home_node .html) publishes the data reported under the Charging Station Ordinance on publicly accessible charging infrastructure in Germany www .bundesnetzagentur .de/DE/Sachgebiete/ElektrizitaetundGas/Unternehmen_Institutionen/ HandelundVertrieb/Ladesaeulenkarte/Ladesaeulenkarte_node .html) .
According to the Federal Motor Transport Authority, 2018 saw another substantial rise in the registrations of electric and hybrid vehicles (+54,4 % and +44,2 % respectively) . The fleet of electric vehicles rose from 53,861 to 83,175, and that of hybrid cars from 236,710 to 341,411, The number of plug-in hybrid vehicles rose by 50,8 % to 66,997 .
The Federal Government plans to fund the establishment of battery cell manufacturing and related value chains in Germany and Europe together with other European coun-tries . To this end, the Economic Affairs Ministry is provid-ing up to €1 billion in funding, to be disbursed as part of an Important Project of Common European Interest (IPCEI) . The funding aims not least to boost the use of renewable energy in battery manufacturing and thus to reduce the lifecycle carbon emissions of electric vehicles .
Further information about the funding of electric mobility by the Federal Government can be found at https://www .bmwi .de/Redaktion/EN/Dossier/electric-mobility .html .
Promotion of renewable energy research and development
Funding for energy research is a strategic element of the Federal Government’s energy policy, and serves to attain the energy and climate targets of the energy transition . The Energy Research Programme is the main element setting out the principles and priorities of the funding policy . Since the first Energy Research Programme took effect in 1977, the development of innovative energy technologies has been constantly supported, with the indirect effect of sus-tainable economic growth and skilled jobs, as well as a lot of potential for exports .
In September 2018, the Federal Cabinet adopted the 7th Energy Research Programme entitled “Innovations for the Energy Transition” . It stipulates the guidelines for energy research funding in the coming years .
The current framework for energy research policy is char-acterised by four main areas:
●● accelerating the transfer of technology and innovations as a precondition for an efficient, cross-sector implemen-tation of the energy transition
●● broadening of the research spectrum of project funding from a focus on individual technologies to systemic and cross-system questions of the energy transition
●● twin-track strategy for the funding instruments: in addition to project funding, support is also given to the institutional research funding of the Helmholtz Asso-ciation of German Research Centres
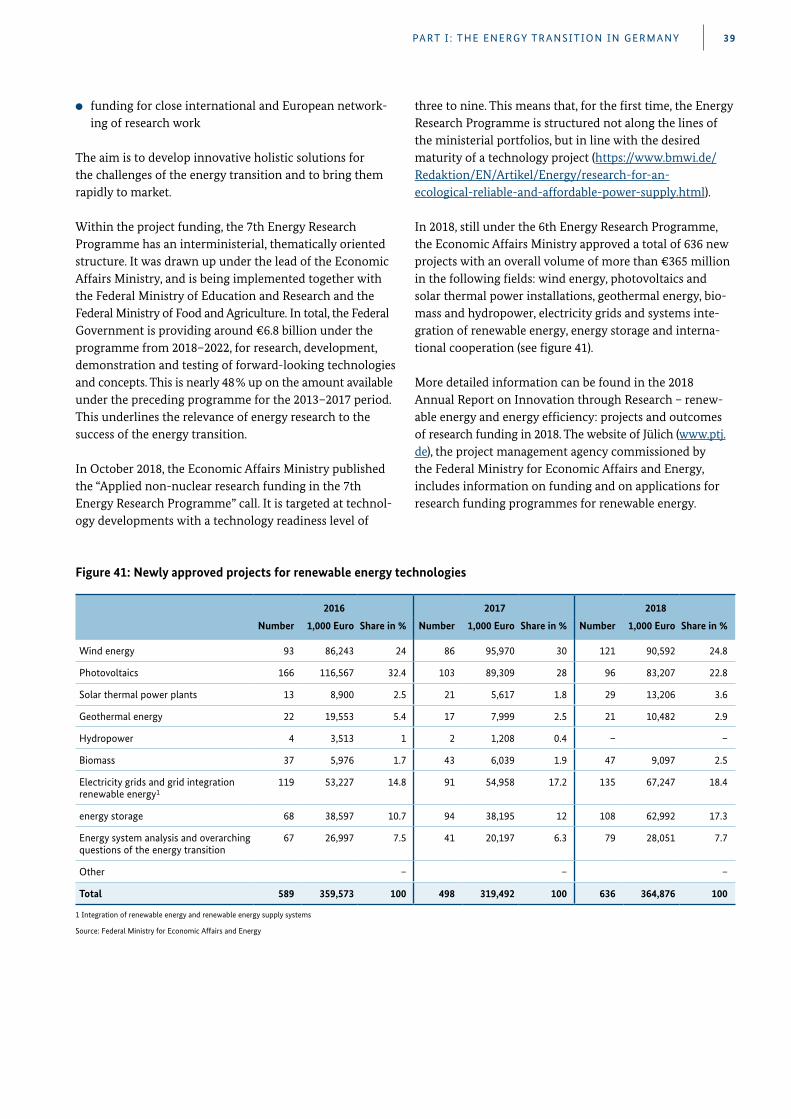
PART I : THE ENERGY TRANSITION IN GERMANY 39
2016 2017 2018
Number 1,000 Euro Share in % Number 1,000 Euro Share in % Number 1,000 Euro Share in %
Wind energy 93 86,243 24 86 95,970 30 121 90,592 24.8
Photovoltaics 166 116,567 32.4 103 89,309 28 96 83,207 22.8
Solar thermal power plants 13 8,900 2.5 21 5,617 1.8 29 13,206 3.6
Geothermal energy 22 19,553 5.4 17 7,999 2.5 21 10,482 2.9
Hydropower 4 3,513 1 2 1,208 0.4 – –
Biomass 37 5,976 1.7 43 6,039 1.9 47 9,097 2.5
Electricity grids and grid integration renewable energy1
119 53,227 14.8 91 54,958 17.2 135 67,247 18.4
energy storage 68 38,597 10.7 94 38,195 12 108 62,992 17.3
Energy system analysis and overarching questions of the energy transition
67 26,997 7.5 41 20,197 6.3 79 28,051 7.7
Other – – –
Total 589 359,573 100 498 319,492 100 636 364,876 100
1 Integration of renewable energy and renewable energy supply systems
Source: Federal Ministry for Economic Affairs and Energy
Figure 41: Newly approved projects for renewable energy technologies
●● funding for close international and European network-ing of research work
The aim is to develop innovative holistic solutions for the challenges of the energy transition and to bring them rapidly to market .
Within the project funding, the 7th Energy Research Programme has an interministerial, thematically oriented structure . It was drawn up under the lead of the Economic Affairs Ministry, and is being implemented together with the Federal Ministry of Education and Research and the Federal Ministry of Food and Agriculture . In total, the Federal Government is providing around €6 .8 billion under the programme from 2018–2022, for research, development, demonstration and testing of forward-looking technologies and concepts . This is nearly 48 % up on the amount available under the preceding programme for the 2013–2017 period . This underlines the relevance of energy research to the success of the energy transition .
In October 2018, the Economic Affairs Ministry published the “Applied non-nuclear research funding in the 7th Energy Research Programme” call . It is targeted at technol-ogy developments with a technology readiness level of
three to nine . This means that, for the first time, the Energy Research Programme is structured not along the lines of the ministerial portfolios, but in line with the desired maturity of a technology project (https://www .bmwi .de/Redaktion/EN/Artikel/Energy/research-for-an- ecological-reliable-and-affordable-power-supply .html) .
In 2018, still under the 6th Energy Research Programme, the Economic Affairs Ministry approved a total of 636 new projects with an overall volume of more than €365 million in the following fields: wind energy, photovoltaics and solar thermal power installations, geothermal energy, bio-mass and hydropower, electricity grids and systems inte-gration of renewable energy, energy storage and interna-tional cooperation (see figure 41) .
More detailed information can be found in the 2018 Annual Report on Innovation through Research – renew-able energy and energy efficiency: projects and outcomes of research funding in 2018 . The website of Jülich (www .ptj .de), the project management agency commissioned by the Federal Ministry for Economic Affairs and Energy, includes information on funding and on applications for research funding programmes for renewable energy .
PART I : THE ENERGY TRANSITION IN GERMANY40
Installation operators need to register themselves and their installations in the register, and are responsible for entering and curating their data . This also applies to all other market players . In this way, all electricity and gas system operators can be found in the register . The list of those obliged to register themselves includes electricity and gas suppliers, direct marketers and public authorities, associations and institutions in the energy sector . A detailed list of who is required to register can be found at www .marktstammdatenregister .de/MaStRHilfe/subpages/registrierungVerpflichtet .html (in German only) .
The core energy market data register only contains core data: names, addresses, sites, categorisations, technologies, capacity figures, etc . It does not contain dynamic data relating to the activities of a market player or processes within an installation (e . g . production figures, power flow data or storage levels) . A detailed description of what data are contained in the core energy market data register can be found on the Federal Network Agency website at www .marktstammdatenregister .de/MaStRHilfe/subpages/hintergrund .html and in the registration aids www . marktstammdatenregister .de/MaStRHilfe/subpages/ regCheck .html . Further information on the core energy market data register can be found on the Federal Network Agency website at www .marktstamm datenregister .de/MaStR (in German only) .
Data platforms of the Federal Network Agency
Core market data register – data for the energy transition
The transformation of the German energy system can only take place in a targeted manner if the vari-ous stakeholders can draw on
comprehensive, uniform and reliable data as a basis for their decisions . Efficient marketing of electricity and gas, the restriction of new grids to the necessary minimum, and the further development of the energy transition are challenges that can only be tackled on the basis of reliable data .
Back in 2014, the Federal Network Agency was entrusted by the legislature with the introduction and maintenance of an official register of renewable energy installations . It soon became clear that this register would have to be expanded to include all generating installations and market players . The design of the new overall register is regulated by the Core Energy Market Data Register Ordinance . The main aim of the core energy market data register is to simplify the processes in the energy industry and to improve the quality of the data, It also reduces the amount of bureau-cracy borne by individuals and companies .
So far, the data on the installations and market players have been kept in different, uncoordinated registers, so that many stakeholders had to register several times over and keep updating their data in various places . The core energy market data register collates all the main data of the elec-tricity and gas market in a central register . Most of the data are public, but personal data are explicitly protected . Public authorities can access the data . This makes it much easier for them to conduct their own surveys – they may even be spared the need to do so at all . Installation operators and other market players can use their core energy market data register numbers to refer to the data they have entered into the register .
PART I : THE ENERGY TRANSITION IN GERMANY 41
SMARD Electricity Market Data
SMARD is a website set up by the Federal Network Agency to map the German electricity market and create more trans-
parency . To this end, central electricity market data obtained by the Federal Network Agency directly from the European Network of Transmission System Operators are published on the website in nearly real time . In order to keep improving the quality of the data, the Federal Network Agency is engaged in a permanent dialogue with the pro-viders of the data .
The information on the website is divided into five main areas . Under “Market data visuals”, users can compile data from electricity generation and consumption, market and system stability to form individual diagrams . This pool of data is supplemented by helpful explanatory notes (“Elec-tricity market explained”) and information on current developments (under “Electricity market topics”) . All of the data available on SMARD can be downloaded, saved and used free of charge under the CC BY 4 .0 licence (“Data download” section) . The fifth section, “German electricity market”, is subdivided into a section on power plants and one on bidding zones . In the power plant section, detailed information can be viewed, including generation by indi-vidual power stations, and the generation figures can also be obtained from the “Data download” section . The bidding zone section uses a map to show the geographical electric-ity generation situation in Germany . Further to this, other key variables like electricity consumption and international wholesale prices are mapped .
SMARD has succeeded in making a complex issue accessi-ble to a broad public via a digital medium, as the published data and background information always provide an up-to-date and comprehensive overview of activity on the elec-tricity market . This also impressed the jury for the Digital Leader Award, with SMARD being awarded third place in the “Digitize Society” category in 2018 .
The SMARD information platform can be found at https://www .smard .de/en/5790 .
Directive 2009/28/EC is part of the European climate and energy package which was based on the resolutions passed on 9 March 2007 at the spring summit of the Heads of State and Government (European Council) . The binding objective of this Directive is to raise the renewables-based share of total gross final energy consumption in the EU from roughly 8 .5 % in 2005 to 20 % in 2020 .
To underpin this 20 % target, this Directive also lays down binding national targets for the share of energy from renewable sources in gross final consumption of energy in 2020 . These were determined on the basis of the 2005 base-line figures and each country’s individual potential, Ger-many’s national target was set at 18 % . The calculation of the shares is based on certain rules; in particular, weather- related fluctuations in electricity generation from hydro-power and wind energy, which fluctuates annually due to weather conditions, are normalised, i . e . calculated on the basis of average precipitation and wind conditions . The calculation of the attainment of the subtarget of 10 % of renewable energy in the transport sector also follows certain rules .
On the basis of Directive 2009/28/EC, Member States have presented National Renewable Energy Action Plans (NREAPs) for achieving their targets and, pursuant to Article 22 of the Directive, must report their progress to the Commission every two years . The progress reports are published on the website of the European Commission at https://ec .europa .eu/energy/node/70 .
In accordance with Article 23 of the Directive, the Euro-pean Commission also prepares a progress report every two years documenting the progress made by each country in reaching the targets set out in the EU directive . The latest, fifth progress report, relating to data from 2017, was pub-lished by the European Commission in April 2019 [33] . In it, the Commission finds that the EU attained a share of 17 .5 % of renewable energy in gross final energy consumption in 2017, which lay above the target curve for 2017/18, so that the EU is well on the way to achieving the 20 % target by 2020 .
Part II: Renewable energy in the European Union
Directive 2009/28/EC of the European Parliament and of the Council on the promotion of the use of energy from renewable sources, which entered into force in June 2009, set ambitious targets for the expansion of renewable energy in the EU ten years ago. For example, by 2020, renewable sources are to account for 20 % of gross final energy consumption. The new ver-sion of the directive, which entered into force at the end of 2018, extends this target to 32 % in 2030.
Directive 2009/28/EC represents the first EU-wide regula-tion that covers all energy applications of renewable energy sources . As such, it provides a sound pan-EU legal frame-work and a clear development path as a basis for the neces-sary investments and thus lays the foundation stone for the EU-wide expansion of renewable energy .
Directive (EU) 2018/2001 entered into force on 24 Decem-ber 2018, providing a new version of the Renewable Energy Directive . Basically, it sets a target whereby the share of renewable energy in final energy consumption within the EU is to increase to at least 32 % by 2030 . In addition to common funding rules for electricity from renewables, the directive also addresses the heating and transport sectors . For example, the Member States will need to increase the share of renewable energy they use for heating and cooling by 1 .3 percentage points from 2021 onwards . In the trans-port sector, the marketers of fuels are obliged to increase the share of renewable fuels to 14 % by 2030 . This is mainly to be achieved using new technologies (e .g . electric mobil-ity, power to X-electricity-based synthetic fuels) and fuels . The updated Directive will also restrict the share of first- generation biofuels – biofuels that are produced from food crops .
One framework for the new directive is the EU Energy Governance Union Regulation, which came into force at the end of 2019 . It links up energy and climate policy at European level for the first time . The European Union has set itself the aim of cutting EU greenhouse gas emissions by at least 40 % by 2030 from 1990 . In addition to the above-mentioned rise in the share of final energy con-sumption covered by renewable energy, EU primary energy consumption is to be cut by at least 32 .5 % compared with a reference scenario . The European electricity markets are to grow closer together and to be made fit for the growing proportion of intermittent renewable energy across Europe . Also, the rights and possibilities for final consum-ers in the electricity markets are to be strengthened .
The Governance Regulation also introduces a new plan-ning and monitoring instrument for the implementation of the goals of the Energy Union, and particularly the EU’s
42
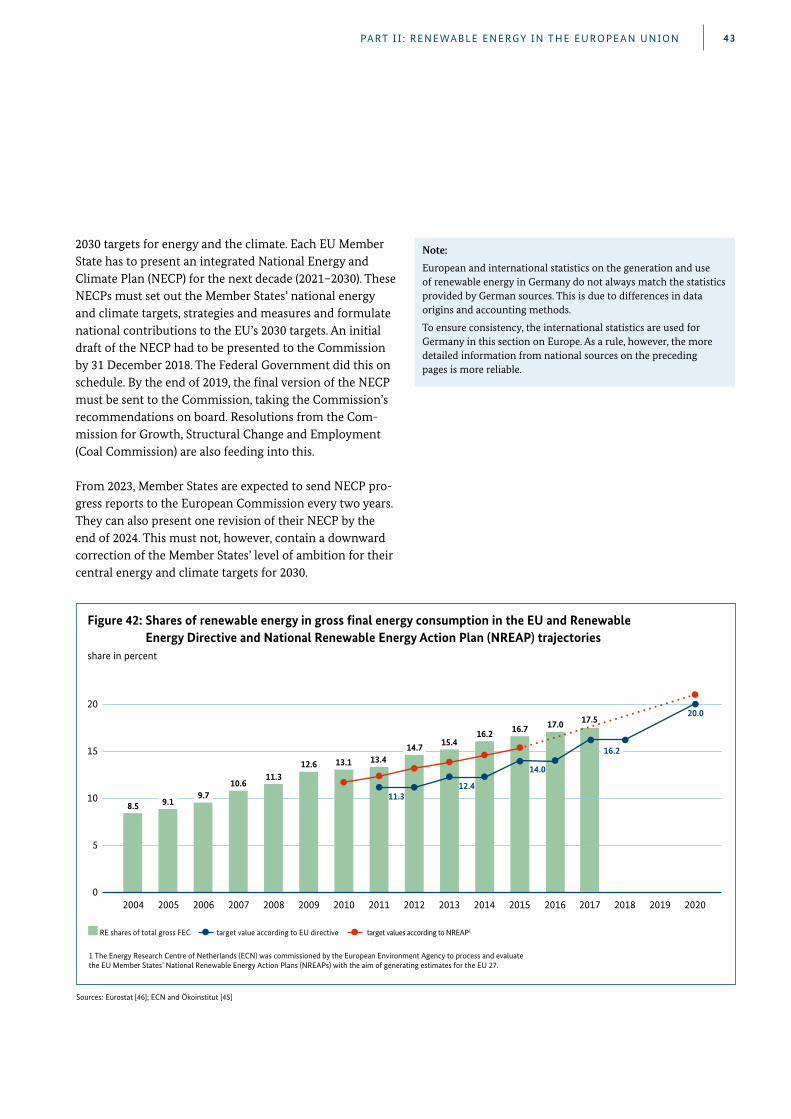
PART I I : RENEWABLE ENERGY IN THE EUROPEAN UNION 43
Note:
European and international statistics on the generation and use of renewable energy in Germany do not always match the statistics provided by German sources . This is due to differences in data origins and accounting methods .
To ensure consistency, the international statistics are used for Germany in this section on Europe . As a rule, however, the more detailed information from national sources on the preceding pages is more reliable .
2030 targets for energy and the climate . Each EU Member State has to present an integrated National Energy and Climate Plan (NECP) for the next decade (2021–2030) . These NECPs must set out the Member States’ national energy and climate targets, strategies and measures and formulate national contributions to the EU’s 2030 targets . An initial draft of the NECP had to be presented to the Commission by 31 December 2018 . The Federal Government did this on schedule . By the end of 2019, the final version of the NECP must be sent to the Commission, taking the Commission’s recommendations on board . Resolutions from the Com-mission for Growth, Structural Change and Employment (Coal Commission) are also feeding into this .
From 2023, Member States are expected to send NECP pro-gress reports to the European Commission every two years . They can also present one revision of their NECP by the end of 2024 . This must not, however, contain a downward correction of the Member States’ level of ambition for their central energy and climate targets for 2030 .
15
10
20
5
2016
20.0
16.2
11.3
RE shares of total gross FEC ● target value according to EU directive ● target values according to NREAP1
1 The Energy Research Centre of Netherlands (ECN) was commissioned by the European Environment Agency to process and evaluate the EU Member States’ National Renewable Energy Action Plans (NREAPs) with the aim of generating estimates for the EU 27.
2004
8.5
2005 2006 2007 2008 2009 2010 2011 2012 2013 2014 2015 2017 2018 2019 2020
● ●● ●
● ●
● ●
●
●●
●●
●●
●
9.19.7
10.611.3
12.6 13.1 13.414.7 15.4
16.2 16.7
12.4
14.0
17.0
0
17.5
Figure 42: Shares of renewable energy in gross final energy consumption in the EU and Renewable Energy Directive and National Renewable Energy Action Plan (NREAP) trajectories
share in percent
Sources: Eurostat [46]; ECN and Ökoinstitut [45]
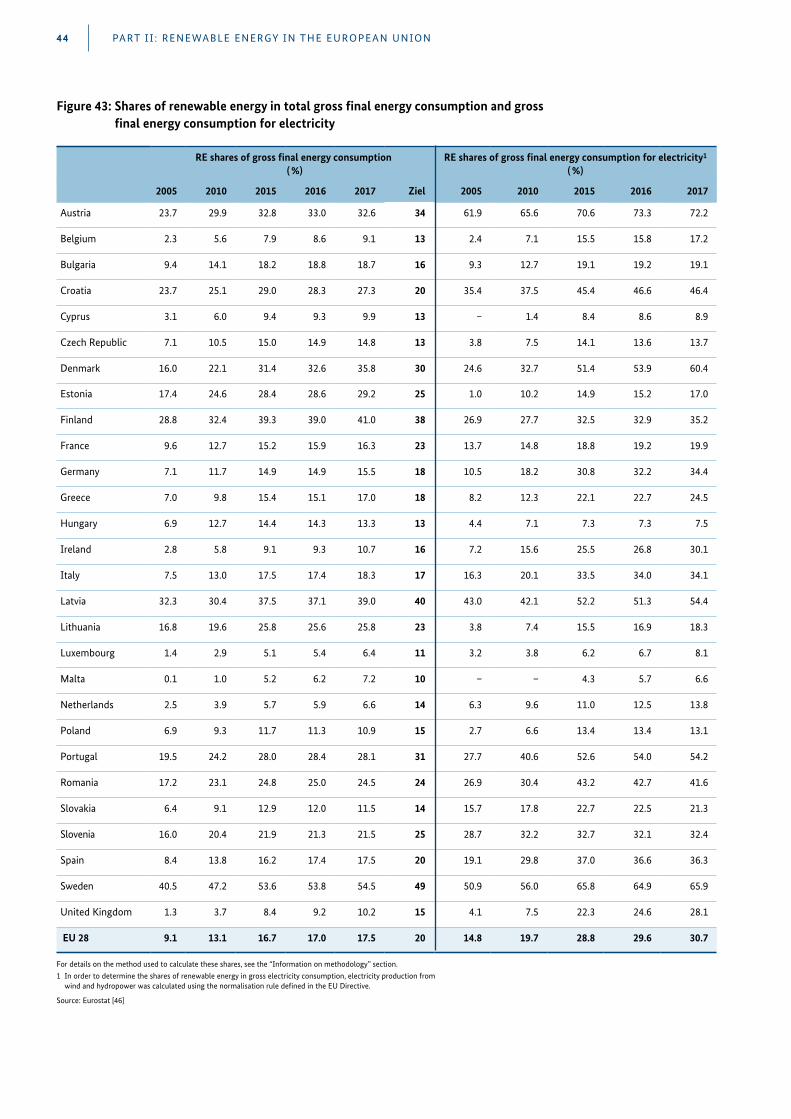
RE shares of gross final energy consumption ( %)
RE shares of gross final energy consumption for electricity1 ( %)
2005 2010 2015 2016 2017 Ziel 2005 2010 2015 2016 2017
Austria 23.7 29.9 32.8 33.0 32.6 34 61.9 65.6 70.6 73.3 72.2
Belgium 2.3 5.6 7.9 8.6 9.1 13 2.4 7.1 15.5 15.8 17.2
Bulgaria 9.4 14.1 18.2 18.8 18.7 16 9.3 12.7 19.1 19.2 19.1
Croatia 23.7 25.1 29.0 28.3 27.3 20 35.4 37.5 45.4 46.6 46.4
Cyprus 3.1 6.0 9.4 9.3 9.9 13 – 1.4 8.4 8.6 8.9
Czech Republic 7.1 10.5 15.0 14.9 14.8 13 3.8 7.5 14.1 13.6 13.7
Denmark 16.0 22.1 31.4 32.6 35.8 30 24.6 32.7 51.4 53.9 60.4
Estonia 17.4 24.6 28.4 28.6 29.2 25 1.0 10.2 14.9 15.2 17.0
Finland 28.8 32.4 39.3 39.0 41.0 38 26.9 27.7 32.5 32.9 35.2
France 9.6 12.7 15.2 15.9 16.3 23 13.7 14.8 18.8 19.2 19.9
Germany 7.1 11.7 14.9 14.9 15.5 18 10.5 18.2 30.8 32.2 34.4
Greece 7.0 9.8 15.4 15.1 17.0 18 8.2 12.3 22.1 22.7 24.5
Hungary 6.9 12.7 14.4 14.3 13.3 13 4.4 7.1 7.3 7.3 7.5
Ireland 2.8 5.8 9.1 9.3 10.7 16 7.2 15.6 25.5 26.8 30.1
Italy 7.5 13.0 17.5 17.4 18.3 17 16.3 20.1 33.5 34.0 34.1
Latvia 32.3 30.4 37.5 37.1 39.0 40 43.0 42.1 52.2 51.3 54.4
Lithuania 16.8 19.6 25.8 25.6 25.8 23 3.8 7.4 15.5 16.9 18.3
Luxembourg 1.4 2.9 5.1 5.4 6.4 11 3.2 3.8 6.2 6.7 8.1
Malta 0.1 1.0 5.2 6.2 7.2 10 – – 4.3 5.7 6.6
Netherlands 2.5 3.9 5.7 5.9 6.6 14 6.3 9.6 11.0 12.5 13.8
Poland 6.9 9.3 11.7 11.3 10.9 15 2.7 6.6 13.4 13.4 13.1
Portugal 19.5 24.2 28.0 28.4 28.1 31 27.7 40.6 52.6 54.0 54.2
Romania 17.2 23.1 24.8 25.0 24.5 24 26.9 30.4 43.2 42.7 41.6
Slovakia 6.4 9.1 12.9 12.0 11.5 14 15.7 17.8 22.7 22.5 21.3
Slovenia 16.0 20.4 21.9 21.3 21.5 25 28.7 32.2 32.7 32.1 32.4
Spain 8.4 13.8 16.2 17.4 17.5 20 19.1 29.8 37.0 36.6 36.3
Sweden 40.5 47.2 53.6 53.8 54.5 49 50.9 56.0 65.8 64.9 65.9
United Kingdom 1.3 3.7 8.4 9.2 10.2 15 4.1 7.5 22.3 24.6 28.1
EU 28 9.1 13.1 16.7 17.0 17.5 20 14.8 19.7 28.8 29.6 30.7
For details on the method used to calculate these shares, see the “Information on methodology” section.1 In order to determine the shares of renewable energy in gross electricity consumption, electricity production from
wind and hydropower was calculated using the normalisation rule defined in the EU Directive.
Source: Eurostat [46]
Figure 43: Shares of renewable energy in total gross final energy consumption and gross final energy consumption for electricity
PART I I : RENEWABLE ENERGY IN THE EUROPEAN UNION44
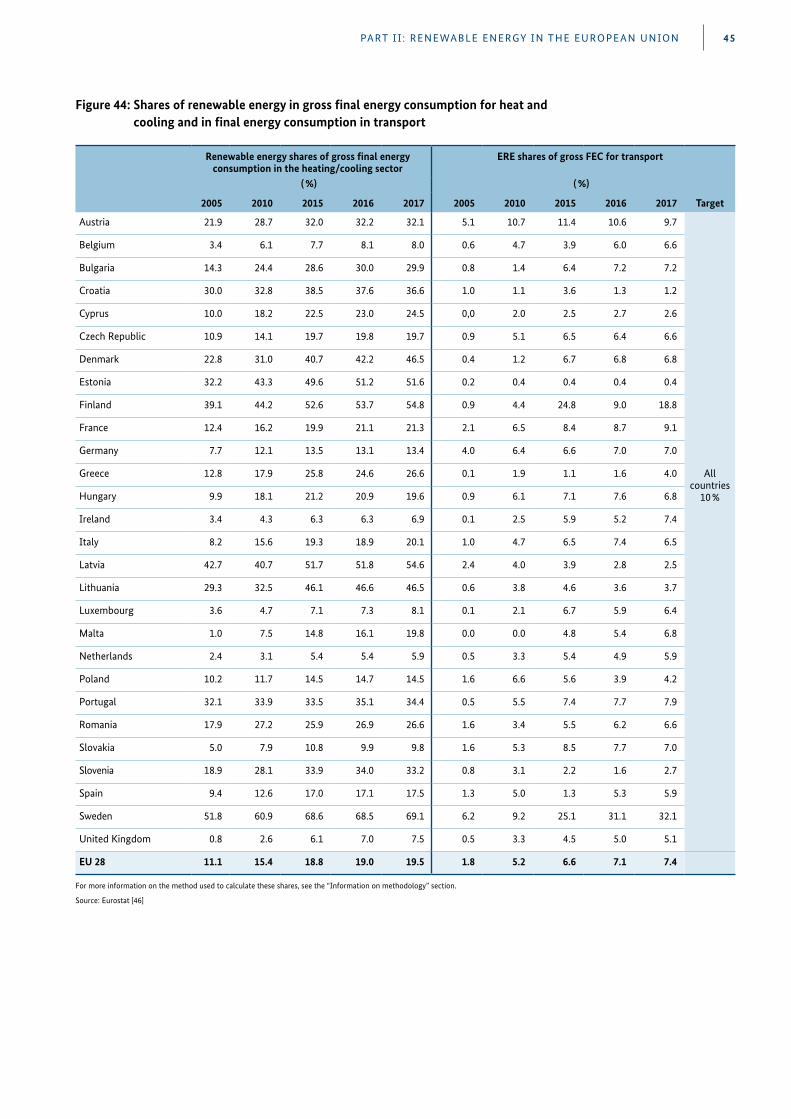
PART I I : RENEWABLE ENERGY IN THE EUROPEAN UNION 45
Source: Eurostat [46]
Figure 44: Shares of renewable energy in gross final energy consumption for heat and cooling and in final energy consumption in transport
Renewable energy shares of gross final energy consumption in the heating/cooling sector
ERE shares of gross FEC for transport
( %) ( %)
2005 2010 2015 2016 2017 2005 2010 2015 2016 2017 Target
Austria 21.9 28.7 32.0 32.2 32.1 5.1 10.7 11.4 10.6 9.7
Belgium 3.4 6.1 7.7 8.1 8.0 0.6 4.7 3.9 6.0 6.6
Bulgaria 14.3 24.4 28.6 30.0 29.9 0.8 1.4 6.4 7.2 7.2
Croatia 30.0 32.8 38.5 37.6 36.6 1.0 1.1 3.6 1.3 1.2
Cyprus 10.0 18.2 22.5 23.0 24.5 0,0 2.0 2.5 2.7 2.6
Czech Republic 10.9 14.1 19.7 19.8 19.7 0.9 5.1 6.5 6.4 6.6
Denmark 22.8 31.0 40.7 42.2 46.5 0.4 1.2 6.7 6.8 6.8
Estonia 32.2 43.3 49.6 51.2 51.6 0.2 0.4 0.4 0.4 0.4
Finland 39.1 44.2 52.6 53.7 54.8 0.9 4.4 24.8 9.0 18.8
France 12.4 16.2 19.9 21.1 21.3 2.1 6.5 8.4 8.7 9.1
Germany 7.7 12.1 13.5 13.1 13.4 4.0 6.4 6.6 7.0 7.0
Greece 12.8 17.9 25.8 24.6 26.6 0.1 1.9 1.1 1.6 4.0 All countries
10 %Hungary 9.9 18.1 21.2 20.9 19.6 0.9 6.1 7.1 7.6 6.8
Ireland 3.4 4.3 6.3 6.3 6.9 0.1 2.5 5.9 5.2 7.4
Italy 8.2 15.6 19.3 18.9 20.1 1.0 4.7 6.5 7.4 6.5
Latvia 42.7 40.7 51.7 51.8 54.6 2.4 4.0 3.9 2.8 2.5
Lithuania 29.3 32.5 46.1 46.6 46.5 0.6 3.8 4.6 3.6 3.7
Luxembourg 3.6 4.7 7.1 7.3 8.1 0.1 2.1 6.7 5.9 6.4
Malta 1.0 7.5 14.8 16.1 19.8 0.0 0.0 4.8 5.4 6.8
Netherlands 2.4 3.1 5.4 5.4 5.9 0.5 3.3 5.4 4.9 5.9
Poland 10.2 11.7 14.5 14.7 14.5 1.6 6.6 5.6 3.9 4.2
Portugal 32.1 33.9 33.5 35.1 34.4 0.5 5.5 7.4 7.7 7.9
Romania 17.9 27.2 25.9 26.9 26.6 1.6 3.4 5.5 6.2 6.6
Slovakia 5.0 7.9 10.8 9.9 9.8 1.6 5.3 8.5 7.7 7.0
Slovenia 18.9 28.1 33.9 34.0 33.2 0.8 3.1 2.2 1.6 2.7
Spain 9.4 12.6 17.0 17.1 17.5 1.3 5.0 1.3 5.3 5.9
Sweden 51.8 60.9 68.6 68.5 69.1 6.2 9.2 25.1 31.1 32.1
United Kingdom 0.8 2.6 6.1 7.0 7.5 0.5 3.3 4.5 5.0 5.1
EU 28 11.1 15.4 18.8 19.0 19.5 1.8 5.2 6.6 7.1 7.4
For more information on the method used to calculate these shares, see the “Information on methodology” section.
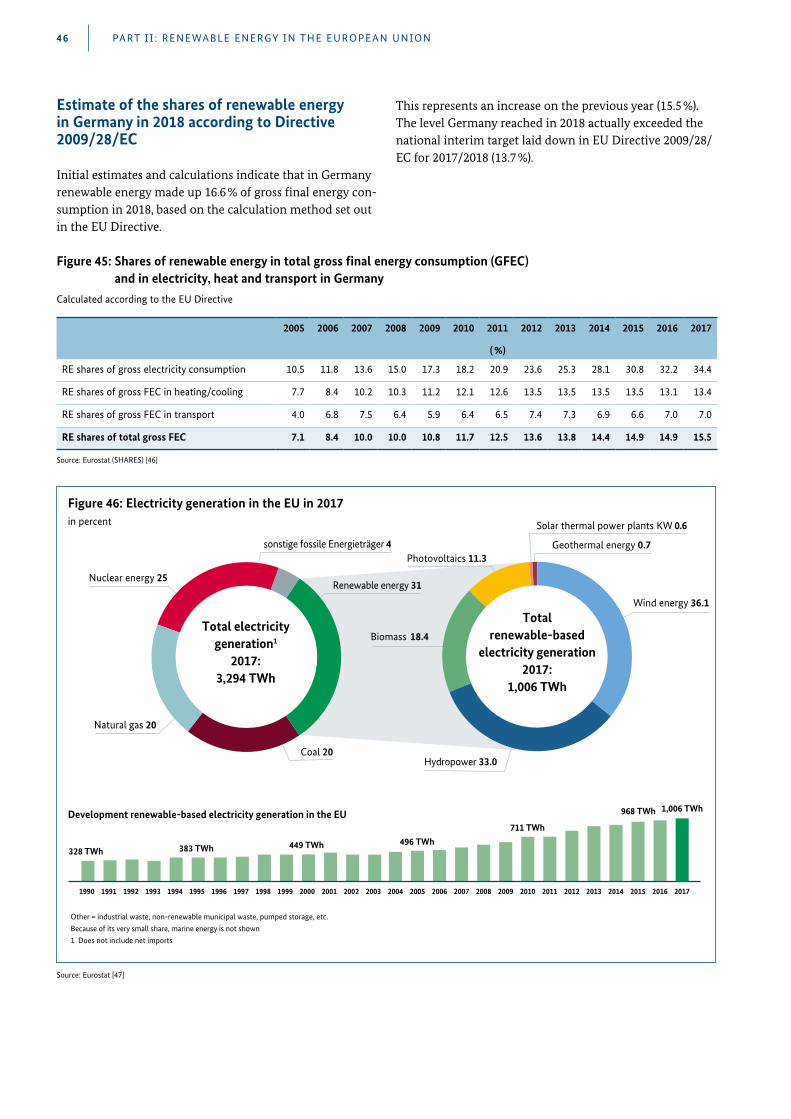
Estimate of the shares of renewable energy in Germany in 2018 according to Directive 2009/28/EC
Initial estimates and calculations indicate that in Germany renewable energy made up 16 .6 % of gross final energy con-sumption in 2018, based on the calculation method set out in the EU Directive .
This represents an increase on the previous year (15 .5 %) . The level Germany reached in 2018 actually exceeded the national interim target laid down in EU Directive 2009/28/EC for 2017/2018 (13 .7 %) .
Source: Eurostat (SHARES) [46]
2005 2006 2007 2008 2009 2010 2011 2012 2013 2014 2015 2016 2017
( %)
RE shares of gross electricity consumption 10.5 11.8 13.6 15.0 17.3 18.2 20.9 23.6 25.3 28.1 30.8 32.2 34.4
RE shares of gross FEC in heating/cooling 7.7 8.4 10.2 10.3 11.2 12.1 12.6 13.5 13.5 13.5 13.5 13.1 13.4
RE shares of gross FEC in transport 4.0 6.8 7.5 6.4 5.9 6.4 6.5 7.4 7.3 6.9 6.6 7.0 7.0
RE shares of total gross FEC 7.1 8.4 10.0 10.0 10.8 11.7 12.5 13.6 13.8 14.4 14.9 14.9 15.5
Figure 45: Shares of renewable energy in total gross final energy consumption (GFEC) and in electricity, heat and transport in Germany
Calculated according to the EU Directive
PART I I : RENEWABLE ENERGY IN THE EUROPEAN UNION46
sonstige fossile Energieträger 4
Nuclear energy 25
Wind energy 36.1
Hydropower 33.0
Photovoltaics 11.3
Solar thermal power plants KW 0.6
Geothermal energy 0.7
Coal 20
Totalrenewable-based
electricity generation2017:
1,006 TWh
Development renewable-based electricity generation in the EU
1990 1991 1992 1993 1994 1995 1996 1997 1998 1999 2000 2001 2002 2003 2004 2005 2006 2007 2008 2009 2010 2011 2012 2013
968 TWh
711 TWh
496 TWh449 TWh383 TWh328 TWh
2014 2015
generation1
Total electricity
2017:3,294 TWh
2016
Other = industrial waste, non-renewable municipal waste, pumped storage, etc.Because of its very small share, marine energy is not shown1 Does not include net imports
Renewable energy 31
Natural gas 20
Biomass
18.4
2017
1,006 TWh
Figure 46: Electricity generation in the EU in 2017in percent
Source: Eurostat [47]
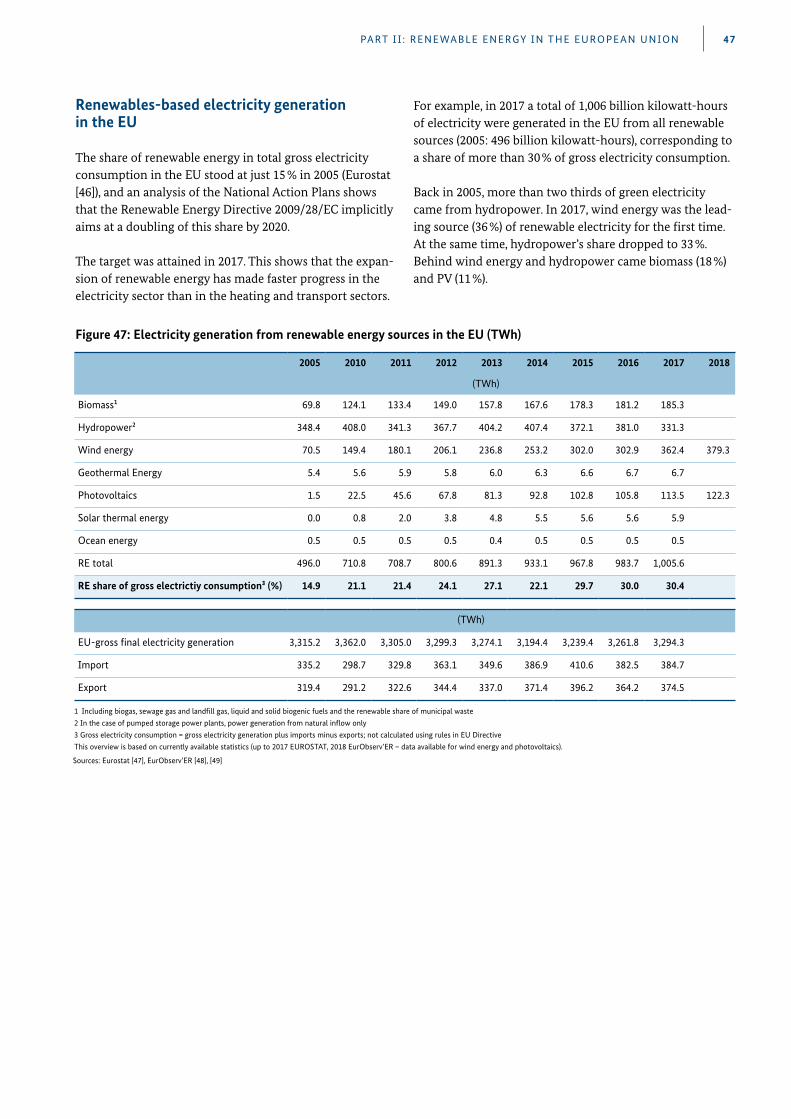
PART I I : RENEWABLE ENERGY IN THE EUROPEAN UNION 47
Renewables-based electricity generation in the EU
The share of renewable energy in total gross electricity consumption in the EU stood at just 15 % in 2005 (Eurostat [46]), and an analysis of the National Action Plans shows that the Renewable Energy Directive 2009/28/EC implicitly aims at a doubling of this share by 2020 .
The target was attained in 2017 . This shows that the expan-sion of renewable energy has made faster progress in the electricity sector than in the heating and transport sectors .
For example, in 2017 a total of 1,006 billion kilowatt-hours of electricity were generated in the EU from all renewable sources (2005: 496 billion kilowatt-hours), corresponding to a share of more than 30 % of gross electricity consumption .
Back in 2005, more than two thirds of green electricity came from hydropower . In 2017, wind energy was the lead-ing source (36 %) of renewable electricity for the first time . At the same time, hydropower’s share dropped to 33 % . Behind wind energy and hydropower came biomass (18 %) and PV (11 %) .
2005 2010 2011 2012 2013 2014 2015 2016 2017 2018
(TWh)
Biomass¹ 69.8 124.1 133.4 149.0 157.8 167.6 178.3 181.2 185.3
Hydropower² 348.4 408.0 341.3 367.7 404.2 407.4 372.1 381.0 331.3
Wind energy 70.5 149.4 180.1 206.1 236.8 253.2 302.0 302.9 362.4 379.3
Geothermal Energy 5.4 5.6 5.9 5.8 6.0 6.3 6.6 6.7 6.7
Photovoltaics 1.5 22.5 45.6 67.8 81.3 92.8 102.8 105.8 113.5 122.3
Solar thermal energy 0.0 0.8 2.0 3.8 4.8 5.5 5.6 5.6 5.9
Ocean energy 0.5 0.5 0.5 0.5 0.4 0.5 0.5 0.5 0.5
RE total 496.0 710.8 708.7 800.6 891.3 933.1 967.8 983.7 1,005.6
RE share of gross electrictiy consumption³ (%) 14.9 21.1 21.4 24.1 27.1 22.1 29.7 30.0 30.4
(TWh)
EU-gross final electricity generation 3,315.2 3,362.0 3,305.0 3,299.3 3,274.1 3,194.4 3,239.4 3,261.8 3,294.3
Import 335.2 298.7 329.8 363.1 349.6 386.9 410.6 382.5 384.7
Export 319.4 291.2 322.6 344.4 337.0 371.4 396.2 364.2 374.5
1 Including biogas, sewage gas and landfill gas, liquid and solid biogenic fuels and the renewable share of municipal waste2 In the case of pumped storage power plants, power generation from natural inflow only 3 Gross electricity consumption = gross electricity generation plus imports minus exports; not calculated using rules in EU DirectiveThis overview is based on currently available statistics (up to 2017 EUROSTAT, 2018 EurObserv’ER – data available for wind energy and photovoltaics).
Sources: Eurostat [47], EurObserv’ER [48], [49]
Figure 47: Electricity generation from renewable energy sources in the EU (TWh)

Figure 48: Electricity generation from renewable energy sources in the EU, 2017
PART I I : RENEWABLE ENERGY IN THE EUROPEAN UNION48
Source: Eurostat [47]
The highest share of electricity consumption covered by renewable energy in the EU in 2017 was recorded by Sweden, at just under 66 %, followed by Denmark with 60 %, Latvia and Portugal with 54 % each . The lowest shares were registered by Malta (just under 7 %), Hungary and Luxembourg (both around 8 %) and Cyprus (9 %) .
The volume of power generated from renewables rose by less than installed capacity . This is because the large amount of new wind and, especially, solar capacity have fewer hours of full capacity than hydropower, which
was still dominant in 2005 . Total renewable energy capacity in 2005 stood at 179 gigawatts, and rose by one-and-a-half times to around 445 gigawatts by the end of 2017 . Back in 2005, hydropower dominated, with two thirds of installed capacity . In 2017, most installed capacity (38 %) took the form of wind energy, followed by hydropower (29 %) and PV (24 %) .
Hydropower Wind-energy
Bio mass1 Biogas2 Lioquid biogenic
fuels
Photo- voltaics
Solar thermal
power plants
Geo thermal energy
Ocean energy
Total
(TWh)
Austria 42.3 6.6 4.0 0.6 < 0.01 1.3 – < 0.01 – 54.7
Belgium 1.4 6.5 4.8 0.9 0.04 3.3 – – – 17.0
Bulgaria 3.5 1.5 0.2 0.2 – 1.4 – – – 6.8
Croatia 5.5 1.2 0.2 0.3 – 0.08 – – – 7.3
Cyprus – 0.2 – 0.1 – 0.2 – – – 0.4
Czech Republic 3.0 0.6 2.3 2.6 – 2.2 – – – 10.8
Denmark 0.02 14.8 5.7 0.7 – 0.8 – – – 21.9
Estonia 0.03 0.7 1.0 0.04 – – – – – 1.8
Finland 14.8 4.8 11.4 0.4 0.01 0.04 – – – 31.5
France 55.1 24.7 5.6 2.1 < 0.01 9.6 – 0.13 0.52 97.7
Germany 26.2 105.7 16.6 33.9 0.4 39.4 – 0.16 – 222.3
Greece 4.0 5.5 0.01 0.3 – 4.0 – – – 13.9
Hungary 0.2 0.8 1.8 0.3 – 0.3 – < 0.01 – 3.5
Ireland 0.9 7.4 0.5 0.2 – 0.01 – – – 9.1
Italy 38.0 17.7 6.6 8.3 4.5 24.4 – 6.2 – 105.7
Latvia 4.4 0.2 0.5 0.4 – 0.0 – – – 5.5
Lithuania 1.2 1.4 0.4 0.1 – 0.1 – – – 3.1
Luxembourg 1.4 0.2 0.1 0.1 – 0.1 – – – 1.9
Malta – 0.0 – 0.01 – 0.16 – – – 0.2
Netherlands 0.1 10.6 3.7 0.9 – 2.2 – – – 17.4
Poland 3.0 14.9 5.4 1.1 < 0.01 0.17 – – – 24.6
Portugal 7.6 12.2 2.9 0.3 – 1.0 – 0.22 < 0.01 24.3
Romania 14.9 7.4 0.5 0.1 – 1.9 – – – 24.6
Slovakia 4.6 0.01 1.1 0.6 – 0.5 – – – 6.8
Slovenia 4.1 0.01 0.2 0.1 < 0.01 0.3 – – – 4.7
Spain 21.1 49.1 5.1 0.9 – 8.5 5.9 – – 90.7
Sweden 65.2 17.6 12.0 0.01 0.04 0.23 – – – 95.1
United Kingdom 8.8 50.0 24.1 7.7 – 11.5 – – < 0.01 102.2
Region EU28 331.3 362.4 116.9 63.4 5.0 113.5 5.9 6.7 0.5 1,005.6
For details on the method used to calculate these shares, see the “Information on methodology” section.1 In order to determine the shares of renewable energy in gross electricity consumption, electricity production from
wind and hydropower was calculated using the normalisation rule defined in the EU Directive.
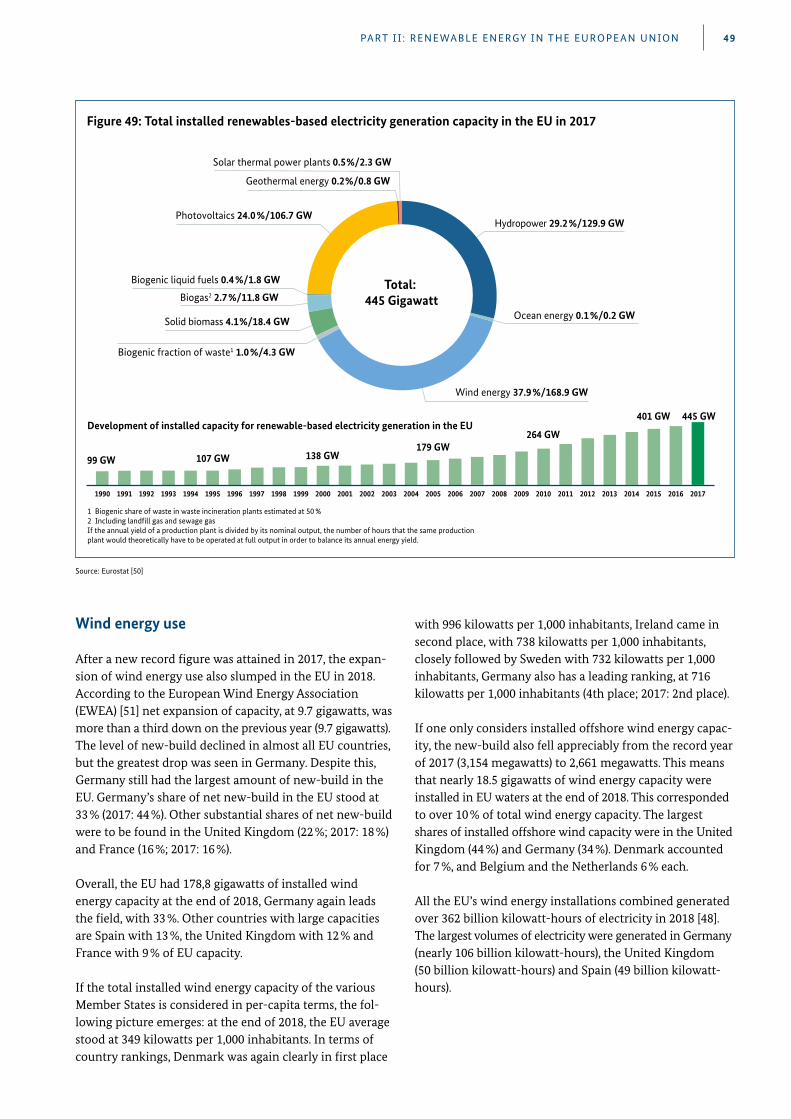
PART I I : RENEWABLE ENERGY IN THE EUROPEAN UNION 49
Source: Eurostat [50]
Biogas2 2.7%/11.8 GW
Solid biomass 4.1%/18.4 GW
Biogenic fraction of waste1 1.0%/4.3 GW
Ocean energy 0.1%/0.2 GW
Development of installed capacity for renewable-based electricity generation in the EU
Photovoltaics 24.0%/106.7 GW
Hydropower 29.2%/129.9 GW
Wind energy 37.9%/168.9 GW
1990 1991 1992 1993 1994 1995 1996 1997 1998 1999 2000 2001 2002 2003 2004 2005 2006 2007 2008 2009 2010 2011 2012 2013
264 GW179 GW
107 GW99 GW
2014
138 GW
445 GW
2015
Total: 445 Gigawatt
2016
1 Biogenic share of waste in waste incineration plants estimated at 50 %2 Including land�ll gas and sewage gasIf the annual yield of a production plant is divided by its nominal output, the number of hours that the same production plant would theoretically have to be operated at full output in order to balance its annual energy yield.
Solar thermal power plants 0.5%/2.3 GW
Geothermal energy 0.2%/0.8 GW
Biogenic liquid fuels 0.4%/1.8 GW
2017
401 GW
Figure 49: Total installed renewables-based electricity generation capacity in the EU in 2017
Wind energy use
After a new record figure was attained in 2017, the expan-sion of wind energy use also slumped in the EU in 2018 . According to the European Wind Energy Association (EWEA) [51] net expansion of capacity, at 9 .7 gigawatts, was more than a third down on the previous year (9 .7 gigawatts) . The level of new-build declined in almost all EU countries, but the greatest drop was seen in Germany . Despite this, Germany still had the largest amount of new-build in the EU . Germany’s share of net new-build in the EU stood at 33 % (2017: 44 %) . Other substantial shares of net new-build were to be found in the United Kingdom (22 %; 2017: 18 %) and France (16 %; 2017: 16 %) .
Overall, the EU had 178,8 gigawatts of installed wind energy capacity at the end of 2018, Germany again leads the field, with 33 % . Other countries with large capacities are Spain with 13 %, the United Kingdom with 12 % and France with 9 % of EU capacity .
If the total installed wind energy capacity of the various Member States is considered in per-capita terms, the fol-lowing picture emerges: at the end of 2018, the EU average stood at 349 kilowatts per 1,000 inhabitants . In terms of country rankings, Denmark was again clearly in first place
with 996 kilowatts per 1,000 inhabitants, Ireland came in second place, with 738 kilowatts per 1,000 inhabitants, closely followed by Sweden with 732 kilowatts per 1,000 inhabitants, Germany also has a leading ranking, at 716 kilowatts per 1,000 inhabitants (4th place; 2017: 2nd place) .
If one only considers installed offshore wind energy capac-ity, the new-build also fell appreciably from the record year of 2017 (3,154 megawatts) to 2,661 megawatts . This means that nearly 18 .5 gigawatts of wind energy capacity were installed in EU waters at the end of 2018 . This corresponded to over 10 % of total wind energy capacity . The largest shares of installed offshore wind capacity were in the United Kingdom (44 %) and Germany (34 %) . Denmark accounted for 7 %, and Belgium and the Netherlands 6 % each .
All the EU’s wind energy installations combined generated over 362 billion kilowatt-hours of electricity in 2018 [48] . The largest volumes of electricity were generated in Germany (nearly 106 billion kilowatt-hours), the United Kingdom (50 billion kilowatt-hours) and Spain (49 billion kilowatt- hours) .
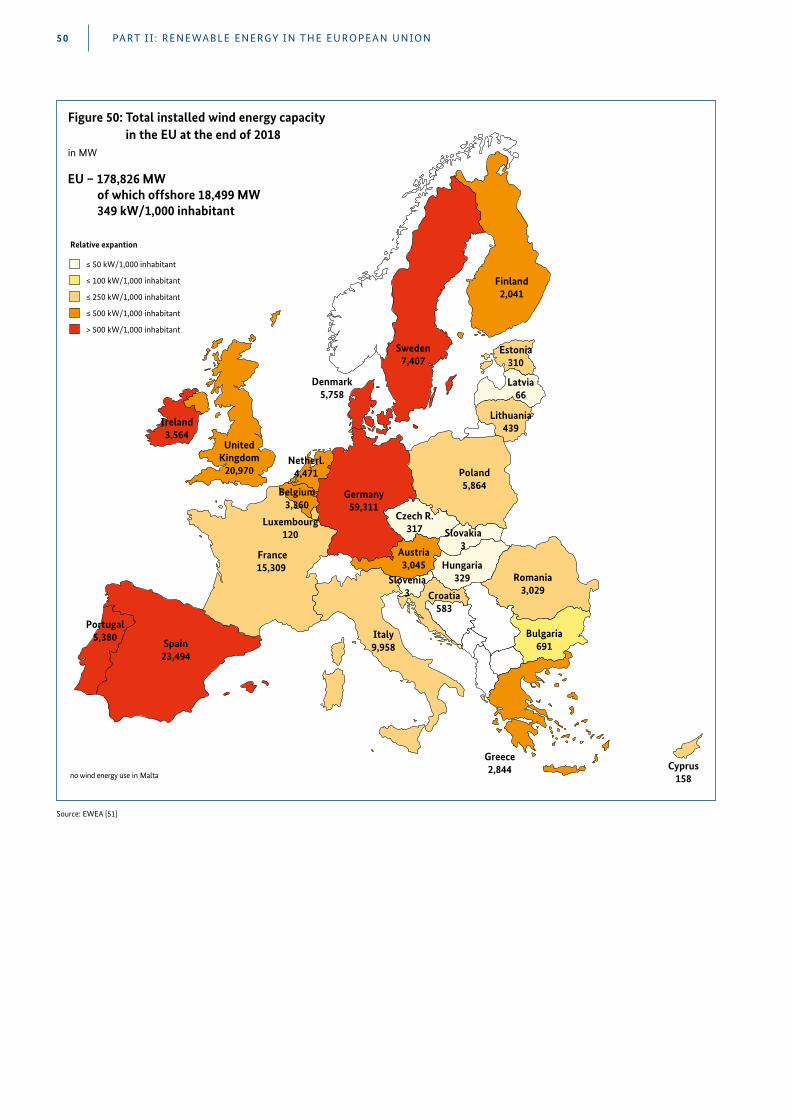
Spain23,494
Portugal5,380 Italy
9,958
France15,309
Germany59,311
Romania3,029
Bulgaria691
Croatia583
Slovakia3
Czech R.317
Poland5,864
Austria3,045
Slovenia3
Greece2,844
Belgium3,360
Netherl.4,471
Denmark5,758
UnitedKingdom
20,970
Ireland3,564
Sweden7,407
Finland2,041
Estonia310
Latvia66
Lithuania439
Cyprus158
Hungaria329
Luxembourg120
Relative expantion
≤ 50 kW/1,000 inhabitant
≤ 100 kW/1,000 inhabitant
≤ 250 kW/1,000 inhabitant
≤ 500 kW/1,000 inhabitant
> 500 kW/1,000 inhabitant
EU – 178,826 MW of which offshore 18,499 MW 349 kW/1,000 inhabitant
keine Windenergienutzung in Malta
1 vorläufig
Quellen: EWEA [36] no wind energy use in Malta
Figure 50: Total installed wind energy capacity in the EU at the end of 2018
in MW
Source: EWEA [51]
PART I I : RENEWABLE ENERGY IN THE EUROPEAN UNION50
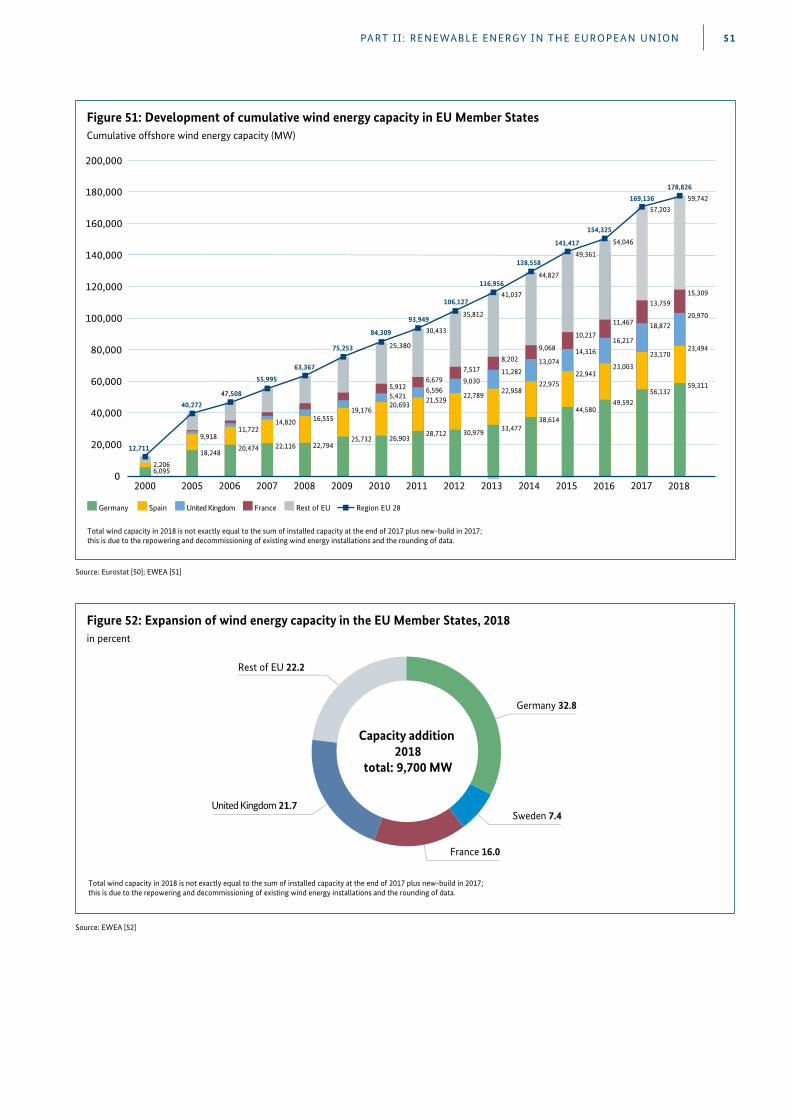
PART I I : RENEWABLE ENERGY IN THE EUROPEAN UNION 51
160,000
140,000
120,000
100,000
80,000
60,000
40,000
20,000
180,000
200,000
Total wind capacity in 2018 is not exactly equal to the sum of installed capacity at the end of 2017 plus new-build in 2017; this is due to the repowering and decommissioning of existing wind energy installations and the rounding of data.
Germany Spain United Kingdom France Rest of EU Region EU 28
20152014201320122011201020092008200720062005
141,417
10,217
14,316
22,943
44,580
44,827
9,068
13,074
22,975
38,614
41,037
8,202
11,282
22,958
35,812
7,517
9,030
30,979
93,949
30,433
6,6796,596 21,529
84,309
25,380
5,9125,42120,693
75,253
19,176
63,367
16,55514,820
22,116
47,508
11,722
20,474
9,918
18,248
2,2066,095
2000
128,558
116,956
33,477
106,127
22,789
28,71226,90325,732
55,995
40,272
12,711
54,046
154,325
11,467
16,217
23,003
49,592
2016
57,203
13,759
18,872
23,170
56,132
20170
22,794
169,136
2018
59,742
15,309
20,970
178,826
49,361
23,494
59,311
United Kingdom 21.7
France 16.0
Germany 32.8
Rest of EU 22.2
Capacity addition 2018
total: 9,700 MW
Total wind capacity in 2018 is not exactly equal to the sum of installed capacity at the end of 2017 plus new-build in 2017; this is due to the repowering and decommissioning of existing wind energy installations and the rounding of data.
Sweden 7.4
Figure 52: Expansion of wind energy capacity in the EU Member States, 2018in percent
Source: EWEA [52]
Figure 51: Development of cumulative wind energy capacity in EU Member StatesCumulative offshore wind energy capacity (MW)
Source: Eurostat [50]; EWEA [51]
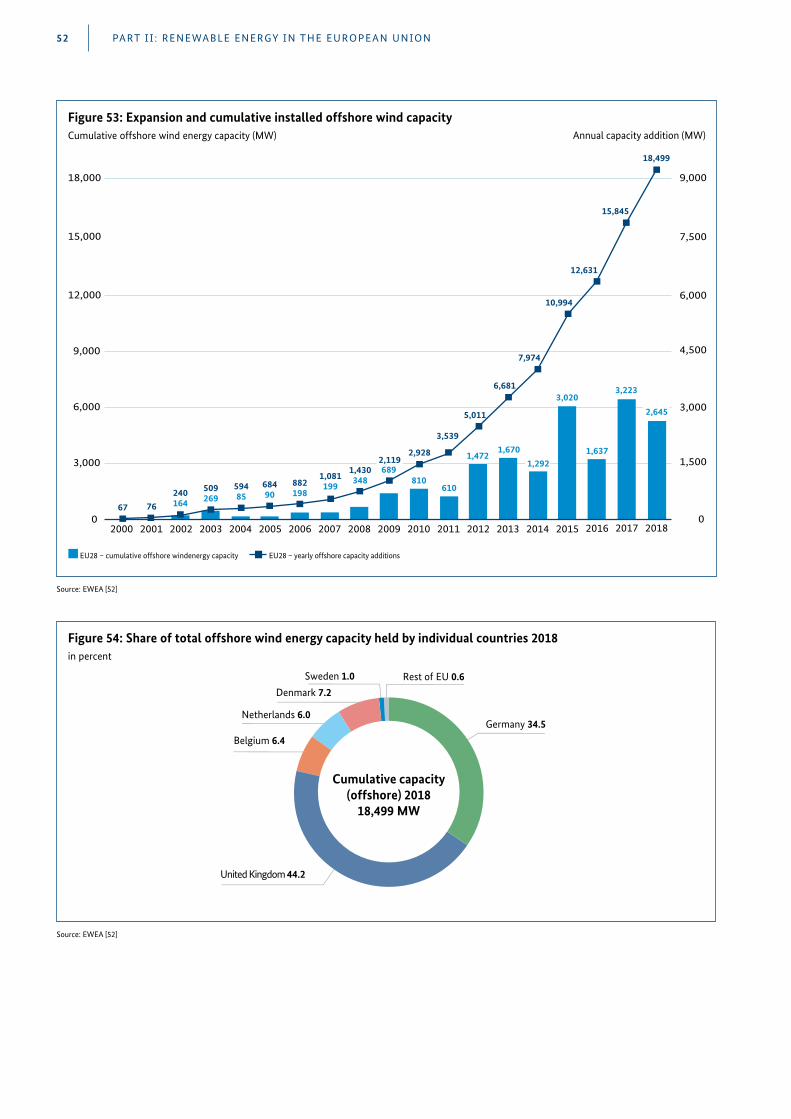
PART I I : RENEWABLE ENERGY IN THE EUROPEAN UNION52
3,000
6,000
9,000
12,000
15,000
18,000
7,500
Annual capacity addition (MW)
1,500
3,000
4,500
6,000
201520142013201220112010
810
200920082007200620052004200320022000
67 76 240
164
509269
594 85
68490
882198
1,081199
1,430 348
2,1192,928
610
3,539
1,472
5,011
1,670
6,681
10,994
2001
1,292
7,974
2016
1,637
12,631
EU28 – cumulative offshore windenergy capacity EU28 – yearly offshore capacity additions
15,845
2018
689
0 02017
18,499
2,645
3,2233,020
9,000
Figure 53: Expansion and cumulative installed offshore wind capacityCumulative offshore wind energy capacity (MW)
Source: EWEA [52]
United Kingdom 44.2
Netherlands 6.0
Sweden 1.0
Germany 34.5
Rest of EU 0.6 Denmark 7.2
Belgium 6.4
Cumulative capacity
(offshore) 201818,499 MW
Figure 54: Share of total offshore wind energy capacity held by individual countries 2018in percent
Source: EWEA [52]
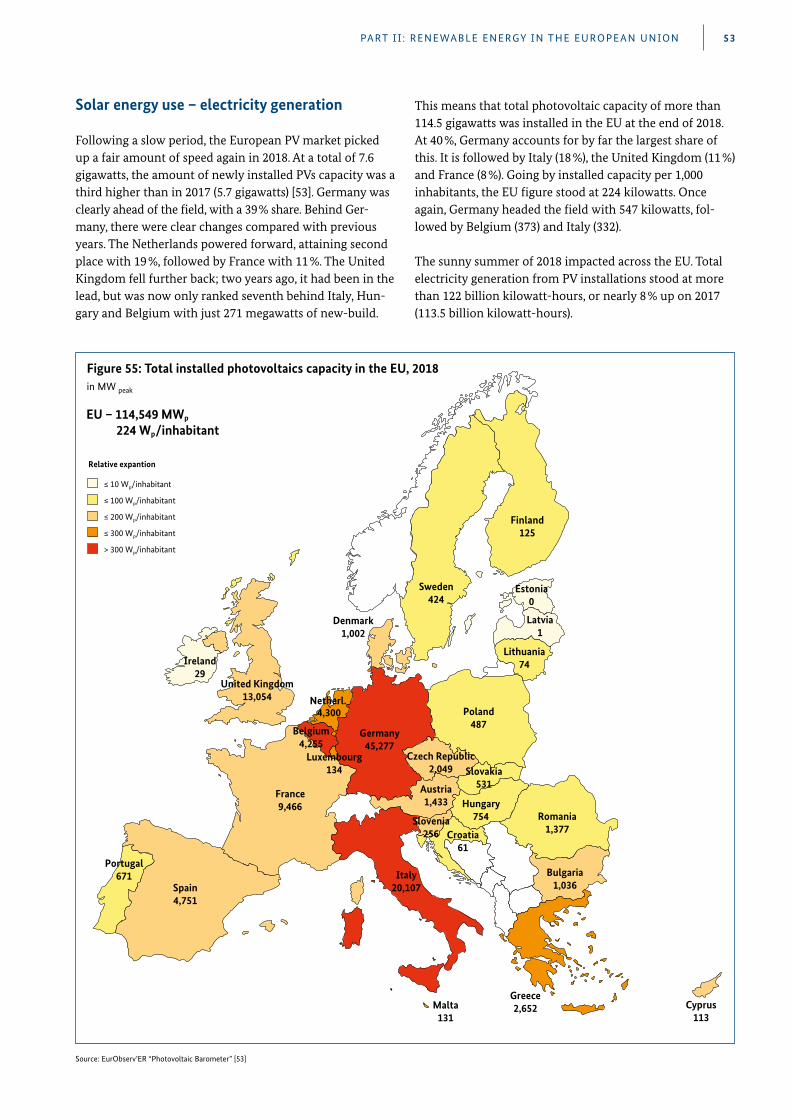
PART I I : RENEWABLE ENERGY IN THE EUROPEAN UNION 53
Solar energy use – electricity generation
Following a slow period, the European PV market picked up a fair amount of speed again in 2018 . At a total of 7 .6 gigawatts, the amount of newly installed PVs capacity was a third higher than in 2017 (5 .7 gigawatts) [53] . Germany was clearly ahead of the field, with a 39 % share . Behind Ger-many, there were clear changes compared with previous years . The Netherlands powered forward, attaining second place with 19 %, followed by France with 11 % . The United Kingdom fell further back; two years ago, it had been in the lead, but was now only ranked seventh behind Italy, Hun-gary and Belgium with just 271 megawatts of new-build .
This means that total photovoltaic capacity of more than 114 .5 gigawatts was installed in the EU at the end of 2018 . At 40 %, Germany accounts for by far the largest share of this . It is followed by Italy (18 %), the United Kingdom (11 %) and France (8 %) . Going by installed capacity per 1,000 inhabitants, the EU figure stood at 224 kilowatts . Once again, Germany headed the field with 547 kilowatts, fol-lowed by Belgium (373) and Italy (332) .
The sunny summer of 2018 impacted across the EU . Total electricity generation from PV installations stood at more than 122 billion kilowatt-hours, or nearly 8 % up on 2017 (113 .5 billion kilowatt-hours) .
Spain4,751
Portugal671 Italy
20,107
France9,466
Germany45,277
Romania1,377
Bulgaria1,036
Croatia61
Slovakia531
Czech Republic2,049
Poland487
Austria1,433
Slovenia256
Greece2,652
Netherl. 4,300
Denmark1,002
United Kingdom13,054
Ireland29
Sweden424
Finland125
Estonia0
Latvia1
Lithuania74
Cyprus113
Hungary754
Luxembourg134
Relative expantion
EU – 114,549 MWp 224 Wp/inhabitant
Malta131
Belgium4,255
≤ 10 WP/inhabitant
≤ 100 WP/inhabitant
≤ 200 WP/inhabitant
≤ 300 WP/inhabitant
> 300 WP/inhabitant
Source: EurObserv’ER “Photovoltaic Barometer” [53]
Figure 55: Total installed photovoltaics capacity in the EU, 2018in MW peak
PART I I : RENEWABLE ENERGY IN THE EUROPEAN UNION54
Solar thermal power installations are also used in the EU to generate electricity using solar energy . However, they are only viable in southern European regions with high num-bers of hours of sunshine . At times, the funding available in Spain for such power stations was particularly attractive . As a result, the country became a leader in solar thermal electricity generation, not only in the EU, but worldwide . As a result, almost all of solar thermal capacity installed in the EU – amounting to roughly 2,300 megawatts – is located in Spain . At roughly 5 billion kilowatt-hours of electricity, the installations cover around 2 % of Spanish electricity consumption each year [53] .
Solar energy use – heat supply
According to the EurObserv’ER Solar Thermal Barometer [49], the pan-EU solar thermal market expanded in 2018 after almost 10 years of shrinkage . More than 2 .2 million square meters of new solar collector surface area was installed in the EU, corresponding to a thermal capacity of 1 .55 gigawatts; this was 8 .4 % more than in 2017 (2 .04 mil-lion square meters) . At the end of 2018, the EU had a total installed collector surface area of just under 53 .5 million square meters, corresponding to a thermal output of 37 .4 gigawatts .
Even though the solar thermal market shrank further in Germany, in contrast to the EU-wide trend, with 573,500 square meters of new glazed collector surface area, Germany continued to be the biggest market in Europe . However, Greece caught up further in second place, with 328,500 . It was followed by Poland, where the newly installed collector surface area was almost three times as much as in 2017, at 310,000 square meters . The Polish market was thus the main driver behind the upward trend in the EU as a whole . It was followed by Spain (205,500 square meters) and France (156,100) .
Taking the total installed collector surface area at the end of 2018, the largest collector surface area was installed in Germany (19 .3 million square meters), followed by Austria (5 .1 million), Greece (4 .7 million), Spain (4 .3 million) and Italy (4 .2 million) . In per-capita terms, Cyprus continues to top the ranking, with 1 .24 square meters, ahead of Austria (0 .58) and Greece (0 .44) .
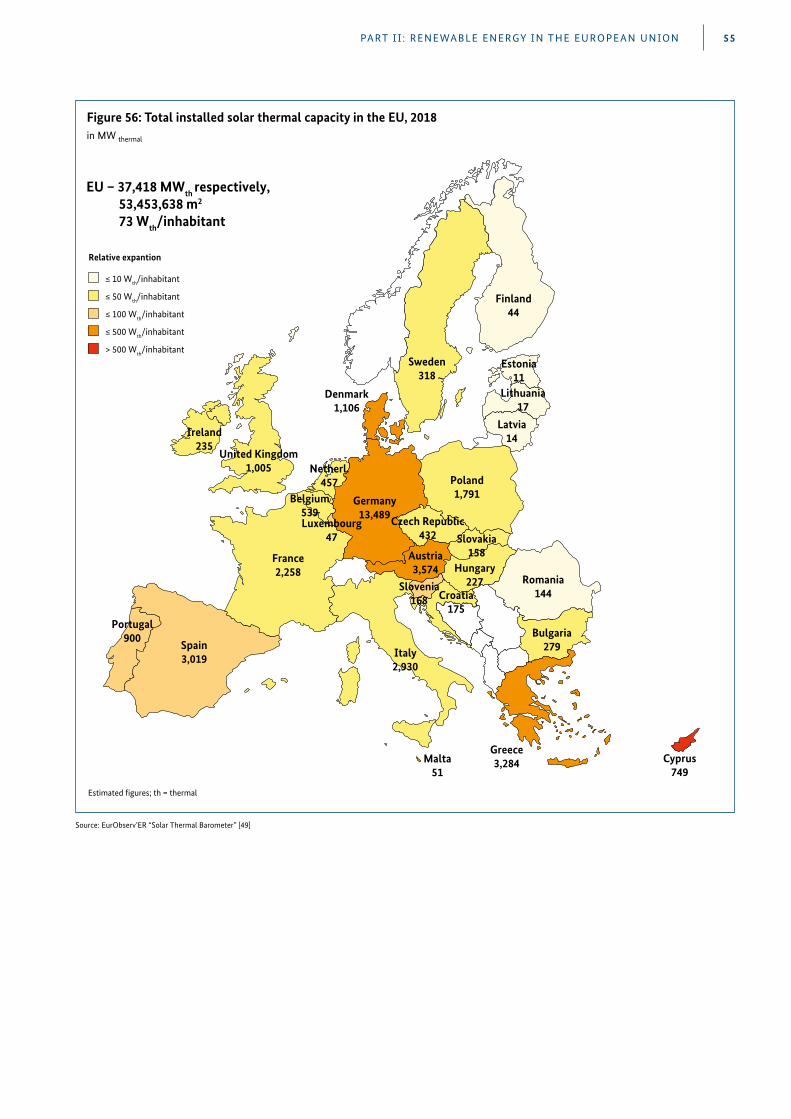
PART I I : RENEWABLE ENERGY IN THE EUROPEAN UNION 55
Spain3,019
Portugal900
Italy2,930
France2,258
Germany13,489
Romania144
Bulgaria279
Croatia175
Slovakia158
Czech Republic432
Poland1,791
Austria3,574
Slovenia168
Greece3,284
Belgium539
Netherl.457
Denmark1,106
United Kingdom1,005
Ireland235
Sweden318
Finland44
Estonia11
Lithuania17
Latvia14
Cyprus749
Hungary227
Luxembourg47
Malta51
EU – 37,418 MWth respectively, 53,453,638 m2
73 Wth/inhabitant
Estimated �gures; th = thermal
Relative expantion
≤ 10 Wth/inhabitant
≤ 50 Wth/inhabitant
≤ 100 Wth/inhabitant
≤ 500 Wth/inhabitant
> 500 Wth/inhabitant
Figure 56: Total installed solar thermal capacity in the EU, 2018in MW thermal
Source: EurObserv’ER “Solar Thermal Barometer” [49]
PART I I : RENEWABLE ENERGY IN THE EUROPEAN UNION56
Renewable energy sources in the transport sector
EU Directive 2009/28/EC sets a binding target for the trans-port sector, namely that the share of final energy consump-tion from renewable sources in each EU Member State must be at least 10 % by 2020, taking multiple-counting options into consideration . Owing to the debate surround-ing the sustainability of first-generation biofuels and to increasing interest in electric mobility options, the use of both biodiesel and bioethanol was flat in 2016 . However, there has been an upward trend since 2017 . Following a rise in the preceding year, the consumption of bioethanol and biodiesel in the EU increased again by a total of approximately 9 % to around 19,635 kilotons . At around 9 %, biodiesel expanded somewhat more strongly than bioethanol (+7 %) (cf . Figure 57) .
Regional sales of electric vehicles rose by around 40 % in 2018 in Europe, to roughly 350,000 vehicles . The largest number of new registrations of electric vehicles was seen in Norway (around 86,300), followed by Germany (around 67,500), the United Kingdom (around 59,900) and France (around 53,700) . Around 29,000 new vehicles were regis-tered in both the Netherlands and Spain . Sales in the EU amount to around 16 % of global sales of electric vehicles [54] .
Figure 57 shows the consumption of biodiesel (incl . HVO) and bioethanol in 2017 and the provisional figures for 2018 . It does not contain data on other biofuels (biomethane, pure vegetable oil), as these only play a very minor role .
Further information about biofuels in Europe can be found on the EurObserv’ER website at www .eurobserv-er .org/ category/all-biofuels-barometers/, along with additional background information (e . g . on the use of biogas as a fuel) .
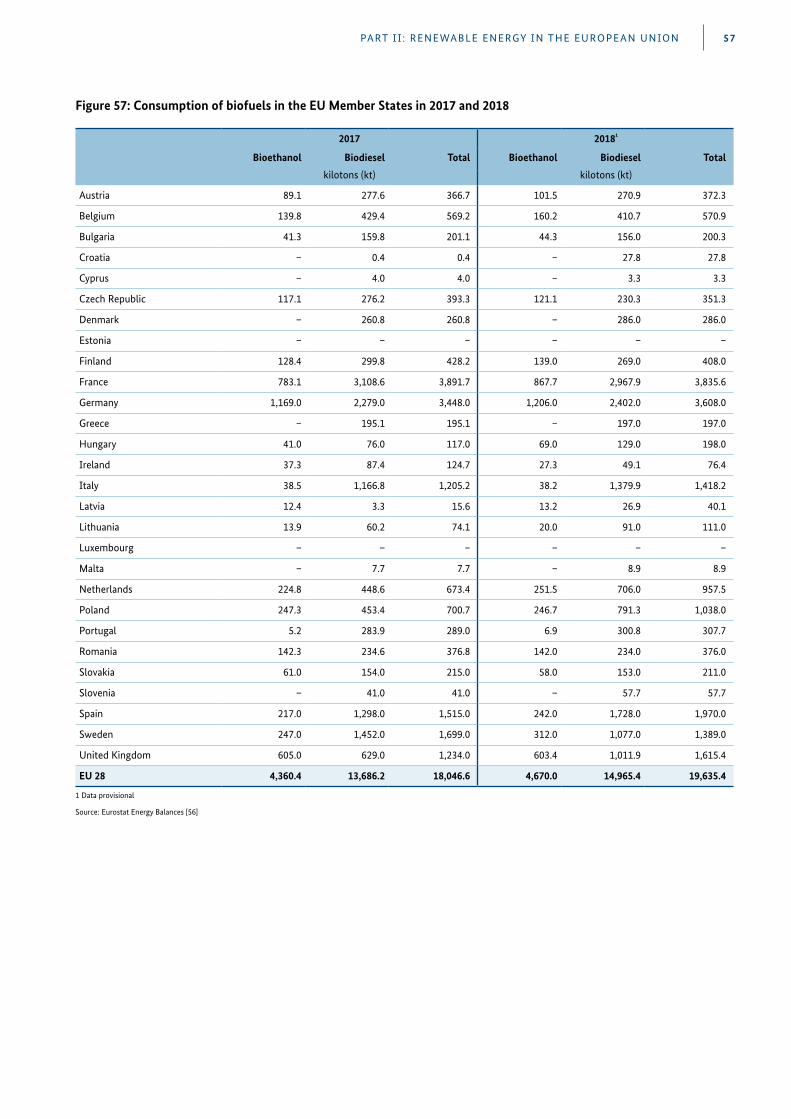
PART I I : RENEWABLE ENERGY IN THE EUROPEAN UNION 57
Figure 57: Consumption of biofuels in the EU Member States in 2017 and 2018
2017 2018¹
Bioethanol Biodiesel Total Bioethanol Biodiesel Total
kilotons (kt) kilotons (kt)
Austria 89.1 277.6 366.7 101.5 270.9 372.3
Belgium 139.8 429.4 569.2 160.2 410.7 570.9
Bulgaria 41.3 159.8 201.1 44.3 156.0 200.3
Croatia – 0.4 0.4 – 27.8 27.8
Cyprus – 4.0 4.0 – 3.3 3.3
Czech Republic 117.1 276.2 393.3 121.1 230.3 351.3
Denmark – 260.8 260.8 – 286.0 286.0
Estonia – – – – – –
Finland 128.4 299.8 428.2 139.0 269.0 408.0
France 783.1 3,108.6 3,891.7 867.7 2,967.9 3,835.6
Germany 1,169.0 2,279.0 3,448.0 1,206.0 2,402.0 3,608.0
Greece – 195.1 195.1 – 197.0 197.0
Hungary 41.0 76.0 117.0 69.0 129.0 198.0
Ireland 37.3 87.4 124.7 27.3 49.1 76.4
Italy 38.5 1,166.8 1,205.2 38.2 1,379.9 1,418.2
Latvia 12.4 3.3 15.6 13.2 26.9 40.1
Lithuania 13.9 60.2 74.1 20.0 91.0 111.0
Luxembourg – – – – – –
Malta – 7.7 7.7 – 8.9 8.9
Netherlands 224.8 448.6 673.4 251.5 706.0 957.5
Poland 247.3 453.4 700.7 246.7 791.3 1,038.0
Portugal 5.2 283.9 289.0 6.9 300.8 307.7
Romania 142.3 234.6 376.8 142.0 234.0 376.0
Slovakia 61.0 154.0 215.0 58.0 153.0 211.0
Slovenia – 41.0 41.0 – 57.7 57.7
Spain 217.0 1,298.0 1,515.0 242.0 1,728.0 1,970.0
Sweden 247.0 1,452.0 1,699.0 312.0 1,077.0 1,389.0
United Kingdom 605.0 629.0 1,234.0 603.4 1,011.9 1,615.4
EU 28 4,360.4 13,686.2 18,046.6 4,670.0 14,965.4 19,635.4
1 Data provisional
Source: Eurostat Energy Balances [56]
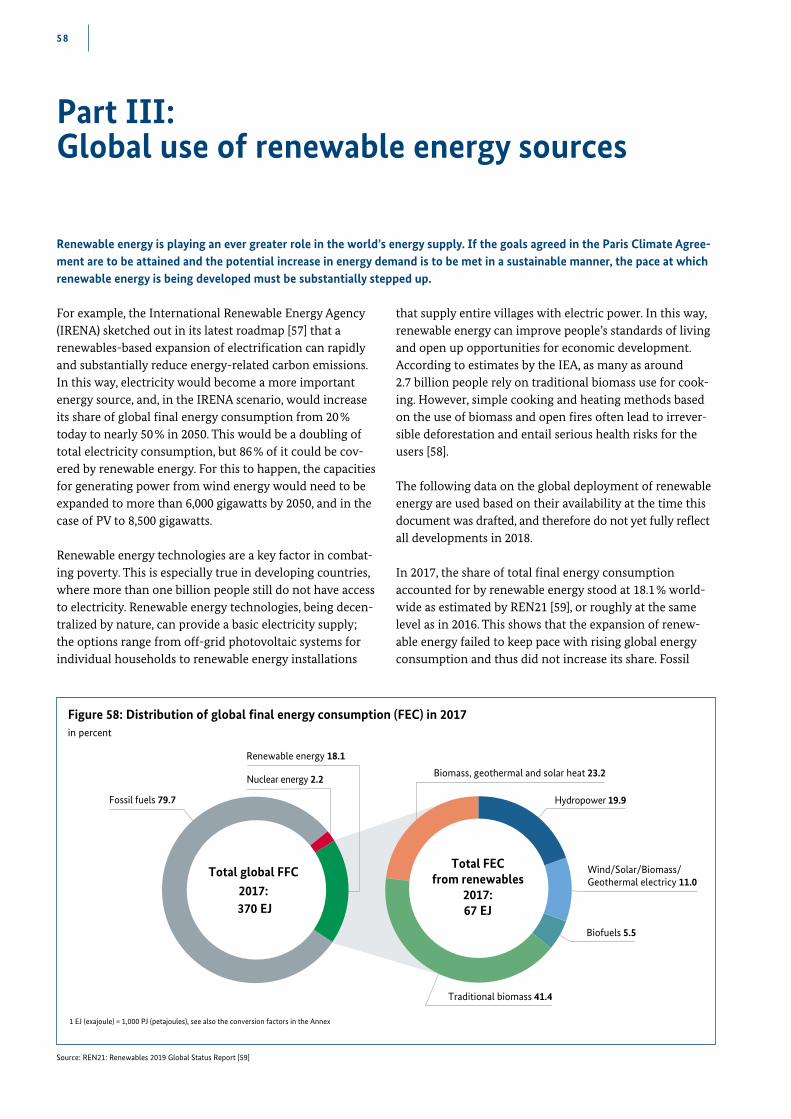
58
Part III: Global use of renewable energy sources
Renewable energy is playing an ever greater role in the world’s energy supply. If the goals agreed in the Paris Climate Agree-ment are to be attained and the potential increase in energy demand is to be met in a sustainable manner, the pace at which renewable energy is being developed must be substantially stepped up.
For example, the International Renewable Energy Agency (IRENA) sketched out in its latest roadmap [57] that a renewables-based expansion of electrification can rapidly and substantially reduce energy-related carbon emissions . In this way, electricity would become a more important energy source, and, in the IRENA scenario, would increase its share of global final energy consumption from 20 % today to nearly 50 % in 2050 . This would be a doubling of total electricity consumption, but 86 % of it could be cov-ered by renewable energy . For this to happen, the capacities for generating power from wind energy would need to be expanded to more than 6,000 gigawatts by 2050, and in the case of PV to 8,500 gigawatts .
Renewable energy technologies are a key factor in combat-ing poverty . This is especially true in developing countries, where more than one billion people still do not have access to electricity . Renewable energy technologies, being decen-tralized by nature, can provide a basic electricity supply; the options range from off-grid photovoltaic systems for individual households to renewable energy installations
that supply entire villages with electric power . In this way, renewable energy can improve people’s standards of living and open up opportunities for economic development . According to estimates by the IEA, as many as around 2 .7 billion people rely on traditional biomass use for cook-ing . However, simple cooking and heating methods based on the use of biomass and open fires often lead to irrever-sible deforestation and entail serious health risks for the users [58] .
The following data on the global deployment of renewable energy are used based on their availability at the time this document was drafted, and therefore do not yet fully reflect all developments in 2018 .
In 2017, the share of total final energy consumption accounted for by renewable energy stood at 18 .1 % world-wide as estimated by REN21 [59], or roughly at the same level as in 2016 . This shows that the expansion of renew-able energy failed to keep pace with rising global energy consumption and thus did not increase its share . Fossil
Nuclear energy 2.2Biomass, geothermal and solar heat 23.2
Renewable energy 18.1
Hydropower 19.9
Wind/Solar/Biomass/Geothermal electricy 11.0
Biofuels 5.5
Traditional biomass 41.4
Fossil fuels 79.7
Total global FFC 2017: 370 EJ
gesamter EEV aus Erneuerbaren
2016: 65.9 EJ
Total FEC from renewables
2017: 67 EJ
1 EJ (exajoule) = 1,000 PJ (petajoules), see also the conversion factors in the Annex
Figure 58: Distribution of global final energy consumption (FEC) in 2017in percent
Source: REN21: Renewables 2019 Global Status Report [59]
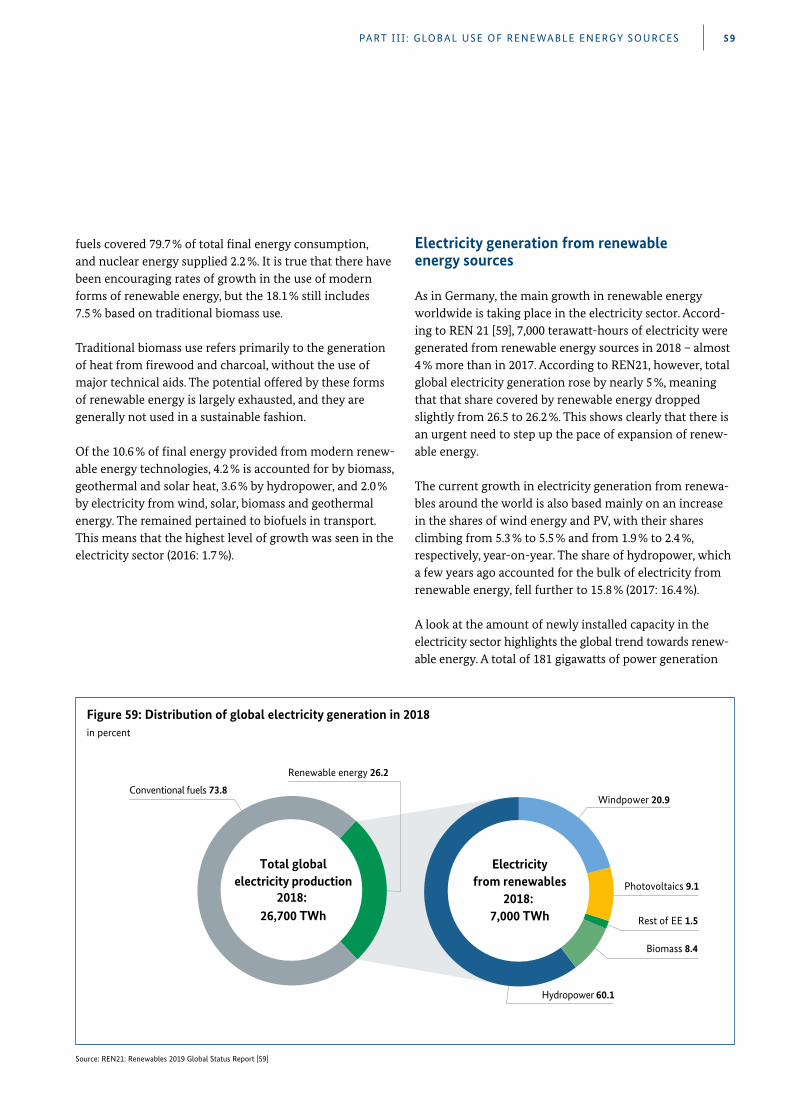
Hydropower 60.1
Biomass 8.4
Photovoltaics 9.1
Rest of EE 1.5
Windpower 20.9
Renewable energy 26.2
Conventional fuels 73.8
Electricityfrom renewables
2018: 7,000 TWh
Total globalelectricity production
26,700 TWh2018:
PART I I I : GLOBAL USE OF RENEWABLE ENERGY SOURCES 59
fuels covered 79 .7 % of total final energy consumption, and nuclear energy supplied 2 .2 % . It is true that there have been encouraging rates of growth in the use of modern forms of renewable energy, but the 18 .1 % still includes 7 .5 % based on traditional biomass use .
Traditional biomass use refers primarily to the generation of heat from firewood and charcoal, without the use of major technical aids . The potential offered by these forms of renewable energy is largely exhausted, and they are generally not used in a sustainable fashion .
Of the 10 .6 % of final energy provided from modern renew-able energy technologies, 4 .2 % is accounted for by biomass, geothermal and solar heat, 3 .6 % by hydropower, and 2 .0 % by electricity from wind, solar, biomass and geothermal energy . The remained pertained to biofuels in transport . This means that the highest level of growth was seen in the electricity sector (2016: 1 .7 %) .
Figure 59: Distribution of global electricity generation in 2018in percent
Source: REN21: Renewables 2019 Global Status Report [59]
Electricity generation from renewable energy sources
As in Germany, the main growth in renewable energy worldwide is taking place in the electricity sector . Accord-ing to REN 21 [59], 7,000 terawatt-hours of electricity were generated from renewable energy sources in 2018 – almost 4 % more than in 2017 . According to REN21, however, total global electricity generation rose by nearly 5 %, meaning that that share covered by renewable energy dropped slightly from 26 .5 to 26 .2 % . This shows clearly that there is an urgent need to step up the pace of expansion of renew-able energy .
The current growth in electricity generation from renewa-bles around the world is also based mainly on an increase in the shares of wind energy and PV, with their shares climbing from 5 .3 % to 5 .5 % and from 1 .9 % to 2 .4 %, respectively, year-on-year . The share of hydropower, which a few years ago accounted for the bulk of electricity from renewable energy, fell further to 15 .8 % (2017: 16 .4 %) .
A look at the amount of newly installed capacity in the electricity sector highlights the global trend towards renew-able energy . A total of 181 gigawatts of power generation
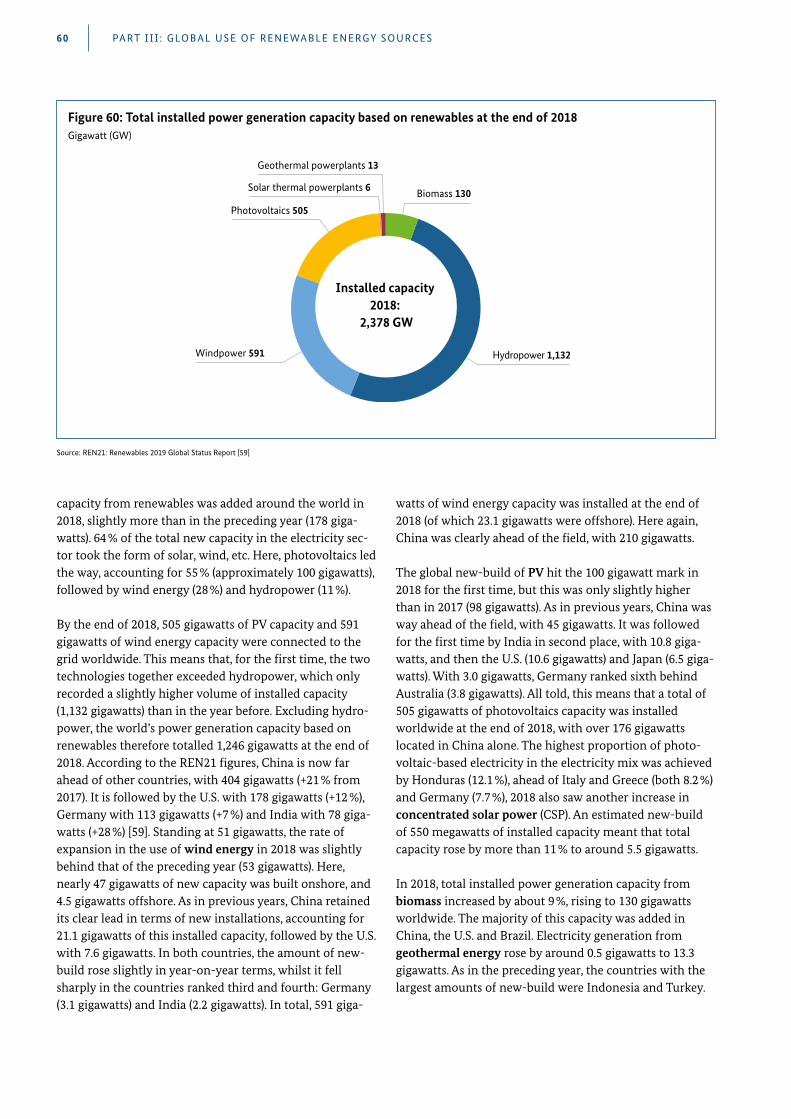
capacity from renewables was added around the world in 2018, slightly more than in the preceding year (178 giga-watts) . 64 % of the total new capacity in the electricity sec-tor took the form of solar, wind, etc . Here, photovoltaics led the way, accounting for 55 % (approximately 100 gigawatts), followed by wind energy (28 %) and hydropower (11 %) .
By the end of 2018, 505 gigawatts of PV capacity and 591 gigawatts of wind energy capacity were connected to the grid worldwide . This means that, for the first time, the two technologies together exceeded hydropower, which only recorded a slightly higher volume of installed capacity (1,132 gigawatts) than in the year before . Excluding hydro-power, the world’s power generation capacity based on renewables therefore totalled 1,246 gigawatts at the end of 2018 . According to the REN21 figures, China is now far ahead of other countries, with 404 gigawatts (+21 % from 2017) . It is followed by the U .S . with 178 gigawatts (+12 %), Germany with 113 gigawatts (+7 %) and India with 78 giga-watts (+28 %) [59] . Standing at 51 gigawatts, the rate of expansion in the use of wind energy in 2018 was slightly behind that of the preceding year (53 gigawatts) . Here, nearly 47 gigawatts of new capacity was built onshore, and 4 .5 gigawatts offshore . As in previous years, China retained its clear lead in terms of new installations, accounting for 21 .1 gigawatts of this installed capacity, followed by the U .S . with 7 .6 gigawatts . In both countries, the amount of new-build rose slightly in year-on-year terms, whilst it fell sharply in the countries ranked third and fourth: Germany (3 .1 gigawatts) and India (2 .2 gigawatts) . In total, 591 giga-
PART I I I : GLOBAL USE OF RENEWABLE ENERGY SOURCES60
Biomass 130
Geothermal powerplants 13
Solar thermal powerplants 6
Hydropower 1,132 Windpower 591
Photovoltaics 505
installierte Leistung
2017: rund 2,195 GW
Installed capacity 2018:
2,378 GW
Figure 60: Total installed power generation capacity based on renewables at the end of 2018Gigawatt (GW)
Source: REN21: Renewables 2019 Global Status Report [59]
watts of wind energy capacity was installed at the end of 2018 (of which 23 .1 gigawatts were offshore) . Here again, China was clearly ahead of the field, with 210 gigawatts .
The global new-build of PV hit the 100 gigawatt mark in 2018 for the first time, but this was only slightly higher than in 2017 (98 gigawatts) . As in previous years, China was way ahead of the field, with 45 gigawatts . It was followed for the first time by India in second place, with 10 .8 giga-watts, and then the U .S . (10 .6 gigawatts) and Japan (6 .5 giga-watts) . With 3 .0 gigawatts, Germany ranked sixth behind Australia (3 .8 gigawatts) . All told, this means that a total of 505 gigawatts of photovoltaics capacity was installed worldwide at the end of 2018, with over 176 gigawatts located in China alone . The highest proportion of photo-voltaic-based electricity in the electricity mix was achieved by Honduras (12 .1 %), ahead of Italy and Greece (both 8 .2 %) and Germany (7 .7 %), 2018 also saw another increase in concentrated solar power (CSP) . An estimated new-build of 550 megawatts of installed capacity meant that total capacity rose by more than 11 % to around 5 .5 gigawatts .
In 2018, total installed power generation capacity from biomass increased by about 9 %, rising to 130 gigawatts worldwide . The majority of this capacity was added in China, the U .S . and Brazil . Electricity generation from geothermal energy rose by around 0 .5 gigawatts to 13 .3 gigawatts . As in the preceding year, the countries with the largest amounts of new-build were Indonesia and Turkey .
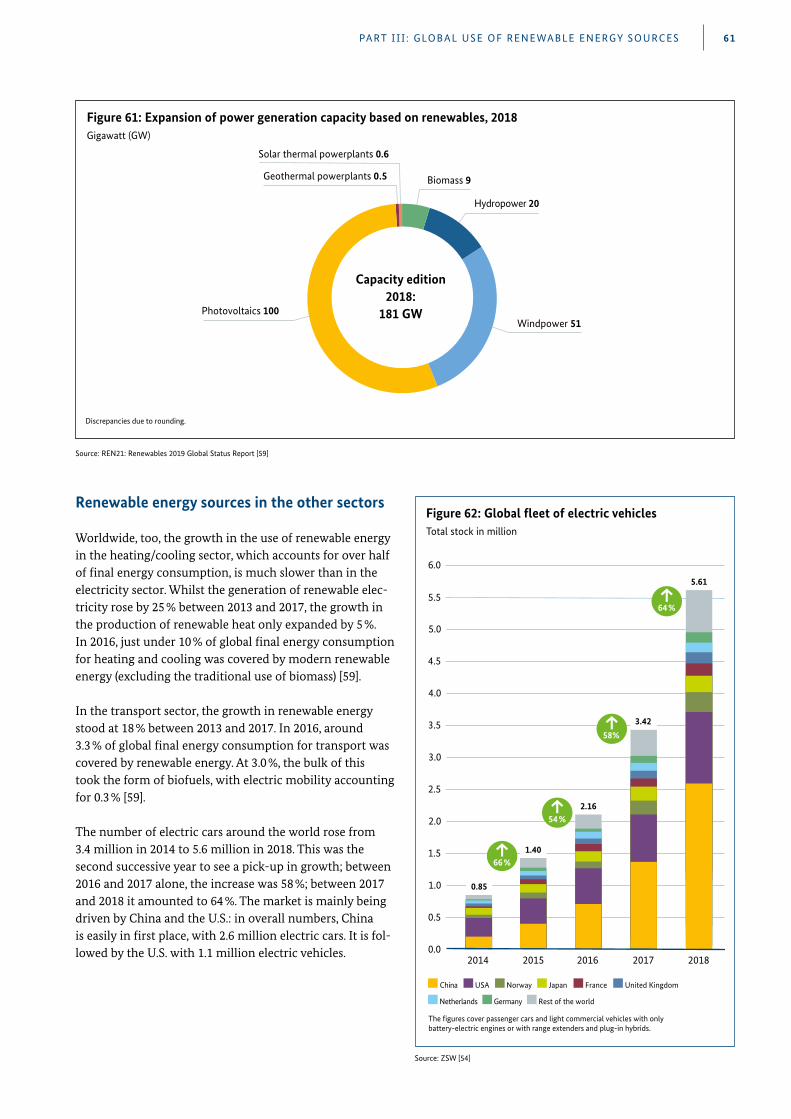
Renewable energy sources in the other sectors
Worldwide, too, the growth in the use of renewable energy in the heating/cooling sector, which accounts for over half of final energy consumption, is much slower than in the electricity sector . Whilst the generation of renewable elec-tricity rose by 25 % between 2013 and 2017, the growth in the production of renewable heat only expanded by 5 % . In 2016, just under 10 % of global final energy consumption for heating and cooling was covered by modern renewable energy (excluding the traditional use of biomass) [59] .
In the transport sector, the growth in renewable energy stood at 18 % between 2013 and 2017 . In 2016, around 3 .3 % of global final energy consumption for transport was covered by renewable energy . At 3 .0 %, the bulk of this took the form of biofuels, with electric mobility accounting for 0 .3 % [59] .
The number of electric cars around the world rose from 3 .4 million in 2014 to 5 .6 million in 2018 . This was the second successive year to see a pick-up in growth; between 2016 and 2017 alone, the increase was 58 %; between 2017 and 2018 it amounted to 64 % . The market is mainly being driven by China and the U .S .: in overall numbers, China is easily in first place, with 2 .6 million electric cars . It is fol-lowed by the U .S . with 1 .1 million electric vehicles .
PART I I I : GLOBAL USE OF RENEWABLE ENERGY SOURCES 61
Hydropower 20
Windpower 51 Photovoltaics 100
Capacity edition2018:
181 GW
Biomass 9
Solar thermal powerplants 0.6
Geothermal powerplants 0.5
Discrepancies due to rounding.
Figure 61: Expansion of power generation capacity based on renewables, 2018Gigawatt (GW)
Source: REN21: Renewables 2019 Global Status Report [59]
Source: ZSW [54]
5.5
China USA Japan Norway United Kingdom France
Netherlands Germany Rest of the world
2015 2016 20182014 2017
6.0
1.0
2.0
3.0
4.0
5.0
0.5
1.5
2.5
3.5
4.5
5.61
0.0
2.16
1.40
0.85
3.42
The �gures cover passenger cars and light commercial vehicles with only battery-electric engines or with range extenders and plug-in hybrids.
h 64%
h 58%
h 66%
h 54%
Figure 62: Global fleet of electric vehiclesTotal stock in million
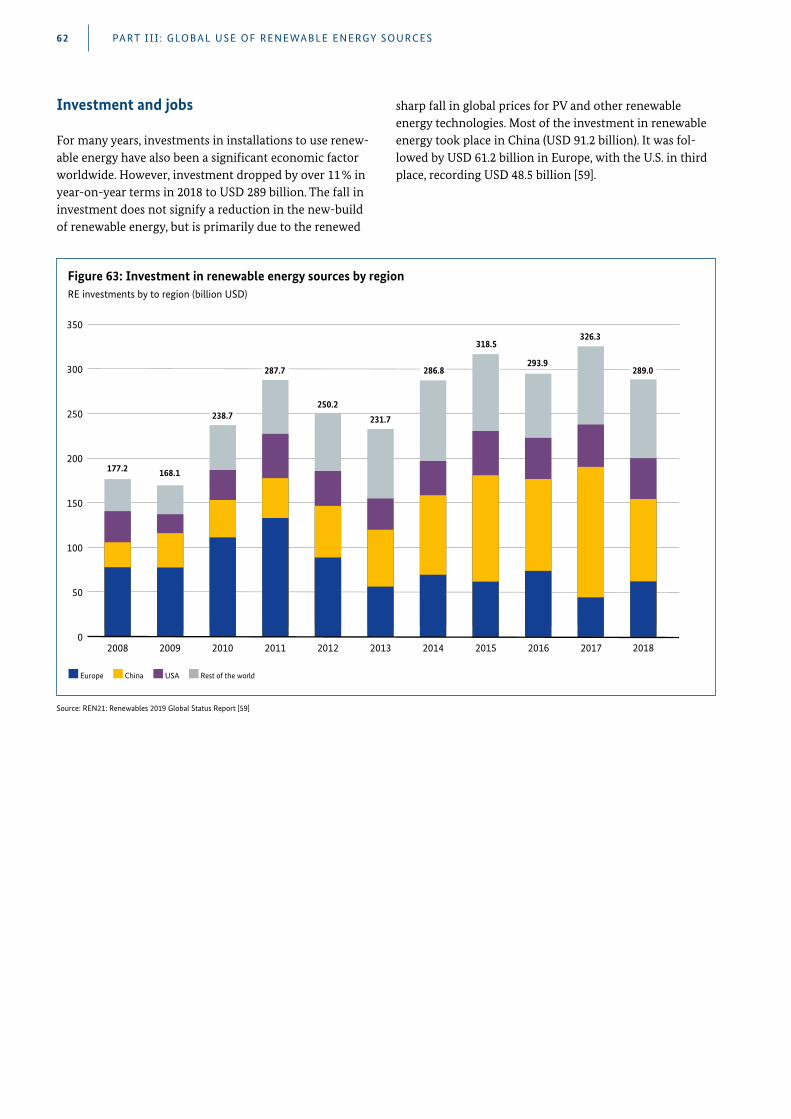
200
150
100
50
350
250
Europe China USA Rest of the world
2017201620152014201320122011201020092008
2018
300
177.2 168.1
250.2
231.7
318.5
293.9
326.3
238.7
287.7 286.8 289.0
0
PART I I I : GLOBAL USE OF RENEWABLE ENERGY SOURCES62
Investment and jobs
For many years, investments in installations to use renew-able energy have also been a significant economic factor worldwide . However, investment dropped by over 11 % in year-on-year terms in 2018 to USD 289 billion . The fall in investment does not signify a reduction in the new-build of renewable energy, but is primarily due to the renewed
Figure 63: Investment in renewable energy sources by regionRE investments by to region (billion USD)
Source: REN21: Renewables 2019 Global Status Report [59]
sharp fall in global prices for PV and other renewable energy technologies . Most of the investment in renewable energy took place in China (USD 91 .2 billion) . It was fol-lowed by USD 61 .2 billion in Europe, with the U .S . in third place, recording USD 48 .5 billion [59] .
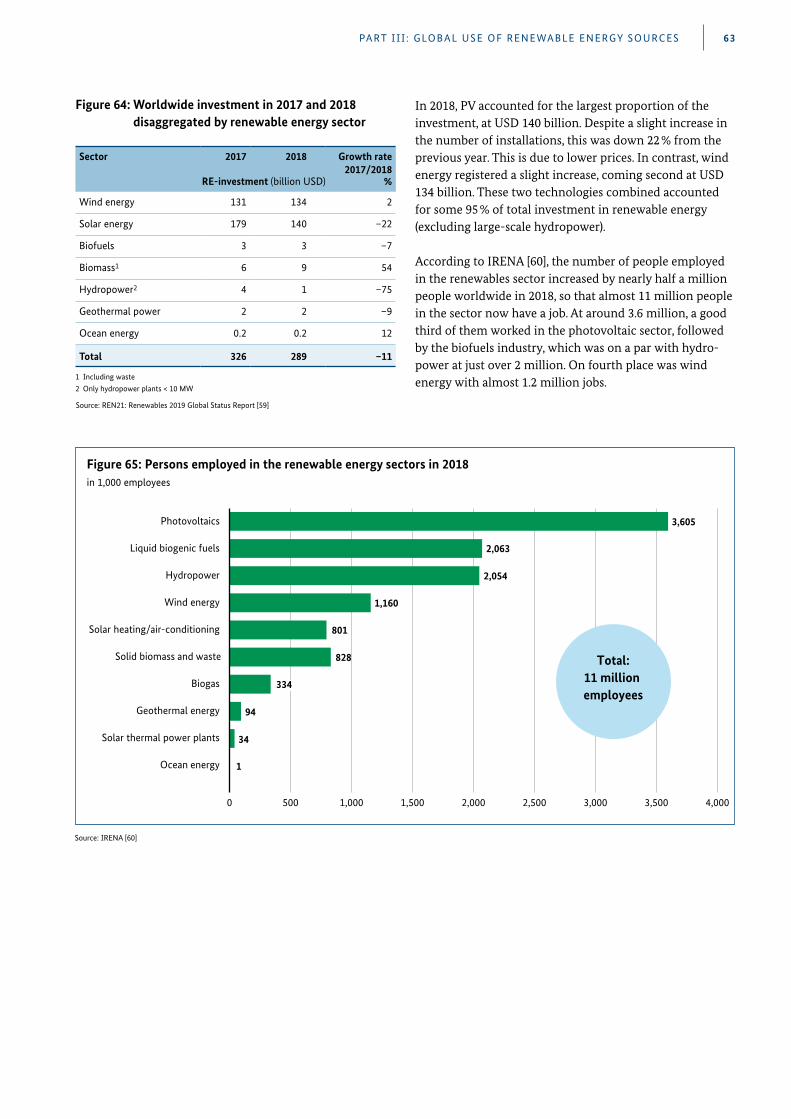
PART I I I : GLOBAL USE OF RENEWABLE ENERGY SOURCES 63
500 1,000 1,500 2,000 2,500 3,000 4,0003,500
Photovoltaics
Liquid biogenic fuels
Hydropower
Wind energy
Solar heating/air-conditioning
Solid biomass and waste
Biogas
Geothermal energy
Solar thermal power plants
Ocean energy
0
1
34
94
334
828
801
1,160
2,054
2,063
3,605
Total:11 million employees
Figure 65: Persons employed in the renewable energy sectors in 2018in 1,000 employees
Source: IRENA [60]
Sector 2017 2018 Growth rate2017/2018
RE-investment (billion USD) %
Wind energy 131 134 2
Solar energy 179 140 –22
Biofuels 3 3 –7
Biomass1 6 9 54
Hydropower2 4 1 –75
Geothermal power 2 2 –9
Ocean energy 0.2 0.2 12
Total 326 289 –11
1 Including waste2 Only hydropower plants < 10 MW
Source: REN21: Renewables 2019 Global Status Report [59]
Figure 64: Worldwide investment in 2017 and 2018 disaggregated by renewable energy sector
In 2018, PV accounted for the largest proportion of the investment, at USD 140 billion . Despite a slight increase in the number of installations, this was down 22 % from the previous year . This is due to lower prices . In contrast, wind energy registered a slight increase, coming second at USD 134 billion . These two technologies combined accounted for some 95 % of total investment in renewable energy (excluding large-scale hydropower) .
According to IRENA [60], the number of people employed in the renewables sector increased by nearly half a million people worldwide in 2018, so that almost 11 million people in the sector now have a job . At around 3 .6 million, a good third of them worked in the photovoltaic sector, followed by the biofuels industry, which was on a par with hydro-power at just over 2 million . On fourth place was wind energy with almost 1 .2 million jobs .
64
Annex
International networks for renewable energy sources
International Renewable Energy Agency (IRENA)
The International Renewable Energy Agency (IRENA) is an intergovernmental organization dedicated to the world-wide promotion of the growth of renewable energy . IRENA now has 160 members, with 23 states currently in the accession process . IRENA is headquartered in Abu Dhabi, United Arab Emirates . The IRENA Innovation and Technol-ogy Centre (IITC), one of its three core divisions, is based in Bonn . Since April 2019, Francesco La Camera of Italy has been the Director-General in charge of the IRENA Secretar-iat . IRENA currently employs around 200 people .
IRENA is the global voice of renewable energy in interna-tional debates . It is also a platform for countries to share knowledge on successful approaches to renewable energy growth, effective policies, capacity expansion, financing mechanisms and energy efficiency measures related to renewable energy . As a knowledge repository, it provides access to information on renewable energy ranging from technological expertise to economic data, opportunities, and development scenarios for renewable energy . It is a centre of excellence for knowledge on renewable energy . It is also tasked with advising industrialized, developing and emerging economies on driving growth in renewable energy .
Cooperation with other players
As an international organisation with global reach, IRENA seeks to support all relevant players in their efforts to bring about the large-scale use of renewable energy technologies around the world . Vital partners include governments, national and international institutions, non-government organisations and the private sector .
Work programme and budget
The current work programme (2018/2019) is divided into six thematic programme areas:
1 . Centre of Excellence for Energy Transformation
2 . Global Voice of Renewables
3 . Network Hub
4 . Source of Advice and Support
5 . International Cooperation and Strategic Engagement
6 . Efficient, Transparent and Innovative Management
An annual budget of around USD 22 million per year is available for these areas . Voluntary contributions are also made .
In recent years, IRENA has particularly gained a reputation for its analysis and development of measures to implement the UN’s Sustainability for All initiative . This initiative aims to double the global share of renewable energy to 36 % by 2030 . IRENA serves as the renewable energy hub in this ini-tiative . It outlines how this goal can be achieved in the “REmap 2030” study developed by the IITC . Building on this, in the context of Germany’s G20 presidency in 2017 IRENA collaborated with the IEA to develop perspectives for 2050, which map out the global transition of the energy sector in line with the Paris climate goals and estimate the investment framework this requires . The modelling analy-sis conducted by IEA and IRENA comes to the conclusion that a global energy transition is technically feasible and can be achieved at reasonable cost [61] . IRENA updates this study every year .
More information on IRENA publications can be found on the organisation’s website (www .irena .org/publications/ 2019/Apr/Global-energy-transformation-A-roadmap-to- 2050-2019Edition) .
Other focal areas of IRENA’s work include issues surround-ing the financing of renewable energy, analyses of resource potential, investment conditions and the socioeconomic, employment and environmental impact of renewable energy technologies . Key projects include studies on the
ANNEX 65
potential for reducing the costs of renewables and the global macroeconomic impacts of expanding renewable energy .
Furthermore, IRENA helps countries and regions accelerate the introduction and expansion of renewable energy, and conducts Renewable Readiness Assessments in individual developing countries to this end . These projects identify priority areas for action in individual countries and guide policymakers in driving renewable energy growth in their respective country .
Main bodies and structure
IRENA is composed of three main governing bodies . The Assembly is IRENA’s ultimate decision-making authority . It consists of all the countries who have ratified the statute .
The Council, which is made up of 21 members, reviews reports and documents, particularly the IRENA work pro-gramme and budget, and submits them to the Assembly for decision . The 17th session of the Council was held in Abu Dhabi on 25 and 26 June 2019 .
The Secretariat implements the IRENA work programme and assists the Assembly, Council and other subordinate bodies in performing their functions . The Secretariat is overseen by IRENA’s Director-General and consists of three divisions . Two are located in Abu Dhabi and one in Bonn .
Further information at: www .irena .org
The International Energy Agency – IEA
The International Energy Agency (IEA) is one of the world’s central energy organisations . An autonomous institution within the OECD, it acts as a voice for the energy-consuming industrialised countries, and currently consists of 30 OECD member countries . Given the strong growth in energy demand outside the OECD, the IEA is also expanding and deepening its cooperation with countries that are not members of the OECD and therefore cannot become mem-bers of the IEA . Its efforts here focus particularly on estab-lishing Association with major emerging countries . This began in November 2015, with China, Indonesia and Thai-land being granted Association status . Since then, Brazil,
India, Morocco and Singapore have also activated Associa-tion status with the IEA .
The IEA was founded in 1974 in response to the first oil crisis, with a view to ensuring that the supply of oil would not be subject to disruptions . In order to achieve this goal, its member countries agree to hold at least 90 days’ worth of emergency oil stocks .
In addition, the IEA has developed into a central platform for sharing experience and advising policymakers on virtu-ally all aspects of energy policy . A key part of this is discuss-ing how renewable energy can be developed and integrated into the various energy systems . The IEA toolkit includes regular detailed country reviews setting out policy recom-mendations, as well as the annual World Energy Outlook (WEO), a comprehensive international reference publica-tion on energy policy with forecasts currently reaching up to 2040 . These are the most influential publications released by the IEA and serve as key reference material in the designing of national energy policies right around the world .
The German Federal Ministry for Economic Affairs and Energy is also represented in the IEA Renewable Energy Working Party (REWP) .
Since 2011, the Renewable Industry Advisory Board (RIAB), a committee consisting of companies in the renewable energy industry, has held regular workshops to discuss market and industry trends and has provided information to support the REWP and the IEA Secretariat in their activ-ities . The RIAB includes German companies as well .
More information on IEA publications can be found on the organisation’s website www .iea .org .
Energy cooperation in the G20
Since 2008, the ‘Group of 20’ (G20) has hosted annual meet-ings of Heads of State and Government of 19 countries and of the European Union . It is the central forum for interna-tional cooperation on financial and economic issues . Within the talks that take place, energy policy issues have become increasingly important . Since 2013, they have been discussed within a dedicated working group, which was expanded under the 2017 German G20 presidency to
ANNEX66
become a working group for energy and climate change which is jointly coordinated by the Federal Ministry for Economic Affairs and Energy and the Federal Ministry for the Environment, Nature Conservation and Nuclear Safety . The working group has focused more sharply on the cen-tral role of the energy sector in the implementation of the Paris Climate Agreement and on the 2030 Agenda on Sustainable Development and has adopted a Climate and Energy Action Plan for Global Growth . The action plan can be viewed here: www .g20germany .de/Content/DE/_Anlagen/G7_G20/2017-g20-climate-and-energy-de . html?nn=2190012 .
In 2018 and 2019, the dialogue on energy policy was con-tinued in specific working groups under the Argentinian and Japanese G20 presidencies .
The renewables2004 conference in Bonn – and the follow-up process
The first International Renewable Energy Conference – renewables2004, which was initiated by the Federal Gov-ernment and held in Bonn, put renewable energy on the global agenda . This conference provided crucial momen-tum: the more than 100 participating countries agreed that renewable energy would play a central role in an energy system of the future and committed to national or regional targets and actions . To maintain this momentum, the Renewable Energy Policy Network for the 21st Century (REN21) was then founded . REN21 publishes the Global Status Report each year, a publication which informs policy debate on renewable energy [59] . After 2004, follow-up conferences took place in China, the United States, India, the United Arab Emirates and Mexico (see below); the next follow-up conference is scheduled for October 2019 in Korea .
International Renewable Energy Conferences (IRECs)
The great success of “renewables2004” has been continued in other countries through the launching of the Interna-tional Renewable Energy Conferences (IRECs) . The individ-ual conferences have generated strong political impetus for accelerating the expansion of renewable energy worldwide . In addition, the IRECs have often had a strong impact in the respective host country .
The conference in Beijing (BIREC 2005) not only evaluated the follow-up process to the Bonn conference, but also discussed the use of renewable energy sources in developing countries . The subsequent Washington International Renewable Energy Conference (WIREC 2008) laid one par-ticular focus on the progress made in expanding renewable energy capacity in industrial countries . Like renewables2004,
WIREC gave rise to a large number of voluntary commit-ments, thereby perpetuating the spirit of the Bonn confer-ence . The next conference in the series was the Delhi Inter-national Renewable Energy Conference (DIREC 2010) in October 2010 . DIREC led to the signing of a joint political declaration reaffirming the intention of all the conference participants to promote the faster expansion of renewable energy worldwide, and to support the initiative for the UN’s International Year of Sustainable Energy For All . In January 2013, the Abu Dhabi International Renewable Energy Conference (ADIREC) took place as part of the Sus-tainable Energy Week, which also opened the third session of the IRENA Assembly and hosted the annual World Future Energy Summit . The 6th International Renewable Energy Conference was held in Cape Town, South Africa, in early October 2015 (SAIREC) . The countries attending discussed the development of renewable energy in Africa, particularly sub-Saharan Africa, the contribution renewable energy makes to economic growth and prosperity, and the contribution it makes to climate protection .
Mexico became the first Latin American country to host the event, with the 7th International Renewable Energy Conference (MEXIREC) held in Mexico City in September 2017 as part of “Energy Week” . MEXIREC was attended by numerous ministers and high-level participants from the field of energy policy and the business community, with talks centring particularly on the framework conditions and factors that are key to the successful expansion of renewable energy in Central and South America . The 8th International Conference on Renewable Energies (KIREC) is to take place in Seoul, Korea, in autumn 2019 . One focus will be on the use of renewable energy in cities .
Renewable Energy Policy Network for the 21st Century – REN21
The Renewable Energy Policy Network for the 21st Century (REN21) is a global policy network that was largely co-founded on the initiative of Germany after the renew-ables2004 conference . The network, which has been exten-sively funded by Germany, has developed into the most important global multi-stakeholder network dedicated to promoting policy measures aimed at accelerating the expansion of renewable energy . It plays a key role in the provision of strategic and organisational support to the countries hosting International Renewable Energy Confer-ences (IRECs) . REN21 comprises representatives from government, international organisations, civil society, the scientific community and private-sector stakeholders from the fields of energy, the environment and development . The Secretariat of REN21 is located in Paris .
Every year, REN21 publishes the Renewables Global Status Report (GSR), which tracks the yearly growth of renewables
ANNEX 67
around the world and has emerged as the standard refer-ence for renewable energy expansion and investment . The report presents the worldwide situation and geographical distribution of installed renewable capacity, growth targets, policy instruments and global investment in renewable energy [59] .
In addition to the Global Status Report, REN21 also pub-lishes Regional Status Reports that examine in greater depth the development of renewables in individual global regions . In 2015, a report was published on the Southern African Development Community (SADC) region for exam-ple, and in 2016, a further regional status report on the Eastern African Community was released . A report on 17 countries in Central Asia, the Balkans and in the Caucasus was published in 2017 .
In 2013, REN21 published the Global Futures Report for the first time . The second edition of the report followed in 2017 . This publication contains an overview of possible directions and expectations for the future growth of renewable energy . Based on scenarios and interviews with experts . the report describes the expectations of various players for the future of renewables, key issues and impor-tant policy options . The report was published for the first time for the Abu Dhabi International Renewable Energy Conference in 2013 (ADIREC 2013) and was highly regarded around the world .
Further information at: www .ren21 .net
Berlin Energy Transition Dialogue (BETD)
Since 2015, the Federal Government has held an interna-tional energy conference, the Berlin Energy Transition Dialogue, every spring . This two-day conference is aimed at intensifying international exchange of experiences, chal-lenges and opportunities associated with the global energy transition . The event is jointly hosted by the Federal Ministry for Economic Affairs and Energy and the Federal Foreign Office .
In 2019, the event was attended by more than 2,000 domes-tic and foreign decision-makers from the political sphere, from business, science and academia, civil society, and world-leading energy experts from almost 90 countries . This also included 50 foreign and energy ministers, as well as more than 100 high-ranking delegations from all over the world . Against the backdrop of the Paris climate agree-ments, the aim of the conference was to continue inter-national dialogue on a secure, environmentally compatible and affordable global energy transition . Parallel to the event, attendees were also offered an extensive side pro-gramme, including excursions to experience the German energy transition at first hand .
The 6th Berlin Energy Transition Dialogue is scheduled for spring 2020 . Further information at: https://2020 . energydialogue .berlin
Clean Energy Ministerial (CEM)
Launched in 2010, the Clean Energy Ministerial (CEM) is a global forum that was set up to promote sustainable energy generation right around the world . It is attended by some 26 industrial countries and emerging economies, as well as by representatives for the European Union [62] .
Cooperation at the CEM takes place across a variety of working groups in which Member States usually focus on specific individual technologies . There are also short-term ‘campaigns’ which often include players from the private sector and civil society . This cooperation goes back to ten technology action plans on a range of low-carbon technol-ogies that were jointly developed in 2009 by a group of industrial countries, in preparation for the COP 15 climate conference in Copenhagen .
The Federal Government, represented by the Federal Min-istry for Economic Affairs and Energy, co-leads the multi-lateral campaign for long-term scenarios for the energy transition together with Denmark . Further to this, Ger-many is involved in a CEM initiative to abolish fossil-fuel subsidies . The various ministers involved meet on an annual basis to decide on what the key areas of focus should be when it comes to the work carried out as part of the initiatives . The latest meeting was held in Vancouver on 29 May 2019 and was hosted by Canada .
Further information at: www .cleanenergyministerial .org
SE4ALL – The Sustainable Energy for All initiative
Launched by former UN Secretary General Ban Ki-moon in 2011, the Sustainable Energy for All initiative aims to ensure that all people around the world can access sustain-able energy by 2030 . Besides ensuring universal access to modern energy services, the initiative seeks to raise the annual improvement in energy efficiency rates from 1 .2 % to 2 .4 % and to double the share of renewables in the global energy mix . These targets are to be attained by 2030 .
Today, some 1 billion people worldwide still have no access to electricity . This figure is forecast to remain essentially unchanged through to 2030 if no additional efforts are undertaken . Twice this number of people are reliant on the use of traditional biomass .
ANNEX68
A high-ranking group of 46 advisors from business, govern-ment and civil society has drawn up an agenda for action in order to implement the three individual targets . As the relevant steps are then taken, it will be necessary to combine the efforts made by both the public and private sectors and civil society in order to increase the overall impact . At the United Nations Conference on Sustainable Development in Rio (Rio+20), 50 countries from Africa, Asia, Latin America and the group of the Small Island Developing States, plus a large number of companies, local governments and various groups from civil society, presented their own commitments towards implementing the Action Agenda . The initiative thus succeeded in harnessing the political momentum from the Rio+20 negotiations to mobilise support .
In September 2019, António Guterres, Secretary-General of the United Nations, is hosting the next climate summit in New York . The summit aims to discuss how to tackle the challenge of climate change and what measures can be adopted to accelerate the implementation of the Paris Agreement on climate change .
Further information at: https://www .seforall .org
Information on methodology
Some of the figures published in this report are provisional . When the final data are published, they may differ from earlier publications . Discrepancies between the figures in the tables and the respective column or row totals are due to rounding .
The terminology commonly used in energy statistics includes the term (primary) energy consumption . This is not strictly correct from a physical point of view, however, because energy cannot be created or consumed, but merely converted from one form to another (e .g . heat, electricity, mechanical energy) . This process is not entirely reversible, however, meaning that a proportion of the energy’s exergy is lost .
For more information on the terminology used in energy statistics, please refer to the website of the Federal Ministry for Economic Affairs and Energy www .bmwi .de/Navigation/DE/Service/Glossar-Energiewende/glossar .html (in German only) .
The amounts of energy (gross electricity consumption, final energy consumption from renewables for heating, cooling and transport) presented in this brochure cannot be added to produce an aggregate value because they are determined on the basis of specific conventions which differ in each case . Consequently it is not possible to calculate shares of total final energy consumption on this basis .
Methodological changes
Changes in the methodology applied for electricity and heat
AGEE-Stat is constantly working to improve the methodol-ogy of the renewable energy statistics, and has held a series of expert discussions over the past 12 months . This sharing of knowledge with experts in a variety of fields has given AGEE-Stat new insights into ways to improve the data for the production of electricity and heat from renewable energy sources . The resulting methodological changes aim to ensure that renewable energy statistics can be updated over the long term, while also providing a uniform and consistent data base to meet national and international reporting obligations .
An overview of the methodological changes is provided below:
Final energy consumption of solid biomass used for the generation of heat in the commerce, trade, and services sector
A major element of the overall time series in the heating sec-tor for commerce, trade, and services is the data on the use of solid biomass in installations which solely generate heat in the commerce, trade, and services sector . This time series was altered from 2003 on the basis of the updated figures from the research project carried out by the Thünen Insti-tute “GHD-Festbiomasse im Wärmesektor” (solid biomass in the commerce, trade, and services sector), which included current empirical surveys from “Monitoring raw materials – Wood” [17] .
Methodology to derive the generation of heat in bio-gas-fired block-type thermal power stations
The quality of the data used in the energy statistics to derive the amount of biogas-based heat had deteriorated in recent years due to the switch by biogas installations to direct mar-keting under the Renewable Energy Sources Act . An AGEE-Stat discussion on biogas heat in April 2018 focused on cur-rent scientific findings, new data sources and models to determine the amount of heat generated from biogas . It was found that anonymised data from environmental experts on the Renewable Energy Sources Act provide a new empirical basis to derive CHP statistics (in addition to the share of externally used CHP heat, also electricity and capacity utili-sation) for biogas-fired block-type thermal power stations . The input data for the model to determine the use of biogas as a fuel to generate CHP electricity and heat were updated accordingly . This also involved a reassessment of internal needs for heat to heat fermenters .
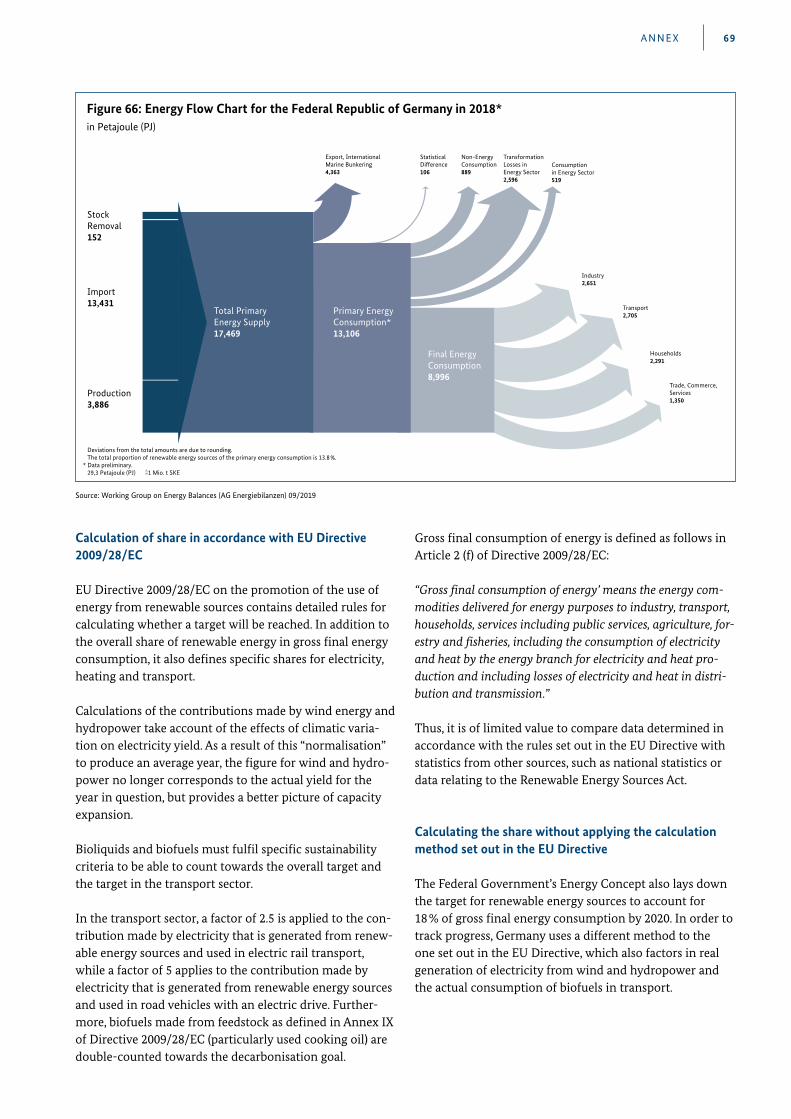
69
Calculation of share in accordance with EU Directive 2009/28/EC
EU Directive 2009/28/EC on the promotion of the use of energy from renewable sources contains detailed rules for calculating whether a target will be reached . In addition to the overall share of renewable energy in gross final energy consumption, it also defines specific shares for electricity, heating and transport .
Calculations of the contributions made by wind energy and hydropower take account of the effects of climatic varia-tion on electricity yield . As a result of this “normalisation” to produce an average year, the figure for wind and hydro-power no longer corresponds to the actual yield for the year in question, but provides a better picture of capacity expansion .
Bioliquids and biofuels must fulfil specific sustainability criteria to be able to count towards the overall target and the target in the transport sector .
In the transport sector, a factor of 2 .5 is applied to the con-tribution made by electricity that is generated from renew-able energy sources and used in electric rail transport, while a factor of 5 applies to the contribution made by electricity that is generated from renewable energy sources and used in road vehicles with an electric drive . Further-more, biofuels made from feedstock as defined in Annex IX of Directive 2009/28/EC (particularly used cooking oil) are double-counted towards the decarbonisation goal .
Gross final consumption of energy is defined as follows in Article 2 (f) of Directive 2009/28/EC:
“Gross final consumption of energy’ means the energy com-modities delivered for energy purposes to industry, transport, households, services including public services, agriculture, for-estry and fisheries, including the consumption of electricity and heat by the energy branch for electricity and heat pro-duction and including losses of electricity and heat in distri-bution and transmission .”
Thus, it is of limited value to compare data determined in accordance with the rules set out in the EU Directive with statistics from other sources, such as national statistics or data relating to the Renewable Energy Sources Act .
Calculating the share without applying the calculation method set out in the EU Directive
The Federal Government’s Energy Concept also lays down the target for renewable energy sources to account for 18 % of gross final energy consumption by 2020 . In order to track progress, Germany uses a different method to the one set out in the EU Directive, which also factors in real generation of electricity from wind and hydropower and the actual consumption of biofuels in transport .
Figure 66: Energy Flow Chart for the Federal Republic of Germany in 2018*in Petajoule (PJ)
Primary EnergyConsumption*13,106
Final EnergyConsumption8,996
Total PrimaryEnergy Supply17,469
Export, InternationalMarine Bunkering4,363
StockRemoval152
StatisticalDifference106
Non-EnergyConsumption889
TransformationLosses in Energy Sector2,596
Consumption in Energy Sector519
Import13,431
Production3,886
Industry2,651
Transport2,705
Households 2,291
Trade, Commerce,Services1,350
Deviations from the total amounts are due to rounding. The total proportion of renewable energy sources of the primary energy consumption is 13.8%.* Data preliminary. 29,3 Petajoule (PJ) =̂ 1 Mio. t SKE
Source: Working Group on Energy Balances (AG Energiebilanzen) 09/2019
ANNEX
ANNEX70
Economic stimulus from the use of renewable energy
The rapid expansion of renewables seen in Germany in recent years has resulted in a massive increase in the importance of the renewable energy sector for the econ-omy as a whole . In additon to investment in plant con-struction, with growing numbers of the operation of these plants has become an increasingly important factor in the economy .
Investment in renewable energy facilities is calculated based on newly installed capacity or the number of addi-tional installations . This number is then combined with the specific investment costs (EUR/kW) or average cost per installation (EUR/installation) to determine the total investment per segment in the year under review . In the case of installations whose construction takes place over a period of several years, investments are assigned to the appropriate period . This particularly concerns offshore wind installations, installations that use deep geothermal energy, large hydropower plants, and large biomass CHP plants and biogas plants . This approach prevents the incor-rect assignment of investment, i . e . investment is not solely assigned to the year the plant was completed or went into operation .
The economic stimuli arising from plant operation include not only the costs of operation and maintenance, especially personnel costs and auxiliary energy costs, but also the pro-vision of renewable fuels and biofuels .
The costs of operating and maintaining installations is determined on the basis of values specific to each type of technology . They were determined using cost calculations from various scientific studies . These particularly include the research projects relating to the Renewable Energy Sources Act (including the research reports on the Renewa-ble Energy Sources Act Progress Report, for example [6] and the final report on the monitoring of power generation from biomass [10]), the evaluations of the Market Incentive Programme [40], and the evaluations of KfW funding for renewable energy sources [63] .
The calculation of the costs arising from supplying fuel for heat and power generation also includes the costs of solid and liquid fuels and of the substrates used to produce bio-gas . The relevant solid biomass fuels include waste wood, residual wood from forestry and industry, wood pellets, wood chips, wood briquettes, and commercially traded fire-wood . The main components of substrates for biogas pro-duction are maize silage, grass silage, whole-crop silage and inferior grain . In total, the economic stimulus from the supply of biogenic fuels for heat and power is estimated at €4 .6 billion .
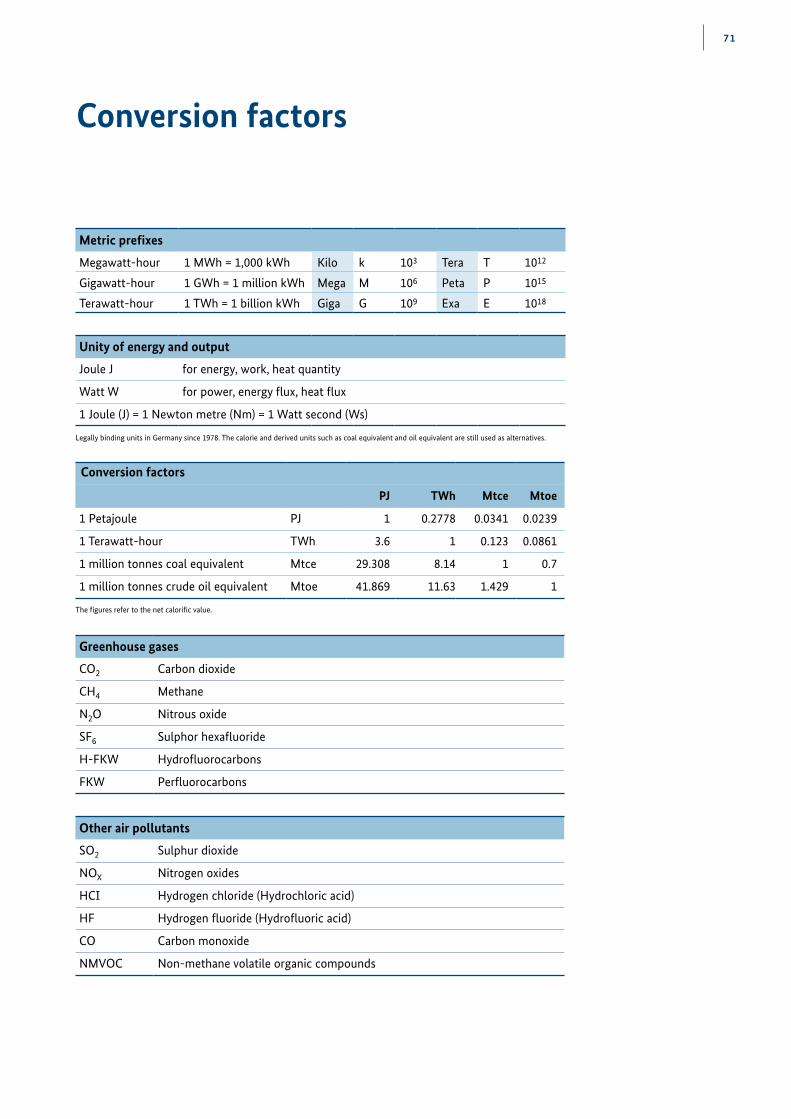
71
Conversion factors
Metric prefixes
Megawatt-hour 1 MWh = 1,000 kWh Kilo k 103 Tera T 1012
Gigawatt-hour 1 GWh = 1 million kWh Mega M 106 Peta P 1015
Terawatt-hour 1 TWh = 1 billion kWh Giga G 109 Exa E 1018
Unity of energy and output
Joule J for energy, work, heat quantity
Watt W for power, energy flux, heat flux
1 Joule (J) = 1 Newton metre (Nm) = 1 Watt second (Ws)
Conversion factors
PJ TWh Mtce Mtoe
1 Petajoule PJ 1 0.2778 0.0341 0.0239
1 Terawatt-hour TWh 3.6 1 0.123 0.0861
1 million tonnes coal equivalent Mtce 29.308 8.14 1 0.7
1 million tonnes crude oil equivalent Mtoe 41.869 11.63 1.429 1
The figures refer to the net calorific value.
Greenhouse gases
CO2 Carbon dioxide
CH4 Methane
N2O Nitrous oxide
SF6 Sulphor hexafluoride
H-FKW Hydrofluorocarbons
FKW Perfluorocarbons
Other air pollutants
SO2 Sulphur dioxide
NOX Nitrogen oxides
HCI Hydrogen chloride (Hydrochloric acid)
HF Hydrogen fluoride (Hydrofluoric acid)
CO Carbon monoxide
NMVOC Non-methane volatile organic compounds
Legally binding units in Germany since 1978. The calorie and derived units such as coal equivalent and oil equivalent are still used as alternatives.
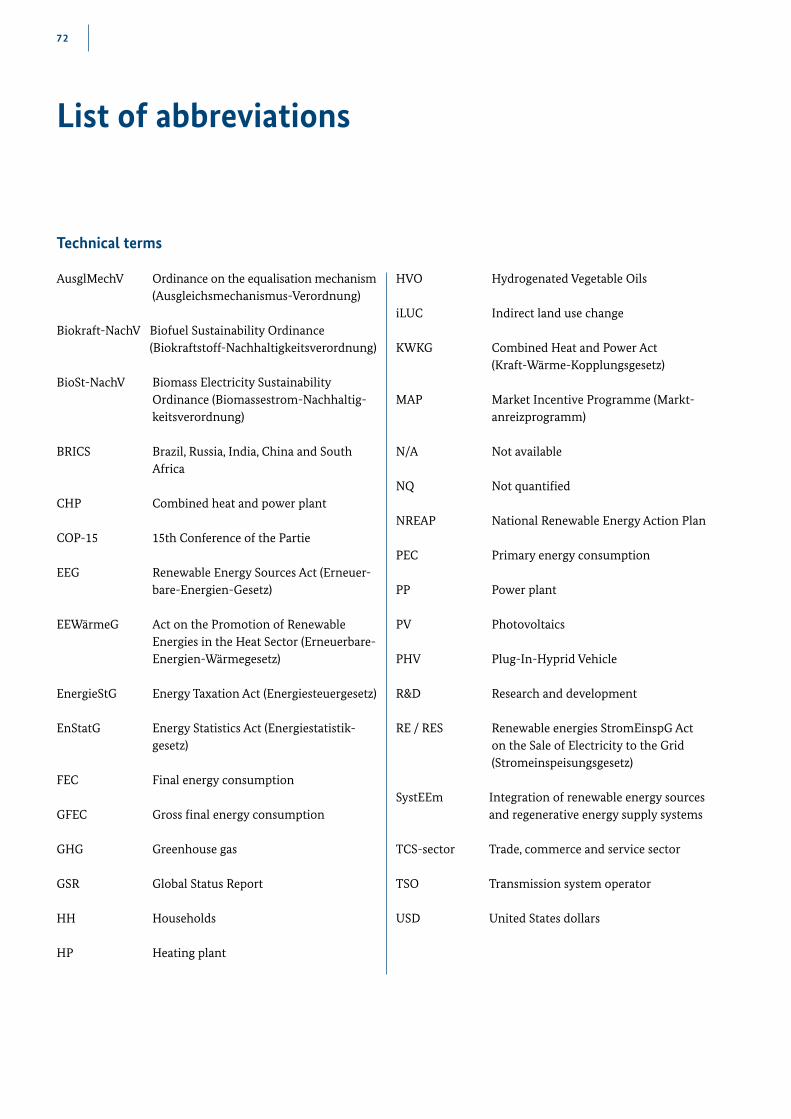
72
Technical terms
AusglMechV Ordinance on the equalisation mechanism (Ausgleichsmechanismus-Verordnung)
Biokraft-NachV Biofuel Sustainability Ordinance (Biokraftstoff-Nachhaltigkeitsverordnung)
BioSt-NachV Biomass Electricity Sustainability Ordinance (Biomassestrom-Nachhaltig-keitsverordnung)
BRICS Brazil, Russia, India, China and South Africa
CHP Combined heat and power plant
COP-15 15th Conference of the Partie
EEG Renewable Energy Sources Act (Erneuer-bare-Energien-Gesetz)
EEWärmeG Act on the Promotion of Renewable Energies in the Heat Sector (Erneuerbare- Energien-Wärmegesetz)
EnergieStG Energy Taxation Act (Energiesteuergesetz)
EnStatG Energy Statistics Act (Energiestatistik-gesetz)
FEC Final energy consumption
GFEC Gross final energy consumption
GHG Greenhouse gas
GSR Global Status Report
HH Households
HP Heating plant
HVO Hydrogenated Vegetable Oils
iLUC Indirect land use change
KWKG Combined Heat and Power Act (Kraft-Wärme-Kopplungsgesetz)
MAP Market Incentive Programme (Markt-anreizprogramm)
N/A Not available
NQ Not quantified
NREAP National Renewable Energy Action Plan
PEC Primary energy consumption
PP Power plant
PV Photovoltaics
PHV Plug-In-Hyprid Vehicle
R&D Research and development
RE / RES Renewable energies StromEinspG Act on the Sale of Electricity to the Grid (Stromeinspeisungsgesetz)
SystEEm Integration of renewable energy sources and regenerative energy supply systems
TCS-sector Trade, commerce and service sector
TSO Transmission system operator
USD United States dollars
List of abbreviations
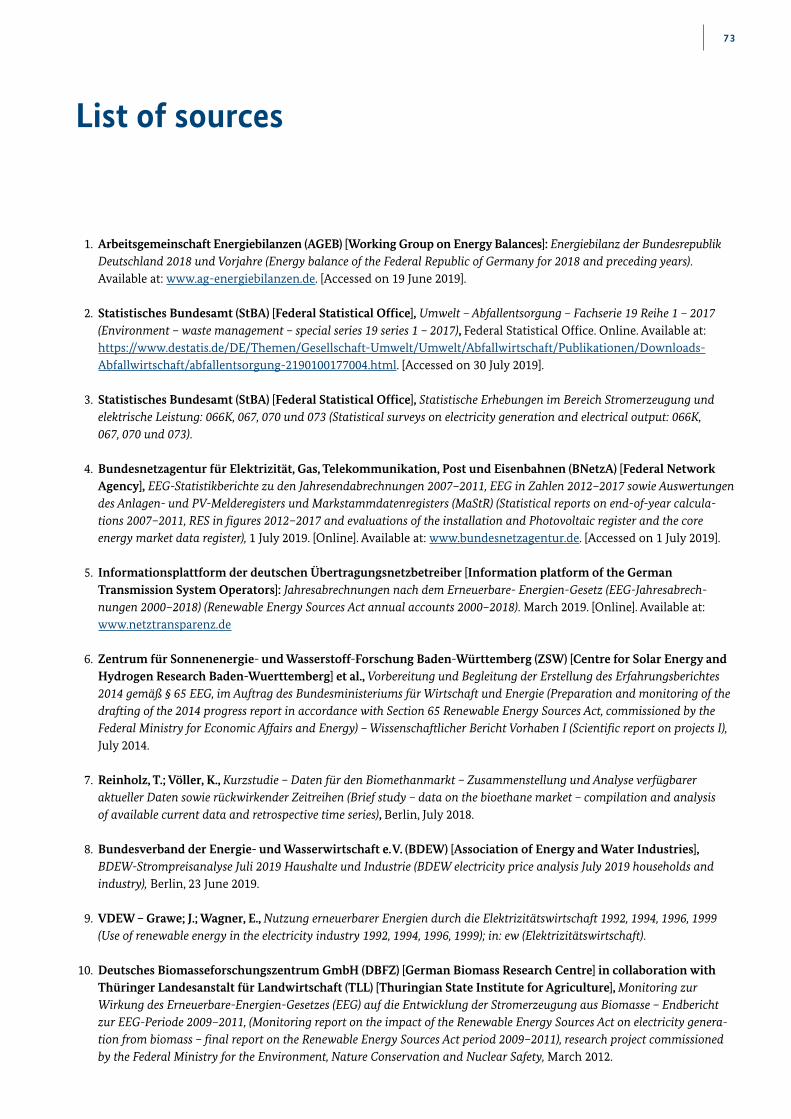
73
List of sources
1 . Arbeitsgemeinschaft Energiebilanzen (AGEB) [Working Group on Energy Balances]: Energiebilanz der Bundesrepublik Deutschland 2018 und Vorjahre (Energy balance of the Federal Republic of Germany for 2018 and preceding years) . Available at: www .ag-energiebilanzen .de . [Accessed on 19 June 2019] .
2 . Statistisches Bundesamt (StBA) [Federal Statistical Office], Umwelt – Abfallentsorgung – Fachserie 19 Reihe 1 – 2017 (Environment – waste management – special series 19 series 1 – 2017), Federal Statistical Office . Online . Available at: https://www .destatis .de/DE/Themen/Gesellschaft-Umwelt/Umwelt/Abfallwirtschaft/Publikationen/Downloads- Abfallwirtschaft/abfallentsorgung-2190100177004 .html . [Accessed on 30 July 2019] .
3 . Statistisches Bundesamt (StBA) [Federal Statistical Office], Statistische Erhebungen im Bereich Stromerzeugung und elektrische Leistung: 066K, 067, 070 und 073 (Statistical surveys on electricity generation and electrical output: 066K, 067, 070 und 073) .
4 . Bundesnetzagentur für Elektrizität, Gas, Telekommunikation, Post und Eisenbahnen (BNetzA) [Federal Network Agency], EEG-Statistikberichte zu den Jahresendabrechnungen 2007–2011, EEG in Zahlen 2012–2017 sowie Auswertungen des Anlagen- und PV-Melderegisters und Markstammdatenregisters (MaStR) (Statistical reports on end-of-year calcula-tions 2007–2011, RES in figures 2012–2017 and evaluations of the installation and Photovoltaic register and the core energy market data register), 1 July 2019 . [Online] . Available at: www .bundesnetzagentur .de . [Accessed on 1 July 2019] .
5 . Informationsplattform der deutschen Übertragungsnetzbetreiber [Information platform of the German Trans mission System Operators]: Jahresabrechnungen nach dem Erneuerbare- Energien-Gesetz (EEG-Jahresabrech-nungen 2000–2018) (Renewable Energy Sources Act annual accounts 2000–2018) . March 2019 . [Online] . Available at: www .netztransparenz .de
6 . Zentrum für Sonnenenergie- und Wasserstoff-Forschung Baden-Württemberg (ZSW) [Centre for Solar Energy and Hydrogen Research Baden-Wuerttemberg] et al., Vorbereitung und Begleitung der Erstellung des Erfahrungsberichtes 2014 gemäß § 65 EEG, im Auftrag des Bundesministeriums für Wirtschaft und Energie (Preparation and monitoring of the drafting of the 2014 progress report in accordance with Section 65 Renewable Energy Sources Act, commissioned by the Federal Ministry for Economic Affairs and Energy) – Wissenschaftlicher Bericht Vorhaben I (Scientific report on projects I), July 2014 .
7 . Reinholz, T.; Völler, K., Kurzstudie – Daten für den Biomethanmarkt – Zusammenstellung und Analyse verfügbarer aktueller Daten sowie rückwirkender Zeitreihen (Brief study – data on the bioethane market – compilation and analysis of available current data and retrospective time series), Berlin, July 2018 .
8 . Bundesverband der Energie- und Wasserwirtschaft e. V. (BDEW) [Association of Energy and Water Industries], BDEW-Strompreisanalyse Juli 2019 Haushalte und Industrie (BDEW electricity price analysis July 2019 households and industry), Berlin, 23 June 2019 .
9 . VDEW – Grawe; J.; Wagner, E., Nutzung erneuerbarer Energien durch die Elektrizitätswirtschaft 1992, 1994, 1996, 1999 (Use of renewable energy in the electricity industry 1992, 1994, 1996, 1999); in: ew (Elektrizitätswirtschaft) .
10 . Deutsches Biomasseforschungszentrum GmbH (DBFZ) [German Biomass Research Centre] in collaboration with Thüringer Landesanstalt für Landwirtschaft (TLL) [Thuringian State Institute for Agriculture], Monitoring zur Wirkung des Erneuerbare-Energien-Gesetzes (EEG) auf die Entwicklung der Stromerzeugung aus Biomasse – Endbericht zur EEG-Periode 2009–2011, (Monitoring report on the impact of the Renewable Energy Sources Act on electricity genera-tion from biomass – final report on the Renewable Energy Sources Act period 2009–2011), research project commissioned by the Federal Ministry for the Environment, Nature Conservation and Nuclear Safety, March 2012 .
LIST OF SOURCES 74
11 . IE – Institut für Energetik und Umwelt gGmbH (IE), Leipzig, Fichtner GmbH & Co. KG. Stuttgart, Thüringer Lande-sanstalt für Landwirtschaft, Monitoring zur Wirkung des novellierten Erneuerbare-Energien-Gesetz (EEG) auf die Entwicklung der Stromerzeugung aus Biomasse (Monitoring report on the impact of the revised Renewable Energy Sources Act on electricity generation from biomass), Jena .
12 . Weimar, H., From empirical studies to bioenergy statistics: bridging the GAP of unrecorded wood-bioenergy in Germany .
13 . Thünen-Institut für internationale Waldwirtschaft und Forstökonomie [Thünen Institute for International For-estry and Forest Economics], Holzeinschlag und Rohholzverwendung (Timber felling and use of raw wood) . [Online] . Available at: https://www .thuenen .de/de/wf/zahlen-fakten/produktion-und-verwendung/holzeinschlag-und- rohholzverwendung/.
14 . Arbeitsgemeinschaft Energiebilanzen (AGEB) [Working Group on Energy Balances], Heizwerte der Energieträger und Faktoren für die Umrechnung von spezifischen Mengeneinheiten in Wärmeeinheiten (2005–2015) (Calorific values of energy sources and factors for the conversion of specific units of measure to heat units (2005–2015)), 19 June 2019 . [Online] . Available at: www .ag-energiebilanzen .de . [Accessed on 19 June 2019] .
15 . Born, H. et al., Analyse des deutschen Wärmepumpenmarktes – Bestandsaufnahme und Trends, 2 . Aktualisierung Interna-tionales Geothermiezentrum (GZB) im Auftrag des ZSW (Analysis of the German heat pump market – stocktaking and trends, 2nd update International Geothermal Energy Centre on behalf of ZSW), 1 November 2017 .
16 . International Energy Agency (IEA), European Solar Thermal Industry Federation (ESTIF), Solar Heating and Cooling Programme: Common calculation method of the solar thermal energy produced worldwide available, Bochum, 15 Novem ber 2011 .
17 . Fachagentur nachwachsende Rohstoffe (FNR) [Agency for Renewable Resources], Rohstoffmonitoring Holz: Mengen-mäßige Erfassung und Bilanzierung der Holzverwendung in Deutschland – Forst – Nachwachsende Rohstoffe – Broschüren (Monitoring raw materials – Wood: quantitative survey and accounts of use of wood in Germany – forestry – regenerative raw materials – brochures), June 2018 .
18 . Döring, P.; Glasenapp, S.; Mantau, U., Rohstoffmonitoring Holz: Energieholzverwendung in privaten Haushalten 2014; Marktvolumen und verwendete Holzsortimente; Abschlussbericht, (Monitoring raw materials – Wood: use of wood for energy in private households in 2014; market volume and types of wood used; final report), February 2016 .
19 . Statistisches Bundesamt (StBA) [Federal Statistical Office], Statistische Erhebung 2, 064, 066K, 067, 073 und Außen-handelsstatistik (Statistical Survey 2, 064, 066K, 067, 073 and foreign trade statistics) .
20 . Bundesamt für Wirtschaft und Ausfuhrkontrolle (BAFA) [Federal Office of Economics and Export Control], Amtliche Mineralölstatistik (Official oil statistics) . [Online] . Available at: https://www .bafa .de/DE/Energie/Rohstoffe/Mineraloelstatistik/mineraloel_node .html;jsessionid=FD235CA42058299AC37D8F4C106AD2DA .2_cid387 . [Accessed on 30 July 2019] .
21 . Bundesanstalt für Landwirtschaft und Ernährung (BLE) [Federal Office for Agriculture and Food] Evaluations- und Erfahrungsbericht für das Jahr 2017 – Biomassestrom-Nachhaltigkeitsverordnung, Biokraftstoff-Nachhaltigkeitsverordnung (Evaluation and progress report for 2017 – Biomass Energy Sustainability Ordinance, Biofuels Sustainability Ordinance), Bonn, 2018 .
22 . Bundesanstalt für Landwirtschaft und Ernährung (BLE) [Federal Office for Agriculture and Food], Anmeldungen auf die Treibhausgasminderungsquote – Daten für das Jahr 2018 (Nabisy Datenauszug 2019) (Reports on the greenhouse gas emission rate – data for 2018 (Nabisy data extract 2019)) .
23 . Bundesministerium der Finanzen (BMF) [Federal Ministry of Finance] and Biokraftstoffquotenstelle [Office for Biofuel Quotas], Statistische Angaben über die Erfüllung der Biokraftstoffquote der Jahre 2007–2017 (Statistics on the fulfilment of the biofuel quota in 2007–2017) .
LIST OF SOURCES 75
24 . Bundesregierung (BReg) [Federal Government], Nationale Berichte zur Umsetzung der Richtlinie 2003/30/EG vom 08 .05 .2003 zur Förderung der Verwendung von Biokraftstoffen oder anderen erneuerbaren Kraftstoffen im Verkehrssektor (National reports on the implementation of Directive 2003/30/EC of 8 May 2003 to promote the use of biofuels or other renewable fuels in the transport sector) .
25 . Bundesregierung (BReg) [Federal Government], Bericht der Bundesregierung über die Entwicklung der Treibhaus-gasminderung von Biokraftstoffen, über das Biomassepotenzial sowie über die auf dem Kraftstoffmarkt befindlichen Biomethan-Mengen (Federal Government report on progress in reducing greenhouse gas emissions from biofuels, on biomass potential and on the quantities of biomethane in the fuel market), 10 May 2012 .
26 . Bundesregierung (BReg) [Federal Government], Verordnung über Anforderungen an eine nachhaltige Herstellung von Biokraftstoffen (Ordinance on requirements for sustainable production of biofuels) (Federal Law Gazette I p, 2174), 30 September 2009 .
27 . Bundesregierung (BReg) [Federal Government], Verordnung über Anforderungen an eine nachhaltige Herstellung von flüssiger Biomasse zur Stromerzeugung (Ordinance on requirements for the sustainable production of liquid biomass for electricity generation), 23 July 2009 .
28 . Statistisches Bundesamt (StBA) [Federal Statistical Office], Energiesteuerstatistik – Fachserie 14 Reihe 9 .3 (Energy tax statistics – special series 14 series 9 .3), latest edition: 2016 . 1 June 2017 .
29 . Umweltbundesamt (UBA) [German Enviroment Agency], Emissionsbilanz erneuerbarer Energieträger. Bestimmung der vermiedenen Emissionen im Jahr 2018 (Emissions balance of renewable energy sources. Determination of avoided emissions in 2018). Dessau-Roßlau, 2019, / 7 [Online] . Available at: www .umweltbundesamt .de/publikationen/ emissionsbilanzerneuerbarerenergietraeger
30 . Kunze et. al., Substitutionseffekte erneuerbarer Energien im Stromsektor – Modellierung der Substitutionseffekte erneuer-barer Energien im deutschen und europäischen Stromsektor und ihrer Auswirkungen auf die Emissionsbilanzierung erneuerbarer Energieträger (Substitution effects of renewable energy in the electricity sector – Modelling the substitution effects of renewable energy in the German and European electricity sector and its impact on the emissions accounts of renewable energy) . 1 September 2019 .
31 . Fehrenbach, H. et al., Aktualisierung der Eingangsgrößen und Emissionsbilanzen wesentlicher biogener Energienutzungs-pfade (BioEm) (Updated input values and emission balances for key usage of biogenic energy sources), 1 February 2016,
32 . Directive (EU) 2015/1513 of the European Parliament and of the Council of 9 September 2015 amending Directive 98/70/EC relating to the quality of petrol and diesel fuels and amending Directive 2009/28/EC on the promotion of the use of energy from renewable sources. Official Journal of the European Union, L 239/1 of 15 September 2015 .
33 . Report from the Commission to the European Parliament, the Council, the European Economic and Social Committee and the Committee of the Regions – Renewable Energy Progress Report .
34 . General Secretariat of the Council, Proposal for a Directive of the European Parliament and of the Council on the promotion of the use of energy from renewable sources – Analysis of the final compromise text with a view to agreement (2016/0382), Brussels, June 2018 .
35 . Reply by the Federal Government to the minor interpollation by the Alliance 90/The Greens parliamentary group, State of play in the EU Clean Air for All Europeans package, Bundestag printed paper 19/1602,
36 . Umweltbundesamt (UBA) [German Environment Agency], Emissionsvermeidung durch erneuerbare Energieträger (Avoided emissions due to renewable energy), 21 June 2019 . [Online] . Available at: https://www .umweltbundesamt .de/themen/klima-energie/erneuerbare-energien/emissionsvermeidung-durch-erneuerbare . [Accessed on 22 August 2019] .
LIST OF SOURCES 76
37 . Bundesministerium für Wirtschaft und Energie (BMWi) [Federal Ministry for Economic Affairs and Energy] and Bundesamt für Wirtschaft und Ausfuhrkontrolle (BAFA) [Federal Office of Economics and Export Control], Hintergrundinformationen zur Besonderen Ausgleichsregelung, Antragsverfahren 2017 für Begrenzungsjahr 2018 (Background information on the special equalisation scheme, Application procedures in 2017 for 2018) .
38 . 50 Hertz Transmission GmbH, Amprion GmbH, TenneT TSO GmbH, and TransnetBW GmbH, Prognose der EEG-Umlage 2019 nach EEV – Prognosekonzept und Berechnungen der ÜNB (Forecast of EEG surcharge 2019 by final energy consumption – forcast concept and calculations of the TSOs), October 2018 .
39 . O’Sullivan, M.; Edler, D. und Lehr, U., Ökonomische Indikatoren des Energiesystems Methode, Abgrenzung und Ergeb-nisse für den Zeitraum 2000–2017 (Economic energy system indicators: method, definition and results for 2000–2017), DIW Berlin: Politikberatung kompakt 135 (Compact policy advice 135), 1 January 2019 .
40 . Bundesregierung (BReg) [Federal Government] Ein neuer Aufbruch für Europa, Eine neue Dynamik für Deutschland, Ein neuer Zusammenhalt für unser Land – Koalitionsvertrag zwischen CDU, CSU und SPD (A new departure for Europe, a new dynamic for Germany, a new cohesion for our country: Coalition Agreement between CDU, CSU und SPD), Berlin, February 2018 .
41 . Bundesministerium für Wirtschaft und Energie (BMWi) [Federal Ministry for Economic Affairs and Energy], Evalu-ation des Marktanreizprogramms zur Förderung von Maßnahmen zur Nutzung erneuerbarer Energien im Wärmemarkt im Förderzeitraum 2015 bis 2017 (Evaluation of the Market Incentive Programme to promote measures to use renewable energy in the heating market in the 2015–2017 funding period), 1 October 2018 . [Online] . Available at: https://www .erneuerbare-energien .de/EE/Redaktion/DE/Downloads/Berichte/evaluierung-marktanreizprogramm-2017 .pdf?__blob=publicationFile&v=3 . [Accessed on 31 July 2019] .
42 . Bundesregierung (BReg) [Federal Government], Gesetz zur Neuregelung der Besteuerung von Energieerzeugnissen und zur Änderung des Stromsteuergesetzes (Act reorganising the taxation of energy products and amending the Electricity Tax Act) of 15 July 2006 (Federal Law Gazette I p .1534) .
43 . Bundesregierung (BReg) [Federal Government], Biokraftstoffquotengesetz (Biofuel Quota Act) of 18 December 2006 (Federal Law Gazette I p . 3180) .
44 . Bundesregierung (BReg) [Federal Government], Zwölftes Gesetz zur Änderung des Bundes-Immissionsschutzgesetzes (Twelfth Act amending the Federal Immission Control Act) of 20 November 2014 .
45 . Energy research Centre of the Netherlands (ECN), European Enviroment Agency (EEA), Renewable Energy Projections as Published in the National Renewable Energy Action Plans of the European Member States, Summary Report, ECN-E--10-069, November 2011 .
46 . Eurostat, Statistical Office of the European Communities, Luxembourg, SHARES 2017 – Short Assessment of Renew able Energy Sources, March 2019 . [Online] . Available at: http://ec .europa .eu/eurostat/web/energy/data/shares .
47 . Eurostat, Statistical Office of the European Communities, Luxembourg, Online Database, Production of electricity and derived heat by type of fuel (nrg_bal_peh) . [Online] . Available at: http://appsso .eurostat .ec .europa .eu/nui/show .do? dataset=nrg_bal_peh&lang=en . [Accessed on 30 July 2019] .
48 . Observatoire des énergies renouvelables (Observ’ER), Wind energy barometer 2018; A study carried out by EurObserv’ER, May 2019 . [Online] . Available at: https://www .eurobserv-er .org/category/all-wind-energy-barometers/ . [Accessed on 25 July 2019] .
49 . Observatoire des énergies renouvelables (Observ’ER), Solar thermal and concentrated solar power barometer 2019, A study carried out by EurObserv’ER, 1 June 2019 . [Online] . Available at: https://www .eurobserv-er .org/solar- thermal-and-concentrated-solar-power-barometer-2019/ . [Accessed on 30 July 2019] .
LIST OF SOURCES 77
50 . Eurostat, Statistical Office of the European Communities, Luxembourg, Online Database, Electricity production capacities for renewables and wastes (nrg_inf_epcrw) . [Online] . Available at: https://ec .europa .eu/eurostat/web/energy/data/database . [Accessed on 25 July 2019] .
51 . European Wind Energy Association (EWEA), Wind energy in Europe in 2018, WindEurope . [Online] . Available at: https://windeurope .org/about-wind/statistics/european/wind-energy-in-europe-in-2018/ . [Accessed on 30 July 2019] .
52 . European Wind Energy Association (EWEA), Offshore wind in Europe – key trends and statistics 2018, WindEurope, 7 February 2019 . [Online] . Available at: https://windeurope .org/about-wind/statistics/offshore/european-off-shore-wind-industry-key-trends-statistics-2018/ . [Accessed on 30 July 2019] .
53 . Observatoire des énergies renouvelables (Observ’ER), Photovoltaic barometer 2019, A study carried out by EurObserv’ER, 1 April 2019 . [Online] . Available at: https://www .eurobserv-er .org/photovoltaic-barometer-2019/ . [Accessed on 30 July 2019] .
54 . Zentrum für Sonnenenergie- und Wasserstoff-Forschung Baden-Württemberg (ZSW) [Centre for Solar Energy and Hydrogen Research Baden-Wuerttemberg], ZSW Datenservice (ZSW data service), 1 July 2019 . [Online] . Available at: https://www .zsw-bw .de/mediathek/datenservice .html#c6840 . [Accessed on 30 July 2019] .
55 . Observatoire des énergies renouvelables (Observ’ER), All Biofuels barometers, A study carried out by EurObserv’ER, 1 September 2018 . [Online] . Available at: https://www .eurobserv-er .org/category/all-biofuels-barometers/ . [Accessed on 30 July 2019] .
56 . Eurostat, Statistical Office of the European Communities, Luxembourg, Energy balances – early estimates – Statistics Explained . [Online] . Available at: https://ec .europa .eu/eurostat/statistics-explained/index .php?title=Energy_balances_-_early_estimates#Renewables_and_waste . [Accessed on 22 August 2019] .
57 . International Renewable Energy Agency (IRENA), Global energy transformation, a roadmap to 2050 .
58 . International Energy Agency (IEA), World Energy Outlook 2018, Access to energy, 15 June 2019 . [Online] . Available at: https://www .iea .org/weo2018/themes/ . [Accessed on 31 July 2019] .
59 . REN 21, Renewables 2019 – Global Status Report, REN21 . [Online] . Available at: https://www .ren21 .net/reports/ global-status-report/ . [Accessed on 30 July 2019] .
60 . IRENA, Renewable Energy and Jobs – Annual Review 2019, 1 June 2019 . [Online] . Available at: www .irena .org/ publications/2019/Jun/Renewable-Energy-and-Jobs-Annual-Review-2019 . [Accessed on 30 July 2019] .
61 . Perspectives for the energy transition: Investment needs for a low-carbon energy system . [Online] . Available at: www .irena .org/publications/2017/Mar/Perspectives-for-the-energy-transition-Investment-needs-for-a-low-carbon-energy- system . [Accessed on 8 August 2019] .
62 . Clean Energy Ministerial (CEM), About the Clean Energy Ministerial . [Online] . Available at: http://www .cleanenergyministerial .org/about-clean-energy-ministerial . [Accessed on 8 August 2019] .
63 . KfW (Kreditanstalt für Wiederaufbau), [German government-owned development bank], KfW-Förderung für Erneuerbare Energien im Inland, 2007–2014 (KfW funding for renewable energy in Germany, 2007–2014) . [Online] . Available at: https://www .kfw .de/KfW-Konzern/KfW-Research/Publikationen-thematisch/Energie-und- Nachhaltigkeit/ . [Accessed on 30 July 2019] .
For more information on renewable energy, please visit the following websites operated by the Federal Ministry for Economic Affairs and Energy www .bmwi .de and www .erneuerbare-energien .de