Embed Size (px)
Citation preview

Procedia Technology 8 ( 2013 ) 406 – 415
2212-0173 © 2013 The Authors. Published by Elsevier Ltd. Selection and peer-review under responsibility of The Hellenic Association for Information and Communication Technologies in Agriculture Food and Environment (HAICTA)doi: 10.1016/j.protcy.2013.11.053
6th International Conference on Information and Communication Technologies in Agriculture, Food and Environment (HAICTA 2013)
Renewable energy sources in Crete: economic valuation results from a stated choice experiment
Christos J. Emmanouilidesa*, heano Sgouromallia aDepartment of Economics, Aristotle University of Thessaloniki, 541 24 Thessaloniki,Greece
Abstract
The paper investigates the preferences and economic valuations of individuals about renewable energy sources for electricity production in the island of Crete. To estimate the monetary value of the social costs and benefits associated with renewable energy programs, we use stated preference data collected via a choice experiment. Focus is placed on the following key likely impacts of renewable energy production methods as alternatives to traditional ones based on fossil fuels: (a) environmental impact on landscape, wildlife, noise levels and quality of air, and (b) economic impact on employment and electricity prices. We apply choice models to analyze the preference structure of residents for alternative impact scenarios that correspond to a mixture of wind, solar, hydro and biomass power installations. The main target of the modeling approach is inference about welfare valuations and their relationship with the characteristics of the participants to the choice experiment. We derive welfare estimates and detect a number of significant effects that may inform energy and regional development policies. © 2013 The Authors. Published by Elsevier B.V. Selection and peer-review under responsibility of HAICTA
Keywords: Renewable energy sources; valuation; choice experiment
1. Introduction
An important target of energy policy in Greece and in EU is the increase of the share of renewable energy sources (RES) in energy production. The national plan for Greece, as stated in [1], is RES to reach a 20% share of the total energy production by 2020, while for the electricity consumption the target share of RES is set to 40%. The island of Crete, due to its size, ample sun, wind and geo-morphological characteristics is one of the locations for which
* Corresponding author. Tel.: +30-2310-996443; fax: +30-2310-996426.
E-mail address: [email protected]
Available online at www.sciencedirect.com
© 2013 The Authors. Published by Elsevier Ltd. Selection and peer-review under responsibility of The Hellenic Association for Information and Communication Technologies in Agriculture Food and Environment (HAICTA)
ScienceDirect

407 Christos J. Emmanouilides and Theano Sgouromalli / Procedia Technology 8 ( 2013 ) 406 – 415
deployment of large RES projects has already started and new installations are planned for the immediate future. As the primary income sources in the island come from activities related to tourism and other environmentally sensitive sectors as agriculture, there are serious concerns in local communities regarding the likely impacts of RES installation mixtures on the quality of the environment, as well as on the local economy. This paper aims to assess the economic valuations of these impacts made by urban and rural residents of the island of Crete employing a choice experiment design. Previous similar studies in Greece include the work of [2] and [3], who studied respectively the willingness to pay (a) of urban dwellers and tourists in Crete for the deployment of RES, and (b) of tourists for staying at hotels in Crete that use RES. These, and other studies of RES energy production in Greece, have used the contingent valuation method. An exception is [4] who used a choice experiment to estimate households’ willingness to accept compensation for wind farm installations in the Aegean. In the following sections we present the methodology, the choice modeling results, assess the impact of measured variables on welfare estimates, and finally conclude with a discussion of the findings.
2. Methodology
Individual preferences and economic valuations about renewable energy sources for electricity production in Crete are studied using a discrete choice experiment (CE). CE is a well known stated preference method (e.g. [5]) used to study the determinants of expected choice behavior in a hypothetical market process. Such experiments have been widely used in marketing, transportation research, and more recently in environmental and energy economics. Among others, [5], [6], and [7] provide comprehensive reviews of the CE methodology.
2.1. Design and data collection
The study focuses on two key aspects of renewable energy production methods as alternatives to traditional ones based on fossil fuels: (a) environmental impact on landscape, wildlife, noise levels and quality of air, and (b) economic impact on employment and electricity prices. These are represented in the CE as the attributes of a hypothetic good that reflects the positive and negative effects a mixture of RES installations (either deployed already or in the future) may have on the environment and the local economy. These attributes were determined through review of the relevant literature and consultation of domain experts and local people. Table 1 presents their definitions and levels. The first attribute is the likely aesthetic effect on landscape. The second attribute is the impact on biodiversity and wildlife habitats, the third is the likely increase in noise levels, the fourth is the effect on air quality and the fifth is the degree of human labour transfer to RES installations in the log-run. Finally, there is a cost attribute that is the extra amount to be paid annually by households, additional to the present RES Tax level (about €25 on average in mid 2012). The definition and measurement of the non-monetary attributes follows the approach of Bergman et al. ([8], [9]) and Ku & Yoo ([10]), and was confirmed through extensive pilot testing. The values of the cost attribute were determined by taking into account scenarios of increases in the RES Tax announced by the Greek Regulatory Authority for Energy in 2012. They represent increases in the annual RES Tax amount per household, ranging from 10% to 60% with respect to the mid 2012 household average.
Table 1. Attributes and levels
Attribute Definition Levels LAND Aesthetic impact of a RES installation (depends on scale and deployment area) None , low, moderate, high
BIO Impact on biodiversity of species as a result of habitat alterations in deployment areas Slightly negative, none, slightly positive
NOISE Noise generation (relevant for large scale on-shore wind farms and biomass plants) Yes, none AIR Impact on air quality (relevant for biomass plants that burn non-fossil fuels) Slightly negative, none EMPL Long-term jobs in a new RES installation 1-3, 8-12, 20-25 COST Annual increase in the RES Tax part of the electricity bill (avg. RES Tax in 2012 is €25) €0 , €2.5, €5, €10, €15
To reduce the large number (4×3×2×2×3×5 = 720) of possible choice alternatives for the given number of
attributes and their measurement levels, we used an exact algorithmic fractional factorial design ([11]) that allows estimation of linear two-way attribute-attribute interactions. The design was developed and implemented using the R

408 Christos J. Emmanouilides and Theano Sgouromalli / Procedia Technology 8 ( 2013 ) 406 – 415
statistical computing environment (http://cran.r-project.org/). The number of profiles in the design is 32. They are orthogonally split into 4 blocks of 8 profiles. In each profile, individuals were asked to choose one among three alternative scenarios for generic RES installation mixtures (as represented by attribute combinations) in Crete. Two of them are “RES” scenarios (RSs) and the third is the “non-RES” scenario or “status quo” (SQ). The survey was carried out in the island of Crete, during July-September 2012. The sampling unit of the survey is resident households. Data are collected with face-to-face interviews with an adult household member, applying geographically proportional stratification. The total sample size is 330.
2.2. Sample characteristics – Measured variables
The questionnaire used for data collection consisted of three parts. The first introduced the aim and scope of the study and provided the necessary attribute definitions, stating clearly to interviewees that the research is not about a specific RES type for electricity production (e.g. solar, wind, etc.), but for the generic attributes of RES installation types regarding their environmental and economic impact. The second was the choice experiment part complemented with follow-up questions elucidating the perceived factors that determine respondents’ choices and identifying protest voters. The third part was about background socio-demographic information. Table 2 presents
Table 2. Socio-demographic variables. Definitions and descriptive statistics
Quantitative Variables Definition Mean Median Std. Dev. Min Max AGE Age in years 36.98 33.00 14.02 18.00 80.00 HHSIZE Size of household 3.00 3.00 1.43 1.00 10.00 NKIDS Number of kids 0.86 0.00 1.21 0.00 8.00 EDUCYRS Years in full time education 14.70 15.00 3.46 5.00 25.00 INCOME Monthly net household income (,000 €) 1.73 1.25 1.05 0.25 4.25 Qualitative Variables * Definition and levels Frequency Percent (%) GENDER Gender 0 = Male 191 57.88 1 = Female 139 42.12 MARITAL Marital status 0= Single 178 53.94 1 = Married/Cohabiting 138 41.82 2 = Widowed/ Divorced 14 4.24 KIDS Have kids 0 = No 193 58.48 1 = Yes 137 41.52 OCCUP Occupation 1 = Public sector employee 68 20.61 2 = Private sector employee 90 27.27 3 = Self-employed 66 20.00 4= Unemployed 26 7.88 5 = Student 47 14.24 6 = Retired 23 6.97 7 = Other (housekeepers, workers, soldiers) 10 3.04 HHOWN Owns residence 0 = No 178 53.94 1 = Yes 152 46.06 REGION Prefecture of residence 1 = Chania 94 28.48 2 = Rethymnon 50 15.15 3 = Heraklion 147 44.55 4 = Lasithi 39 11.82 URBAN Resides on urban location 0 = No 73 22.12 1 = Yes 257 77.88 ENV Environmental group membership 0 = No 311 94.24 1 = Yes 19 5.76
Base: N = 330. * Operationalised as dummies
definitions and statistics for the key socio-demographic and geographical sample characteristics (henceforth called
409 Christos J. Emmanouilides and Theano Sgouromalli / Procedia Technology 8 ( 2013 ) 406 – 415
individual specific variables – ISVs). Protest bidders pose a well known problem in discrete choice analysis (e.g. [12]). Using a set of appropriate
questions asking zero bidders to provide reasons for choosing the status quo scenario, we classified 1.5 % of the respondents as protest bidders, a very small proportion indeed. These were excluded from further analyses, reducing thus, the effective sample size to N=325.
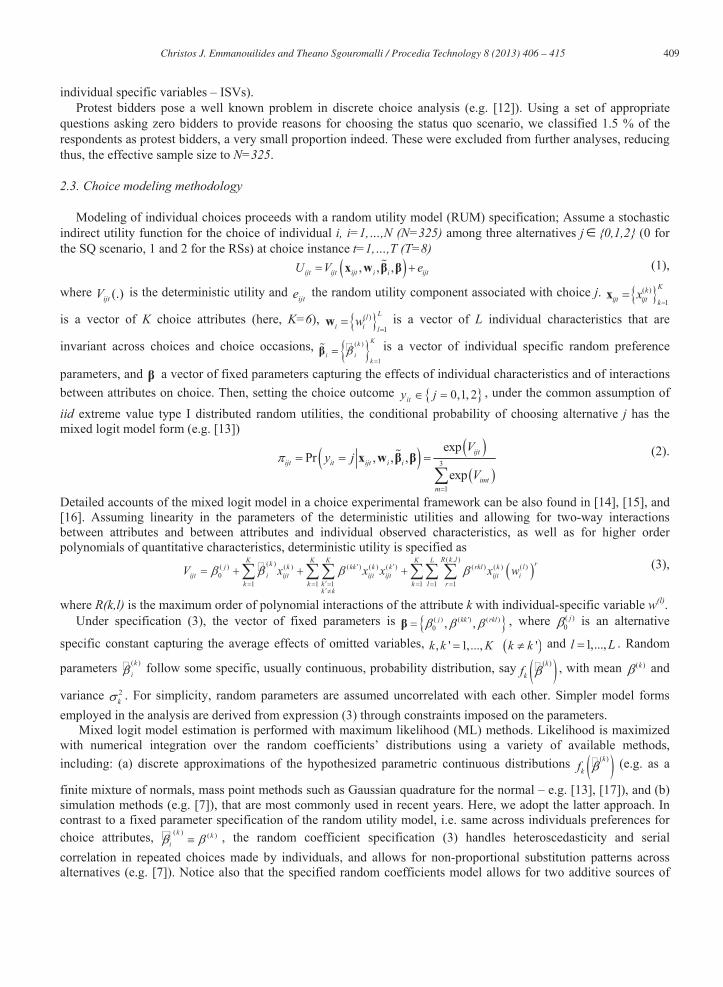
2.3. Choice modeling methodology
Modeling of individual choices proceeds with a random utility model (RUM) specification; Assume a stochastic indirect utility function for the choice of individual i, i=1,…,N (N=325) among three alternatives j {0,1,2} (0 for the SQ scenario, 1 and 2 for the RSs) at choice instance t=1,…,T (T=8)
, , ,ijt ijt ijt i ijtiU V ex w (1),
where (.)ijtV is the deterministic utility and ijte the random utility component associated with choice j. ( )
1
Kkijt ijt k
xx
is a vector of K choice attributes (here, K=6), ( )
1
Lli i l
ww is a vector of L individual characteristics that are
invariant across choices and choice occasions, ( )
1
Kk
iik
is a vector of individual specific random preference
parameters, and a vector of fixed parameters capturing the effects of individual characteristics and of interactions between attributes on choice. Then, setting the choice outcome 0,1, 2ity j , under the common assumption of iid extreme value type I distributed random utilities, the conditional probability of choosing alternative j has the mixed logit model form (e.g. [13])
3
1
expPr , , ,
exp
ijtijt it ijt i i
imtm
Vy j
Vx w (2).
Detailed accounts of the mixed logit model in a choice experimental framework can be also found in [14], [15], and [16]. Assuming linearity in the parameters of the deterministic utilities and allowing for two-way interactions between attributes and between attributes and individual observed characteristics, as well as for higher order polynomials of quantitative characteristics, deterministic utility is specified as
( , )( )( ) ( ) ( ) ( ) ( ) ( ) ( ) ( )0
1 1 1 1 1 1
R k lK K K K L rkj k kk k k rkl k liijt ijt ijt ijt ijt i
k k k k l rk k
V x x x x w (3),
where R(k,l) is the maximum order of polynomial interactions of the attribute k with individual-specific variable w(l). Under specification (3), the vector of fixed parameters is ( ) ( ') ( )
0 , ,j kk rkl , where ( )0
j is an alternative
specific constant capturing the average effects of omitted variables, , ' 1,..., 'k k K k k and 1,...,l L . Random
parameters ( )k
i follow some specific, usually continuous, probability distribution, say ( )k
kf , with mean ( )k and
variance 2k . For simplicity, random parameters are assumed uncorrelated with each other. Simpler model forms
employed in the analysis are derived from expression (3) through constraints imposed on the parameters. Mixed logit model estimation is performed with maximum likelihood (ML) methods. Likelihood is maximized
with numerical integration over the random coefficients’ distributions using a variety of available methods, including: (a) discrete approximations of the hypothesized parametric continuous distributions ( )k
kf (e.g. as a
finite mixture of normals, mass point methods such as Gaussian quadrature for the normal – e.g. [13], [17]), and (b) simulation methods (e.g. [7]), that are most commonly used in recent years. Here, we adopt the latter approach. In contrast to a fixed parameter specification of the random utility model, i.e. same across individuals preferences for choice attributes, ( ) ( )k k
i, the random coefficient specification (3) handles heteroscedasticity and serial
correlation in repeated choices made by individuals, and allows for non-proportional substitution patterns across alternatives (e.g. [7]). Notice also that the specified random coefficients model allows for two additive sources of

410 Christos J. Emmanouilides and Theano Sgouromalli / Procedia Technology 8 ( 2013 ) 406 – 415
possible correlations between choices of the same individual; (a) correlations due to observed effects, introduced in the model through the interactions between attributes and individual characteristics, and (b) correlations due to unobserved preference heterogeneity, accounted for by the individual-specific random parameters. Both are assumed time-invariant (i.e. constant across choices of the same individual), implying a temporally stable structure of individual preferences.
2.4. Estimation of the monetary value of attributes
Given estimates of parameters in the utility function (3), marginal willingness to pay (WTP) for a unit improvement of a non-cost attribute k can be computed as
( , )1( ) ( ) ( ) ( ) ( ) ( )
1 11( )( ) ( )( )( , )1( ) ( ' ) ( ') ( ) ( )
1 1' 1
, ,
R k lLK rk kk k kC rkl li ijt ijt i
k rlkk C k kki ii R C lK L rC k C k rCl li
i ijt il rk
x C wV xWTPV C
x ww
(4).
Equation (4) is derived by decomposing (3) into terms that involve cost (C) and non-cost attributes (x(k) , k=1,...,K-1), and computing the derivatives involved in (4). R(k,l) denotes the maximum order of polynomial interactions of the non-cost attribute k with individual-specific variable w(l) and R(C,l) the maximum order of polynomial interactions of variable w(l) with the cost attribute. Note that the presence of interactions between the cost and other attributes renders willingness to pay for attribute k dependent on the levels of other attributes, k , and cost, C. Interactions of attributes with individual characteristics (observed heterogeneity) and the random coefficients of the choice attributes (unobserved heterogeneity) both render willingness to pay individual-specific. Estimates of the individual random parameters are computed during the simulated likelihood estimation procedure, and then are used to derive individual WTP values.
Finally, the estimated expected willingness to pay for attribute k is
( ) ( ) ( ) ( ) ( ) ( )( ) ( ) , ,
i
k C k C k Ck ki i i i i ii i k C iE WTP WTP f f f d d d
w W
w w w (5),
where W denotes the multidimensional space of observed individual characteristics and if w the corresponding
probability distribution function. Note that random coefficients are assumed independent from observed characteristics. ( ) ( )( ) , ,
k Cki iiWTP w is given by (4). Integral (5) is analytically intractable and is evaluated
numerically. Asymptotic confidence intervals for the expected WTP can be derived with Monte Carlo simulations using the estimated variance-covariance matrix of model coefficients under the assumption of asymptotic multivariate normality (MVN) of maximum likelihood estimates. Alternatively, at the expense of computational cost (that is considerable for the random coefficient models) non-parametric confidence intervals can be derived using resampling methods such as the bootstrap. The delta method is another option, based again on asymptotic normality of ML estimators. As expected, it provides similar results to the MVN Monte Carlo approach. Here, we use both the Monte Carlo and the delta method to derive asymptotic WTP confidence intervals.
3. Choice modeling results
We model the CE data using a sequence of increasingly complex logit model specifications. We start with a fixed parameter specification of an additively separable indirect utility function (3) that is assumed to include only main choice attribute effects (model termed FPL1). Then we add interactions between choice attributes and interactions between individual characteristics and choice attributes, allowing for higher order polynomials of quantitative variables (model termed FPL2). All possible two-way interactions are considered, and selection of effects to include in each specification is based on standard BIC (Bayesian Information Criterion) minimizing stepwise variable

411 Christos J. Emmanouilides and Theano Sgouromalli / Procedia Technology 8 ( 2013 ) 406 – 415
selection procedures. For both fixed parameter logit models we estimate its random coefficient (i.e. mixed logit) version by allowing the main effects of choice attributes to vary randomly across individuals assuming independent normal, truncated normal or log-normal distributions. These parametric distributions, despite their drawbacks that are extensively discussed in the literature (e.g. [7]), is the common choice for the modeler.
3.1. Model estimation
To estimate the FPL and RPL models, we employed the publicly available maximum simulated likelihood GAUSS code of Kenneth Train (http://elsa.berkeley.edu/~train), modified for use in the R statistical computing environment (http://cran.r-project.org/). For RPL model estimation we tried sequentially several starting values, intermediate optimization solutions, number of points for the simulation of random coefficient distributions, and alternative optimization algorithms to reach a final solution. Finally, for each estimated model, marginal WTP for the non-cost choice attributes are computed using the methodology of the previous section. The covariates we used to specify the indirect utility function (3) are defined in section 2.2.
Table 3. Estimated RPL model with interactions (RPL2)
***, **, * indicate significance at 1%, 5% and 10% respectively. (ns) indicates significance at a level slightly >10% The variable selection procedure suggests optimal model specifications that include attribute - attribute
interactions. However, for exposition ease, we consider here somewhat simplified model versions (FPL and RPL) that include interactions of attributes with socio-demographics only; Preliminary analyses indicate that aggregate welfare estimates from these models are very close to those from the more complex ones. Testing alternative combinations of independent normal, truncated normal, and log-normal distributions for the random coefficients, and employing the minimum BIC as the selection rule, we reached the conclusion that for both models - with ISVs (RPL2) and without ISVs (RPL1) - the data support a truncated normal distribution for the main effects of the COST attribute, and normally distributed main effects for all other attributes (LAND, BIO, NOISE, AIR, EMPL). That is, unobserved preference heterogeneity in the target population is empirically supported for all attributes; modeled covariates are not sufficient to capture the full heterogeneity in individual preferences for the RES attributes studied here.
Variables Estimate Variables Estimate Variables Estimate ASC-SQ ( 0) -1.929 *** LAND:AGE 0.085 * NOISE: EDUCYRS -0.036 * LAND:AGE2 -0.002 * NOISE: ENV 0.993 *** LAND (normal) LAND:AGE3 1.3×10⁻⁵ (ns) mean -0.087 (ns) AIR:INCOME -1.7×10⁻⁴ ** sd 0.410 *** LAND:INCOME2/100 1.1×10⁻⁶ * AIR:GENDER -0.366 ** LAND:EDUCYRS -0.030 *** AIR:REGION2 0.448 * BIO (normal) LAND:NKIDS 0.110 ** AIR:REGION3 -0.035 (ns) mean -1.564 (ns) LAND:HHOWN -0.084 * AIR:REGION4 0.308 (ns) sd 0.459 *** LAND:MARITAL2 0.331 *** LAND:MARITAL3 0.436 *** EMPL:AGE -0.003 *** NOISE (normal) EMPL:INCOME 3.4×10⁻⁵ ** mean 0.959 ** BIO:AGE 0.177 ** EMPL:INCOME2/100 -6.2×10⁻⁷ ** sd 0.714 *** BIO:AGE2 -0.004 * EMPL:EDUCYRS -0.003 ** BIO: AGE3 2.6×10⁻⁵ * EMPL:HHSIZE -0.009 ** AIR (normal) BIO:INCOME 3.9×10⁻⁴ * EMPL:NKIDS 0.015 *** mean 1.302 *** BIO:INCOME2/100 -1.1×10⁻⁵ * EMPL:URBAN 0.028 *** sd 1.272 *** BIO:NKIDS -0.084 * EMPL:ENV -0.059 *** BIO:EDUCYRS -0.038 ** EMPL (normal) BIO:REGION2 0.171 (ns) mean 0.132 *** BIO:REGION3 -0.125 (ns) sd 0.074 *** BIO:REGION4 0.361 ** Fit statistics BIO:URBAN 0.321 *** Sample size 325 COST (truncated normal) Log Likelihood -2286.7 mean -0.042 *** NOISE:INCOME -1.5×10⁻⁴ (ns) BIC 4974.33 sd 0.074 *** NOISE: INCOME2/100 4.5×10⁻⁶ * McFadden’s R2 0.160

412 Christos J. Emmanouilides and Theano Sgouromalli / Procedia Technology 8 ( 2013 ) 406 – 415
McFadden’s R2 ranges from 0.05 for the FPL1 model to 0.16 for the RPL2 model, indicating acceptable levels of model fit for the choice models employed. [5] state that a LRI value of 0.2 corresponds to a standard OLS adjusted R2 value of about 0.7. Likelihood ratio (LR) tests are clearly in favor of the more complex RPL model specifications. Overall, the more complex RPL2 model is statistically superior as it achieves significantly better values of both the likelihood function and the BIC. Note also that the estimated standard errors of the random coefficients are statistically significant, justifying the conclusion of random unobserved preferences for all attributes. Estimation results for the RPL2 model are shown in Table 3.
3.2. Welfare estimates
Table 4 presents estimates from each model of the average WTP for the five investigated attributes, using equation (5), and the corresponding 95% confidence intervals. The latter are derived using the MVN Monte Carlo method. For the more complex and computationally demanding RPL2 model we employ the delta method. Table 4. WTP estimates (means and associated 95% confidence intervals in parentheses)
Model Attribute FPL1* RPL1* FPL2* RPL2**
LAND
3.06 (0.95,6.09)
2.47 (0.88,4.47)
2.77 (0.87,5.35)
2.66 (1.05,4.28)
BIO
19.75 (12.33,35.28)
15.93 (10.94,24.82)
18.50 (11.88,31.64)
15.63 (7.25,24.02)
NOISE
10.38 (5.23,19.43)
8.49 (4.75,14.21)
10.03 (5.34,17.99)
7.57 (3.77,11.37)
AIR
27.13 (16.32,49.31)
24.38 (16.23,38.62)
24.96 (15.46,43.47)
21.81 (13.12,30.50)
EMPL
0.70 (0.38,1.27)
0.52 (0.30,0.85)
0.65 (0.36,1.14)
0.59 (0.33,0.84)
* Monte Carlo estimates, ** Delta method estimates.
For each attribute, WTP estimates from the four models do not differ significantly. However, RPL models tend to provide lower point estimates. Point estimates range from 2.47€ to 3.06€ per level change for the LAND attribute, from 15.63€ to 19.75€ per level improvement for the BIO attribute, from 7.57€ to 10.38€ per level change for NOISE, from 21.81€ to 27.13€ per level improvement in AIR, and from 0.52€ to 0.70€/employee for the EMPL attribute. From the best fitting RPL2 model, the average marginal WTP for LAND is estimated at 2.66€ per level change, 15.63€ for BIO, 7.57€ for NOISE, 21.81€ for AIR, while for the EMPL attribute at about 0.59€/employee.
-20 -10 0 10 20
0.00
0.02
0.04
0.06
Distribution of WTP for LAND
WTP for LAND
Den
sity
-20 -10 0 10 20 30 40
0.00
0.02
0.04
Distribution of WTP for BIO
WTP for BIO
Den
sity
-20 0 20 40
0.00
0.02
0.04
Distribution of WTP for NOISE
WTP for NOISE
Den
sity
-40 -20 0 20 40 60 80
0.00
00.
010
Distribution of WTP for AIR
WTP for AIR
Den
sity
-4 -2 0 2 4
0.00
0.10
0.20
Distribution of WTP for EMPL
WTP for EMPL
Den
sity
WTP.LAND
-10 0 10 20 30 -20 0 20 40 60
-10
010
20
-10
010
2030
WTP.BIO
WTP.NOISE
-10
010
2030
40
-20
020
4060
WTP.AIR
-10 0 10 20 -10 0 10 20 30 40 -4 -2 0 2 4
-4-2
02
4
WTP.EMPL
Fig. 1. Estimated sample WTP values for the choice attributes from the RPL2 model: (a) marginal, and (b) bivariate distributions.
Figure 1 depicts the distribution of estimated individual WTP for each one of the five attributes from the best fitting RPL2 model, together with projections of their bivariate joint distributions. The linear correlations between them range from -0.32 (for the pair NOISE-EMPL) to 0.36 (for the pair LAND-NOISE). Most of these correlations

413 Christos J. Emmanouilides and Theano Sgouromalli / Procedia Technology 8 ( 2013 ) 406 – 415
between valuations for the five attributes are statistically significant (p-value < 0.001 for 8 out of the10 pairs) and are due to the common effects of individual characteristics and the significant interactions between some of the attributes.
4. Effects of ISVs on welfare estimates
Given a non-trivial functional form for the WTP, such as (4), we are interested to assess the effects of individual characteristics on the WTP for the choice attributes. We choose here to follow a regression approach instead of utilising the more cumbersome analytical calculations based on the derivatives of average WTP (e.g. see [18]). Specifically, we regress the estimated (from RPL2) individual WTP for each attribute on the ISVs, including polynomial terms of the quantitative covariates. We keep only significant terms, selected via standard stepwise procedures. It is worth mentioning that the selected terms are those that correspond to covariates with statistically significant interactions with the relevant attribute in the RPL2 model. This is an indication for the internal consistency of our approach. Table 5 presents the results. Table 5. Effects of ISVs on WTP for the non-monetary attributes (WTP estimated from the RPL2 model)
***, **, * indicate significance at 1%, 5% and 10% respectively. (ns) indicates significance at a level slightly >10% Figure 2 shows the estimated average (i.e. evaluated at the mean values of other covariates and random coefficients) effects, of each quantitative ISV on the estimated individual-level WTP values from model RPL2. We restrict here the discussion to some selected main results.
20 30 40 50 60 70
23
45
6
AGE
Est
imat
ed W
TP
Effect of AGE on WTP for LAND
1000 2000 3000 4000
23
45
INCOME
WTP
Effect of INCOME on WTP for LAND
5 10 15 20 25
02
46
810
EDUCYRS
WTP
Effect of EDUCYRS on WTP for LAND
(a) LAND
Variables LAND BIO NOISE AIR EMPL Intercept -11.200 (ns) -26.310 *** 39.250 *** 83.840 *** 0.616 (ns) AGE 1.609 *** 3.387 *** - - -0.052 *** AGE2 -3.718×10⁻² *** -7.228×10⁻² *** - - - AGE3 2.658×10⁻⁴ *** 4.550×10⁻⁴ *** - - - INCOME - 4.081×10⁻³ *** - - 3.499×10⁻⁷ *** INCOME2 - - 1.780×10⁻⁷ * -5.021×10⁻⁷ * -7.834×10⁻¹¹ *** INCOME3 8.731×10⁻¹¹ *** -3.403×10⁻¹⁰ *** - - - EDUCYRS -1.455 *** - -5.313 ** -12.040 * 0.223 * EDUCYRS2 3.028×10⁻² * -8.569×10⁻² *** 0.320 * 0.761 * -9.154×10⁻³ ** EDUCYRS3 - 2.510×10⁻³ *** -7.114×10⁻³ (ns) -0.015 (ns) - NKIDS 2.462 *** -1.836 *** - - 0.361 *** NKIDS2 - - - -0.406 * - NKIDS3 - - - - - HHSIZE - - - - -0.188 *** HHOWN -2.393 *** - - - - GENDER - - - -6.783 *** - REGION2 - 3.293 *** - 12.600 *** - REGION3 - -3.103 *** - - - REGION4 - 6.754 *** - 9.869 *** - MARITAL2 7.364 *** - - - - MARITAL3 9.381 *** - - - - URBAN - 5.646 *** - - 0.722 *** ENV - - 20.520 *** - -1.412 *** Fit statistics Sample size 325 325 325 325 325 F-statistic (p-value) 14.29 (< 0.001) 30.58 (< 0.001) 28.08 (< 0.001) 4.541 (< 0.001) 10.14 ( <0.001) Adjusted R2 0.311 0.523 0.295 0.081 0.203

414 Christos J. Emmanouilides and Theano Sgouromalli / Procedia Technology 8 ( 2013 ) 406 – 415
20 30 40 50 60 70
68
1012
1416
18
AGE
WTP
Effect of AGE on WTP for BIO
1000 2000 3000 4000
46
810
1214
16
INCOME
WTP
Effect of INCOME on WTP for BIO
5 10 15 20 25
810
1214
16
EDUCYRS
WTP
Effect of EDUCYRS on WTP for BIO
(b) BIO
1000 2000 3000 4000
9.5
10.0
10.5
11.0
INCOME
WTP
Effect of INCOME on WTP for NOISE
5 10 15 20 25
510
1520
EDUCYRS
WTP
Effect of EDUCYRS on WTP for NOISE
(c) NOISE
1000 2000 3000 4000
1618
2022
24
INCOME
WTP
Effect of INCOME on WTP for AIR
5 10 15 20 25
1520
2530
35
EDUCYRS
WTP
Effect of EDUCYRS on WTP for AIR
0 2 4 6 8
810
1214
1618
20
NKIDS
WTP
Effect of NKIDS on WTP for AIR
(d) AIR
20 30 40 50 60 70
-0.5
0.0
0.5
1.0
AGE
WTP
Effect of AGE on WTP for EMPL
1000 2000 3000 4000
0.3
0.4
0.5
0.6
0.7
0.8
INCOME
WTP
Effect of INCOME on WTP for EMPL
5 10 15 20 25
-0.5
0.0
0.5
EDUCYRS
WTP
Effect of EDUCYRS on WTP for EMPL
(e) EMPL
Fig. 2. Estimated effects of ISVs on WTP values for the choice attributes from the RPL2 model
Age is non-linearly related to WTP for the LAND and BIO attributes. For the first, WTP initially increases from 2€ to 2.7€ at the age of 27, then decreases to 1.9€ at the age of 45 and then is rapidly increasing again well above 3€ for persons aged 60 or more. For BIO, WTP increases with age from 12€ to 19€ at about the age of 37 and then decreases to values below of 10€ for elders (> 60). Age does not appear to affect WTP for NOISE and AIR, when controlling for the effects of other covariates, while its effect on WTP for EMPL is negative with an almost linear trend; it decreases from about 1€ for younger people (~20) to zero and even negative values for those older than 55 years of age.
Income effects on WTP are non-linear for all five attributes. For landscape impact (LAND), WTP increases in an almost cubic manner from about 2€ for low income values (250€/month) to a maximum of 5.5€ per level change for the highest income values (4250€/month). For biodiversity impact (BIO), expected WTP per level change towards improvement appears to be almost constant at the value of 16€ for lower income levels (up to about 1500€/month) and then decreases rapidly and smoothly to a minimum of about 4€ for the highest incomes. Income effect on WTP for NOISE and AIR is strictly negative and positive respectively, while its effect on WTP for new employment positions is non-monotonous; it increases from 0.3€ for the lowest incomes to a maximum of about 0.8€ for mid-upper incomes (~2500€/month) and then decreases rapidly to 0.3€ for the highest ones.
Education (EDUCYRS) has negative non-linear effects on the WTP for all attributes but EMPL, for which its effect is non-monotonic. WTP for LAND decreases from an average of 11€ for the less educated (5 years in full-time education) to about 0€ for the most educated respondents (25 years). For BIO, the relationship is concave, decreasing from about 16.5€ to 7€. For NOISE and AIR, patterns are similar, declining from about 20€ to 0€ and 35€ to 15€ respectively. WTP for EMPL starts from negative values and, as years of education increase, reaches a maximum of about 0.9€ (for EDUCYRS=14) and then declines again towards negative values.
Number of kids (NKIDS) is positively related with the WTP for LAND improvements and RES job creation (EMPL), and negatively related with the WTP for BIO and AIR. Significant regional variation (REGION) is

415 Christos J. Emmanouilides and Theano Sgouromalli / Procedia Technology 8 ( 2013 ) 406 – 415
detected for the WTP for the BIO and AIR attribute, reflecting possibly differences in local conditions. Urban dwellers have higher average WTP for biotope improvements and job creation than rural dwellers, when controlling for the effects of other covariates. Members of environmental groups are much more sensitive to NOISE reductions and much less sensitive to EMPL than other respondents.
5. Concluding comments
We conducted a choice experiment to value five key attributes associated with RES installations in the island of Crete. Choice models were used to obtain monetary estimates for the preferences of residents about the impact of generic RES projects on the environment and the local economy, and their relationship to agents’ characteristics. These valuations were found to be strongly related to individual socio-demographic characteristics. Our empirical results may well inform decision makers towards the types of RES projects’ characteristics that are locally acceptable and for designing and targeting more efficient policies to meet the 2020 energy targets in a socially beneficial way.
Acknowledgements
We would like to gratefully acknowledge the valuable suggestions of Dr. G. Arabatzis at the early stages of the study design. We also thank the two anonymous referees for their constructive comments.
References
[1] Hellenic Republic. Law 3851/2010, http://www.et.gr/, 18/11/2010. [2] Zografakis N, Sifaki E, Pagalou M, Nikitaki G, Psarakis V, Tsagarakis K. Assessment of public acceptance and willingness to pay for
renewable energy sources in Crete. Renewable and Sustainable Energy Reviews 2010; 14: 1088-1095. [3] Sardianou E, Kostaki E. Which Factors Affect the Willingness of Tourists to Pay for Renewable Energy? Renewable Energy 2012; 38: 169-
172. [4] Dimitropoulos A, Kontoleon A. Assessing the determinants of local acceptability of wind-farm investment: A choice experiment in the
Greek Aegean Islands. Energy Policy 2009; 37: 1842-1854. [5] Louviere JJ, Hensher DA, Swait J. Stated choice methods: analysis and applications. Cambridge: Cambridge University Press; 2000. [6] Hensher DA, Rose JM, Greene WH. Applied choice analysis: A primer. Cambridge: Cambridge University Press; 2005. [7] Train KE. Discrete Choice Methods with Simulation. 2nd ed. Cambridge: Cambridge University Press; 2009. [8] Bergmann A, Hanley N, Wright R. Valuing the attributes of renewable energy investments. Energy Policy 2006; 34: 1004-1014. [9] Bergmann A, Colombo S, Hanley N. Rural versus urban preferences for renewable energy developments. Ecological Economics 2008; 65:
616-625. [10] Ku SJ, Yoo SH. Willingness to pay for renewable energy investment in Korea: A choice experiment study. Renewable and Sustainable
Energy Reviews 2010; 14: 2196-2201. [11] Federov VV. Theory of optimal experiments. New York: Academic Press; 1972. [12] Meyerhoff J, Liebe, L. Do Protest Responses to a Contingent Valuation Question and a Choice Experiment Differ? Environmental Resource
Economics 2008; 39: 433-446. [13] Longford NT. Random coefficient models. Oxford: Clarendon Press; 1993. [14] Revelt D, Train K. Mixed logit with repeated choices: Households’ choice of appliance efficiency level. Review of Economics and Statistics
1998; 53: 647-657. [15] Revelt D, Train K. Customer specific taste parameters and mixed logit: Households’ choice of electricity supplier. 1998. Working Paper,
Department of Economics, University of California, Berkeley. [16] Bateman IJ, Carson RT, Day B, Hanemann M, Hanley N, Hett T, Jones-Lee M, Loomes G, Mourato S, Ozdemiroglu E, Pearce DW, Sugden
R, Swanson J. Economic valuation with stated preference techniques: A manual. Cheltenham: Edward Elgar; 2002. [17] Train KE. EM Algorithms for nonparametric estimation of mixing distributions. Journal of Choice Modelling 2008; 1: 40-69 [18] Emmanouilides CJ, Tsiantikoudis S, Arabatzis G. Choice-based valuation of natural resources in the protected area of the Evros Delta.
HAICTA 2011 Conference Proceedings; 1-15.