Embed Size (px)
Citation preview

REPORT BY THE UNIVERSITY OF WASHINGTON ____________________________________________________________________________________________________________
Renewable Energy Options for Golden Gate National Recreation Area at Alcatraz Island
May 2008
Prepared for:
University National Park Energy Partnership Program and
National Park Service
Prepared by:
Mary H. Hamman, K. Boyd Fackler, and Philip C. Malte Department of Mechanical Engineering
University of Washington Seattle, WA 98195-2600
Phone: 206.543.6851 Email: [email protected]
________________________________________________________________

ii
Renewable Energy Options for Golden Gate National Recreation Area at Alcatraz Island
Mary H. Hamman, K. Boyd Fackler, and Philip C. Malte
Department of Mechanical Engineering University of Washington Seattle, WA 98195-2600
EXECUTIVE SUMMARY
This report is based on the Masters of Science (Mechanical Engineering) Thesis of Ms. Hamman completed in March 2008. Material on electrical details and wiring diagrams and on pumped storage seawater corrosion has been added. The report includes a comprehensive study of the existing energy situation at Alcatraz Island and the renewable energy opportunities available there. Alcatraz Island is part of the Golden Gate National Recreation Area in San Francisco Bay. As the site of one of the most notorious federal prisons, it is a significant piece of this country’s history and a destination for over a million tourists each year. The island is not connected to the San Francisco power grid, and currently energy is provided by 210 kW rated diesel generators, one that operates all day, regardless of the energy demand, and one held as an alternative. The cost of electricity produced by the diesel generators is $0.39/kWh, including fuel, transportation, maintenance and the emissions from the generators. With the increase in fuel cost and growing concern about greenhouse gas effects on the environment, the National Park Service is interested in finding alternative forms of power generation for the park. The purpose of this study is to determine one or more alternative energy systems to be used at Alcatraz Island. A comprehensive energy analysis of the island has been performed, including an audit of all of the energy uses on the island. Several energy consumption reduction methods are explored and the possible daily energy savings are estimated. Possible renewable energy resources in the San Francisco Bay are identified and data have been obtained to characterize their yearly availability. The energy available from each resource has been calculated and the optimal renewable energy resource has been determined to be solar energy. Four different systems are designed, including two different capacity solar photovoltaic systems in combination with either diesel generators or grid electricity. Finally, an economic analysis of each solar photovoltaic system is performed to determine the resulting cost of electricity for each possible system. Seven of the original buildings on Alcatraz Island, plus two modern restrooms, are currently functional and utilize power. Their uses vary between tourism, commerce, offices and facilities used by the National Park Service and the Golden Gate National Park Conservancy. The daily fuel consumption at Alcatraz

iii
Island is 175 gallons, providing 2350 kWh of electricity each day. This divides into a daytime load of 154 kW and an evening load of 41 kW. It is not recommended to operate generators at below their rated capacity because their efficiency decreases and the engines deteriorate faster. The largest energy consumers on the island are the incandescent and halogen lighting, consuming 27.7% and 17.9% of the daily energy produced, respectively. By implementing a few very simple energy conservation methods, including turning off unnecessary lighting and incorporating energy efficient bulbs, the daily energy load at Alcatraz Island could be reduced by nearly 42.3% of the current load. The three renewable resources available in San Francisco Bay are solar, wind, and tidal energy. Hourly solar and wind measurements have been obtained from the National Renewable Energy Laboratory website for San Francisco Airport. These data have been used to calculate the energy available each hour from both resources for an entire year. A full wind turbine array, 51 turbines, located on the roof of the Cell House could produce only 3% of the yearly energy demand at Alcatraz Island. In contrast, a large solar photovoltaic array, rated at 330 kW, could provide over 70% of the energy demand for the year. The energy output of a solar array depends on the amount of solar radiation available, causing a monthly energy production variation between 30% and 100% of the demand depending on the time of year. The National Oceanic and Atmospheric Administration has tidal current predictions of the maximum ebb and flood tides at several locations in the San Francisco Bay. This information has been used to predict the average power density of the tidal current at four locations near Alcatraz Island. The maximum power density of the tide near Alcatraz Island is 0.4 kW/m², but a tidal installation generally should have a power density of no less than 0.8 kW/m². Unless alternative data can be obtained that contradict the wind and tidal data presented in this report, neither should be considered for a renewable energy installation at Alcatraz Island. After determining the most suitable renewable energy resource, the system has to be sized and designed. The solar photovoltaic array can be as small or large as the space available to accommodate the solar modules. The two potential locations for solar modules in this study are the Cell House and the New Industries Building located on the island. The New Industries Building has a usable roof area of 15,300 ft² and the Cell House has 43,000 ft² of free area. The two roof solar arrays explored originally in this report are rated at 100 and 330 kW. The daytime power load at Alcatraz Island is 154 kW, so a 100 kW rated solar array will never produce power in excess of the daytime load; however, a 330 kW system in midsummer will. This demonstrates the need for an energy storage system in combination with a renewable energy system. During the daytime, a 330 kW system can produce up to twice as much power as is needed, so that excess is stored until the evening when the sun is gone and the modules can no longer produce power. Even the 100 kW system would benefit by the inclusion of an energy storage system. A 100 kW solar energy system at

iv
Alcatraz Island will always require a secondary energy system and a 330 kW solar array will require a secondary system to be used in the winter and on cloudy days. In this case, the diesel generators already located on the island will work in combination with the solar modules to power the island; this is called a hybrid diesel solar energy system. If there is no energy storage, then generators are used to make up any shortage between the power demand and the solar energy system production, which could be very small, causing the generators to operate at dangerously low speed. With an energy storage system, batteries could be used to supply the power deficit during low load periods and the generators would only be turned on to recharge the batteries at a rate close to the generator capacity. This reduces the run time of the generators and allows them to only be used at their maximum efficiency. A pumped storage solution also is considered for the island, but the water reservoir present is not large enough to fully meet the energy storage demand. Another specification of the solar energy system is the tilt angle and orientation of the solar modules. The tilt of a solar module refers to the angle that it makes with the horizontal surface and its orientation pertains to the angle between the front edge of the module and true south. It is often beneficial to tilt solar modules in the direction of the sun; this allows better solar radiation exposure and greater energy production potential. Alcatraz Island is located at a latitude of 37°N of the equator, so the optimal yearly tilt angle of a solar module located there is 28° off of the horizontal and facing directly south. Placing the solar modules in this position increases the yearly energy production by 9.3% compared to horizontal panels. It is preferable to arrange solar modules in line with the walls of the building because more modules can be fit onto the roof area available; however, neither of the buildings of consideration on Alcatraz Island are oriented directly north-south. The Cell House is oriented at 45° west of south and the New Industries Building is at 30° east of south. In these cases, the energy production penalties caused by orienting the tilted modules in line with each building are a 2.7% energy reduction for tilted panels aligned with the Cell House and a 3.6% energy reduction for the New Industries Building. The price of a high-efficiency 200 watt solar module is roughly $1080, bringing the cost of a 100 kW solar array to $540,000. Off-grid solar energy systems of this magnitude are not very common, so it has been difficult to locate manufacturers of power electronic components. The only company found that makes off-grid inverters of the required size is the Australian company SunEnergy. For a 100 kW solar installation, a 200 kW inverter is recommended. This allows room for expansion of the solar array, and it also allows the diesel generators to charge the batteries at close to their rated capacity of 210 kW. The cost of this inverter with the balance of the power electronics included is $105,000. A solar array is a combination of multiple, smaller sub-arrays. The limitations on the size of a sub-array are dependent on the open circuit voltage and short circuit current of both the modules and the inverter, while the full array

v
is limited by the number of inputs that the inverter can accommodate. The solar modules considered for this project cannot be arranged with more than eight modules in parallel and 12 modules in series to match the 200 kVA SunEnergy Inverter and eight modules in parallel and 18 modules in series to match the 400 kVA inverter, which means that the arrays have to be sized in increments of 96 and 144. This changed the solar arrays of consideration into 115 kW and 346 kW rated systems. The remaining costs associated with the system are the solar module racks, the power conductors and the battery bank. The costs of the racking system and power conductors are minimal compared to the other components. The price of the battery bank and its 10 year replacement is $541,400. The capital cost of a 115 kW rated system is between $1,475,900 and $1,485,300, and the cost of a 346 kW system ranges between $3,036,800 and $3,092,700. The alternative to having diesel generators as backup for the solar energy system is to reconnect to the San Francisco power grid. This was the original source of energy for Alcatraz Island, so it is a logical consideration for this project. A grid connection could either be used in combination with a solar energy system or as the single source of energy for the island. A grid connected solar energy system removes the need for a secondary energy generation method and the need for energy storage, because any excess energy produced by the solar energy system can simply be put into the power grid to be retrieved when needed. The only impediment of this solution is the undersea power cable, which will have to be replaced and reinstalled on the sea bed. Including the copper for the cable and the installation, this would cost around $2.5 million. An economic analysis is performed for the two differently sized solar energy systems in combination with the diesel generator and the grid connection. For the diesel hybrid energy system, the cost of the fuel needed to supply the remaining energy demand and the resulting cost of the emissions are incorporated into the yearly operating costs. The cost of replacing the power cable is included in the capital investment of grid connected solar energy system analysis. For the purpose of comparison, the costs of energy for a stand alone diesel generator system and unaccompanied grid energy are calculated. The capital cost, annual capital, annual operating and energy costs of each system are shown in Table 1 below. The price range shown for each combination solar energy system is the maximum and minimum price based on the tilt angle and orientation of the panels. The system lifetime is 20 years. The analysis assumes a diesel price of $3.00 per gallon (which was valid at the time of the cost analysis in autumn 2007).
vi
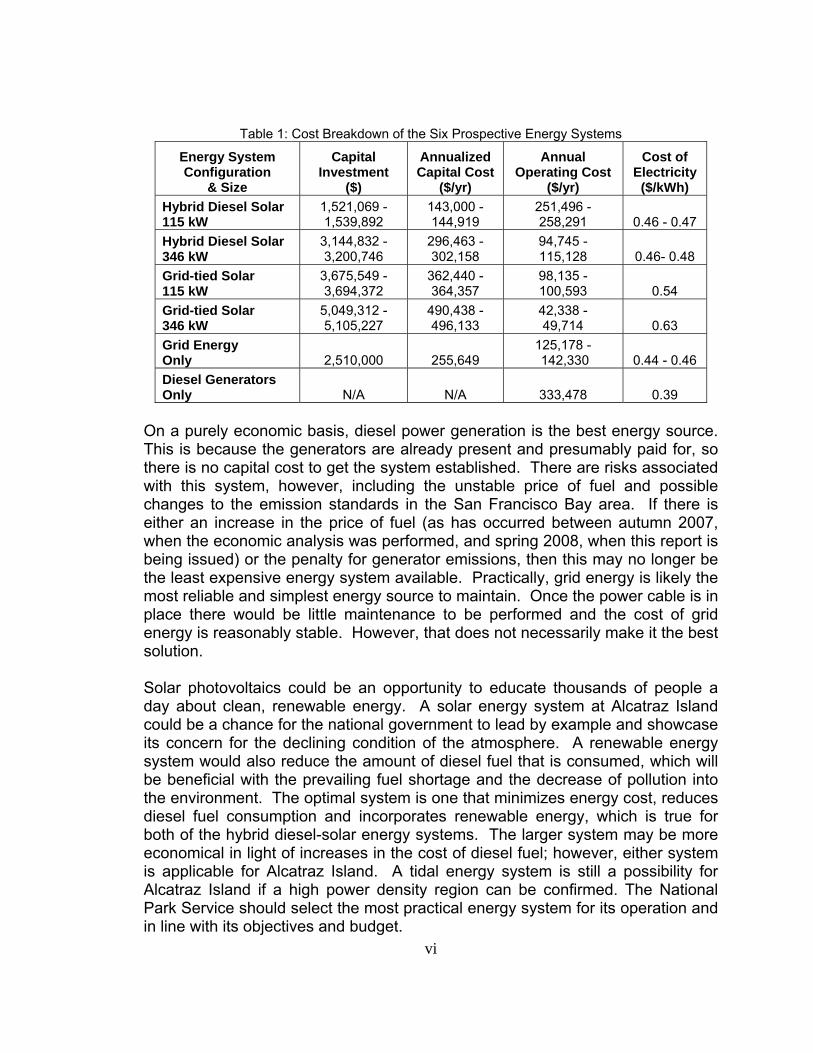
Table 1: Cost Breakdown of the Six Prospective Energy Systems
Energy System Configuration
& Size
Capital Investment
($)
Annualized Capital Cost
($/yr)
Annual Operating Cost
($/yr)
Cost of Electricity
($/kWh) Hybrid Diesel Solar 115 kW
1,521,069 - 1,539,892
143,000 - 144,919
251,496 - 258,291 0.46 - 0.47
Hybrid Diesel Solar 346 kW
3,144,832 - 3,200,746
296,463 - 302,158
94,745 - 115,128 0.46- 0.48
Grid-tied Solar 115 kW
3,675,549 - 3,694,372
362,440 - 364,357
98,135 - 100,593 0.54
Grid-tied Solar 346 kW
5,049,312 - 5,105,227
490,438 - 496,133
42,338 - 49,714 0.63
Grid Energy Only 2,510,000 255,649
125,178 - 142,330 0.44 - 0.46
Diesel Generators Only N/A N/A 333,478 0.39
On a purely economic basis, diesel power generation is the best energy source. This is because the generators are already present and presumably paid for, so there is no capital cost to get the system established. There are risks associated with this system, however, including the unstable price of fuel and possible changes to the emission standards in the San Francisco Bay area. If there is either an increase in the price of fuel (as has occurred between autumn 2007, when the economic analysis was performed, and spring 2008, when this report is being issued) or the penalty for generator emissions, then this may no longer be the least expensive energy system available. Practically, grid energy is likely the most reliable and simplest energy source to maintain. Once the power cable is in place there would be little maintenance to be performed and the cost of grid energy is reasonably stable. However, that does not necessarily make it the best solution. Solar photovoltaics could be an opportunity to educate thousands of people a day about clean, renewable energy. A solar energy system at Alcatraz Island could be a chance for the national government to lead by example and showcase its concern for the declining condition of the atmosphere. A renewable energy system would also reduce the amount of diesel fuel that is consumed, which will be beneficial with the prevailing fuel shortage and the decrease of pollution into the environment. The optimal system is one that minimizes energy cost, reduces diesel fuel consumption and incorporates renewable energy, which is true for both of the hybrid diesel-solar energy systems. The larger system may be more economical in light of increases in the cost of diesel fuel; however, either system is applicable for Alcatraz Island. A tidal energy system is still a possibility for Alcatraz Island if a high power density region can be confirmed. The National Park Service should select the most practical energy system for its operation and in line with its objectives and budget.

vii
TABLE OF CONTENTS
EXECUTIVE SUMMARY.......................................................................................ii LIST OF FIGURES...............................................................................................ix LIST OF TABLES ................................................................................................xi ACKNOWLEDGEMENTS ...................................................................................xii INTRODUCTION .................................................................................................. 1 1 Alcatraz Island Overview............................................................................... 4
1.1 History .................................................................................................... 4 1.2 Description ............................................................................................. 6
2 Project Objectives ......................................................................................... 9 3 Alcatraz Island Energy Consumption .......................................................... 11
3.1 Existing Energy Generation Method..................................................... 11 3.2 Energy Production by Diesel Generators at Alcatraz Island................. 12 3.3 Energy Load Profile.............................................................................. 15
4 Energy Audit................................................................................................ 17 4.1 Energy Consumption Distribution......................................................... 17 4.2 Energy Conservation Methods and Savings ........................................ 20
5 Solar Energy Assessment ........................................................................... 22 5.1 Solar Resource .................................................................................... 22 5.2 Solar Module Manufacturers ................................................................ 25 5.3 Solar Module Tilt Angles ...................................................................... 27 5.4 Solar Power Availability........................................................................ 32
6 Wind Energy Assessment ........................................................................... 43 6.1 Wind Resource..................................................................................... 43 6.2 Wind Turbine Manufacturers ................................................................ 48 6.3 Wind Turbine Orientation and Type...................................................... 53 6.4 Wind Power Availability ........................................................................ 55
7 Tidal Energy Assessment............................................................................ 59 7.1 Tidal Resource ..................................................................................... 59 7.2 Tidal Turbine Manufacturers ................................................................ 61 7.3 Potential Tidal Turbine Location........................................................... 63 7.4 Tidal Power Availability ........................................................................ 64
8 Reconnect to the San Francisco Power Grid............................................... 66 9 Energy Storage ........................................................................................... 68
9.1 Battery Storage .................................................................................... 69 9.2 Pumped Storage .................................................................................. 70
10 Solar Energy System Design ................................................................... 76 10.1 Solar Energy Justification..................................................................... 76 10.2 Solar System Components................................................................... 77
10.2.1 Solar Modules ............................................................................... 77 10.2.2 Battery Bank ................................................................................. 78 10.2.3 Inverter.......................................................................................... 80

viii
10.2.4 Charge Controller.......................................................................... 82 10.2.5 Power Conductors......................................................................... 82 10.2.6 Solar Module Support ................................................................... 83
10.3 Solar Array Design ............................................................................... 84 10.4 Solar Energy Availability for New Industries Building ........................... 87 10.5 Solar Energy Availability for Cell House ............................................... 88
11 Economic Analysis................................................................................... 90 11.1 Solar Energy System............................................................................ 91
11.1.1 Hybrid Diesel-Solar Power System ............................................... 91 11.1.2 Grid-Tied Solar System................................................................. 96
11.2 San Francisco Grid Power ................................................................... 99 11.3 Stand Alone Diesel Generator............................................................ 100
12 Electrical Considerations, Details, and Wiring Diagrams ....................... 101 12.1 Overview ............................................................................................ 101 12.2 Solar PV Modules............................................................................... 101 12.3 Inverter ............................................................................................... 103 12.4 Battery Bank....................................................................................... 108 12.5 The NEC ............................................................................................ 110
12.5.1 Cables and Over-current Device Sizing ...................................... 110 12.5.2 Battery Bank Wiring Considerations............................................ 116 12.5.3 DC Grounding ............................................................................. 116 12.5.4 Generators .................................................................................. 119 12.5.5 Voltage Drop Considerations ...................................................... 119
12.6 346 kW PV hybrid System.................................................................. 123 13 Conclusions and Recommendations ..................................................... 124 END NOTES..................................................................................................... 128 REFERENCES ................................................................................................. 106 Appendix A: Energy Consumption Calculations ......................................... 114 Appendix B: Summer Energy Demand ......................................................... 116 Appendix C: Solar Energy Availability Analysis.......................................... 123 Appendix D: Wind Energy Availability Analysis ......................................... 129 Appendix F: Pumped Storage Capacity Analysis........................................ 132 Appendix G: Economic Analysis – Annuity Method .................................. 134 Appendix H: Wiring Diagrams for the 346 kW Solar array ......................... 137

ix
LIST OF FIGURES
Figure Number Page Figure 1: Map of San Francisco Bay Including Location of Alcatraz Island. .......... 1 Figure 2: Aerial View of Alcatraz Island........................................................................ 5 Figure 3: Building Layout on Alcatraz Island. .............................................................. 7 Figure 4: Daily Diesel Fuel Consumption for February 27 to March 26, 2007 ..... 13 Figure 5: Monthly Solar Radiation Measured at Alcatraz Island in 1995-1996 .... 23 Figure 6: Monthly Solar Radiation Measured at SFO in 1995-1996 ...................... 24 Figure 7: Diagram of the Solar Angles: θz, θ, β and γ............................................... 28 Figure 8: Required Space Between 28° Tilted Panels in Summer, Winter, Spring and Fall ............................................................................................................................ 30 Figure 9: Solar modules aligned with the Cell House long wall.............................. 31 Figure 10: Solar modules oriented true south on the Cell House .......................... 31 Figure 11: Average Hourly Solar Radiation for SFO in July.................................... 34 Figure 12: Average Monthly Solar Radiation at SFO ............................................... 35 Figure 13: Monthly Solar Energy for a 100 kW Rated Horizontal Panel Solar System ............................................................................................................................. 36 Figure 14: Monthly Solar Energy for a 100 kW Rated Solar System Tilted at 28°........................................................................................................................................... 37 Figure 15: Monthly Solar Energy for a 100 kW Rated Solar System Tilted at 28° Oriented At 30° East of True South............................................................................. 38 Figure 16: Monthly Solar Energy for a 100 kW Rated Solar System Titled at 28° Oriented at 45° West of True South ............................................................................ 39 Figure 17: Comparison Between Flat and Tilted Panels at Different Orientations........................................................................................................................................... 40 Figure 18: Monthly Solar Energy for a 330 kW Rated Horizontal Panel Solar System ............................................................................................................................. 41 Figure 19: Monthly Solar Energy for a 330 kW Rated South Facing Solar System Tilted at 28° ..................................................................................................................... 42 Figure 20: Examples of the Boundary Layer of Wind over Different Terrain........ 43 Figure 21: Average Daily Wind Speed at Alcatraz Island........................................ 44 Figure 22: Alcatraz Island Wind Speed Distribution ................................................. 45 Figure 23: TMY2 Average Daily Wind Speed at San Francisco Airport................ 47 Figure 24: SFO Average Wind Speed Distribution from 1995-2005 ...................... 47 Figure 25: Swift Rooftop Wind Turbines .................................................................... 48 Figure 26: ARE 110 Wind Turbine .............................................................................. 49 Figure 27: Bergey Windpower Turbines (left: 1 kW, right: 7.5 kW) ....................... 50 Figure 28: Windside WS-C4 Turbine .......................................................................... 51 Figure 29: PacWind Turbines (left to right: SeaHawk, Delta I, Delta II) ................ 52 Figure 30: Drag and Lift Wind Turbines...................................................................... 54 Figure 31: Horizontal Axis Turbine Array Located on the Cell House Roof.......... 55

x
Figure 32: Small Vertical Axis Turbine Array Located on the Cell House Roof ... 56 Figure 33: Large Vertical Axis Turbine Array on the Cell House Roof .................. 57 Figure 34: Monthly Wind Energy Production for a 51 Turbine Installation............ 58 Figure 35: Bathymetry for west end of San Francisco Bay with NOAA stations noted. ............................................................................................................................... 60 Figure 36: TRIM Model Prediction for Ebb Tide on January 20, 2008 .................. 61 Figure 37: Verdant Power Free Flow Turbines ......................................................... 62 Figure 38: Vertical Axis Gorlov Helical Turbine......................................................... 63 Figure 39: Bathymetry of San Francisco Bay around Alcatraz Island. .................. 64 Figure 40: Water Tower on Alcatraz Island................................................................ 71 Figure 41: Diagram of the Components and Connections of a PV System.......... 80 Figure 42: Current versus Voltage Curve for a 200 W Sanyo Solar Module ........ 86 Figure 43: A CAD depiction of Alcatraz Island from the North. ............................ 102 Figure 44: Generalized diagram of renewable/genset interaction for varying electric load. .................................................................................................................. 104 Figure 45: A model representation of a typical 5 day charging/discharging schedule for Alcatraz. .................................................................................................. 106 Figure 46: Battery Bank SOC corresponding to the charging/discharging cycle in Figure 45........................................................................................................................ 106 Figure 47: Sub-array for the 115 kW system........................................................... 115 Figure 48: Battery bank wiring for the 115 kW array. ............................................. 118 Figure 49: DC to AC wiring diagram for the 115 kW system. ............................... 121 Figure 50: Inverter to Generator Wiring Diagram for the 115 kW system........... 122 Figure 51: Main Generator Bus Diagram for the 115 kW system. ....................... 123 Figure 52: Sub-array for the 346 kW system........................................................... 138 Figure 53: Battery bank wiring for the 346 kW array. ............................................. 140 Figure 54: DC to AC wiring diagram for the 346 kW system. ............................... 141 Figure 55: Inverter to Generator Wiring Diagram for the 346 kW system........... 142 Figure 56: Main Generator Bus Diagram for the 346 kW system. ....................... 143

xi
LIST OF TABLES
Table Number Page Table 1: Cost Breakdown of the Six Prospective Energy Systems......................... vi Table 2: Caterpillar 3306B Engine Performance. ..................................................... 14 Table 3: Alcatraz Island Energy Demand and Daily Load....................................... 19 Table 4: ARE Systems and Costs ............................................................................... 50 Table 5: Bergey Systems and Cost Breakdown........................................................ 51 Table 6: PacWind Systems Cost Breakdown ............................................................ 52 Table 7: Solar System Location, Size and Layout................................................... 85 Table 8: Solar Array Size and Corresponding Power Rating.................................. 87 Table 9: Solar System Power Output for New Industries Building ......................... 88 Table 10: Solar System Output for Cell House Building .......................................... 89 Table 11: Diesel Emissions and Costs ....................................................................... 92 Table 12: Economic Analysis for a 115 kW rated Hybrid System .......................... 93 Table 13: Economic Analysis for a 346 kW rated Hybrid System .......................... 95 Table 14: Economic Analysis for a 115 kW Grid-Tied Solar System..................... 97 Table 15: Economic Analysis for a 346 kW Grid-Tied Solar Energy System ....... 98 Table 16: Economic Analysis for Stand Alone Grid-Tied Energy System ............ 99 Table 17: Economic Analysis for Stand Alone Diesel Generator Energy System......................................................................................................................................... 100 Table 18: Design Specs for the Sanyo HIP-200BA3 Module. .............................. 101 Table 19: Cost Breakdown of the Six Prospective Energy Systems ................... 126

ACKNOWLEDGEMENTS
The authors would like to extend their sincere gratitude to everyone who aided in the successful completion of this study and report. Foremost, thanks to the University National Park Energy Partnership Program (UNPEPP), the National Park Service (NPS) and the Bonneville Power Administration (BPA), whose financial support made this study possible, and to the Pacific Northwest Cooperative Ecosystems Studies Unit (PNW CESU). A special thanks to Steve Butterworth and Laura Castellini with the National Park Service, who provided invaluable knowledge and insight during the study. Dr. Andy Walker of National Renewable Energy Laboratory (NREL) has been extremely accommodating, providing information and data that have been critical to the project. The helpfulness and cooperation of Patrick McAllister at the Golden Gate National Conservancy and of Ricardo Perez with the National Park Service are greatly appreciated. Special thanks to Scott Gates at Idaho Power, whose knowledge and experience with similar hybrid diesel solar energy systems has been invaluable, to Brian Polagye, who provided his time and knowledge for the assessment of the tidal resource, and to Jessica Theilmann, who provided the information on corrosion and its control for the pumped storage system. Finally, thanks are extended to Professors Teodora Shuman and John Kramlich for serving and providing guidance on Ms. Hamann’s Masters of Science Committee.
xii

1INTRODUCTION
Alcatraz Island, commonly referred to as “The Rock,” is a relatively small, natural
island located in the San Francisco Bay just three kilometers north of San
Francisco and east of the Golden Gate Bridge. Its location is indicated in Figure
1 below. Over the last two hundred years this island has maintained a
lighthouse, been employed as a military fortress, a military prison, a federal
prison, been the scene of a Native American occupation and is currently a part of
the Golden Gate National Recreation Area.
Figure 1: Map of San Francisco Bay Including Location of Alcatraz Island.1
As part of a national recreation area, Alcatraz Island hosts over one million
visitors each year. People come to the island to experience the historical
atmosphere of the former federal prison and revel in the natural beauty of the
area. While at the park, visitors can view a film about the history of the island,

2take an audio tour of the Cell House, purchase memorabilia from the variety of
shops or walk around the grounds and enjoy the wildlife and plants that inhabit
the island. It is also possible to rent some of the facilities for private functions.
Between the National Park Service and the concessionaire, who manage the
shops and tours, there are 120 employees on the island each day who maintain
the facilities and the tourism.
Between the employees and thousands of visitors, a considerable amount of
energy is consumed on the island each day, with tourism only increasing each
year. As Alcatraz Island has not been connected to the San Francisco power
grid since 1970, all of the energy is produced with diesel generators. Originally,
80 kW generators were employed but were upgraded to 210 kW units after 2002
to keep up with the increase in energy demand. Diesel fuel, to be used in the
generators, is transported to the island twice a week for a total of 63,875 gallons
per year at a cost of $176,000 in fuel alone. This does not account for the cost of
delivery of the fuel to the island or the maintenance on the generators, nor does it
consider the detriment to the air caused by burning diesel fuel in the
transportation boats and in the generators.
With growing concern about greenhouse gas emissions, it is likely that the
emissions standards in the San Francisco Bay area will become more stringent
in the upcoming years; however, as tourism on the island increases, it can only
be assumed that power consumption is going to increase. These two factors
express the need to find a cleaner, more efficient energy solution for Alcatraz
Island. The University of Washington was requested to conduct a renewable
energy study and energy audit of Alcatraz Island. The purpose of this study is to
identify techniques to reduce energy consumption and find an alternative to
diesel generators for powering the island. Although it may not be possible to
replace diesel generators entirely, the amount of energy they produce can be

3offset with clean, renewable energy. The park could also be reconnected to the
San Francisco power grid, but at significant expense.
This report explores the renewable energy opportunities available in San
Francisco Bay and identifies possible solutions. Also included is a conceptual
design of the solar photovoltaic energy system and economic analysis to
accompany the energy solutions.

4
1 Alcatraz Island Overview
1.1 History
For such a small body of land, Alcatraz Island has a unique and complicated
history which has helped shape the history of the United Staes. The island was
named “isla de los Alcatraces” by the first Spanish Explorers for the many
pelicans that inhabit its shores and was later shortened to Alcatraz. The premier
use of the island was as a station for a navigational lighthouse used to
accommodate the large influx of people coming to California as a result of the
discovery of gold in the 1840’s. 2 Due to its strategic location in the San
Francisco Bay, Alcatraz was soon realized as a military defensive position and
an army fortress was constructed in the early 1850’s to defend San Francisco
from possible attacks.3
Alcatraz Island became a useful instrument during the Civil War while California
was populated with those sympathetic to both causes. Although the island was
never attacked, it was used to imprison Confederate supporters and soon
removed any ambition of the Confederates of taking California for their side.
After the end of the Civil War, Alcatraz Island lost its usefulness as a military fort
and became principally a military prison for those charged with treason, mutiny
and high crimes. The island remained under control of the United States military
until 1934 when it was transferred to the Bureau of Prisons to be used as a High
Security Federal Prison. In the meantime, the original fortress was leveled to the
first floor and a full size cell house was constructed on top using prisoner labor.
This building was the largest reinforced concrete building to date including 600
cells, each with plumbing and electricity that was transferred from the mainland
by an underwater cable sitting on the sea bed.

5As a Federal Prison, Alcatraz Island housed some of this country’s most
notorious criminals and is responsible for several legends regarding the many
escapes attempted over the years. It was also during this era that many of the
buildings that are present today were constructed and can be seen in Figure 2.
The barracks, which had originally been used by the military, were converted into
housing for the prison guards and their families as well as the addition of four
houses, a duplex and three apartments. The Model Industries Building that had
been used by military prisoners for vocational trades was insufficient at
restraining the federal prisoners and was replaced by the New Industries Building
in the early 1940’s.4 The main cell block also had to be remodeled in order to
accommodate its new tenants. The cells were reduced in number from 600 to
336 and reinforced with “tool-proof” steel bars, while gun galleries were installed
on either side of the cells. Although the innovative security measures along with
the swift tide and cold water were supposed to render the island inescapable,
there were still 5 escapees whose bodies remain unaccounted.
Figure 2: Aerial View of Alcatraz Island.5

6Alcatraz Island was employed as a Federal Prison from 1934 until 1963 when it
was shut down due to its declining condition and increased cost of operation.
From the time the ferry left with the last prisoner, the island remained vacant until
1969 when it became the scene of a large Native American occupation that
lasted 19 months. The island still contains evidence of their occupation,
including red paint that declares “Indians Welcome” at the dock and the burnt
remnants of three buildings. It was during this period that the under-sea cable
that supplied power to the island was severed. The occupation eventually ended
in 1971 and the island was given to the NPS in 1972 to become part of the
Golden Gate National Recreation Area. Today, Alcatraz Island is a very popular
tourist destination for people from all over the world, drawing thousands of
visitors each day.
1.2 Description
There are seven original buildings that remain intact on the island. These are the
Cell House, Barracks, Sally Port, Storehouse, Power Plant, Model Industries
Building and the New Industries Building. Each building and its relative
orientation can be seen in Figure 3 below. In the figure, the New Industries
Building is simply labeled as the Industries Building.

7
Figure 3: Building Layout on Alcatraz Island.6
When the ferry arrives at Alcatraz Island, all of the passengers gather at the dock
area where they receive a short orientation and are then sent to explore the
island. The first stop is the theatre in the Barracks building where people can
view a short film about the history of the island or purchase memorabilia in the
gift shop. There are three display rooms, well lit by track lighting, filled with relics
from the prison era of the island. The Barracks building is also the residence of
several offices used by both the NPS and the Golden Gate National Park
Conservancy (GGNPC), which is responsible for all of the commerce on the
island. From here, people make the ascent up to the Cell House.
Although the Cell House is no longer used to house criminals, it accommodates
thousands of people each day. The main cell block is illuminated by a
combination of several hundred compact fluorescent light (CFL) bulbs and
incandescent light bulbs. Visitors are granted access to the main cell block as

8well as the dining area, prison guard offices and exercise yard, all while
listening to an audio tour guide provided at the “prisoner check-in” area on the
first floor. When done viewing the Cell House, tourists can shop at the newly
installed bookstore located on the first floor below the dining area. In contrast to
the main cell block, the bookstore is very modern and includes hundreds of
halogen track lights, flat screen televisions and cash registers. Very few visitors
are granted access to the chapel and storage rooms, located above the guard
offices, or to the original first floor of the “citadel” located below the cell block,
otherwise known as the dungeon for extremely disobedient inmates. The Cell
House contains additional offices for the NPS and GGNPC.
The remaining buildings on the island are used by the NPS for the operation of
the park, or not at all. The Sally Port, next door to the Barracks, is used by the
NPS as a workshop for performing any necessary repairs or maintenance. The
Power House, located at the north end of the island, contains the generators that
power it and is off-limits to tourists. As implied by its name, the Store House is
used to store equipment for the NPS and sits next to the Power House. Due to
its deteriorated condition, the Model Industries Building residing at the north-west
tip of the island is not used anymore. The New Industries Building is becoming
popular as a venue and can be rented out for conferences or events. As this use
increases, the NPS will install a heat exchanger on the generators and supply
heat to this building. The remaining structures on the island include the burnt
remnants of the Warden’s House and Officer’s Club, the non-functional Water
Tower and the functional Lighthouse.

9
2 Project Objectives
The purpose of this project is to analyze the current energy usage and production
methods at Alcatraz Island National Park, assess the renewable energy
opportunities located in San Francisco Bay, and determine the most efficient and
economical renewable system possible. Renewable energy systems produce
power from natural resources, such as sunlight, wind, hydro, geothermal or
biomass. With the limited supply of fossil fuels and global climate changes
occurring due to greenhouse gas emissions, it is becoming important to find
clean, alternative methods of energy generation. A hybrid system uses part
renewable and part non-renewable energy to provide power to a site. The first
step is to determine how much energy is being used, and when and where it is
being used on Alcatraz Island. Based on the current energy generation methods
and fuel consumption, the daily energy load at the park is determined. An energy
audit of the island is then conducted, and all of the main energy users are
identified. The purpose of this is to verify the energy load at the park and
determine the load profile, specifically, the high and low loads through the day.
Next, energy conservation solutions are recommended.
The second aspect of the project is to determine the best renewable energy
resource available to the island and design a corresponding renewable energy
system. Three renewable energy resources are identified in the San Francisco
Bay area: solar, wind and tidal. Information is then gathered for each of these to
determine how much energy can be harnessed from each. A resource has to be
present in order to induce the renewable system to generate power; however,
natural resources such as sunlight and wind are not available all of the time nor
are they predictable. This makes it necessary to obtain data that indicate how
often a resource is available in order to determine how much energy can be
produced by it throughout the year. A renewable energy system does not just

10consist of a solar module or a turbine by itself, but also requires an energy
storage system to accompany it, unless the site is connected to a power grid
where any excess energy produced can be displaced until it is needed. This
means that energy storage solutions have to be considered for the installation of
a renewable energy system at Alcatraz Island.
Once the renewable energy system and accompanying energy storage system
are determined, an economic analysis has to be conducted. A comparison is
made between two different sized renewable systems having either generator
backup and energy storage or a grid connection. The possibility of reconnecting
to the San Francisco power grid and purchasing all of the energy is also
considered. This is necessary for determining the overall cost of energy for the
system and for assisting the NPS in deciding if renewable energy is cost
competitive with respect to reestablishing the grid power.

11
3 Alcatraz Island Energy Consumption
3.1 Existing Energy Generation Method
The current method of producing electricity at Alcatraz Island is with either of two
Caterpillar 210 kW diesel generators. The generators are run for intervals of one
month and are then switched to provide routine maintenance on the inactive
generator. Thus, effectively, Alcatraz Island runs on one 210 diesel generator.
The diesel fuel is delivered to the island at the dock and transported through a
pipe to a 3000 gallon storage tank located next to the Power House at the north
end of the island. Although this was not the original method of powering the
island, generators have been used since the Native American Occupation of
Alcatraz Island when the under-sea cable was severed and attempts to repair the
cable were unsuccessful. From the park opening until around 2002, Alcatraz
Island used two 80 kW generators, but had to upgrade with the increased energy
demand. The 80 kW generators are still functional and available for use as
backup on the island.7
Although generators are reliable and relatively efficient at producing electricity,
they have several disadvantages. Diesel generators tend to produce a lot of
noise, detracting from the ambiance of the island and disturbing the wildlife that
inhabits it. A second issue is the transportation of fuel to the island twice a week
with the possibility of fuel spill into the bay. Diesel fuel cannot be transported to
Alcatraz Island on the same boat as passengers, so a separate vessel has to be
sent to the island specifically for this purpose, consuming ten gallons of fuel per
trip.8 The greatest problem, however, is the high emissions associated with
diesel generators. The exhaust emissions from the generators are considered a
point source of pollution that may be subject to more stringent regulations by the
Bay Area Air Quality Management District as the agency tries to reduce the

12carbon footprint in the bay. For every 1000 gallons of diesel fuel burned, there
are 11.2 tons of carbon dioxide (CO2), 575 lbs of nitric oxide and nitrogen dioxide
(NOx), 28.5 lbs of sulfur dioxide (SO2) and smaller quantities of other harmful
substances emitted into the atmosphere.9 Each pollutant has a cost associated
with it, helping justify the installation of renewable, non-polluting energy systems.
In addition to installing a renewable energy system to offset the use of the diesel
generators, the NPS plans to reduce emissions on the island by replacing diesel
fuel in the generators with biodiesel. Their intention is to start with B20 (20%
biodiesel with 80% diesel) and, if successful, consider moving up to B100 (100%
biodiesel). Aside from being carbon neutral, studies have indicated that biodiesel
produces significantly less carbon monoxide (CO), hydrocarbons (HC) and
particulate matter than petroleum diesel, however, the NOx production can
increase. Although the University of Washington is not responsible for this
aspect of the project, it explored the possibility of using biodiesel and biodiesel
blends in the generators at Alcatraz Island. It investigated the measures that will
need to be taken to ensure that the generators can support biodiesel and
examined particulate filters for reducing engine emissions. Additional study
regarding the condition of the Alcatraz fuel storage tank and piping will need to
be conducted before the system can contain biodiesel. An account of the UW
investigation can be found in the UW UNPEPP quarterly report for July, 2007.10
3.2 Energy Production by Diesel Generators at Alcatraz Island
Before a renewable energy system can be designed for a location, it is necessary
to assess how much energy is being consumed on a daily basis. Since Alcatraz
Island is powered by a diesel generator, the island energy consumption is the
same as the generator production. There is no meter or record of how much
electricity the generators at Alcatraz Island produce hour by hour; however, they

13do maintain a log book that records the amount of diesel fuel in the tank each
day, when fuel is delivered and how much. While visiting the Island in March of
2007, Steve Butterworth took photographs of the diesel log book for that month.11
The records indicated that 600 gallons are delivered to Alcatraz Island twice a
week, making a total of 1200 gallons each week. The daily fuel consumption for
the period of February 27 to March 26 can be seen in Figure 4 below. This
information is used to calculate the amount of electricity produced each day
based on the efficiency of the diesel generators and the lower heating value of
diesel fuel.
0
50
100
150
200
250
2/27/2
007
3/1/200
7
3/3/200
7
3/5/200
7
3/7/200
7
3/9/200
7
3/11/2
007
3/13/2
007
3/15/2
007
3/17/2
007
3/19/2
007
3/21/2
007
3/23/2
007
3/25/2
007
Dies
el F
uel C
onsu
med
(gal
lons
)
Figure 4: Daily Diesel Fuel Consumption for February 27 to March 26, 2007
The generators being used to power Alcatraz Island are two Caterpillar 3306B
engines that are alternated monthly. These generators are rated at 210 kW,
which is their maximum power output. Generators tend to produce energy more
efficiently as they operate closer to their rated power. The specification sheet for
the Caterpillar 3306B is used to compute the power output of the generators from
the energy available from diesel fuel. The efficiency of the generator at quarter-
interval loads are calculated and shown in Table 2.12 The calculated efficiency

14only applies under specific conditions, with the actual power output or fuel
consumption varying up to 3% based on temperature and humidity.
Table 2: Caterpillar 3306B Engine Performance.13
Engine Load
Brake Power (kW)
Diesel Consumed
(gph)
Energy from Diesel Fuel
(kWh/hr) Generator Efficiency
100% 205 14.3 523.66 39.1% 75% 153 10.8 395.49 38.7% 50% 103 7.3 267.32 38.5% 25% 53 4.2 153.80 34.5%
The rated efficiency of the generator ranges between 34.5% and 39.1%,
depending on the load. Although there is slight variation from day to day, the
average fuel consumption on the island is 175 gallons per day or 7.3 gallons per
hour. This fuel consumption rate corresponds to a 50% load on the generator
and 38.4% generator efficiency.14 This assumes a constant daily load, which is
clearly not the case when the island is occupied for 12 hours and vacant for the
remaining 12 hours. It is determined that the generators operate at around 75%
capacity during the daytime and 25% during the evening, which corresponds to
respective efficiencies of 38.7% and 34.5%. Other sources of power loss are to
heat, caused by friction in the gear box and resistance in the transmission lines,
and by the generator operating under non-ideal conditions.15 As a result of these
factors, a conservative efficiency of 34.5% is used for the analysis. Once the
generator efficiency is known, it is possible to convert fuel consumption into
power using the lower heating value and density of diesel fuel (see Appendix A
for calculation). The average power load at Alcatraz Island is 98 kW, and the
daily electrical energy consumption is 2350 kWh. In order to verify this energy
consumption calculation, an inventory of all of the power drawing items on the
island, including their wattage and hours of use per day, is compiled and
summed. The results of the energy audit compare favorably with the values
obtained using diesel consumption and are discussed in Section 4.

15The marine rate for diesel fuel in March of 2007 was $2.72 per gallon, not
including the cost of delivery to the island or the $0.5 million retrofit to the vessel
that transports the diesel.16 This corresponds to a yearly cost of $176,000 for
diesel fuel alone, or $0.21 per kWh electrical energy for fuel. This energy rate
does not account for the cost of operating and monitoring the diesel generators,
in order to ensure that they are functioning properly, or for the routine
maintenance that is performed monthly. Also excluded is the cost of the pollution
on the environment in the form of CO2, SO2 and NOx, caused by burning diesel
fuel. A detailed economic analysis, including each of these factors, is performed
in Chapter 11.
3.3 Energy Load Profile
It is not only important to know the average daily power draws of a system but
the corresponding daily and yearly peaks and dips in the load. Alcatraz Island is
open every day of the week for visitors, so there is not a decrease in energy
consumption from the weekdays to weekends. The hours of operation for the
National Park Service are from 9:00 am to 9:00 pm every day, year round.17 The
Golden Gate National Park Conservancy (GGNPC), who manage the bookstore
and gift shops, work from 8:45 am to 9:30 pm on the weekdays and 8:45 am to
6:45 pm on the weekends during the summer and for two fewer hours each day
during the winter schedule.18 This means that the island is operational for 50% of
the day during the summer and 40% of the day during the winter.
There is a slight increase in energy consumption during the winter, even though
the park is open for fewer hours, which is likely due to the increased use of
electric wall and space heaters. This difference is minimal, however, compared
to the significant difference between the daytime and evening energy loads
observed on the island. By knowing the hours of operation of the island and

16which and when equipment is used, it is possible to distinguish the daytime
from the evening load. Roughly 79% of the total daily energy consumption
occurs during business hours, leaving 21% remaining for the evening and night.
This corresponds to a daytime load of 153.8 kW and a 41.4 kW nighttime load.
The 41.4 kW nighttime load has some serious implications, as it is less than 25%
of the generator’s rated power and would be even smaller if unnecessary lights
didn’t remain lit in the Cell House to maintain this load. A generator operated at
too low of a load loses efficiency, as seen in Table 2, and degrades faster.
However, keeping an artificial load on the generator wastes fuel and generator
run time. This report explores possible solutions to this problem.

17
4 Energy Audit
4.1 Energy Consumption Distribution
The easiest way to become more energy and environmentally friendly is to make
reductions on the demand side, rather than improve the supply side. As
mentioned in Section 3, an inventory of all of the appliances and equipment on
the island is compiled, including wattage and hours of daily use. This is done in
order to confirm the daily energy load on the island and discover where all of the
energy is going. This also helps identify the main power users in order to
determine where changes should be made. The inventory is compiled using
several sources. A trip to Alcatraz Island in July, 2007 provided a first hand view
of the operation and insight into what kind of and how much equipment is being
used in the offices and tourist areas. Since there are two independent outfits
working out of Alcatraz Island, the NPS and the GGNPC, each had to be
contacted to obtain information regarding their work schedule and all of their
office equipment. Including employees from both groups, there are 120 people
working on the island each day. Supplementary information was taken from an
energy efficiency study conducted in 1996 by the Lawrence Berkeley National
Laboratory 19 and an inventory conducted recently by the NPS. 20 Diesel
consumption is only known for the month of March, and there could be variances
depending on the season that this number does not reflect; however, it should
provide an average yearly consumption. The energy audit performed does
consider the different work schedule observed during the winter versus the
summer as well as the use of any electric heaters to warm the offices during the
colder months.
A complete inventory of equipment, wattage, location and hours of use can be
seen in Appendix B, with a summary of the results listed in Table 3. The daily

18energy consumption calculated from the energy audit of 2361 kWh in the
summer months matches very well with 2350 kWh per day, calculated using
diesel consumption. There is an observed increase of 7.8% energy consumption
during the winter months, bringing the daily consumption to 2546 kWh. The
greatest energy consumers on the island, using 27.7% of the daily energy load,
are the incandescent light bulbs, located in the various offices and illuminating
the Cell House walls, ceilings and cells themselves. The halogen flood lights
located in the bookstore and two gift shops are the second largest consumer,
using 17.9% of the total daily load on the island. Although the park is open for
fewer hours during the winter season, the increased use of electric heaters more
than makes up for the decreased use of lighting and equipment, consuming
11.1% of the daily load. In descending order, the next greatest power consumers
are the water heater, compressor, fluorescent lights and hand dryers in the
bathrooms.

19Table 3: Alcatraz Island Energy Demand and Daily Load.21
Appliance/Equipment Quantity
Summer Daily Consumption
(kWh/day)
Winter Daily Consumption
(kWh/day) Air Curtain 1 14.4 14.4Beverage Cooler 1 6 6Cash Register 6 10.8 8.64CFL Bulb 113 40.54 40.4Change/Bill Counter 3 0.96 0.6Coffee Maker/Urn 5 42 36Compressor 4 103.68 103.68Computer 21 43.2 43.2Copy Machine 1 3 3Electric Car/Tram 5 60 60Electric Heater 16 0 282Electric saw 1 Negligible Negligible Elevator 2 36 36Exit Sign 10 12.48 12.48F32T8 Light Fixture 80 76.54 40.32F40T12 Light Fixture 43 41.77 36.85Fax Machine 1 2.88 2.88Freezer 2 28.8 28.8Halogen Flood Lamp 597 424.46 413.81Hand Dryer 6 72 72HID 13 55.8 55.8Incandescent Bulb 518 654.96 651.58Light House Lamp 1 36 36Light House Motor 1 60 60Microwave 6 18 18Monitor 21 37.8 34.56MP3 Charger 1 48 48PA System 1 0.53 0.528Printer 15 27 23.4Projection System 4 96 76.8Refrigerator 5 70.8 70.8Speakers 16 3.84 3.07Sump Pump 4 38.4 38.4Telephone 12 7.2 7.2Television 10 19.86 16.14Toaster/Toaster Oven 6 15.6 15.6VCR 2 0.552 0.552Visitor Computer 2 3.6 2.88Water Cooler/Heater 1 6 4.8Water Heater 4 122.4 122.4Water Pump 2 19.2 19.2Welder 1 Negligible NegligibleDaily Total 2361.048 2546.774

204.2 Energy Conservation Methods and Savings
There are many ways to decrease one’s energy footprint, ranging from simple
actions like turning off lights to installing an energy management system that can
shut off the light and heat to a room when no one is inside and shut down
equipment when it is not being used. It is wasteful to throw out and replace all of
one’s appliances with more energy efficient products, but there are ways to
decrease energy consumption and eventually phase out antiquated equipment.
For example, as incandescent light bulbs burn out, replace them with high
efficiency compact fluorescent light (CFL) bulbs or install heat detecting wall
switches that recognize when a room is occupied and adjust the light
accordingly. Also, a lot of computer equipment and appliances still draw power
when they are turned off, so it is wise to unplug such equipment or turn off the
power to that outlet if it is not going to be used for an extended period of time.
One point of dispute is whether it is better to turn a computer off over long
periods of no use. Most modern computers have the option to sleep or
hibernate, which essentially shuts them down and reduces their power draw to 8-
15 W. This is a reasonable option if a computer is not going to be used for a
couple hours; otherwise, it is preferable to turn a computer off overnight or for
eight or more hours of inactivity. By no means should a computer sit idle for an
extended period of time with a screen saver running, and the monitor should at
least be turned off if not in use.22
One of the most wasteful practices at Alcatraz Island is in keeping all of the lights
in the Cell House on all night to keep a reasonable load on the diesel generator.
Currently the evening power load at Alcatraz Island is 41.4 kW, which is less than
25% of the generator capacity and still unnecessarily high. By including some
type of energy storage system that the island could run off of in the evening, the
generator and the lights in the Cell House could be turned off and the load would

21decrease to 17.5 kW. This would result in a 12% energy savings each day.
Another option is to transfer to one of the 80 kW rated generators for the
nighttime load. In this case, only a 20 kW load would have to be maintained on
the generator to keep it at 25% of its rated capacity. Before this is implemented,
a comparison should be made between the efficiencies of the two sized
generators at 25% capacity to confirm the fuel savings.
Several other energy saving methods are considered to determine the amount by
which Alcatraz Island could reduce its daily energy consumption. First, all of the
52 W incandescent light bulbs could be replaced with 13 W CFL bulbs, the 100-
150 W with 24 W, and all the 200-300 W with 40 W. Next, the halogen flood
lights, presumably rated at 50 W, could be exchanged for equivalent energy
saving spotlights, which only draw 11 W and have a lifetime of 15,000 hours.23 A
dimming spotlight could also be installed, which adjusts its output with respect to
the amount of natural light available in a room, reducing the consumption further.
The 52 W rated exit signs could be replaced with 10 W LED signs that can last
up to 100 times longer.24 Already, 80 of the fluorescent fixtures have been
replaced with lower wattage bulbs and electrical ballasts to limit their electrical
current, so the remaining 39 fixtures could incorporate this. 25 The result of
implementing these four replacements and turning off all unnecessary lights in
the evening is an energy consumption reduction of 42.3% per day. This breaks
into a daytime power load of 97 kW, an evening load of 16.1 kW and a total daily
energy consumption of 1361 kWh. This 42.3% energy demand reduction
corresponds to an equivalent reduction in fuel consumption and a savings of
$74,300 per year in fuel alone (based on an autumn 2007 fuel price of $3/gallon).

225 Solar Energy Assessment
5.1 Solar Resource
A photovoltaic (PV) cell is a device that can convert light, or solar energy, into
electrical energy. There are two types of solar radiation that cause a PV cell to
produce energy: beam and diffuse radiation. Beam radiation is energy that
travels directly from the sun to the solar collector. Diffuse radiation is the
component that is scattered through the clouds and sky. Diffuse radiation makes
it possible for a solar collector to produce energy even on overcast days. Typical
solar radiation studies measure the two sources separately by using one
collector aimed directly at the sun and a second that blocks the direct beam
component and measures radiation from everywhere else in the sky. It is useful
to know the two separate components because it allows one to calculate exactly
how much energy can be produced as a function of the position of a solar
collector.
A renewable energy study was conducted at Alcatraz Island by the National
Renewable Energy Laboratory (NREL) from November 1995 to October 1996,
collecting hourly solar radiation and wind speed measurements.26 An entire
year’s worth of data are pieced together from this study, with the exception of
data for the month of December. Preliminary calculations are performed using
these data to determine the amount of energy that can be harnessed from the
sun in San Francisco Bay. However, the solar measurements at Alcatraz Island
were taken on horizontal and south facing vertical collectors, making it more
difficult to calculate the solar energy available for a tilted solar module compared
to when both the beam and diffuse components of solar flux are considered.
A second source of solar data is consulted in order to perform the energy
calculations on a tilted collector. NREL has a Renewable Resource Data Center

23(RReDC) that contains meteorological statistics for sites all over the US and in
two US territories from the years 1961-2005.27 This database does not contain
solar measurements from Alcatraz Island, but it does have data taken at the San
Francisco International Airport (SFO), located south of San Francisco on the
mainland. Global radiation is solar radiation collected on a horizontal surface
and includes both the beam component and diffuse radiation. The global
radiation measured at Alcatraz Island was compared to that measured at SFO
during the same months and year. The total monthly radiation received at each
location can be seen in Figure 5 and Figure 6.
0
50000
100000
150000
200000
250000
Janu
ary
Februa
ryMarc
hApri
lMay
June Ju
ly
Augus
t
Septem
ber
Octobe
r
Novem
ber
Mon
thly
Glo
bal R
adia
tion
(Whr
/m^2
)
Figure 5: Monthly Solar Radiation Measured at Alcatraz Island in 1995-1996
24
0
50000
100000
150000
200000
250000
Janu
ary
Februa
ryMarc
hApri
lMay
June Ju
ly
Augus
t
Septem
ber
Octobe
r
Novem
ber
Mon
thly
Glo
bal R
adia
tion
(Whr
/m^2
)
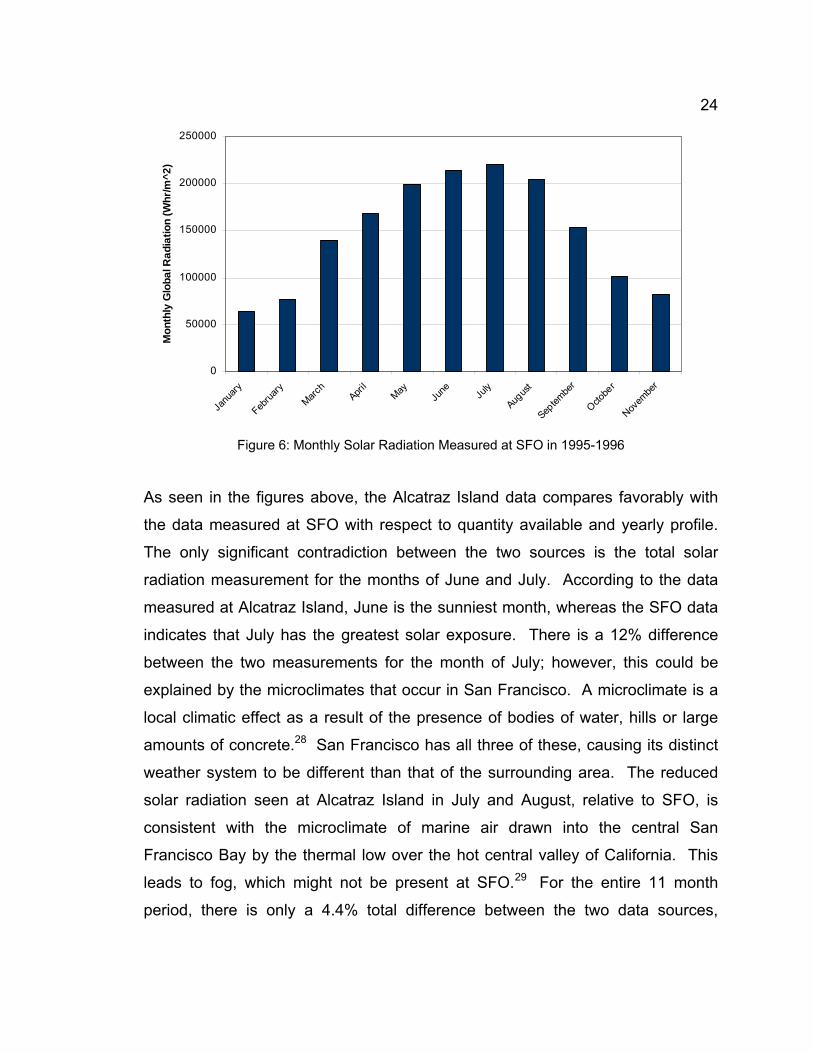
Figure 6: Monthly Solar Radiation Measured at SFO in 1995-1996
As seen in the figures above, the Alcatraz Island data compares favorably with
the data measured at SFO with respect to quantity available and yearly profile.
The only significant contradiction between the two sources is the total solar
radiation measurement for the months of June and July. According to the data
measured at Alcatraz Island, June is the sunniest month, whereas the SFO data
indicates that July has the greatest solar exposure. There is a 12% difference
between the two measurements for the month of July; however, this could be
explained by the microclimates that occur in San Francisco. A microclimate is a
local climatic effect as a result of the presence of bodies of water, hills or large
amounts of concrete.28 San Francisco has all three of these, causing its distinct
weather system to be different than that of the surrounding area. The reduced
solar radiation seen at Alcatraz Island in July and August, relative to SFO, is
consistent with the microclimate of marine air drawn into the central San
Francisco Bay by the thermal low over the hot central valley of California. This
leads to fog, which might not be present at SFO.29 For the entire 11 month
period, there is only a 4.4% total difference between the two data sources,

25indicating that the SFO data are similar enough to the Alcatraz data to be used
to characterize the solar resource in the bay.
In addition to containing data for each hour, day and year, NREL has created a
data set they call a typical meteorological year (TMY2) that combines data from
the 30 year time span 1961-1990.30 The solar flux, wind speed and temperature
over this 30 year period are evaluated to find the most probable solar and
weather condition for every hour, day and month of the year. This provides a
more accurate representation of a renewable energy resource, rather than
relying on a single year’s worth of data that could have been an uncharacteristic
period. The TMY2 data taken at SFO are used in all calculations to compute the
solar energy availability at Alcatraz Island.
5.2 Solar Module Manufacturers
As alternative and renewable energy becomes more popular there are more
available solar photovoltaic module manufacturers. Established solar panel
manufacturers include Sharp, Sanyo, and SunPower, while companies like
Suntech are relative newcomers to the industry. The two brands of solar
modules used for this analysis are Sanyo and SunPower. SunPower is a US
company that manufactures its modules in the Philippines. Sanyo is located in
Japan; however, its unique silicon is manufactured in the US and its modules are
assembled in Mexico. These companies were chosen because they produce
some of the highest efficiency solar cells, and as roof space is a limiting factor in
this project, panel efficiency is critical. The size, efficiency and cost information
for each of these panels is used to characterize the solar electric resource at
Alcatraz Island and calculate the economics of a solar energy system. It is of
interest to note that the solar cell efficiency is always 2-3% greater than the
actual solar module, and all efficiencies quoted are for the full module.

26The SunPower module of interest is its 315 watt rated solar panel. This panel
is chosen because it has the highest panel efficiency available on the market,
19.3%, and because of its aesthetically pleasing appearance. 31 With high
efficiency panels, fewer panels are needed, reducing racking system and
installation costs. Also, less space is required, which is of high importance in this
project. For a 100 kW system, only 320 of these panels are required. Although
this panel is not currently available for purchase in the United States, it may be
obtainable by the time this project is executed. If this is not the case; however,
SunPower does have lower rated panels that have similar efficiencies but are
slightly smaller in size. A price quote of $7.00 per rated watt was obtained for an
installed grid-tied SunPower system, including modules, power electronics and
installation.32 This is a very reasonable price; however, it is not completely
representative of a solar system cost for Alcatraz Island because it does not
include the energy storage system cost that will be required for an off-grid system
or any additional delivery and installation charges associated with the off-grid
installation. Although the cost cannot be used for an installed system at Alcatraz,
it suggests a price per watt for just the panels between $4.00 and $5.00.
Sanyo makes a solar cell from heterojunction with intrinsic thin layer (HIT) silicon,
used in its HIP series solar modules. These panels use a combination of mono-
crystalline silicon and thin film amorphous silicon, giving them an efficiency range
of 15.3-17.3% and are available in power ratings of 180-205 watts.33 Thin film
silicon does not preserve its conductive quality as well as crystalline silicon, so
the efficiency of these panels does tend to degrade over time, but they will still
function at 14% efficiency at the end of their lifecycle. The Sanyo HIP-200
panels cost $1,080 per panel or $5.40 per rated watt but currently have a limited
supply and can only be delivered in batches of 400 panels every four months.34
The price quote obtained did not include a delivery cost. Since these panels are
in short supply and difficult to obtain, it would be wise to reserve them far in
advance if the NPS intends to go ahead with this option.

275.3 Solar Module Tilt Angles
The quantity of solar energy produced can be affected by the angle of tilt of the
solar module relative to the horizontal surface. As mentioned previously, there
are two types of radiation that trigger electrical generation by a solar module, but
the angle of incidence between the beam radiation and the module has a
significant effect on the amount of power the module will produce. The power
output of a solar module is directly related to the amount of solar radiation it
receives, and the more directly the sun strikes a solar panel, the more power it
will produce. There are several factors that influence the angle between the
direct beam radiation from the sun and a solar panel, including latitude of the
module, time of year, time of day, angle between the panel and the ground and
the angle between the front edge of the panel and true south.35 Figure 7 below
gives a visual representation of the following angles:
• θz = solar zenith angle, the angle between a vector normal to the
horizontal surface of the earth and the direct beam radiation vector
• θ = solar incidence angle, the angle between a vector normal to the
surface of a solar collector and the direct beam radiation vector
• β = tilt angle, the angle between a solar collector and the horizontal
surface of the earth
• γ = solar azimuth angle, the angle between a vector normal to the surface
of a collector projected on the ground and a vector facing true south

28
Figure 7: Diagram of the Solar Angles: θz, θ, β and γ36
The remaining angles not represented on Figure 7 are:
• Φ = latitude at the location of a solar collector
• δ = solar declination angle, the angle of the earth’s axis of rotation with
respect to the location of the sun (varies between 23.5°N during the
summer solstice and -23.5°S at the winter solstice)
• ω = hour angle, the angle between the longitudinal position of a solar
collector and the longitude where solar noon is occurring on the earth.
Solar noon is defined as the average time between sunrise and sunset
and has an hour angle of 0°. The hour angle decreases at 15° per hour
traveling east and increases at 15° per hour to the west.37
Ideally, a solar module would face directly normal to the beam component of the
solar radiation at all times to maximize energy production. This is done by
adjusting the tilt angle, β, of a module, allowing it to be set relative to the solar
declination angle, and the solar azimuth angle γ, which accounts for the hour
angle fluctuation. However, the solar declination of the earth changes every day

29and the hour angle shifts constantly though the day, which means that the tilt
angle would have to be adjusted daily and the solar azimuth angle adjusted at
least hourly. There are solar installations with the ability to track the location of
the sun and adjust automatically, but this increases the complexity of the system
and the cost. It is common practice to set the solar azimuth angle at 0° so that
the module is always facing true south. This is this optimal position, because it
takes advantage of both the morning and afternoon solar availability. The
change in solar declination each day is very minimal, so it is not necessary to
adjust the tilt angle every day. An alternative is to optimize the solar modules for
each month; however, for a large installation, it can still be laborious to adjust
every module each month. The preferred method for a large, manual installation
is to set the tilt of the solar modules at an angle so that the solar electric energy
production is optimized for the entire year.
As Alcatraz Island is located at latitude 37.37°N of the equator, the sun will
always be located to the south of it; however, the optimal monthly tilt angle of the
panels shifts between 5° in July and 60° in January. It is not sensible to optimize
the solar modules for the extremes of either summer or winter, the best option
being to design for the fall and spring when the sun is at the same location in the
sky relative to the modules. Solar calculations were performed with the NREL
data from SFO, proving the optimal tilt angle of a solar module located on
Alcatraz Island to be 28° off of the horizontal and facing true south. The analysis
shows that a module tilted at this angle can produce 9.3% more energy over the
entire year than a horizontal panel. Solar panel mounting systems come with
preset angles, fortunately 30° is a common angle setting and very close to the
desired 28° angle.
There are certain disadvantages associated with installing the solar modules
tilted up at an angle. The racking system for a tilted panel installation is more
complicated and more expensive to purchase than the installation kit for

30horizontal mountings. Also, more space is required for a titled system so that
each row of panels does not cast a shadow on the row behind it. In order to
prevent a 28° tilted solar module from shading any subsequent panels, the
distance between the front edges of the panels has to be 1.24 times the height of
the panel in the spring and fall. This dimension increases to 1.72 times the
height of the panel in the winter and is almost negligible in the summer. A visual
representation of the module tilt angle relative to the solar declination angle of
the sun is available in Figure 8.
Figure 8: Required Space Between 28° Tilted Panels in Summer, Winter, Spring and Fall
Another issue concerning tilted panels is the east-west solar azimuth orientation
of the panels. The buildings being considered for a solar installation on Alcatraz
are the Cell House and New Industries Building, neither of which is oriented
north-south. The long wall of the Cell House is facing 45° west of true south and
the short wall of the New Industries building is facing 30° east of true south. This

31is not a concern if the panels are laid horizontal, but if they are tilted, the
modules should be facing exactly south. Fewer panels can be installed on a
building if they are not aligned with the walls of the building, which can be
observed in the figures below for the Cell House.
Figure 9: Solar modules aligned with the Cell House long wall.
Figure 10: Solar modules oriented true south on the Cell House

32As seen in Figure 9, a solar array arranged in line with the walls of the building
results in an orderly, cleaner looking system that can accommodate more panels.
However, the south facing array can produce more total energy for the year. The
energy production loss as a result of orienting the modules off of true south is
explored in the following section.
5.4 Solar Power Availability
The amount of power that can be harnessed from a solar PV system is
dependent upon the amount of solar radiation available, the efficiency of the
solar modules and the amount of space available. The rated power of a PV
system simply refers to the amount of power that it can produce in full irradiance,
which is defined as 1000 W/m². Two systems can have the same rated power
but will require a different number of modules based on the size of the panel and
its efficiency. If an installation is not limited by space, it can be more economical
to use more, lower efficiency panels. This project, however, is limited by space
and high efficiency solar modules are used for all of the calculations.
In order to determine the solar power availability at Alcatraz Island and the
advantage of tilting the modules, a 100 kW rated system is considered first. This
number is chosen because it is close to the average 98 kW load and will easily fit
on the roof of either building using various solar modules. The TMY2 data from
NREL is used for all of the calculations. The information required to determine
solar electricity production is solar radiation, ambient temperature, wind speed,
panel efficiency and total area. Solar panel efficiency is defined for a certain
panel temperature, observing decreased efficiency at higher temperatures and
increased efficiency at lower temperatures, while the panel temperature is a
function of the solar irradiation on the panel, the ambient temperature and the
wind speed, which provides convective cooling. Power output is also dependent

33upon the solar incidence angle between the beam radiation and solar module,
so it varies based on the time of day, time of year and the panel orientation. A
detailed description of the analysis can be seen in Appendix C, while the results
are discussed below.
The sun does not supply constant, rated irradiation, but rather varies through the
day as seen in the Figure 11 below. As a result of this, solar modules do not
produce at their rated power during all of the daylight hours. Since rated
irradiance is 1000 W/m², on a characteristic day in San Francisco in July, a
horizontal solar panel will produce close to its rated power for three hours and
taper off in the morning and evening. One way to estimate the daily energy
output of a solar system is to calculate the number of peak (1000 W/m²) hours of
sunlight and multiply it by the system rating. The peak sunlight hours are found
by summing the total solar irradiation for the day and dividing by 1,000 W/m².
There are 7.26 peak hours of sunlight in San Francisco per day in July, followed
by no useful solar irradiation for the remainder of the day. Thus, 100 kW rated
system will produce 726 kWh of electrical energy per day on average. This is
roughly ⅓ of the total daily energy consumption at Alcatraz Island, so a solar
system would have to be built three times this size to be able to supply the total
energy demand for July.

34
0
200
400
600
800
1000
1200
1 2 3 4 5 6 7 8 9 10 11 12 13 14 15 16 17 18 19 20 21 22 23 24
Hour of the Day
Sol
ar F
lux
on a
Hor
izon
tal S
urfa
ce (W
/m^2
)
Figure 11: Average Hourly Solar Radiation for SFO in July
There is also a significant variation in solar radiation at SFO based on the time of
year, as seen in Figure 12. July sees the greatest amount of solar irradiation,
observing four times more solar flux than December. In contrast to July,
December only has 2.2 peak hours of sunlight on a horizontal surface each day,
so a solar system would have to be rated at 1090 kW to produce all of the energy
required in December. This would be a very large, expensive system and would
not fit on the roof of either building, leading to the decision to design the system
only large enough to supply the full energy demand for the month of July.

35
0
50000
100000
150000
200000
250000
Janu
ary
Februa
ryMarc
hApri
lMay
June Ju
ly
Augus
t
Septem
ber
Octobe
r
Novembe
r
Mon
thly
Glo
bal R
adia
tion
(Whr
/m^2
)
Figure 12: Average Monthly Solar Radiation at SFO
After the daily and seasonal effects are determined, the different panel tilt
configurations are compared. For the analysis, properties of the Sanyo HIT 200
kW rated panels are used. A 100 kW rated flat panel configuration is assessed
first and compared to the monthly energy demand at Alcatraz Island. For the
energy demand calculation, the average power consumption of 98 kW is
multiplied by the number of hours in each month. This system can produce up to
19.28% of the yearly power requirement at Alcatraz Island. This provides as
much as 30.4% of the energy requirement in July, but only 8.2% of the demand
in December. A visual representation of the monthly energy production for this
system can be seen in Figure 13.

36
0
10000
20000
30000
40000
50000
60000
70000
80000
Janu
ary
Febru
aryMarc
hApri
lMay
June Ju
ly
Augus
t
Septem
ber
Octobe
r
Novem
ber
Decem
ber
Ener
gy (k
Whr
)
RemainingEnergy Demand
Solar Production
Figure 13: Monthly Solar Energy for a 100 kW Rated Horizontal Panel Solar System
Next, the effect of tilting the solar modules at an angle of 28° is examined and the
results can be seen in Figure 14. By tilting the panels, the solar energy
production decreases in the summer but increases for the remaining seasons.
This is due to the fact that the optimal tilt angle for a solar module in San
Francisco in the summer is 5°, so a horizontal panel orientation is closer to ideal
than 28°. The result of tilting the panels 28° off of the horizontal and facing them
true south is a net increase of 9.3% in energy production over the year compared
to a horizontal panel layout, providing 21.08% of the total demand.

37
0
10000
20000
30000
40000
50000
60000
70000
80000
Janu
ary
Febru
aryMarc
hApri
lMay
June Ju
ly
Augus
t
Septem
ber
Octobe
r
Novem
ber
Decem
ber
Ener
gy (k
Whr
)
RemainingEnergy Demand
Solar Production
Figure 14: Monthly Solar Energy for a 100 kW Rated Solar System Tilted at 28°
As mentioned previously, neither of the buildings of interest are oriented to the
south; therefore, the energy production loss caused by installing the solar
modules in line with the buildings is calculated. The monthly energy output of
each system is shown in Figure 15 and Figure 16. The New Industries building is
facing 30° east of true south, so an analysis is performed to determine the power
decrease caused by aiming the panels in this direction. The yearly energy output
of tilted panels facing 30° east of south is 5.3% greater than that for flat panels
but 3.6% less than for tilted, south facing panels. This is a net yearly production
of 20.32% of the energy demand. Next, the effect of facing a solar system at 45°
west of south, or aligned with the roof of the Cell House, is calculated. The result
of this is a 6.3% increase in yearly power output compared to flat panels and a
2.7% decrease in energy production versus tilted, south facing panels, providing
a total of 20.49% of yearly of the demand.
It is counterintuitive that a solar module facing 45° off of south would produce
more energy than one at 30° off of true south since it is facing farther away from

38the optimal orientation. An examination of Figure 11, the average hourly solar
radiation throughout the day, explains this. During the month of July, solar noon
occurs at 12:45. Until this hour, the sun is in the eastern part of the sky relative
to San Francisco, and after this time the sun is to the west. The amount of solar
flux received on a flat collector for the first half of the day is 3392.6 Wh/m², while
the amount received during the second half of the day is 4171.1 Wh/m². The
majority of the solar flux occurs after solar noon, so there must be more solar
radiation available in the afternoon, from the west side of the sky. Therefore, a
panel facing west will observe more solar flux during the day and produce more
energy.
0
10000
20000
30000
40000
50000
60000
70000
80000
Janu
ary
Febru
aryMarc
hApri
lMay
June Ju
ly
Augus
t
Septem
ber
Octobe
r
Novem
ber
Decem
ber
Ener
gy (k
Whr
)
RemainingEnergy Demand
Solar Production
Figure 15: Monthly Solar Energy for a 100 kW Rated Solar System Tilted at 28° Oriented At 30°
East of True South

39
0
10000
20000
30000
40000
50000
60000
70000
80000
Janu
ary
Febru
aryMarc
hApri
lMay
June Ju
ly
Augus
t
Septem
ber
Octobe
r
Novem
ber
Decem
ber
Ener
gy (k
Whr
)
RemainingEnergy Demand
Solar Production
Figure 16: Monthly Solar Energy for a 100 kW Rated Solar System Titled at 28° Oriented at 45°
West of True South
A side by side comparison of the energy output of the four different arrangements
can be seen in Figure 17. This shows the monthly energy production of each
design relative to the others. Not surprisingly, a horizontal panel system
produces the most energy in the summer months, and a south facing, tilted
system produces the most in the winter. Unexpectedly, there is slightly more
energy available in the summer months from the south-west facing tilted panels
compared to the south facing tilted panels. As explained above, there is more
solar flux available in the west side of the sky than the east, so a west facing
panel optimizes the resource. In spite of the greater solar flux in the west side of
the sky, the south-east facing, tilted solar module produces more energy during
the winter than the south-west directed module. This is because the sun is so
low on the horizon in the winter that a panel with the most southern exposure will
receive more flux and produce more energy.

40
0
5000
10000
15000
20000
25000
Janu
ary
Febru
aryMarc
hApri
lMay
June Ju
ly
Augus
t
Septem
ber
Octobe
r
Novem
ber
Decem
ber
Ene
rgy
(kW
hr)
Horizontal Panel
Tilted Panel at 45°West of True SouthTilted Panel at 30°East of True SouthTilted Panel facingTrue South
Figure 17: Comparison Between Flat and Tilted Panels at Different Orientations
The last item to verify is the optimal size of a solar system in San Francisco Bay
for the month of July. It is determined, using the number of peak sunlight hours,
that the optimal rating for a solar system in the San Francisco Bay in July is 330
kW. This is verified with the TMY2 data by conducting the analysis with a 330
kW rated system and calculating the monthly power production. The results,
shown in Figure 18, verify that a horizontal, 330 kW rated system can produce
100% of the energy required for Alcatraz Island in July, 27.12% of the energy
required in December and 63.6% of the energy need for the entire year.

41
0
10000
20000
30000
40000
50000
60000
70000
80000
Janu
ary
Febru
aryMarc
hApri
lMay
June Ju
ly
Augus
t
Septem
ber
Octobe
r
Novem
ber
Decem
ber
Ener
gy (k
Whr
)
RemainingEnergy Demand
Solar Production
Figure 18: Monthly Solar Energy for a 330 kW Rated Horizontal Panel Solar System
Tilting this same sized system up at 28° increases the yearly energy production
to 69.58% and the December production up to 39.08% but reduces the summer
production to 96.28% of the monthly demand for July. The monthly energy
production of a 330 kW, tilted solar system is represented in Figure 19 below. In
order for a tilted solar system to produce all of the energy demand for Alcatraz
Island in July, it would have to be rated at 345 kW, producing a total of 72.75% of
the yearly energy demand on the island.

42
0
10000
20000
30000
40000
50000
60000
70000
80000
Janu
ary
Febru
aryMarc
hApri
lMay
June Ju
ly
Augus
t
Septem
ber
Octobe
r
Novem
ber
Decem
ber
Ener
gy (k
Whr
)
RemainingEnergy Demand
Solar Production
Figure 19: Monthly Solar Energy for a 330 kW Rated South Facing Solar System Tilted at 28°
Unfortunately, a 330 kW rated system cannot fit on the roof of the New Industries
Building, so it would have to be divided between the two buildings or be installed
entirely on the roof of the Cell House. Space will become an even greater issue
if the panels are installed at an angle. Although a south-facing, tilted panel
arrangement can produce the most energy for the year, this additional energy
may not be worth the added inconvenience and expense of arranging the panels
in this manner. A titled system that is facing 45° west of south only produces
2.7% less energy yearly than its south-facing counterpart and will be easier to
install and accommodate more panels on the Cell House. By facing the panels
at 30° east of south on the New Industries building, there is an energy loss of
3.6% for the year versus the south-facing panels. A horizontal panel installation
will produce the least amount of energy per year at 9.3% less than true south
facing, tilted panels and 6.3% less than the south-west facing, tilted panels;
however, it will be the easiest and cheapest system to implement. All of these
possibilities are discussed in greater detail in Chapter 10.

436 Wind Energy Assessment
6.1 Wind Resource
An examination of the wind energy resource at Alcatraz Island is conducted next.
Wind data collected during the 1995-1996 NREL study at Alcatraz Island is
evaluated first. An anemometer mounted on a 10 ft mast on the exhaust
chimney of the Cell House took hourly records of the wind speed and direction.
Wind turbines are generally installed at no less than a height of 10 meters, so
before the average daily and monthly wind speed values could be calculated, the
wind data had to be scaled from 10 feet to 10 meters. This is because of the
boundary layer that exists over a surface. As wind passes over the ground or
buildings, it is slowed due to friction. This effect has an inverse relationship to
height, which is why the minimum recommended height for a wind turbine is 10
meters.38 The boundary layer is represented by the curve in Figure 20 and
shows how wind speed is affected by interaction with the ground. The horizontal
scale shows the percentage of “unimpeded wind” versus the height above the
ground over different surfaces.
Figure 20: Examples of the Boundary Layer of Wind over Different Terrain39

44The hourly wind speed data at Alcatraz Island, obtained from NREL, was
converted into the daily average wind speed over the period of the study.
Although the hourly wind speed at Alcatraz Island can reach 18 m/s, the average
daily wind speed never gets higher than 10 m/s, and the yearly average is only
3.4 m/s. Figure 21 shows the average wind speed for each day from January 1st
to late November. Peak average wind speed is found in the winter and early
spring, although the late spring and summer period has the most consistent wind.
0
2
4
6
8
10
12
1 21 41 61 81 101 121 141 161 181 201 221 241 261 281 301 321
Day of the Year
Ave
rage
Dai
ly W
ind
Spee
d (m
/s)
Figure 21: Average Daily Wind Speed at Alcatraz Island

45
0
200
400
600
800
1000
1200
1400
1600
0 1 2 3 4 5 6 7 8 9 10 11 12 13 14 15 16 17Wind Speed (m/s)
Hour
s pe
r Yea
r
Figure 22: Alcatraz Island Wind Speed Distribution
A wind speed distribution is created to show the number of hours per year that
Alcatraz receives wind at each speed, which can be seen in Figure 22. This is a
standard method of characterizing the wind energy availability of a site. The
graph in Figure 22 indicates that the most probable wind speed at Alcatraz Island
is only 3 m/s. All of the small wind turbines considered for this project have cut-in
speeds between 2-3 m/s; which is the minimum wind velocity for a turbine to
produce power, meaning that for the majority of the time the wind is blowing,
these turbines will be producing near their minimum amount of power. The rule
of thumb for a wind energy installation is that the site should have a most
probable wind speed of at least 5 m/s, leaving Alcatraz Island out as an option for
wind turbines based on the NREL data.
There is the possibility that the Alcatraz wind data is not representative of the
actual condition. Alcatraz Island is in the middle of the San Francisco Bay, which
appears windy; however, the data were measured more than ten years ago and
over a single year time period with uncertain anemometer placement and airflow
conditions on the roof of the Cell House. For these reasons, the Alcatraz data

46was discarded in favor of the NREL data taken at the San Francisco Airport
(SFO). In order to confirm the wind resource at Alcatraz Island, it will be
necessary to install another, taller anemometer on the roof of the Cell House and
record several months worth of wind data to compare with the data taken
previously. If a second study obtains similar results to the 1995-1996 Alcatraz
data, then it is likely that a sufficient wind resource is not present on the Cell
House roof. The location of the anemometer could be a cause of the slow wind
speed. The Cell House is the tallest building on the island and is located at the
highest point. As the wind rises to flow over the island, it may get caught on the
front edge of the Cell House, causing a turbulent recirculation zone over the roof
of the Cell House, which is not suitable for wind energy turbine placement.
The data measured at SFO airport by NREL are utilized for the wind analysis.
The average daily wind speed and wind speed distribution graphs can be seen in
Figure 23 and Figure 24 below. This wind data were measured at a height of ten
meters, so they did not need to be scaled to get out of the boundary layer as with
the Alcatraz data. According to the wind data measured at SFO, the average
wind speed in San Francisco is 4.6 m/s and the most probable wind speed is 5
m/s. Although this is still on the low side for a wind turbine installation, it is within
an acceptable range.

47
0
2
4
6
8
10
12
1 21 41 61 81 101 121 141 161 181 201 221 241 261 281 301 321 341 361
Day of the Year
Ave
rage
Dai
ly W
ind
Spe
ed (m
/s)
Figure 23: TMY2 Average Daily Wind Speed at San Francisco Airport
0
200
400
600
800
1000
1200
1400
1600
1800
2000
0 1 2 3 4 5 6 7 8 9 10 11 12 13 16
Wind Speed (m/s)
Hou
rs p
er Y
ear
Figure 24: SFO Average Wind Speed Distribution from 1995-2005

486.2 Wind Turbine Manufacturers
The National Park Service requested that the University of Washington consider
small wind turbines for the roof of the Cell House. These are smaller turbines
with a lower rated wattage and lower wind speed requirement than the large
turbines seen at wind farms. The small wind turbines considered include the
horizontal axis turbines made by Bergey, Abundant Renewable Energy (ARE)
and Swift and the vertical axis turbines manufactured by PacWind and Windside.
All turbines are assumed to be located on the roof of the Cell House, as that is
the highest point on the island and presumably has the greatest wind due to the
lack of obstructions. However, the Cell House could be experiencing turbulent
wind flow and flow separation over it and there may be a site more suitable for
wind turbines.
Figure 25: Swift Rooftop Wind Turbines 40
Swift wind turbines, seen in Figure 25, are designed specifically for rooftop
installations and do not sit very high above the building, which is consistent with
the NPS desire for placing wind turbines on the Cell House roof. These turbines
have a cut in speed of 2.3 m/s and are rated at 1.5 kW in wind of 12.5 m/s.41
Although the average wind speed in San Francisco is above the cut-in speed of
the Swift turbine it is far below its rated speed; therefore, the turbine would only
be producing a fraction of the rated wattage for the majority of the time. Another
factor to be considered on a roof-top wind turbine installation is the boundary
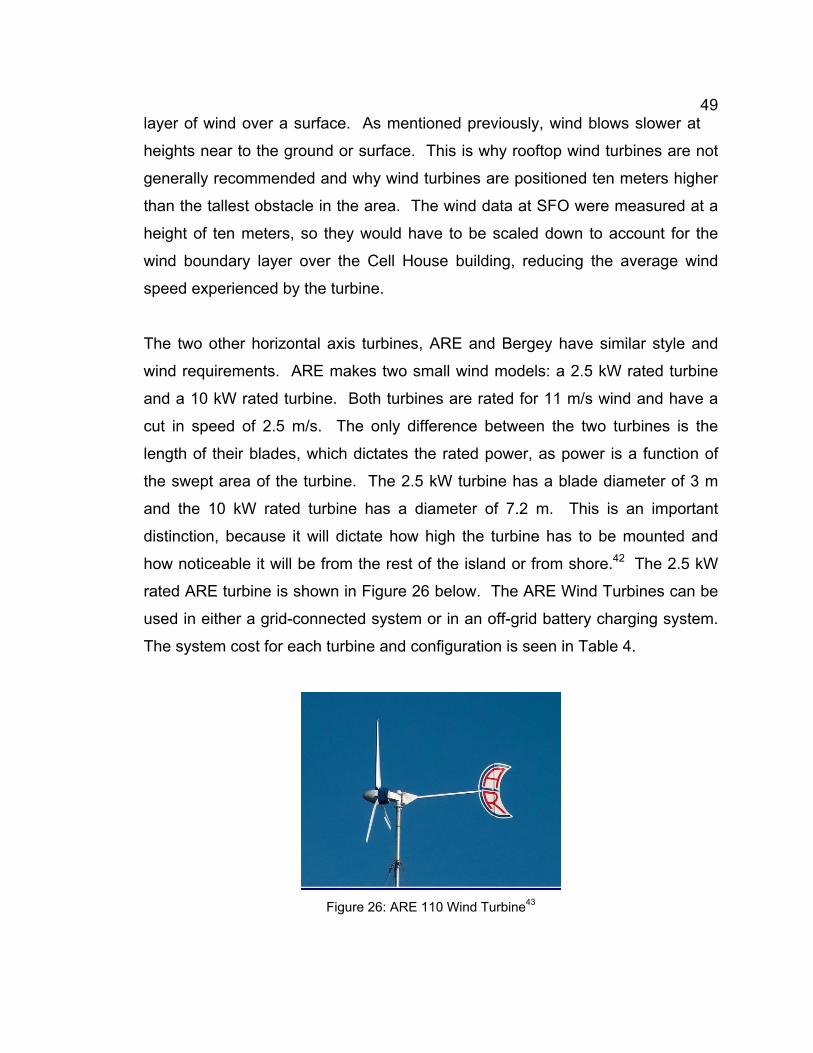
49layer of wind over a surface. As mentioned previously, wind blows slower at
heights near to the ground or surface. This is why rooftop wind turbines are not
generally recommended and why wind turbines are positioned ten meters higher
than the tallest obstacle in the area. The wind data at SFO were measured at a
height of ten meters, so they would have to be scaled down to account for the
wind boundary layer over the Cell House building, reducing the average wind
speed experienced by the turbine.
The two other horizontal axis turbines, ARE and Bergey have similar style and
wind requirements. ARE makes two small wind models: a 2.5 kW rated turbine
and a 10 kW rated turbine. Both turbines are rated for 11 m/s wind and have a
cut in speed of 2.5 m/s. The only difference between the two turbines is the
length of their blades, which dictates the rated power, as power is a function of
the swept area of the turbine. The 2.5 kW turbine has a blade diameter of 3 m
and the 10 kW rated turbine has a diameter of 7.2 m. This is an important
distinction, because it will dictate how high the turbine has to be mounted and
how noticeable it will be from the rest of the island or from shore.42 The 2.5 kW
rated ARE turbine is shown in Figure 26 below. The ARE Wind Turbines can be
used in either a grid-connected system or in an off-grid battery charging system.
The system cost for each turbine and configuration is seen in Table 4.
Figure 26: ARE 110 Wind Turbine43
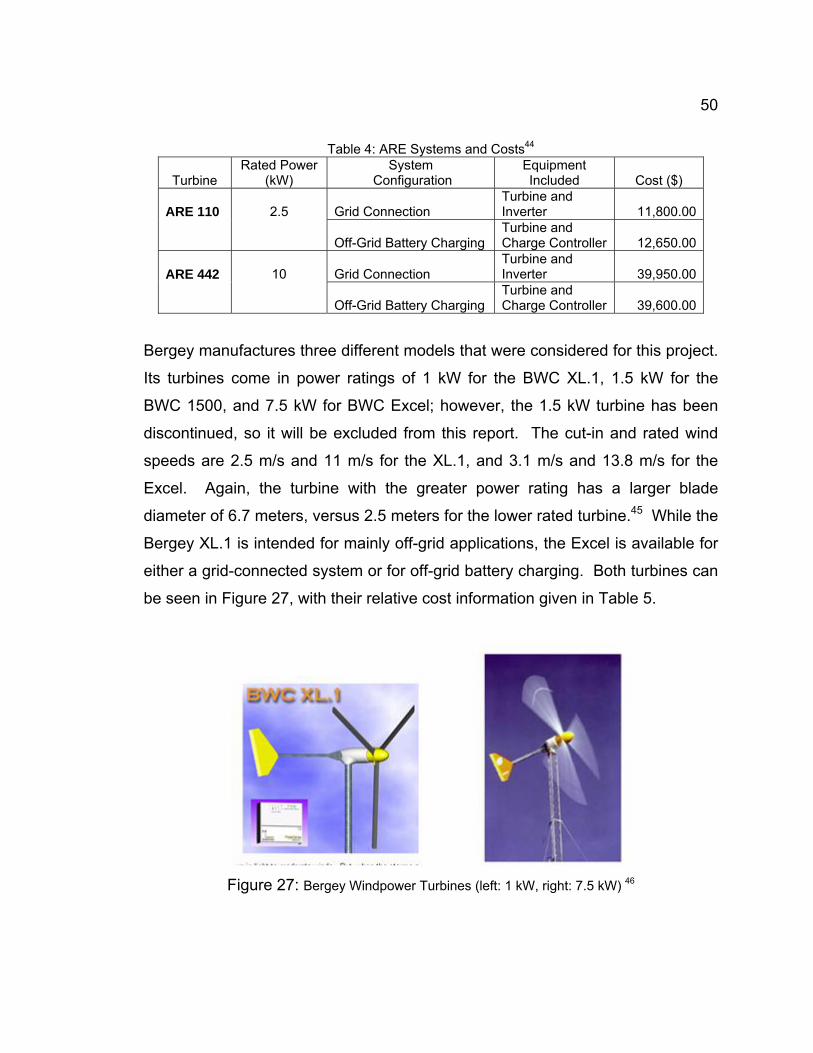
50
Table 4: ARE Systems and Costs44
Turbine Rated Power
(kW) System
Configuration Equipment Included Cost ($)
ARE 110
2.5 Grid Connection Turbine and Inverter 11,800.00
Off-Grid Battery Charging Turbine and Charge Controller 12,650.00
ARE 442
10 Grid Connection Turbine and Inverter 39,950.00
Off-Grid Battery Charging Turbine and Charge Controller 39,600.00
Bergey manufactures three different models that were considered for this project.
Its turbines come in power ratings of 1 kW for the BWC XL.1, 1.5 kW for the
BWC 1500, and 7.5 kW for BWC Excel; however, the 1.5 kW turbine has been
discontinued, so it will be excluded from this report. The cut-in and rated wind
speeds are 2.5 m/s and 11 m/s for the XL.1, and 3.1 m/s and 13.8 m/s for the
Excel. Again, the turbine with the greater power rating has a larger blade
diameter of 6.7 meters, versus 2.5 meters for the lower rated turbine.45 While the
Bergey XL.1 is intended for mainly off-grid applications, the Excel is available for
either a grid-connected system or for off-grid battery charging. Both turbines can
be seen in Figure 27, with their relative cost information given in Table 5.
Figure 27: Bergey Windpower Turbines (left: 1 kW, right: 7.5 kW) 46

51
Table 5: Bergey Systems and Cost Breakdown47
The remaining wind turbines are the vertical axis turbines produced by PacWind
and Windside. Windside is a turbine manufacturer from Finland that produces
wind turbines, as seen in Figure 28. The Windside turbine of particular interest is
a 2.4 kW rated turbine at a speed of 15 m/s with a cut-in speed of 1.5 m/s.48
Compared to the Bergey and ARE turbines, the WS-4C is able to start producing
power at lower wind speeds due to its lower cut-in speed. This will be beneficial
for the high number of low wind speed days; however, it is not going to run at its
rated capacity as often because of its higher rated speed condition.
Unfortunately, it was not possible to contact a distributor for Windside turbines in
the US, so the cost of these turbines is unknown.
Figure 28: Windside WS-C4 Turbine49
Turbine
Rated Power (kW)
System Configuration
Equipment Included
Turbine ($)
Tower ($)
Inverter ($)
Total Cost($)
BWC XL.1 1
Off-Grid Battery Charging
Charge Controller 2,590
1,595-2,450
2,165- 3,495
6,350- 8,535
BWC Excel 7.5
Off-Grid Battery Charging
Charge Controller
21,900-22,900
7,400- 13,400
3,495- 3,995
32,795-40,295
Grid Connected Inverter 27,900 7,400- 13,400 N/A
35,300-41,300

52PacWind is a California based wind turbine manufacturer that is committed to
making renewable energy opportunities available to the public. There were three
PacWind turbines considered for this project. The first one is called the
SeaHawk and has a rated wattage of 500 W at 12.5 m/s and a cut in speed of
3.13 m/s. This is their smallest turbine in size and power and has the least
conspicuous design. The other two PacWind turbines are the Delta I and Delta
II. The Delta I and II look similar, but the Delta II has a turbine diameter of 4.0 m
and height of 3.0 m, while the Delta I is only 1.2 m wide by 0.8 m tall. Both
turbines have the same rated speed of 12.5 m/s, but the Delta I has a rated
wattage of 2.0 kW and the Delta II is rated at 10.0 kW. The most unusual thing
about these two turbines is that the Delta II has a lower cut-in speed than its
smaller version with a value of 2.2 m/s versus 3.6 m/s for the Delta I.50 With the
wind speed in San Francisco as low as it is, it is beneficial to be able to produce
power at low wind speed. A price breakdown of these turbines is listed in Table
6, with a picture of each shown in Figure 29.
Table 6: PacWind Systems Cost Breakdown51
Turbine Rated
Power (kW) Turbine
($) Tower
($) Inverter
($) Charge
Controller ($) Total Cost
($) Seahawk .5 3,500.00 1,850.00 1,900.00 500.00 7,750.00Delta I 2 4,750.00 1,850.00 1,900.00 500.00 9,00.00Delta II 10 34,999.00 7,650.00 1,900.00 500.00 45,049.00
Figure 29: PacWind Turbines (left to right: SeaHawk, Delta I, Delta II)52

536.3 Wind Turbine Orientation and Type
As mentioned previously, there are two possible orientations of a wind turbine:
horizontal axis and vertical axis. As implied by their name, horizontal axis
turbines rotate around an axis that is in a horizontal plane. The alternative is a
turbine that rotates on a vertical axis and looks more like a helix or a large
eggbeater. Each of these designs is considered to determine which one best fits
the application on Alcatraz Island.
The other defining characteristic between turbines is their method of harnessing
power from the wind. The two designs are “drag type” and “lift type” wind
turbines. Drag type turbines have the simplest design, by relying on “cups”
placed about an axis that catch the wind when the cup is facing into it and
repelling it when faced away.53 Lift type machines incorporate the same concept
as the wing of an airplane and use the pressure difference created over an airfoil
to cause a lift force that is perpendicular to the direction of the relative wind.54
These two designs can be seen in Figure 30. (Please note, however, the artist’s
error in the Figure 30: the lift and drag forces should be perpendicular and
parallel, respectively, to the incoming wind, rather than to the shape of the airfoil.)
There are advantages and disadvantages of each of these turbine designs. In
order for a horizontal axis, lift type turbine to function it has to be facing into the
wind, the whole turbine must be able to rotate around a vertical axis to
accommodate the direction of the wind. A vertical axis drag or lift type turbine
works no matter what direction the wind is coming from, which reduces the
number of moving parts and the complexity of the machine. The rotational speed
of the drag machine is directly related to the speed of the wind and can only
move as fast as the wind pushing it. The blades of a lift type turbine can rotate
faster than the speed of the wind because it is not using the wind to push them,
but use the wind to create a pressure difference across the blades; therefore,

54they have a greater energy producing potential. Almost all horizontal axis
turbines are lift type machines, while the vertical axis turbines are mainly drag
type machines. Vertical axis lift turbines do exist, but these are not as common
in small wind applications.
Figure 30: Drag and Lift Wind Turbines55
The horizontal axis turbines considered for this project incorporate the lift
principle to rotate the blades, so they can reach speeds higher than the wind
speed itself, but the height requirement and large swept area of the blades
makes then very noticeable at a distance. The Windside vertical axis turbine
introduced earlier is based on drag, while PacWind has turbines that incorporate
both methods. Another benefit of the vertical axis turbines is their appearance.
Unlike the horizontal axis turbines that have large rotating blades that stand out,
the vertical axis turbines are relatively thin and unassuming. The horizontal axis
turbines were ultimately ruled out as a possibility because of their conspicuous
appearance. Even installation of small diameter turbines, seen in Figure 31,
would be very conspicuous on the roof of the Cell House. Therefore, all of the
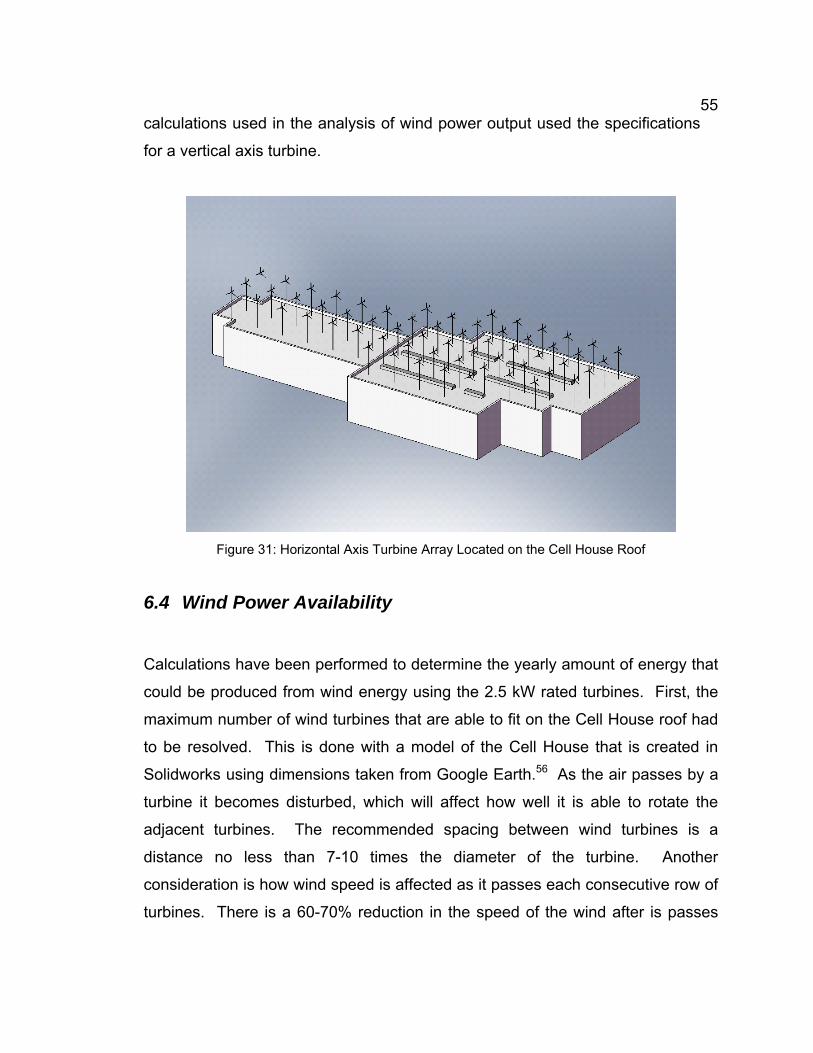
55calculations used in the analysis of wind power output used the specifications
for a vertical axis turbine.
Figure 31: Horizontal Axis Turbine Array Located on the Cell House Roof
6.4 Wind Power Availability
Calculations have been performed to determine the yearly amount of energy that
could be produced from wind energy using the 2.5 kW rated turbines. First, the
maximum number of wind turbines that are able to fit on the Cell House roof had
to be resolved. This is done with a model of the Cell House that is created in
Solidworks using dimensions taken from Google Earth.56 As the air passes by a
turbine it becomes disturbed, which will affect how well it is able to rotate the
adjacent turbines. The recommended spacing between wind turbines is a
distance no less than 7-10 times the diameter of the turbine. Another
consideration is how wind speed is affected as it passes each consecutive row of
turbines. There is a 60-70% reduction in the speed of the wind after is passes

56the first row of turbines and then only a slight reduction after each subsequent
row.57 This phenomenon was accounted for in the calculations of the power
output. The wind availability analysis can be seen in Appendix D and the SFO
wind data are assumed for all calculations.
Two different models are generated to represent wind turbine installations on the
roof of the Cell House. One design optimizes the space on the roof of the
building, and the second model keeps the turbines as free from view as possible.
The maximum number of turbines that can be discretely placed on the Cell
House roof is 22 and the maximum number possible is 51. Visual
representations of the two configurations are shown in Figure 32 and Figure 33.
Figure 32: Small Vertical Axis Turbine Array Located on the Cell House Roof

57
Figure 33: Large Vertical Axis Turbine Array on the Cell House Roof
An installation of 22 of the turbines would produce 1.8% of the energy
requirement for the entire year, and an array of 51 would produce 3%. This
means that 97% of the energy for the year would have to come from diesel or a
combination of diesel and another renewable energy system. The monthly wind
energy production versus energy demand analysis can be seen in Figure 34.
This investigation concludes that the wind resource at Alcatraz Island is not
sufficient to support wind turbines. Further research could be conducted in order
to determine the existence of a location on the island with greater wind speeds.

58
0
10000
20000
30000
40000
50000
60000
70000
80000
Janu
ary
Februa
ryMarc
hApri
lMay
June Ju
ly
Augus
t
Septem
ber
Octobe
r
Novembe
r
Decembe
r
Ener
gy (k
Whr
)
RemainingEnergy DemandWind Energy
Figure 34: Monthly Wind Energy Production for a 51 Turbine Installation

59
7 Tidal Energy Assessment
7.1 Tidal Resource
Unlike solar and wind energy, tidal energy can be more accurately predicted.
The benefit of this is the knowledge of exactly how much energy can be
produced and when. The height and direction of the tide is based on the
gravitational pull of the sun and moon on the earth. Most locations on the earth
observe two high and two low tides per day that occur on a 12.4 hour cycle. The
range of these cycles vary over a two week period including the maximum tide,
or “spring tide”, when the sun and moon are aligned with the earth and the
minimum tide, or “neap tide,” when the sun and the moon are at 90° in relation to
the earth. Each of these situations occurs twice a month; therefore, only a two
week period of tidal current data is required to characterize the essential aspects
of the yearly tidal resource at a specific location.58 The height of the neap and
spring tides are relative to the distance between the earth and the sun and
therefore vary through the year, but this can be accounted for in the analysis.
Tidal turbines are also beneficial from an aesthetic and historical preservation
point of view, as they sit below the water level and can’t be seen from the island.
In order to determine if there is a tidal resource that could be harnessed at
Alcatraz Island, it has been necessary to consider tidal current measurements
obtained in the area. The National Oceanic and Atmospheric Administration
(NOAA) has tidal current measurements from several locations in the San
Francisco Bay, including four stations north, south, east and west of the island,
ranging from distances of 0.2 to 0.8 miles from the island.59 These stations are
labeled E, B, A, and D, respectively in Figure 35. Tidal current data are
downloaded from the NOAA website and processed to determine the average
tidal current power density available at each station.

60
0m
Water Depth (MLLW)
20m
>40m
San Francisco
Alcatraz Island
Treasure Island
Angel Island
ABC
D
E
FG
Figure 35: Bathymetry for west end of San Francisco Bay with NOAA stations noted.60
In order to obtain a additional prediction of the tides in the San Francisco Bay, it
is possible to view real-time current velocities there. These predictions are
generated by the Tidal, Residual, and Intertidal Mudflat (TRIM) model, which is
available on the United States Geological Survey (USGS) web page. TRIM is a
numerical model that simulates the tidal currents and behavior of a body of water
and has been applied to the San Francisco Bay.61 An example of the predictions
can be seen in Figure 36.

61
Figure 36: TRIM Model Prediction for Ebb Tide on January 20, 200862
7.2 Tidal Turbine Manufacturers
One deficiency of tidal energy compared to solar and wind energy is that the
technology is relatively new and not as well developed and tested. Currently,
there are no tidal turbines past the stage of commercial scale demonstration,
unlike solar modules and their wind turbine counterparts, with only a relatively
few companies conducting research and development. Two of the US tidal
turbine ventures are Verdant Power and Gorlov Helical Turbines.

62Verdant Power is responsible for the pilot tidal turbine installation in the East
River in New York City. These turbines are similar to lift type horizontal axis wind
turbines with three blades that rotate around a hub. The blade diameter is five
meters, with a rated power of 34 kW. In order to account for the bi-directional
flow of the current with the ebb and flood tides, these turbines are secured to a
monopile and spin on a vertical axis so that they can turn into the direction of the
flow.63 The advantage of this design is that the turbine is always on axis with the
direction of the current, although the rotating hub is at a greater risk of
mechanical failure than a stationary design. A representation of the Verdant
Free Flow turbine can be seen in Figure 37.
Figure 37: Verdant Power Free Flow Turbines64
Verdant’s competitor, Gorlov, also incorporates the lift type design and can be
installed either on a vertical axis or horizontal axis. Its axisymmetric blade design
allows the turbine to rotate regardless of the direction of flow of the current. This
reduces the number of moving parts and the possibility of failure. The Gorlov
turbine is stated to have a low cut-in speed.65 An example of the Gorlov turbine
is shown in the Figure 38 below.

63
Figure 38: Vertical Axis Gorlov Helical Turbine66
7.3 Potential Tidal Turbine Location
None of the NOAA stations is situated close enough to the island to provide a
clear indication as to whether there is a localized acceleration as the current
splits to travel around the island. However, the bathymetry of the water around
Alcatraz Island shows that there is a shallow area, “Alcatraz shoal”, located
directly south of the island, as indicated on Figure 39. This information confirms
the predictions from the TRIM model seen in Figure 36, which indicate the
presence of a fast current at that location with a high power density. Despite
best efforts, no additional data have been discovered regarding the tidal resource
near Alcatraz. There are several sources of tidal current data in the San
Francisco Bay; however, none of them has information regarding the shoal area
that may confirm accelerated current. If these data cannot be obtained, it may be
necessary to commission a tidal current study at this location to verify the
resource.

64
0m
Water Depth (MLLW)
20m
>40m
AB
C
D
E
Alcatraz Island
To San Francisco
Alcatraz Shoal
Figure 39: Bathymetry of San Francisco Bay around Alcatraz Island.67
7.4 Tidal Power Availability
Tidal power calculations are performed with the NOAA data to determine the
average power density at each of the four stations surrounding Alcatraz Island.
The NOAA data contain tidal predictions of the maximum ebb and flood current
velocities for each day over an entire year. These data are imported into a tidal
current power estimation program, created by Brian Polagye, which converts the
current velocity into the average power density for the year.68 The station to the
east of the island (A) has a nominal power density of 0.2 kW/m2, and the west
station (D) has a power density of 0.4 kW/m2. These are fairly low power
densities. Additionally, these two sites may not be suitable locations for tidal
turbines because the water flows east-west in the bay, so the current at the
downstream side of the island would likely be turbulent for either the flood or ebb
tides. The north station (E) has a power density of 0.3 kW/m2 and the power

65density at the south station (B) is 0.2 kW/m2. For a site to be considered for
tidal power, it should have a minimum power density of 0.8 kW/m2. Although the
NOAA stations around Alcatraz do not support adequate power density for tidal
turbines, there may be localized acceleration closer to the island as the current
splits to travel around the island that is not indicated in the NOAA data. As
indicated by the TRIM model, the shoal to the south of Alcatraz Island is a likely
location for accelerated current and should be investigated further.
If the NPS is seriously considering in-steam tidal energy, it should commission a
tidal current measurement study to be conducted at locations near to the island
and at the shoal south of the island. This will confirm if localized power densities
can support tidal turbines. In addition to the lack of tidal current information near
the island, tidal energy is still a relatively new technology with no fully commercial
tidal installations yet and a few demonstration installations currently in progress.
These factors may make tidal energy a less desirable renewable energy solution
for the island at present.

66
8 Reconnect to the San Francisco Power Grid
An alternative to the use of diesel generators on Alcatraz Island is to reconnect to
the San Francisco power grid and purchase energy from Pacific Gas and Electric
(PG&E). This was the original method of providing power to the island, and it is a
logical alternative to the diesel generators currently being used. Alcatraz Island
is located just off of the north coast of San Francisco in the Bay. Initially, Pacific
Gas and Electric (PG&E), the local utility, agreed to provide the cost estimate for
installing an undersea cable from San Francisco to Alcatraz Island; however,
being unable to perform this task, it was undertaken by the University of
Washington with the assistance of Mirko Previsic Consulting in Sacramento,
CA.69
A large portion of the cost for any cable installation is the price of the conductor
material copper, which is around $3 per pound. The remaining expenses include
burying the cable under the surface on the seabed floor and tying into the power
grid at both ends. This cost was estimated from a calculation performed for
another sea-cable installation with similar distances and loads. The cost of
copper for this installation is around $0.81 million while the installation cost is
$1.2 million.70 A value of $.5 million was added to this estimate to account for the
cost of connecting the cable at the substations on the both the mainland and
island.71 The total cost of reconnecting Alcatraz Island to the San Francisco grid
is estimated as $2.5 million if done in autumn 2007.
After Alcatraz Island has been reconnected to the power grid, the electricity
consumed will still have to be paid for. Although the cost of energy varies
depending on the time of year and the amount of power consumption, the
average cost of electricity in San Francisco is $0.14/ kWh.72 The NPS can
incorporate renewable energy into its system by purchasing “green” energy from

67the power company at an additional cost of $0.02/ kWh. 73 Also, a grid
connection can be used jointly with a solar energy system, and thereby used to
simplify the system significantly. If Alcatraz Island is connected to the San
Francisco grid in addition to having a solar energy system, it can draw power
from the grid during hours or days of insufficient solar energy production. This
completely removes the need for diesel generator use on the island or an energy
storage system. The economics of this arrangement are discussed in Chapter
11.

68
9 Energy Storage
Power that is produced at a coal or natural gas power plant does not need to be
collected and stored for future use, because the production can be adjusted to
accommodate the power demand. One of the shortcomings of renewable energy
is that it is unpredictable and is not always available when it is needed. This is
not a problem if the renewable energy system is connected to the power grid,
because any excess power that is produced can be deposited into the grid to be
taken out later when needed. Most energy meters measure power flow in both
directions, meaning that power going into the grid is subtracted from the power
taken out, giving a net consumption value. However, if a renewable energy
system does not have access to a power grid, it becomes necessary to harness
the renewable resource while it is available, convert it into energy and then store
it until it is needed. A stand alone renewable energy system should have enough
energy storage to last through a lull in its resource, such as a period of overcast
days for a solar system.
Even a hybrid diesel-renewable energy system that uses renewable energy when
available and diesel generators when it is not will require some energy storage.
The energy demand at Alcatraz Island in the evening is not high enough to justify
running the 210 kW rated diesel generator. The alternatives to this are switching
to the 80 kW rated generator in the evening or installing an energy storage
system that can supply the evening power demand. This system works by
absorbing excess energy produced during the day, either by the generator or the
renewable energy system, and storing it until the other systems are no longer
running, at which point it distributes the energy that it has collected. The two
types of energy storage systems that are considered for this project are a battery
bank and a pumped storage system.

699.1 Battery Storage
Batteries are the most common, reliable and efficient form of energy storage
available to date, which is why they are used most often in off-grid renewable
energy systems. However, they are also useful for a hybrid solar-diesel
generator system to provide energy during small load periods without having to
run the generator at low efficiency. Generally, a battery bank for an off-grid
renewable energy system without backup has to be sized for the worst case
scenario of the year regarding the renewable resource. Since solar is the only
resource capable of providing a significant portion of the demand, a battery bank
is sized according to the solar resource. However, Alcatraz Island has diesel
generators available for use, which means that not all of the energy has to be
provided by solar energy and battery storage. It was decided previously in this
study only to design a solar energy system large enough to provide the total
energy demand for July using strictly renewable energy, so the energy storage
system should correspond to the July demand and solar availability.
The size of a battery bank depends on several different factors, including the
average peak sunlight hours, the discharge depth of the batteries, the maximum
charge of the batteries and the daily electricity load. Batteries cannot be
discharged until they are empty and then charged until they are full again, in fact,
most lead acid batteries should not be discharged further than 30% of their
capacity and charged more than 80% in order not to damage them. This means
that a battery bank has to be sized at least twice as large as the amount of
energy storage required, without taking into account inefficiencies in charging the
batteries, temperature compensation factors and losses in the wires. Battery
storage capacity can be classified as critical or non-critical storage, critical
storage meaning that energy is available 99% of the time and non-critical
meaning that energy is available 95% of the time. Since there is not any power

70critical equipment located on Alcatraz Island, there is no need for a 99%
guaranteed power supply, especially since generator back-up is available if there
is a series of cloudy days. The battery capacity for storage is defined by the
number of “days of autonomy” required, which is a function of the average
number of peak sunlight hours over the period of desired autonomy. The
average hours of peak sunlight per day in San Francisco in July is 7.26 hours,
which will provide 1.09 days of non-critical storage, as calculated by Fackler.74
The daily power load at Alcatraz Island of 2350 kWh and the 1.09 days of power
available for non-critical storage, gives 2562 kWh of required energy storage. At
minimum, the battery bank would have to be sized at least twice this large, at
5124 kWh, and then increased further to account for inefficiencies in the system.
For a 48 volt battery, the minimum amount of battery storage would be 106,750
amp-hours. This is an extremely large battery bank and would be difficult to
accommodate and maintain on Alcatraz Island. Some batteries are very large
and require the use of a fork lift to move and replace them, making a large
system even less desirable. This is why it is decided not to follow the non-critical
storage guideline and instead design the system to provide enough storage for
only part of the day. The downsized battery bank for partial day storage is
discussed in Chapter 10.
9.2 Pumped Storage
Since batteries contain hazardous material and contribute to electronic waste if
not properly disposed, the National Park Service has requested an investigation
into alternative energy storage; resulting in the investigation of pumped storage
as a supplement to battery storage. A pumped storage system is in essence a
hydro power system that uses, as its source, water that has been pumped to a
higher elevation. Energy is stored in the potential energy of the water, which is

71then turned back into power as it is released through the turbine. Shown in
Figure 40, the water tower has a capacity of 250,650 gallons, is roughly 140 ft
above sea level, and is not currently in use; thus it has a good potential to act as
the reservoir for the pumped water.75
Figure 40: Water Tower on Alcatraz Island76
The tank was previously a fresh water storage vessel, so in order for it to endure
sea water, the tank would probably need to be treated or lined with a protective
coating to protect it from corrosion. It is possible to protect a steel tank from
corrosion by either treating the metal itself or by treating the fluid in the tank so it
does not contain corrosion inducing properties. Adding corrosion inhibitors to
salt water, such as alkaline material77 or tobacco78, can have dramatic results in
reducing corrosion on unprotected steel. Some inhibitors have been tested and
found to have no toxins or other negative effects on the composition of the salt
water, thus these corrosion inhibitors are environmentally safe and the treated

72water can returned to the ocean. It must be noted, though, that maintaining an
anti-corrosive mixture requires continual monitoring of the composition of the
water and periodic addition of the chosen inhibitor. This can increase both
material and labor costs drastically, making it less economically efficient when
compared to an anti-corrosion lining. Thus, for the purposes of this study only
anti-corrosive lining technologies will be further explored.
There are several types of anti-corrosion coatings. Some of the common
compositions used for anti-corrosion products include epoxy, alkyd, vinyl ester,
phenolic and zinc. These coatings are most commonly used in short-term
situations, as they tend to chalk, peel or fade over prolonged use, thus the issue
with this type of corrosion prevention is both cost and life expectancy. For
reference purposes it is estimated that a three coat epoxy/polyurethane coating
costs approximately $56.48 per square meter and has an estimated service life
of 10 years.79
Many products on the market that advertise corrosion resistance are also used
for wear resistance and thermal protection. Although a primer may be effective
in corrosion prevention, its cost is slightly deceiving as it is also necessary to
apply multiple layers as well as a topcoat in order to ensure proper protection. In
addition to the need for multiple layers each coat applied must be allowed time to
try before applying the next coat. In addition to the extended time needed for
drying, the metal surface needs to be cleaned of all prior paints and coats as well
as be free from any chemicals or rust. The time needed to prep the surface for
the primer coupled with the previously mentioned time requirements and
increased amount of layers increase both labor and material costs. Overall the
cost is similar to that of the three-coat epoxy/polyurethane coating specified
above, though its expected life is slightly longer. 80

73Other long-term solutions include the use of cathodic protection in anti-
corrosion coatings and paints. This is the most commonly used method of
corrosion prevention due to its low cost and long life expectancy. This method is
frequently used in large scale cases similar to that of the water tower making this
the optimal anti-corrosion coating.81
An example of a cathodic protection product is Si-COAT anti-corrosion coatings.
Si-COAT anti-corrosion coatings are a one-coat, room temperature applied
protective rubber coating. Specifically, Si-COAT 579 and 580 are used for
corrosion prevention on metals such as steel. The application process of this
product is fairly simple as there are no extreme conditions necessary when
applying the coating, including no need to mix chemicals and only minimal
surface preparation. It is not necessary to sandblast prior coatings off, as they
will be encapsulated by Si-COAT, leading to a 70% cut on application costs. It is
necessary, however, to remove any rust or oil, in which case sandblasting may
be necessary for the inside of the storage tank.82
Si-COAT has been proven to withstand extreme conditions such as exposure to
severe temperatures and corrosive chemical compounds. This type of coating is
intended for use on unprimed metal structures, tanks, buildings and roofs; thus
application to the interior of a steel tank is a reasonable use of this product. The
cost is approximately $31.28 per square meter, 45% cheaper than the previous
methods, and has an estimated service life of 25 years, a 250% improvement
when compared to epoxies.83
One aspect to be cautious of in cathodic protection is cathodic disbondment,
which is the loss of adhesion due to the properties used in cathodic protection for
anti-corrosion purposes. 84 The Si-Coat 579 has been specifically developed to
resist cathodic disbondment, which reduces risk of failure for this technology.85

74Thus, it is possible to protect the water tank against salt water corrosion. The
other aspects of the system are now discussed.
The energy storage comes from harnessing excess energy produced during the
day from a renewable energy system or generator to pump water up to the height
of the water tower where it then has potential energy. The water is stored at this
elevation until a time when energy can no longer be produced by the renewable
resource, and then it is discharged back down to sea level and run through a
hydroelectric turbine where its potential energy is converted into kinetic energy.
The total amount of energy that can be produced by this method is dependent
upon the height of the storage reservoir, the amount of water, and the efficiency
of each component. The number of hours a system can be run, or the power
rating, can be modified by changing the size of the discharge pipe.
The pump in a pumped storage system generally has an efficiency of 80%, so
there will be a 20% loss from the energy produced by the generator of the
renewable energy system to the potential energy of the water in the tower. The
efficiency of the hydroelectric system is a combination of the efficiency of the
piping, the turbine itself and the generator. As water descends through a pipe,
the friction between the flowing water and the walls of the pipe causes a pressure
loss in the system, reducing the pressure difference across the turbine and the
potential energy available.86 Only about 90% of the original potential energy of
the fluid is converted into kinetic energy. The turbine efficiency varies depending
on its size and consistency of power load. Pumped storage systems are
effective for utility grade systems; however, they are not as efficient for small
scale installations. At small scale, a fixed load impulse turbine has an efficiency
of up to about 80%, meaning it can convert 80% of the kinetic energy of flowing
water into rotational energy of the turbine.87 The generator has an efficiency of
up to 98% as it converts mechanical energy into electrical energy. Thus, the
overall efficiency of the pumped storage system is only 56%.

75
Including the energy losses from the piping, turbine and generator, the greatest
amount of energy that can be produced using a tank with the volume and height
of the one on Alcatraz is 85 kWh (see Appendix F for analysis). If the nighttime
load could be reduced to 17.5 kW, this system would last for 4.86 hours. This
value does not include energy loss as a result of a non-fixed load caused by
turning lights and appliances on and off. A hydroelectric turbine cannot respond
instantaneously to fluctuations in the load, so this is accounted for with a battery
buffering system that handles spikes and dips in the energy load while the
turbine provides the base load.88 Even if the nighttime load could be reduced,
this would not alleviate the need for an additional energy storage system or for
the generators to run for part of the night. Clearly, a pumped storage system
using the present water tower can only supplement a hybrid diesel-renewable
system and will not remove the need for some batteries, and in fact, small hydro
systems always interface to the electric load through a battery bank.

76
10 Solar Energy System Design
10.1 Solar Energy Justification
After considering all of the renewable energy resources in San Francisco Bay, a
solar energy system is determined to be the best energy solution. Wind energy
is eliminated from consideration as a renewable energy solution at Alcatraz
Island for several reasons. There is not a great enough wind resource at
Alcatraz Island to justify a wind turbine installation. Although the turbines would
be moving 75% of the time, they would only be running at their rated power about
1% of the time. Also, there is not space on the island to install enough turbines
to make a substantial contribution to the energy demand; the entire roof of the
Cell House covered with small turbines would produce 3% of the energy need for
the year. Also, Alcatraz Island is home to several species of birds that inhabit the
island from February until August. The presence of wind turbines could disrupt
their habitat and potentially cause them harm. The final reason is because wind
turbines would be very conspicuous on the island. Although this study considers
small turbines located close to the roof, wind turbines should be installed at least
ten meters above the tallest obstacle in an area, the Cell House in this case. It is
unlikely that a ten meter tall turbine on the roof of the Cell House would comply
with the historical preservation regulations of the island. Tidal energy also is
ruled out as a possibility for Alcatraz Island. This is not a final conclusion,
however, and is subject to change if new, favorable tidal data become available
showing that tidal current kinetic power of at least 0.8 kW/m² exists near Alcatraz.
For now, there is no proof that the tidal resource is present.
A solar energy system is determined to be not only the most practical renewable
energy system for installation at Alcatraz Island, but it will produce the greatest
amount of energy. Solar modules will lay flat or can be tilted on the roof of either

77the Cell House or the New Industries Building. The Cell House is by far the
tallest building on the island, so a solar installation on its roof won’t be seen by
the public. The roof of the New Industries Building can be seen from one
vantage point on the island, which is at the door that leads from the recreation
yard to the stairway down to the west side of the island. This makes it a less
desirable location in terms of aesthetics and historical preservation. It is possible
to produce the entire energy requirement for the island for the month of July with
an installation that fits on the roof of the Cell House, so there is an ample space
and solar resource.
10.2 Solar System Components
10.2.1 Solar Modules
The solar module is the backbone of a solar energy system. It is made from
multiple solar cells by which the solar radiation is collected and converted into
electricity. The modules are arranged in groups in series and parallel to create
an array and a combination of arrays makes the system89. A solar energy
system is only as effective as the panels of which it is comprised. Different solar
modules have a different voltage, current and efficiency based on their solar cell
efficiency and arrangement. The efficiency of a solar cell is dependent upon
multiple factors, including the semiconductor material used, the production
method of the semiconductor, and the manner and material used to create a
positively and negatively charged junction across the semiconductor.
The two solar modules chosen for this study are the SunPower 315 and Sanyo
200. These modules incorporate different, yet the most efficient solar cells
available on the market today. The SunPower panels use monocrystalline silicon
as the semiconductor material. The advantage of a monocrystalline structure is
the lack of impurities or gaps in the crystalline lattice that might impede electrical

78current. The drawback, however, is that monocrystalline silicon is very
difficult, expensive and time consuming to manufacture, because it takes more
time for a single element crystal to grow. SunPower panels have efficiency
ratings up to 19.3%, which is by far the highest efficiency available to date.
The Sanyo panels of interest use a combination of monocrystalline silicon and
thin film silicon layers termed HIT technology. By supplementing the
monocrystalline silicon with the easily manufactured thin film silicon, the amount
of base material is reduced. Although the HIT modules initially have efficiency
rated near 17.4%, they degrade over time to around 14% by the end of their
lifecycle. The final efficiency of the Sanyo panels is still as good as or better than
the efficiency of other brands at the beginning of their installation.
10.2.2 Battery Bank
The purpose of a battery bank in a renewable energy system installation has
been discussed in Chapter 9. It is decided that the size required for a battery
bank to provide non-critical autonomy is too large for the installation at Alcatraz
Island. A battery bank that can provide enough energy storage for half of the
day, specifically during the evening, would allow the island to be powered by
solar energy or diesel generators during the day and by batteries at night. Even
if batteries weren’t necessary to store any excess energy produced from solar
energy, they are beneficial for the diesel generator system.
An example of a solar installation similar to this particular situation can be seen in
the hybrid diesel-solar system installed in Grasmere, Idaho.90 This is a project
funded by the Energy Conservation Investment Program (ECIP) and
implemented by Idaho Power and Sandia National Laboratory. The power load
ranges from 30-90 kW and is supplied by two 210 kW rated diesel generators

79and a 75 kW rated solar array. This is very similar to the 98 kW average daily
load at Alcatraz Island, the 210 kW generators and the suggested 100 kW rated
solar system. Grasmere has a 1,440 kWh battery bank to accompany the daily
energy consumption of 1,047-1,609 kWh. The usable energy is only half the size
of the battery bank, so there are 720 kWh of energy storage available from the
batteries; this is roughly half of the daily load.
By having the batteries available to supplement the solar and diesel energy
supply, the diesel generators can run for less time and at their highest efficiency.
The generators at Grasmere only have to switch on when there is no solar
energy available and the batteries have reached their discharge depth, at which
point the generators supply power to the site and recharge the batteries. For
example, if the load is 90 kW, the generators can be operated at 180 kW, with
half of the output powering the site and the other half charging the batteries.
After 8 hours, the batteries are full and the generators can be turned off again.
The diesel generators at Grasmere observe 9-13 hours of run time each day,
rather than 24 hours, and the batteries are cycled completely every 1-2 days.
This extends the life of the diesel generators and of the batteries by allowing
them to be used most efficiently and under steady conditions.91 This is the same
practice that should be adopted at Alcatraz Island. A battery bank that is sized
for a full day of energy demand, 2350 kWh, will have half of a day’s supply of
usable energy. The island can then be powered by the batteries for at least half
of the day and the generators won’t have to be operated at low capacity. Due to
the size increments of batteries available and their necessary arrangement, it is
difficult to obtain a capacity of exactly 2350 kWh. The actual battery bank will
have a storage capacity of 2500 kWh.92 The price of a battery bank this size
ranges between $300,000 and $500,000, depending on the type of battery
incorporated.

8010.2.3 Inverter
The power output of a solar module is in DC form, the same at the battery bank,
but most appliances and equipment run on AC power, and power grids are
generally AC. All of the DC energy has to be converted into AC before it can be
put into the grid, which is done with the aid of an inverter. An inverter is sized
according to the amount of power that will be passing through it. In a hybrid
diesel-solar installation, energy has five paths: solar panels to the grid, solar
panels to the batteries, generators to the grid, generators to the batteries, and
batteries to the grid. As seen in Figure 41 below, three out of the five energy
transfers require the use of an inverter.
Figure 41: Diagram of the Components and Connections of a PV System93
There is a 98 kW average load at Alcatraz Island with daytime loads around 158
kW and evening loads at 41 kW. If the solar energy system is sized at 100 kW, it
means that in ideal conditions and peak daylight 100 kW is the most power that it
can produce. In this case, it would all go straight to powering the island with the

81remaining demand coming from the diesel generators. The inverter would
have to be sized at least as big as the solar energy system at 100 kW so that it
could handle all of the energy passing through it during peak load and solar
production. Energy that goes directly from the diesel generators to the grid does
not have to pass through the inverter because it is already AC, but energy that
travels from the generators to the batteries has to be converted into DC in the
inverter and then back to AC when it returns from the batteries into the grid. In
the instance of no sun, the inverter would have to be sized for the power traveling
from the generator to the batteries and then from the batteries to the grid. The
batteries will probably only be used during the evening, so the power passing
between them and the grid won’t be greater than 50 kW. However, if the
generators are being used to charge the batteries it is preferred to run them at
near their full capacity, which is 210 kW, so the capacity of the inverter should be
large enough to handle that load. For this reason, it has been decided to
incorporate a 200 kVA rated inverter in the design for Alcatraz Island.
This sized inverter was inspired by the inverter located at Grasmere. For the
Grasmere 90 kW load and 75 kW solar system, a 150 kVA rated SunEnergy
inverter is used.94 This provides room for expansion of the solar array if desired
and allows the generator to charge the batteries at 75% rated power. SunEnergy
is the only company currently producing inverters of this magnitude for an off-grid
installation. The company has inverters in every unit of ten up to 100 kVA and
then in increments of 200 kVA from 200 to 1000 kVA. 95 SunEnergy was
contacted to obtain inverter specifications and price information which has been
used in the economic analysis below. The estimated cost of a 200 kVA inverter
is $75,000 plus the cost of shipping.96 If the NPS decides to install a photovoltaic
system larger than 200 kW, the inverter will need to be upgraded and priced
accordingly.

8210.2.4 Charge Controller
The charge controller is used to protect the batteries by limiting the amount of
current that can flow to and from the battery bank.97 As mentioned previously,
batteries that are cycled should not be drained to less than 30% of their capacity
or filled to more than 80%. The charge controller prevents the batteries from
being either undercharged or overcharged, thus extending their lifespan. In
doing this, it has to compensate for the effect of temperature on the ability of the
batteries to receive charge. The final function of a charge controller is to regulate
the rate at which batteries are charged or discharged, as there is an optimal rate
which maximizes their useable life. The cost for the charge controller also comes
from SunEnergy, as the inverter and charge controller are sold as a set. The
estimated cost of a charge controller that can handle loads up to 200 kVA is
$25,000.98
10.2.5 Power Conductors
Power conductor refers to the wire that transfers power between the solar
modules, batteries, inverter, generators and the local grid. The cable is gauged
according to the amount of current that is passed through it. The wire that
attaches each panel of the sub-array in series and parallel is almost insignificant
compared to the wire that joins all of the sub-arrays and connects them to the
inverter. These lengths are measured off of the Solid Model drawings that have
been created for the Cell House and the New Industries Building. In each
scenario, the inverter, charge controller and battery bank are assumed to be in
the Power House, where the diesel generators are located (or in the basement of
the New Industries Building, which is near the Power House).
The gauge of the cable and the corresponding cost per length is dependent upon
the amount of power that is flowing through it. As mentioned previously, the cost

83of the conductor depends on the cost of copper, which is around $3 per pound.
The wire cost will be minimal compared to the cost of all of the other
components, resulting in 1-2% of the total system cost. 99 This number is
calculated and included in the economic analysis in Chapter 11.
10.2.6 Solar Module Support
The last major component of a solar energy system is the racking unit for the
solar modules. This will vary depending on the shape of the roof or installation
site and the desired tilt angle of the solar modules. A tilted panel installation on a
flat roof requires a racking system that can support and secure the panels at the
desired angle. For a slanted roof installation, it is unlikely that the roof will be
tilted at exactly the desired angle of installation, so a modifying rack will still be
needed. Even modules that are installed flat on a horizontal roof or aligned with
the angle of a slanted roof cannot just be bolted to the surface but require a
racking system. The efficiency of a solar module is inversely related to its
temperature. A solar system exposed to a certain amount of light can produce
more energy at a lower temperature than at a higher temperature. A racking
system can be used to elevate the module from the surface of the installation,
allowing air to flow below and above the panels, providing convective heat
transfer on both sides and keeping the modules cooler. Aside from setting the
modules at the correct orientation for solar harvesting, solar mounting racks
protect the modules and keep them in place. Solar modules are very expensive,
so a racking system is used to prevent them from detaching in the event of a
powerful wind storm.
The cost of a racking system for solar modules varies depending on each of the
factors listed above, as well as the module layout and the roof material. The
company Unirac is a custom solar module rack manufacturer and dealer. They

84have available on their website a program that can be downloaded, which is
able to make cost estimates for a solar module rack based on the size and
system parameters. 100 For the estimate, the modules are assumed to be
elevated off of the surface of the roof, a standard rail type with top mounting clips
is assumed, and the panels are grouped in rows of 8 modules. The cost of a
racking system for a horizontal array of 96 panels is between $6,200 and $6,500.
This cost is increased by as much as $3,000 per array by having the panels tilted
at 28°.
10.3 Solar Array Design
Once the solar modules, inverter and battery bank are selected and sized, it is
possible to design the solar system. There are several factors that contribute to
the size of each system considered and its arrangement on each building. A 100
kW system is a practical first system because of the 98 kW average load at
Alcatraz. The second solution is a 330 kW system because it can provide all of
the required energy for the month of July and varying portions of the energy need
for the remaining months. It is not practical to build a system larger than this
unless the island is reconnected to the San Francisco grid because the excess
energy produced will go to waste. The final option is to fill the entire roof of the
Cell House with solar modules; however, this size will vary depending upon the
panel orientation. The effects of tilting the solar panels up at their optimal angle
are also considered for each sized system. When a panel is laid horizontally its
orientation is unimportant, however, when a panel is tilted it is recommended to
have it facing directly toward the sun. In San Francisco the sun is to the south for
the entire year so the panels should be oriented to the south. The optimal tilt
angle is calculated to be 28°. The New Industries and Cell House buildings do
not face north-south but are turned at 30° and 45° degrees, respectively, which

85has to be accounted for when spacing the panels. The 15 scenarios
considered are broken down in Table 7.
Table 7: Solar System Location, Size and Layout.
Building System
Size Panel
Configuration New Industries 100 kW horizontal 100 kW tilted, facing south 100 kW tilted, facing 30° east of south Full Roof horizontal Full Roof tilted facing south Full Roof tilted facing 30° east of south
Cell House 100 kW horizontal 100 kW tilted, facing south 100 kW tilted, facing 45° west of south 330 kW flat 330 kW tilted, facing south 330 kW tilted, facing 45° west of south Full Roof flat Full Roof tilted, facing south Full Roof tilted, facing 45° west of south
Solid Models are constructed for both the Cell House and the New Industries
buildings, and each scenario is laid out for the two panels of interest. The
purpose of the model is to determine the layout and the exact number of panels
that could be installed on each roof and to measure how far the power
conductors will have to travel from each array to the batteries, inverter and
charge controller. The dimensions and shape of the roof of each building are
measured off of Google Earth, and the resulting area is verified with the 2002
Cathcart Study.101 The usable area on the roof of the New Industries Building is
15,300 ft² and 43,000 ft² on the Cell House. In order to lay out the solar panels,
first the panel arrays have to be constructed. The array size is dependent upon
the open circuit voltage (Voc) and short circuit current (Isc) of the solar modules
and the specifications of the inverter. The Voc of a solar module is its maximum
possible voltage that occurs when there is no current through it, and the Isc is its

86current when there is no voltage present. This relationship is represented in
Figure 42.
Figure 42: Current versus Voltage Curve for a 200 W Sanyo Solar Module102
The 200 kVA SunEnergy inverter has an allowable Voc of 600 Volts and Isc of 500
amps.103 The Sanyo panels have a Voc of 68.7 volts and Isc of 3.83 amps104,
while the SunPower panels have 64.6 volts Voc and 6.14 amps Isc.105 This means
that up to eight panels can be placed in series for the Sanyo panels and nine
SunPower panels can be laid in series. For ease of the analysis, each array was
divided into 12 sub-arrays connected in parallel formed by eight panels in
series.106 The purpose of breaking the entire system into arrays and sub-arrays
is to keep the total power flowing through the cables at a safe and reasonable
value. Due to the array restrictions, the systems could not be broken into exact
100 kW and 330 kW rated systems, so they were divided into groups of 96
panels closest to the desired values. The array sizes and rated power outputs
are listed in Table 8. The SunPower panels are slightly larger than the Sanyo
panels, as well as slightly more efficient; therefore fewer panels are required to
obtain the same system rating as the Sanyo panels.

87
Table 8: Solar Array Size and Corresponding Power Rating Sanyo Panel – 200 W SunPower 315 W
Desired Size (kW)
Number of Panels
System Rating (kW)
Number of Panels
System Rating (kW)
100 576 115 384 120330 1728 346 1056 332
10.4 Solar Energy Availability for New Industries Building The amount of energy available from a solar energy system depends upon the
amount of space available, the panels used, their tilt angle and orientation.
Although the New Industries Building has significantly less surface area than the
Cell House, at nearly 15,300 ft², it can still accommodate a large number of
panels. The yearly energy availability for the six different system sizes and
orientations on the New Industries Building is calculated using the SFO data and
the properties of the Sanyo and SunPower panels. The results of the analysis
are shown in Table 9. Since the yearly energy demand at Alcatraz Island is
857,600 kWh, the largest, most efficient solar system installed on the entire roof
of the New Industries Building could produce 38.9% of the yearly energy demand
on the island.

88Table 9: Solar System Power Output for New Industries Building
Sanyo Panel – 200 W SunPower Panel - 315 W
Building
System Size &
Orientation
Number of
Panels
System Rating (kW)
Yearly Power (kWh)
Number of
Panels
System Rating (kW)
Yearly Power (kWh)
New 100 kW, flat 576 115 190,853 384 120 193,295
Industries 100 kW, tilted south 576 115 208,688 384 120 211,182
100 kW, tilted 30°E 576 115 201,115 384 120 203,500
full, flat 768 153 254,471 672 211 333,826
full, tilted south 640 128 231,876 576 181 316,773
full, tilted 30°E 672 134 241,566 576 181 305,250
10.5 Solar Energy Availability for Cell House The yearly energy possible for a solar installation on the roof of the Cell House is
assessed next. The Cell House has 43,000 ft² of usable space on the roof. The
nine different scenarios for the Cell House are modeled and their yearly power
outputs are calculated using both Sanyo and SunPower panels. The results are
shown in Table 10 below. In some cases, the power available from a tilted
system is less than that from a horizontal system because fewer panels can be
installed on the roof. The most efficient panels installed horizontally on the entire
roof of the Cell house could produce 73.3% of the yearly energy demand. Due to
space limitations on the roof, it is not possible to install a 330 kW tilted, south
facing system on the roof of the Cell House using either of the modules of
interest. The largest titled, south facing systems that the Cell House can
accommodate are rated at 302 kW and 307 kW.

89Table 10: Solar System Output for Cell House Building
Sanyo Panel – 200 W SunPower Panel - 315 W
Building
System Size &
Orientation
Number of
Panels
SystemRating (kW)
Yearly Power (kWh)
Number of
Panels
System Rating (kW)
Yearly Power (kWh)
Cell House 100 kW, flat 576 115 190,853 384 120 193,295
100 kW, tilted south 576 115 208,688 384 120 211,182
100 kW, tilted 45°W 576 115 201,115 384 120 203,500
330 kW, flat 1728 346 572,560 1056 332 531563
330 kW, tilted south N/A N/A
330 kW, tilted 45°W 1728 346 608,487 1056 332 564964
full, flat 1728 346 572,560 1248 393 628211
full, tilted south 1536 307 556,502 960 302 527955
full, tilted 45°W 1728 346 608,487 1068 336 564964

90
11 Economic Analysis
When assessing a renewable energy system, it is necessary to consider the
resulting cost of energy as well as the amount of energy available. Unlike energy
purchased from the power company that has a set rate, the cost of renewable
energy is a function of the price of the installed system and operation versus the
amount of energy produced. A renewable energy system that is able to produce
more energy than another system with the same installed cost is going to have a
lower cost of energy. An annualized economic analysis is used to calculate the
total yearly cost and the energy cost for several combinations of hybrid,
renewable, diesel and grid-tied systems.
The annuity method determines the yearly cost of an energy system by
transforming the capital investment into a yearly expense that is spread out over
the lifetime of the system and combining it with the operating cost of the
system.107 This method is explained in Appendix G. Solar panels have a
lifespan of 20 years; however, the inverter and charge controller have an
estimated lifetime of 10 years and batteries have a minimum useful life of 5
years, so the cost of replacing them has to be included in the capital investment
of the system. The batteries for the hybrid diesel-solar system at the Grasmere
installation did not have to be replaced until they had been used for 12 years, so
a battery lifespan of 10 years is assumed, meaning the batteries have to be
replaced once in the lifetime of the system.108 A present value calculation is
used to find the current cost of replacing all of the major equipment in 10 year’s
time, except the solar panels, racking and conductors. The installation cost of
the system is also considered a capital expense, so a common estimate of 10%
of the equipment cost is incorporated into the analysis. A conservative interest
(discount) rate of 8% is used for the capital investment and a standard top down
approximation for operating and maintenance cost of 2% of the capital

91investment is assumed.109 Diesel fuel is taken at $3/gallon, the price in early
autumn 2007.
11.1 Solar Energy System
As mentioned previously, the main components of a solar photovoltaic system
include the solar modules themselves, the inverter, charge controller, battery
bank, power conductors and racking system. It is clear that a stand-alone
renewable energy system will not be possible at Alcatraz Island, so the solar
energy system will only supplement the energy produced by the diesel
generators or energy purchased from the power grid should Alcatraz Island be
reconnected to Pacific Gas and Electric. The price estimate for the Sanyo HIP –
200BA3 panels is used to compare the energy cost of 115 kW and 346 kW rated
hybrid solar-diesel systems with the 115 kW and 346 kW grid-tied solar systems.
Since these systems are rated slightly higher than the 100 kW and 330 kW
systems analyzed in Chapter 5, the power output also will be slightly greater. In
the case of the hybrid diesel-solar energy system, the cost of diesel fuel,
transportation and the equivalent cost of the pollution into the environment is
included in the calculation. For the grid-tied solar energy system, the cost of
reconnecting the island to the San Francisco power grid is included.
11.1.1 Hybrid Diesel-Solar Power System
11.1.1.1 115 kW Hybrid Diesel-Solar Energy System with Battery Storage
A cost analysis of the 115 kW rated hybrid system is presented first. This
analysis includes not only the cost of the solar photovoltaic system components
and installation but also the cost of the diesel fuel required to supply the
difference between the energy demand and solar energy system production and
the cost of pollution. For every gallon of diesel fuel that is burned, there is a

92given amount of CO2, SO2 and NOx emitted into the atmosphere, and each of
these pollutants has a cost associated with it. These values are listed in Table
11. The equivalent cost of pollution is calculated by converting energy demand
into diesel fuel consumption and then determining the quantity of each pollutant
emitted and multiplying it by its cost.
Table 11: Diesel Emissions and Costs110
Gas Emissions
(lb/1000 gal diesel) Cost ($/lb)
CO2 23,800 0.01SO2 29 0.85NOx 575 3.40
The energy production of the four different panel orientations and their resulting
energy costs are considered. A 115 kW rated horizontal panel orientation solar
system can produce 22.2% of the yearly energy demand. If the panels are tilted
up at an angle of 28° and faced true south, they can produce 24.3% of the yearly
demand. A 28° tilted panel configuration facing 30° east of south can make
23.4% of the demand, and a 45° west of south facing system can make 23.6% of
the yearly energy demand. The more energy that a system can produce means
the less energy that has to be supplied by diesel fuel, which brings the total cost
down. The resulting cost of electricity for a 15 kW rated system at each
orientation is shown in Table 12.

93Table 12: Economic Analysis for a 115 kW rated Hybrid System
Hybrid Solar PV/Diesel Generator System w/Battery Backup
Panel Orientation Horizontal
Tilted 28° Facing
due South
Tilted 28° Facing 30°
East of South
Tilted 28° Facing 45°
West of South Number Panels 576 576 576 576 Rated Power (kW) 115.45 115.45 115.45 115.45 Percentage of Yearly Energy Demand 22.25% 24.33% 23.45% 23.65% Required Area (ft^2) 15393.79 15393.79 15393.79 15393.79
Module Location Cell House or
New Industries Cell House or
New Industries Cell House or
New Industries Cell House or
New Industries
Capital Cost Solar Module ($) 622,080.00 622,080.00 622,080.00 622,080.00 Inverter ($) 80,000.00 80,000.00 80,000.00 80,000.00 Battery & Replacement ($) 541,381.59 541,381.59 541,381.59 541,381.59 Charge Controller ($) 25,000.00 25,000.00 25,000.00 25,000.00 Solar Module Rack ($) 38,580.00 55,356.00 55,356.00 55,356.00 Power Conductor ($) 26,140.83 26,476.35 26,476.35 26,476.35 Installation Cost ($) 133,318.24 135,029.39 135,029.39 135,029.39 Yearly Cost Annual Capital ($/yr) 141,218.16 143,135.29 143,135.29 143,135.29 Annual Operating ($/yr) 2,824.36 2,862.71 2,862.71 2,862.71 Diesel Cost ($/yr) 148,915.48 144,932.14 146,623.45 146,240.82 CO2 cost ($/yr) 8,269.77 8,048.56 8,142.49 8,121.24 SO2 cost ($/yr) 1,202.49 1,170.33 1,183.98 1,180.89
NOx cost ($/yr) 97,043.26 94,447.44 95,549.62 95,300.27 Total Yearly Cost ($/yr) 399,473.52 394,596.47 397,497.54 396,841.21 Cost of Energy ($/kWh) 0.4679 0.4622 0.4656 0.4649
As expected, the solar energy system with the greatest energy output has the
smallest cost of energy, and the solar system with the least production has the
most expensive energy cost. As seen in the Table 12, there is not a significant
reduction in the cost of energy by tilting the panels. The increased cost of the
racking system almost makes up for the extra energy produced by tilting the
panels.

9411.1.1.2 346 kW Hybrid Diesel-Solar Energy System with Battery Storage
The next cost analysis, shown in Table 13, is for the 346 kW rated hybrid system.
The economy of scale principle indicates that the average energy cost should
decrease with an increase in the size of the energy system. This is because the
cost of an energy system does not increase linearly with the size of the system,
but its energy production does. Also, a larger renewable energy system requires
less diesel energy, resulting in a decrease in the cost of diesel fuel as well as the
associated emissions penalties. Both of these factors dictate that the larger solar
energy system should have a lower cost of energy than its smaller counterpart,
but according to the economic analysis, seen in Table 12, there is a very slight
increase in electricity cost for each system. The same unit cost is used for the
panels and the racks in both economic analyses; however, this will probably not
be the case for a purchase order of this magnitude. Also, the cost of the inverter
and charge controllers are scaled linearly with their size, which may not be the
case. These factors account for the absence of energy cost savings for the large
system.

95Table 13: Economic Analysis for a 346 kW rated Hybrid System
Hybrid Solar PV - Diesel Generator System with Battery Storage
Solar Module Orientation Horizontal
Tilted 28° Facing
due South
Tilted 28° Facing 30°
East of South
Tilted 28° Facing 45°
West of South Number of Modules 1728 1728 1728 1728 Rated Power (kW) 346.36 346.36 346.36 346.36 Percentage of Yearly Energy Demand 66.58% 73.00% 70.35% 70.95% Required Area (ft^2) 46181.38 46181.38 46181.38 46181.38
Module Location Cell House or
New Industries Cell House or
New Industries Cell House or
New Industries Cell House or
New Industries
Capital Cost Solar Module ($) 1,866,240.00 1,866,240.00 1,866,240.00 1,866,240.00 Inverter ($) 160,000.00 160,000.00 160,000.00 160,000.00 Battery Bank & Replacement ($) 541,381.59 541,381.59 541,381.59 541,381.59 Charge Controller ($) 50,000.00 50,000.00 50,000.00 50,000.00 Solar Module Rack ($) 115,740.00 166,068.00 166,068.00 166,068.00 Power Conductor ($) 27,333.62 27,836.90 27,836.90 27,836.90 Installation Cost ($) 276,069.52 281,152.65 281,152.65 281,152.65 Yearly Cost Annual Capital ($/yr) 293,004.84 298,699.85 298,699.85 298,699.85 Annual Operating ($/yr) 5,860.10 5,974.00 5,974.00 5,974.00 Diesel Cost ($/yr) 64,008.46 51,713.03 56,786.97 56,041.61 CO2 cost ($/yr) 3,554.60 2,871.80 3,153.57 3,112.18
SO2 cost ($/yr) 516.87 417.58 458.55 452.54 NOx cost ($/yr) 41,712.18 33,699.66 37,006.18 36,520.45 Total Yearly Cost ($/yr) 408,657.04 393,375.91 402,079.12 400,800.62 Cost of Energy ($/kWh) 0.4799 0.4628 0.4730 0.4715
The energy cost for the large hybrid solar-diesel energy systems follows the
same trend as the smaller energy system. The tilted, south facing panels are the
least expensive, the tilted, 45° angled panels are second, the tilted, 30° angled
panels are third and the horizontal panels are the most expensive. However, the
cost differences are very small for the large solar system: the difference in the
cost of energy between the four different module orientations is a maximum of
$0.017 per kWh of energy.

9611.1.2 Grid-Tied Solar System The alternative to having battery storage for a renewable energy system is to tie
into the power grid. This removes the cost of a battery bank from a renewable
energy system, as well as the cost of diesel fuel and its equivalent emissions
costs. If Alcatraz Island is connected to the power grid, it can draw power from
PG&E when needed and put power into the grid when excess renewable energy
is available, eliminating entirely the need for diesel generators and energy
storage. However, there is an additional cost of relaying the power grid and
connecting it at both ends. Table 14 and Table 15 below demonstrate the
economics of installing a solar energy system of the same size as those
considered above in combination with an undersea cable connection.

97
11.1.2.1 115 kW Grid-Tied Solar Energy System
Table 14: Economic Analysis for a 115 kW Grid-Tied Solar System Solar PV System with Grid Connection
Panel Orientation Horizontal
Tilted 28° Facing
due South
Tilted 28° Facing 30°
East of South
Tilted 28° Facing 45°
West of South Number Panels 576 576 576 576 Rated Power (kW) 115.45 115.45 115.45 115.45 Percentage of Yearly Energy Demand 22.25% 24.33% 23.45% 23.65% Required Area (ft^2) 15393.79 15393.79 15393.79 15393.79
Module Location Cell House or
New Industries Cell House or
New Industries Cell House or
New Industries Cell House or
New Industries
Capital Cost Solar Module ($) 622,080.00 622,080.00 622,080.00 622,080.00 Inverter ($) 80,000.00 80,000.00 80,000.00 80,000.00 Charge Controller ($) 25,000.00 25,000.00 25,000.00 25,000.00 Solar Module Rack ($) 38,580.00 55,356.00 55,356.00 55,356.00 Power Conductor ($) 26,140.83 26,476.35 26,476.35 26,476.35 Sea-Cable ($) 2,500,000.00 2,500,000.00 2,500,000.00 2,500,000.00 Installation Cost ($) 329,180.08 330,891.24 330,891.24 330,891.24 Yearly Cost Annual Capital ($/yr) 360,656.73 362,573.86 362,573.86 362,573.86 Annual Operating ($/yr) 7,213.13 7,251.48 7,251.48 7,251.48 Grid Energy ($/yr) 93,345.06 90,848.18 91,908.35 91,668.50 Total Yearly Cost ($/yr) 461,214.93 460,673.51 461,733.68 461,493.83
Cost of Energy ($/kWh) 0.5399 0.5393 0.5405 0.5402
The cost of energy for a grid-tied solar system compared to a hybrid system is
greater by $0.07 per kWh in each scenario; however, the ranking from least to
most expensive is slightly different. In this situation, the improved energy
production of the non-true south facing, tilted panel orientation is not enough to
compensate for the increased cost of the tilted racking system.

9811.1.2.2 346 kW Grid-tied Solar Energy System
Table 15: Economic Analysis for a 346 kW Grid-Tied Solar Energy System Solar PV System with Grid Connection
Solar Module Orientation Horizontal
Tilted 28° Facing
due South
Tilted 28° Facing 30°
East of South
Tilted 28° Facing 45°
West of South Number of Modules 1728 1728 1728 1728 Rated Power (kW) 346.36 346.36 346.36 346.36 Percentage of Yearly Energy Demand 66.58% 73.00% 70.35% 70.95% Required Area (ft^2) 46181.38 46181.38 46181.38 46181.38
Module Location Cell House or
New Industries Cell House or
New Industries Cell House or
New Industries Cell House or
New Industries
Capital Cost Solar Module ($) 1,866,240.00 1,866,240.00 1,866,240.00 1,866,240.00 Inverter ($) 160,000.00 160,000.00 160,000.00 160,000.00 Charge Controller ($) 50,000.00 50,000.00 50,000.00 50,000.00 Solar Module Rack ($) 115,740.00 166,068.00 166,068.00 166,068.00 Power Conductor ($) 27,333.62 27,836.90 27,836.90 27,836.90 Sea-Cable ($) 2500000 2500000 2500000 2500000 Installation Cost ($) 221,931.36 227,014.49 227,014.49 227,014.49 Yearly Cost Annual Capital ($/yr) 486,980.36 492,675.37 492,675.37 492,675.37 Annual Operating ($/yr) 9,739.61 9,853.51 9,853.51 9,853.51 Grid Energy ($/yr) 39,906.07 32,415.41 35,595.92 34,876.37 Total Yearly Cost ($/yr) 536,626.04 534,944.28 538,124.79 537,405.25 Cost of Energy ($/kWh) 0.6298 0.6279 0.6316 0.6307
Similar to the results from the hybrid diesel-solar system analysis, it does not
appear to be more economical to install a larger system, as would be expected
for an energy system. In fact, the increase in the energy cost for all four panel
configurations is roughly $0.09 more for a 346 kW rated system than a 115 kW
rated system. This is not an insignificant amount of money. Grid energy is
cheaper than energy produced by solar panels or diesel generators, so it is not
beneficial to build a larger renewable energy system in order to reduce the
amount of energy purchased from the grid.

9911.2 San Francisco Grid Power
The San Francisco energy grid was the original source of power for Alcatraz
Island, and so is an obvious alternative to diesel generators for powering the
island. The costs associated with reconnecting Alcatraz Island to the power grid
in descending order are the installation of the cable on the sea floor, the cost of
the actual cable, and then the cost to tie the cable into the power grid on the
mainland and the island. After the cable has been installed, the energy
consumed still has to be purchased. The normal rate of power from PG&E is
$0.14/kWh, and energy produced from a renewable source can be purchased at
an additional cost of $0.02/kWh. The cost of energy for an independent grid-tied
system is seen in Table 16. For the purpose of consistency, this analysis
assumes the same lifetime (20 years), interest (8%), and O&M (2%) as used
elsewhere in the economic analysis. (The reasonableness of the 2% O&M has
not been verified.) These assumptions also were used in the grid-tied solar
system economics of the previous section.
Table 16: Economic Analysis for Stand Alone Grid-Tied Energy System
Grid-tied System Regular Energy "Green" Energy Energy Need (kWh/yr) 857,604.00 857,604.00 Component Cost Sea-Cable ($) 810,000.00 810,000.00 Installation ($) 1,200,000.00 1,200,000.00 Connection ($) 500,000.00 500,000.00 Annual Cost Annual Capitol ($/yr) 255,649.04 255,649.04 Annual Operating ($/yr) 5,112.98 5,112.98 Grid Power Cost ($/yr) 120,064.56 137,216.64 Total Yearly Cost ($/yr) 380,826.59 397,978.67 Cost of Energy ($/kWh) 0.44 0.46
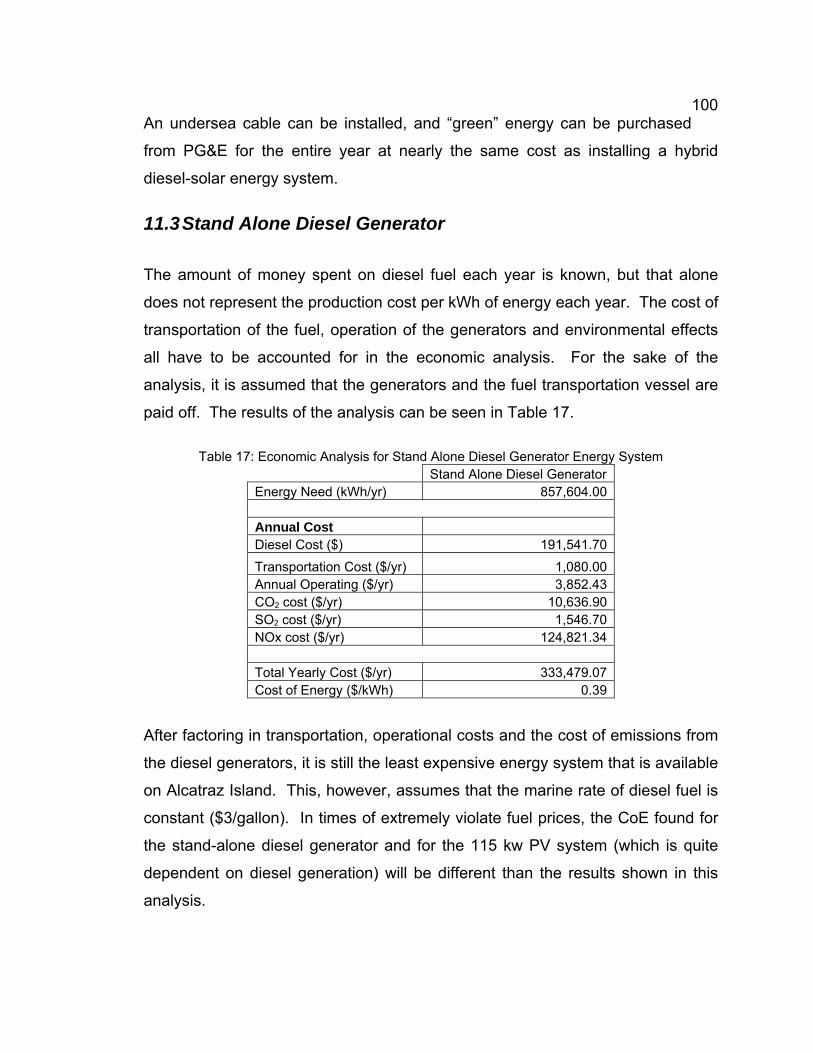
100An undersea cable can be installed, and “green” energy can be purchased
from PG&E for the entire year at nearly the same cost as installing a hybrid
diesel-solar energy system.
11.3 Stand Alone Diesel Generator
The amount of money spent on diesel fuel each year is known, but that alone
does not represent the production cost per kWh of energy each year. The cost of
transportation of the fuel, operation of the generators and environmental effects
all have to be accounted for in the economic analysis. For the sake of the
analysis, it is assumed that the generators and the fuel transportation vessel are
paid off. The results of the analysis can be seen in Table 17.
Table 17: Economic Analysis for Stand Alone Diesel Generator Energy System
Stand Alone Diesel Generator Energy Need (kWh/yr) 857,604.00 Annual Cost Diesel Cost ($) 191,541.70
Transportation Cost ($/yr) 1,080.00 Annual Operating ($/yr) 3,852.43 CO2 cost ($/yr) 10,636.90 SO2 cost ($/yr) 1,546.70 NOx cost ($/yr) 124,821.34 Total Yearly Cost ($/yr) 333,479.07 Cost of Energy ($/kWh) 0.39
After factoring in transportation, operational costs and the cost of emissions from
the diesel generators, it is still the least expensive energy system that is available
on Alcatraz Island. This, however, assumes that the marine rate of diesel fuel is
constant ($3/gallon). In times of extremely violate fuel prices, the CoE found for
the stand-alone diesel generator and for the 115 kw PV system (which is quite
dependent on diesel generation) will be different than the results shown in this
analysis.

101
12 Electrical Considerations, Details, and Wiring Diagrams
12.1 Overview
The electrical considerations of the 115 kW and 346 kW horizontally mounted
Sanyo PV-hybrid systems are presented in this section. The systems have been
designed in accordance with the National Electrical Code. The cases treated can
be used as guidelines for any system larger or smaller with similar electrical
generation components. For each system, the daily load is assumed constant.
In addition, each system incorporates both of the existing 210 kW gensets;
however, it would not be difficult to modify the electrical configuration if the solar
generator was augmented and a genset was removed or another completely
different generator was added such as a wind or tidal turbine.
12.2 Solar PV Modules
Both of the systems are composed of the Sanyo HIP-200BA3 200 watt solar
modules. The module specifications necessary for the electrical design are listed
in Table 18. Table 18: Design Specs for the Sanyo HIP-200BA3 Module.
Max Power
Voltage, Vpm (V)
Max Power
Current, Ipm (A)
Open Circuit
Voltage, Voc (V)
Short Circuit
Current, Isc (A)
Max system Voltage
(V)
Series Fuse
Rating (A)
Temperature Coefficient
for Pmax (%/°C)
55.8 3.59 68.7 3.83 600 15 -0.29 Virtually any panel could be selected. The main reason to employ a high
efficiency PV module is to be able to place as many modules as possible in the
space available. There is a space constraint if all of the panels are to be
mounted on the New Industries Building. This building could accommodate the
entire 115 kW array, but a 346 kW array would not fit in the space. For the
analysis in this chapter, both the small and large arrays composed of Sanyo HIP

102200BA3 solar PV modules are mounted horizontally on the roof of the Cell
House with the balance of system components (inverter, charge controller, and
battery bank) located in the Power House where the gensets currently reside.
(An alternative location for the power electronics and batteries is the basement of
the New Industries Building.) As shown in Figure 43 the Cell House is further
away from the Power House than the New Industries Building; however, it can
accommodate both array sizes and would have to be used if the NPS decides to
purchase an array larger than about 150-200 kW.
Figure 43: A CAD depiction of Alcatraz Island from the North.111
The main specification to consider when putting together a system of this size is
the operating voltage of the module. In a small system it is common to size the
array to operate at 120 volts or less; however, a 100 kW array composed of
Sanyo panels with the above specifications and wired to 120 volts in series,
would output a very large current (over 1000A). Power loss in a conductor is
proportional to the operating current squared; thus, large currents are
undesirable from a power loss perspective. The inverter selected has a
maximum input voltage of 600VDC. Using a module with a larger output voltage

103would reduce the number of modules required to be wired in series. With an
open circuit voltage of 58.6VDC, eight Sanyo HIP 200BA3 modules can be safely
wired in series for a maximum VOC of 549.6VDC.
12.3 Inverter
SunEnergy is an Australian company that is one of the only companies that
manufactures inverters for use in large scale off-grid installations. Its inverters
come in units of 10 to 100 kVA and then in increments of 200 kVA from 200 to
1000 kVA. It was first thought to use a 100 kVA inverter with the Alcatraz system
as the base, since it would be about the same size as the small solar array. An
inverter this size would be sufficiently large enough to invert 100 kW from the
array. However, one generator could only charge the batteries at half of its rated
output; leading to extended run time which causes greater fuel consumption
because of a lower operating efficiency at part load and greater maintenance
cost due to extended hours of operation. In addition, a larger array or other
renewable inputs could not be supplied to the site in the future without buying a
larger inverter. Thus, it is decided to size the inverter to be at least large enough
for one of the 210 kW gensets to charge the batteries close to its peak efficiency.
It is recommended that the solar/genset system be a dual diesel system with a
200 kVA inverter. PV and diesel generators have complementary characteristics.
A PV system has a high capital cost, low operating costs and maintenance
requirements, while a diesel system has low capital cost, but high operating costs
and maintenance requirements. In addition, a diesel genset is available on
demand, while the PV is dependent on the weather and time of day. Coupled
together, PV and diesel gensets can provide a more reliable and cost effective
system than either PV or diesel alone. The bidirectional inverter will work with
the genset pair to provide optimal loading on the diesel and during peak loads

104can support the diesel to provide power of virtually the sum of the diesel and
inverter ratings as shown in Figure 44.
Figure 44: Generalized diagram of renewable/genset interaction for varying electric load.
With a 200 kW PV array, a 200 kVA inverter, and a 210 kW diesel genset, it will
be possible to provide peak loads up about 410 kVA. When there are low
building loads, the inverter will shut the diesel off and the battery and renewable
generation will provide the entire building load. When there are intermediate
loads, the diesel will provide the entire building load and aid the renewable
generation to provide optimal charging to the batteries. The main advantages to
this system are:
1. The gensets are always operating near full load; thus reducing fuel,
operating, and maintenance costs.
2. The diesel can be completely turned off.
3. Both diesels are run in an alternate manner.
In general, there are three primary operational modes for this system. When the
battery is close to full charge and there is relatively low power requirement, the
diesel generator will be turned off and the all of the power will be drawn from the
battery bank and solar generator. When the battery bank is at a low state of
charge and there are building medium sized building loads, the solar generator
will charge the battery bank and the diesel generator will be operating near full
capacity with part of the power going to the building load and the rest charging
the battery bank. During periods of peak building load, which should be limited to

105a few minutes for a properly designed system, the solar generator, the
battery bank, and the genset supply power to the building load.
Figures 45 and 46 can help further illustrate what a typical power
producing/consuming five day period may look like at Alcatraz. For example,
there is a battery bank with 2500 kWh of storage, a 100 kW PV array, a 400 kVA
inverter, and two 210 kW gensets. The solar resource is a generic
representation of an average sunny day during the spring in San Francisco. The
load is representative of the power draw averages for day and night time hours
as outlined in Chapter 3. (Note that energy load is plotted negative in Figure 45 –
increasing downward.) The set point for the battery bank is set to 55% state of
charge, SOC, meaning that at least one generator will turn on automatically when
the battery bank falls below 55% SOC.
At the beginning of the first day the SOC of the battery bank is hovering just
above the set point. There is no solar contribution and the building load is
drawing its night time average of 41 kW. At about 2:00 am one of the 210 kW
gensets turns on for an hour taper charging the battery to a state above the set
point. As the day goes on, the solar contribution ramps up, but so does the
building load; thus, there is still need for periodic trickle charging of the battery
bank. At about midnight near the end of the first day, both diesel generators turn
on and bulk charge the battery bank back to full SOC, while powering the
building load simultaneously. In this particular model, if 24 hours goes by and
the battery bank has not been charged to full capacity then a bulk charge
initiates; the second diesel generator turns on at full capacity, the battery is
charged back to 100% SOC, and the cycle repeats itself.

106
-195
-95
5
105
205
305
405
12:00 AM 12:00 AM 12:00 AM 12:00 AM 12:00 AM 12:00 AM
Time of Day (hrs)
Ener
gy P
rodu
ctio
n/C
onsu
mpt
ion
Solar Contribution(kWh) Load (kWh)
Diesel GensetContribution (kWh)
Figure 45: A model representation of a typical 5 day charging/discharging schedule for Alcatraz.
0
0.2
0.4
0.6
0.8
1
1.2
12:00 AM 12:00 AM 12:00 AM 12:00 AM 12:00 AM 12:00 AM
Time of Day (hrs)
Bat
tery
Sta
te o
f Cha
rge
Figure 46: Battery Bank SOC corresponding to the charging/discharging cycle in Figure 45.

107It should be noted that the length of time the generator will run per day will
decrease as the solar array is augmented. If there is a large enough solar array
there will be no need for as many periodic trickle charges throughout the day;
however, there should always be a scheduled bulk charge every 2-5 days to
ensure proper battery health. The charging/discharging schedule will also
change with weather and size of battery bank. As mentioned before, the addition
of a solar generator has allowed the diesel genset pair to run for a fraction of the
day at full capacity, instead of all day long at a fraction of its capacity.
Increasing the size of this array will further decrease the run time of the gensets.
A 200 kVA rated inverter could be used for a 115 kW rated system; however, the
second genset would be strictly used to power building loads while the first
genset is charging the battery. A 400 kVA rated inverter would be employed for
the 346 kW rated system to provide an adequate inverting capacity for periods of
high solar resource, and this inverter would allow both gensets to aid in the bulk
charge. In addition to providing a factor of safety, a 200 kVA inverter would leave
room for additional solar PV modules to be added to the 100 kW system and
allow the 210 kW generator to run at almost full capacity. The 200 kVA rated
inverter is quoted at $75,000 plus the cost of shipping the unit from the east
coast of the US, and for the 400 kVA inverter, cost nearly doubles. In addition to
the inverter, a solar charge controller is required which costs an additional
$20,000 per 200kVA, and the brains behind the dual diesel control are expected
to add another approximately $10,000 to the overall system cost. The economic
analysis of Chapter 11 assumes a 200 kVA inverter for the 115 kw PV system
and power electronics costs of $80K+$25K (the same total as here), whereas for
the 346 kw system, the 400 kVA inverter with power electronics costs of
$160K+$50 (the same total as here) are assumed.

10812.4 Battery Bank
The battery bank is the next item to be sized and priced. Generally the energy
storage for an off-grid PV system is sized to provide a number of days of
autonomy. This corresponds to the maximum number of days a site would have
to run off of battery power due to lack of sun exposure, which is 1.09 days for
San Francisco in July. Since average energy consumption at Alcatraz is 2350
kWh, this means at least 2,500 kWh of battery storage is needed for the diesel
generator not to be used in July. It is common practice to size a battery bank
twice or more times the adjusted storage requirement, not including power losses
in the line and inefficiency in the charging/discharging procedure. These safety
factors lead to an extremely large and expensive battery storage system. Both
due to the large diesel generator already in place and the high cost of batteries,
the normal rules of thumb for sizing a battery bank have been overlooked. The
battery bank has been sized for 2500 kWh total capacity, about ½ of which can
be used. Although the diesel generator will have to be turned on every day, the
inverter along with the PV array will help to decrease the generator run time from
all day to about 7-14 hours per day depending on the size of the installed PV
array.
The estimated cost of a battery bank this size is between $300,000 and $500,000
depending on the battery cell chosen. The low end of the spectrum corresponds
to a large battery with a high voltage but equivalent capacity. For example, a
SunEnergy 200 kVA inverter is designed to charge a 360V battery bank. The
two flooded lead-acid cells that are being considered are the C&D CPV-2500
rated at 2 volts per cell and 2041 amp-hours, and the Surrette 8-CS-25PS rated
at 8 volts per cell and 1156 amp-hours. A 2500 kWh battery bank at 360V would
need to be composed of 4 strings of 180 C&D cells, while the same size battery
bank would need to be composed of 8 strings of 45 Surrette cells. Clearly fewer
cells would have to be purchased if Surrette is used; consequently, this battery

109bank would be cheaper by about $200,000. However, a couple of
maintenance considerations do not make this an easy choice. First, each
Surrette cell weighs about 600 lbs, in comparison to about 100 lbs for the C&D
cell. After speaking with various institutions that maintain large battery banks, it
became clear that it is far easier to maintain a battery bank composed of small
cells.112 Not only does the 8 volt battery charge and discharge in a more non-
uniform manner than a 2 volt battery, if it has to be replaced or serviced, a forklift
must be employed, whereas maintenance technicians can handle the smaller
battery alone. Because of these reasons and numerous case studies of proven
reliability for the C&D battery, it is recommended for this application; however,
the large price difference may also affect the final choice. The economic analysis
of Chapter 11 assumes the $300,000 battery bank cost.
It is important to recognize the charging and discharging considerations when
employing a small battery bank for a relatively large rate of energy consumption.
The battery bank will complete a cycle every 1 to 5 days. Especially during
periods of low solar insolation, the genset will have to run for a good portion of
the day to fully charge the batteries and help to limit capacity loss. Basically,
instead of the diesel generator running all day long at half load or less, the
genset will be running for 7 to 14 hours per day at full load, which is much more
efficient in terms of fuel consumption and reduces engine maintenance.
Following the example of the solar PV hybrid project at Grasmere, Idaho, there
are a couple of operating parameters that should be noted.113 The discharge
termination voltage should be limited to about 1.98 vpc (volts per cell). This
corresponds to a depth of discharge of about 55%. The recharge termination
voltage and bulk charge voltage should be about 2.55 vpc. It is found that the
battery maintains its capacity best with a bulk charge every 5th cycle for 5 to 6
hrs. 114 The Grasmere project also proved that unacceptable capacity loss
resulted in setting the taper charge interval every 20 cycles (about 30 days).115

110In order to prevent excessive gassing the current going into the battery bank
should be limited to a rate of about C/10.116 Each battery has nominally 2 vpc
and 2041 amp-hours of capacity, corresponding to a total voltage and capacity of
360 VDC and 8164 amp-hours. A C/10 charging rate corresponds to 8164 amp-
hours/10 hrs, or about 816 amps. This means that the input current from either
the solar or diesel generator should be limited to about 800 amps to ensure safe
charging. The battery bank at Grasmere has run for 12 years of operation
without replacement.117 The best a PV system designer can really hope for is to
only have to replace the battery bank once within the 20 years lifetime of the
entire system. With proper storage, charging and discharging precautions, it has
been shown that this is possible.
12.5 The NEC
The 2005 National Electric Code, or NEC, has been consulted to design the
system for safety and reliability. The NEC is published about every three years
by the National Fire Protection Association. The NEC is a collection of articles
that apply electrical safety and efficient utilization considerations to a slew of
topics such as: wiring methods and materials, and wiring protection. Article 690 is
specifically written about solar PV systems. To protect both technicians and end
users, the NEC specifies the size, type and location of fuses, conductors, and
breakers to be used. Other considerations such as wire losses, types of wire
housing, and wire materials are also taken into consideration.
12.5.1 Cables and Over-current Device Sizing Calculations for conductor sizes and over-current device ratings are based on the
requirements of both the NEC and on UL Standard 1703, which provides
installation instructions for PV products. Wire ampacity data and temperature
derating factors are found in Tables 310.16 and 310.17 in the 2005 NEC.118 The

111115 kW example PV hybrid wiring diagrams are shown in Figures 47 through
51. The optimally sized subarray for the 115 kW system is shown in Figure 47.
It is composed of 6 sets of 96 panels that are wired together with 8 panels in
series and 12 strings in parallel. Notice that every other parallel string is ganged
with the string adjacent to it, so effectively there are only six strings in parallel.
This is allowed by the NEC if the conductors and over-current protection devices
are sized to protect the circuit. Since the short circuit current of one of the Sanyo
HIPBA200 modules is only 3.83A, it is definitely more economical to combine two
of them and use 6 larger fuses rather than 12 smaller fuses. The actual wiring
requirements are presented below.
There are six basic steps to sizing a conductor:
1. Article 690-8a states that the maximum current should be the sum of
parallel module rated short circuit currents multiplied by 125%.119 This is
sometimes referred to as the continuous current. This 125% correction
factor is required because the short-circuit current of a module is
referenced at a peak irradiance of 1,000 W/m2; however, the intensity of
the sun at solar noon can exceed 1,000 W/m2.120 Each module string
circuit conductor is rated at 125% of the individual module Isc. Each sub-
array source circuit conductor should be rated at 125% of the sum of the
individual short circuit currents in the sub-array. The battery input circuit
should be rated the same as the source circuit rating, since there are two
conductors. If there was only one conductor, then each battery input
conductor must be rated at 125% of the short-circuit current from both
sub-arrays. The inverter input circuit should be rated to handle the
continuous inverter input current, when the inverter is producing rated
power at the lowest possible input voltage.121 For example, in Figure 4,
the inverter is rated to 200 kVA, the lowest operating voltage of the battery
bank is about 330 volts, and the inverter efficiency is about 90%. The

112
input current is then: A673(0.9)*volts)330(
VA200,000I == . The inverter output
conductor should have a rating equal to the continuous current output
rating; however, it is recommended that this conductor be oversized to
allow for the surge capability of the inverter.
2. Article 690-8b states that the conductor and over-current device must be
rated at 125% of the current determined in step 1, which is to prevent
over-current devices from operating at more than 80% of their rating.
However, circuits containing over-current devices that are listed for
continuous operation at 100% of their rating are permitted to be employed
at the full rating.122 All of the breakers selected have 100% duty ratings,
so the second 125% correction factor is only applied to the conductors.
3. Cables should have an ampacity at 30ºC of 125% of the current
determined in step 1 in order to guarantee proper operation of attached
over-current devices.123
4. A cable size and insulation temperature rating must be selected from the
NEC Ampacity Tables 310-16 and 310-17. The size of the cable is
determined from the 75 ºC insulation level; then the cable is derated for
temperature, conduit fill, and other provisions. The derated ampacity must
be larger than the ampacity determined in step 1. If the ampacity isn’t
larger; then a larger cable or higher insulation temperature must be
selected.124
5. The derated ampacity of the cable in step 4 must be greater than or equal
to the over-current device rating determined in step 2. If this is not the
case; then a larger gauge conductor must be selected.

1136. Stated in article 110-3b: cables must be compatible with the
temperature ratings of terminals on over-current protection devices. Most
over-current devices have terminals rated to 60 or 75 ºC. If a cable with 90
ºC insulation has been selected, the 30ºC ampacity of a of the same size
cable with 60 ºC or 75 ºC insulation must have a derated ampacity larger
than that determined in step 1.125
The 115 kW system in Figures 47 through 50 is used as an example. The
charging circuit, or subarray circuit is the circuit connecting each subarray to the
charge controllers. As mentioned before, each module has a short circuit current
of 3.83A. All 12 strings combined together create a total short circuit current of
45.96A. The conductor size and protection are determined as follows.
The continuous current is found in accordance with article 690-8a.
A57.45125%*string
A7.66*strings)(6Isc ==
The breaker is sized to operate at 80% of rated capacity in accordance with 690-
8b. Thus, its current is 1.25 x 57.45, or 71.8A.
From Table 310-16, a 1/0 AWG USE-2 copper wire with 90 ºC insulation is rated
to 170A. Now a temperature derating must be applied. The wire is in conduit,
and it is assumed the wire will be operating at the maximum expected cell
temperature of about 70 ºC. The temperature derating factor for copper
conductors in conduit with 90ºC insulation at 70 ºC is 0.58.126 Shown below, the
derated ampacity of the conductor is 98.6A, which is greater than the ampacity
determined in step 1.
amps98.6(0.58)*amps)(170I == .
Standard ratings for over-current devices are shown in article 240-6 of the NEC.
It is possible to protect a cable with a derated ampacity of 98.6 amps with an 80

114amp over-current device and still have the over-current device larger than the
required 71.8 amps determined in step 2.
Presently there are no over-current devices that have terminals listed for 90ºC
insulation; most are listed for 75 or 60ºC insulation. The selected over-current
device has terminals that are rated at 75ºC insulation, so the cable derated
ampacity must be checked again at 75ºC. The derated ampacity of a 1/0 AWG
conductor with 75ºC insulation is 150 amps x 0.58, or 87 amps, which is larger
than the required ampacity found in step 1 and is larger than the selected 80 amp
over-current device. All of the conductors in this installation have been sized
according to the methods outlined above.
In addition to conductor and over-current protection sizing, there are many other
issues that the NEC addresses. Some of the additional requirements and codes
are outlined below; however, the serious system designer should become
familiar with the entire NEC, not limited to the information found in this report.

115
Figure 47: Sub-array for the 115 kW system.

11612.5.2 Battery Bank Wiring Considerations A short circuit condition in a battery bank can be a severe situation, with a single
6 volt, 220 amp-hour battery being able to produce short-circuit currents as high
as 8,000 amps, which can generate temperatures and magnetic forces that can
destroy underrated over-current devices.127 The interrupt capability of an over-
current device is specified as the amperes interrupt rating, or AIR, and reach
120,000 amps in some dc rated fuses. A current limiting fuse must be used in a
battery circuit that has breakers that have a low AIR rating.128 As shown below in
Figure 48, two 175 amp, Littelfuse, current limiting fuses protect each string of
the battery bank.
One other unique design aspect of such a large system is the fact that the
system voltage is so large. Most DC over-current devices are rated to a
maximum voltage of 125VDC. All of the current system components have an
operating voltage far higher than 125VDC; thus, special over-current devices
have been selected. Both the Littlelfuse IDSR series fuses and the Ferraz-
Shawmut A4BQ series fuses are rated to 600VDC and provide current ratings
within the specifications of this design. The A4BQ series fuses are slightly more
expensive than the Littelfuse models at equal current ratings; however, the
maximum current that the Littelfuse IDSR model can handle is 600A. Thus, the
Ferraz-Shawmut A4BQ fuses are only selected for applications with currents
larger than 600A.
12.5.3 DC Grounding For systems over 50 volts, which is the open-circuit voltage multiplied by a
temperature coefficient found in Table 690.7 of the NEC, the DC side of the
system must be grounded, which is usually the negative conductor. In addition,

117all systems regardless of voltage must have equipment grounding conductors
to ground exposed metal parts of non-current carrying conductors.129 In order to
reduce fire hazards, roof mounted PV systems must include ground fault
protection devices, as outlined in Article 690.5 of the NEC.130 The ground fault
protection devices are shown connected to each sub-array circuit above in
Figures 47.

118
Figure 48: Battery bank wiring for the 115 kW array.

11912.5.4 Generators The AC side of the 115 kW system is shown in Figures 49, 50, and 51. The NEC
requires that the conductors between the generator and the first installed field
device be rated at 115% of the nameplate rating. One of the currently installed
gensets is rated to 210kW; however, the selected inverter for the 115 kW system
is only rated to 200kVA. The operating voltage of the generator is 208VAC.
Thus the maximum current per phase of the generator will be:
A63815.1*3*VAC)(208
VA200,000I phaseGenerator/ == .
Thus, 500kcmil THHN conductors are selected for most of the AC circuitry.
THHN rated conductors are used for most of the AC wiring; instead of USE-2
conductor cable. Both of these conductors are rated for operation up to 90 ºC;
however, the USE-2 is to be operated at continuous current in wet conditions,
where THHN cable is not. THHN conductor cable is slightly less expensive than
the USE-2 for the same gauge.
12.5.5 Voltage Drop Considerations All of the other conductors and over-current devices are sized similarly to the
methods above. However, the NEC also requires that the total voltage drop in
feeder and branch circuits must be less than 3%. If the panels are mounted on
the Cell House roof, the PV source circuits could be located as far as 250 feet
away from the SunEnergy Solar Regulators. In order to keep voltage drop within
the limit, these conductors should be oversized. Nominal ohmic resistances per
1,000 feet are found for each wire size in Chapter 9 of the NEC, which should be
used to calculate voltage drop. Note that voltage drop must be calculated for the
entire length of the wire (both positive and negative conductors); thus if a source

120circuit is 22 feet away from the charge controller, the circuit length is 44 feet.
Percent voltage drop can be calculated from the equation below:
1,000
d2RVI*100VD%
s
= 131
where,
• %VD is the percentage voltage drop
• Vs is the source voltage in volts
• I is the load current in amps
• R is the wire resistance in ohms per 1,000 feet
• d is the one way circuit distance in feet.
Note that the above equation assumes that the load voltage is essentially equal
to the source voltage.
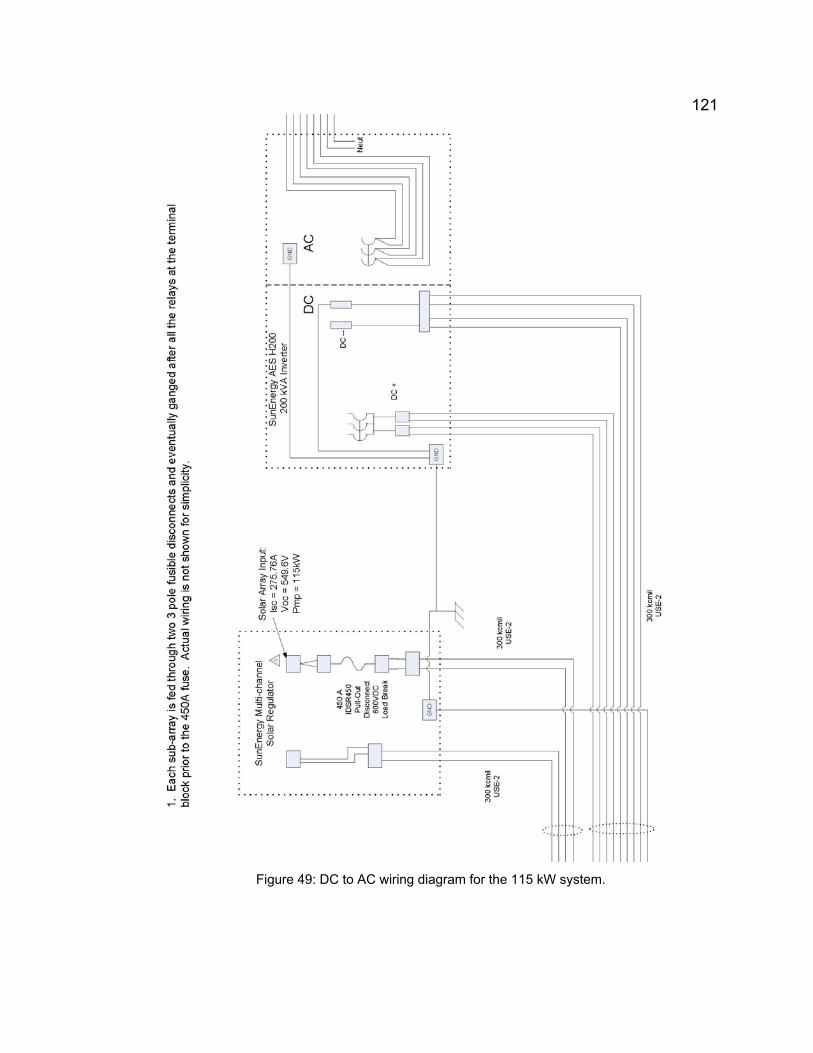
121
Figure 49: DC to AC wiring diagram for the 115 kW system.

122
Figure 50: Inverter to Generator Wiring Diagram for the 115 kW system.

123
Figure 51: Main Generator Bus Diagram for the 115 kW system.
12.6 346 kW PV hybrid System
As mentioned before, a 346 kW system has also been detailed. All of the same
NEC guidelines have been employed when selecting the conductors, over-
current devices and ground fault protection. The actual wiring is explained and
shown in Appendix H.
Cell Block

12413 Conclusions and Recommendations The purpose of this project is to determine a renewable energy system for the
Golden Gate National Recreation Area at Alcatraz Island. First, the current
energy load is assessed and possible energy consumption reduction methods
are explored. Next, the renewable resources in the San Francisco Bay are
identified and analyzed. The possibility of a pumped storage energy system
using the water tower located on the island is also considered. Once the optimal
renewable resource is identified, an energy system is designed, and an
economic analysis is performed on the system.
The current average energy consumption on Alcatraz Island is 2350 kWh per
day; this number could be reduced by 42% by replacing all of the incandescent
and halogen light bulbs with high efficiency compact fluorescent lights. The three
renewable resources identified in the area are solar, wind and tidal. A full small
wind turbine array located on the roof of the Cell House could only produce 3% of
the energy demand for the entire year. Likewise, the tidal resource only has a
maximum power density of 0.4 kW/m², which is not large enough to justify a tidal
turbine installation. Unless alternative data can be obtained regarding either of
these resources, neither are viable considerations for renewable energy systems
at Alcatraz Island. The best renewable energy resource is solar energy, which
can produce between 20% and 70% of the energy demand for the year,
depending on the number of panels and their orientation.
The solar energy system can range in size from 115 kW to 346 kW rated power.
Although a larger rated system could fit on the combined roofs of the Cell House
and New Industries buildings, it is not recommended unless the island is
reconnected to the power grid in San Francisco. A solar system larger than 346
kW rated will produce more energy than can be consumed or stored on the
island, especially in the summer, so the excess energy will go to waste. Special
New Industries Building
Power House

125considerations for a solar energy system are the panel tilt angle and
orientation relative to the building long side. South facing tilted panels can
produce 9.3% more energy per year than horizontal (flat) panels; however,
neither building of interest faces south. The result of orienting tilted solar
modules in line with the New Industries Building is a 5.3% increase in power
output over a horizontal PV system and an increase of 6.3% by orienting the
panels in line with the Cell House Building. Titled solar module racks are more
expensive than horizontal racks, so this is considered in the economic analysis.
The final component of the renewable energy system is the backup energy
system. The options are to continue using the diesel generators, already located
on the island, or to reconnect to the power grid in San Francisco. There is a
significant capital investment to re-lay and reconnect he undersea cable that
would bring power to the island, but grid power is relatively inexpensive to
purchase once installed. Although there is no capital cost associated with the
diesel generators, the operating cost to purchase fuel and maintain the
generators is considerably greater than grid energy.
A cost comparison for each system explored in this report is shown in Table 19
below. The cost is separated into the initial capital investment, the annualized
capital cost, the annual operating cost and the resulting cost of electricity. The
price range shown for each combination solar energy system is the maximum
and minimum price based on the tilt angle and orientation of the panels. There is
not a significant difference in the price between the small and large hybrid diesel
solar energy systems. Grid-tied solar energy is considerably more expensive
than hybrid diesel solar energy, with a large increase in price between the small
and large solar system. Unaccompanied, grid-tied energy is comparable with
hybrid diesel solar energy, and diesel generator energy is the least expensive
overall – at least when diesel fuel is $3/gallon as assumed in this study.

126
Table 19: Cost Breakdown of the Six Prospective Energy Systems
Energy System Configuration
& Size
Capital Investment
($)
Annualized Capital Cost
($/yr)
Annual Operating Cost
($/yr)
Cost of Electricity
($/kWh) Hybrid Diesel Solar 115 kW
1,521,069 - 1,539,892
143,000 - 144,919
251,496 - 258,291 0.46 - 0.47
Hybrid Diesel Solar 346 kW
3,144,832 - 3,200,746
296,463 - 302,158
94,745 - 115,128 0.46- 0.48
Grid-tied Solar 115 kW
3,675,549 - 3,694,372
362,440 - 364,357
98,135 - 100,593 0.54
Grid-tied Solar 346 kW
5,049,312 - 5,105,227
490,438 - 496,133
42,338 - 49,714 0.63
Stand Alone Grid Energy 2,510,000 255,649
125,178 - 142,330 0.44 - 0.46
Stand Alone Diesel Generators N/A N/A 333,478 0.39
On a purely economic basis, diesel power generation is the best energy source
and on a practicality scale, grid energy is likely the most reliable and simplest to
maintain. This, however, does not make them the best energy solutions for the
island. A solar energy installation at Alcatraz Island could be an opportunity to
educate thousands of people that visit the park each day about clean, renewable
energy. It will also reduce the amount of diesel fuel that is consumed in the Bay
area each day, which could be beneficial with the prevailing fuel shortage and
volatility of cost. The optimal system is one that minimizes energy cost, reduces
diesel fuel consumption and incorporates renewable energy, which is true for
both hybrid diesel-solar energy systems. The larger system may be more
economical if there in an increase in the cost of diesel fuel, but either system is
recommended for application at Alcatraz Island.
These are not the only solar PV configuration possibilities for Alcatraz Island.
Any array that is the same size or smaller than the largest possible systems
defined in Table 19 could be implemented on the island. The largest possible
horizontal solar array that could fit onto the roof of the New Industries building is

127rated at 153 kW, assuming Sanyo modules, and 211 kW assuming
SunPower modules. The largest south facing, tilted solar arrays that will fit onto
the New Industries Building roof are rated at 128 kW and 181 kW, respectively,
for the Sanyo and SunPower modules. The Cell House roof can accommodate
horizontal solar arrays up to a maximum rating of 346 kW using the Sanyo
modules and 393 kW using the SunPower modules, which will produce more
solar electricity than the demand in July. This value is reduced to 307 kW for the
Sanyo modules and to 302 for the SunPower modules by tilting the modules and
facing them south, since this curtails the number of modules that can be placed
on the roof. The 115-120 kW rated system explored in this study will fit onto
either of the buildings in any of the three orientations considered. The NPS
should select the energy system that is the most practical for its operation and in
line with its objectives and budget.

128END NOTES
1 San Francisco Bay 2 Alcatraz Island 3 Legends of Alcatraz 4 National Park Service, The Industries 5 Alcatraz 6 Alcatraz Island Diagram 7 Butterworth, personal interview 8 Clark 9 National 10 Malte (1) 11 Butterworth 12 Caterpillar 13 Malte (1) 14 Malte (1) 15 Electrical Energy Transmission 16 Clark 17 Perez 18 McAllister 19 Lawrence 20 Castellini 21 DOE, Laurence Berkeley, McAllister, Perez 22 Department of Energy (1) 23 Megaman 24 Energy Star 25 Castellini 26 Walker 27 National Solar Resource Data Base 28 Microclimate 29 Malte 30 National Solar Resource Data Base 31 SunPower 32 Wilcox 33 Sanyo 34 Brown 35 Renewable Energy 36 Renewable Energy 37 Renewable Energy

129 38 Twindell, pg 291 39 Kaper 40 Renewable Devices 41 Renewable Devices 42 Abundant Renewable Energy 43 Abundant Renewable Energy 44 Abundant Renewable Energy 45 Bergey Windpower Co. 46 Bergey Windpower Co. 47 Bergey Windpower Co. 48 Windside Turbines 49 Windside Turbines 50 PacWind, Inc. 51 Clint 52 PacWind, Inc. 53 Savonius Wind Turbine 54 Twindell, pg 269 55 After Gutenberg, American Wind Energy Association 56 Alcatraz 57 Polagye 58 Tide 59 NOAA 60 Malte (2) 61 USGS 62 USGS 63 Verdant 64 Verdant 65 GCK Technologies 66 GCK Technologies 67 Malte (2) 68 Polagye 69 Previsic 70 Previsic 71 Polagye 72 Pacific Gas & Electric 73 Clark 74 Fackler 75 Castellini

130 76 Google 77 Johnson 78 Plant-Based Corrosion Inhibitors 79 ECONOMIC STUDY 80 Technical Information 81 Cathodic protection 82 Si-COAT: Technology that Sticks 83 Si-COAT 579 84 Roy 85 Si-COAT: Technology that Sticks 86 Renewable Energy 87 Harris 88 Harris 89 Beckman 90 Gates (2) 91 Gates (1) 92 Fackler 93 Department of Energy (2) 94 Gates (2) 95 SunEnergy 96 Currie 97 Twindell 98 Currie 99 Fackler 100 Dixon 101 Cathcart 102 Sanyo 103 SunEnergy 104 Sanyo 105 SunPower 106 Fackler 107 Renewable Energy 108 Gates 109 Renewable Energy 110 NPS

131 111 Google Earth 112 Gates 113 Hund, p. 1 114 Hund, p. 2 115 Hund, p. 3 116 Gates 117 Gates 118 National Fire Protection Association, p. 297-298. 119 National Fire Protection Association, p. 1024 120 Wiles, p. 32-33 121 National Fire Protection Association, p. 1024 122 National Fire Protection Association, p. 1024 123 National Fire Protection Association, p. 1029 124 Wiles, p. I-2 125 Wiles, p. I-2 126 National Fire Protection Association, p. 297 127 Wiles, p. 40 128 Wiles, p. 42 129 National Fire Protection Association, p. 1031 130 National Fire Protection Association, p. 1021 131 Messenger, p. 91

106REFERENCES
Abundant Renewable Energy. “Specifications.” ARE Wind Turbines. Accessed
on September 6, 2007 from http://www.abundantre.com/ARE_Wind_Turbines.htm
After Gutenberg. “Savonius Wind Turbine.” Vertical Axis Wind Turbines.
Accessed on February 3, 2008 from http://jcwinnie.biz/wordpress/?p=1091 Alcatraz. Google Earth. Accessed on January 7, 2008 from
http://earth.google.com/. Alcatraz Island. Wikipedia. Accessed on January 8, 2008 from
http://en.wikipedia.org/wiki/Alcatraz American Wind Energy Association. “Basic Aerodynamic Operating Principles of
Wind Energy. Resources. Accessed on February 3, 2008 from http://www.awea.org/faq/basicop.html
Bergey Windpower Co. “Small Wind Turbines.” Products and Prices. Accessed
on September 6, 2007 from http://www.bergey.com/ Brown, Chris. Sales Representative for the Alternative Energy Store. Email
received from Chris Brown on October 19, 2007. Butterworth, Steve. Regional Energy Program Coordinator for National Park
Service. “Alcatraz Log Book.” Email received from Steve Butterworth on August 28, 2007.
Castellini, Laura. Environmental and Safety Programs Officer for National Park Service. Personal Interview on July 20, 2007.
Caterpillar. “Marine Auxiliary Engine 3306B.” Marine Engine Specifications
Sheet. 2001. Available at http://www.cat.com/cda/files/99297/7/LEHM1559-00.pdf.

107Cathodic protection. Corrosion science and engineering information hub. 11 Apr. 2008 <http://www.corrosion-doctors.org/CP/Introduction.htm> Clark, Cameron. Director of Environmental Affairs for Alcatraz Cruises.
Personal Interview on July 20, 2007 Clint, Michael. PacWind Inc. “Seahawk Turbine.” Email received from Michael
Clint on December 6, 2007. Currie, Glen. Business Development Manager at Sun Energy Limited. “Your
query on our website.” Forwarded email received from Boyd Fackler on November 27, 2007.
Department of Energy. “Estimating Appliance and Home Electronic Energy Use.”
A Consumers Guide to Energy Efficiency and Renewable Energy. September 12, 2005. Accessed on August 1, 2007 from http://www.eere.energy.gov/consumer/your_home/appliances/index.cfm/mytopic=10040
Department of Energy. “When to Turn off Personal Computers.” A Consumers
Guide to Energy Efficiency and Renewable Energy. September 12, 2005. Accessed on February 3, 2008 from http://www.eere.energy.gov/consumer/your_home/appliances/index.cfm/mytopic=10070
Department of Energy. “Solar Electric Power (PV).” Distributed Energy
Program. May 17, 2006. Accessed on February 12, 2008 from http://www.eere.energy.gov/de/solar_electric.html
Dixon, Aaron. Unirac. Phone Interview on February 20, 2008 ECONOMIC STUDY: Si-COAT 579 versus Epoxy/Urethan 3-Coat System. by
CSL Silicones Inc. (2004)

108Electric Power Transmission. Wikipedia. Accessed on March 17, 2007 from
http://en.wikipedia.org/wiki/Electric_power_transmission Energy Star. “LED Exit Signs.” Products. Accessed on October 17, 2007 from
http://www.energystar.gov/ia/products/prod_lists/exit_signs_prod_list.pdf EPRI. “Methodology for Estimating Tidal Current Energy Resources and
Power Production by Tidal In-Stream Energy Conversion Devices. EPRI Tidal In Stream Energy Conversion Project. September, 29 2006.
Fackler, Boyd. Ph.D. Candidate at University of Washington. “Wiring Diagram.”
Email received on December 3, 2007. “Wire Cost.” Email received on February 21, 2008.
Gates, Scott. Idaho Power. Phone Interview on November 7, 2007. Gates, Scott, Thomas Hund. “PV Hybrid System and Battery Test Results from
Grasmere Idaho.” IEEE Photovoltaic Specialists Conference. New Orleans, May 2002.
Google Earth. Accessed on March 5th 2008. GCK Technologies. “Gorlov Helical Turbine.” Accessed on July 30 from
http://www.gcktechnology.com/GCK/pg2.html Harris, Don. Harris Hydroelectric. Phone Interview on August 30, 2007. Higher Heating Value. Wikipedia. Accessed on June 20, 2007 from
http://en.wikipedia.org/wiki/Higher_heating_value Johnson, Arthur. “Methods for producing hydro-electric power.” U.S.
http://en.wikipedia.org/wiki/Higher_heating_value

109 Kaper, Kite Flying Around Wind Obstacles, “Boundary Layer.”
http://www.kaper.us/basics/BASICS_040502_hunt_windflow.html Kiss and Cathcart, Architects. “Alcatraz Island National Historic District Building
Integrated Photovoltaic System.” Systematic Study: Preliminary and Final Report. March 1, 2002. Kiss and Cathcart Architects.
Lawrence Berkeley National Laboratory. “National Park Service Alcatraz Island
Energy-Efficiency Study Report.” Energy Efficiency Study. November, 1996.
Legends of America. “The History and Hauntings of Alcatraz.” California
Legends. Accessed on January 8, 2008 from <http://www.legendsofamerica.com/CA-Alcatraz.html>
Malte, Philip, Mary Hamann. “University-National Park Energy Partnership Program Status Report.” Renewable Energy for Electricity Generation for Alcatraz Island. June, 2007.
Malte, Philip, Mary Hamann. “University-National Park Energy Partnership
Program Status Report.” Renewable Energy for Electricity Generation for Alcatraz Island. September, 2007.
Malte, Philip, Mary Hamann, Boyd Fackler “University-National Park Energy Partnership Program Status Report.” Renewable Energy for Electricity
Generation for Alcatraz Island. December, 2007. McAllister, Patrick. Alcatraz Island National Golden Gate Part Conservancy.
Phone Interview. August 14, 2007. Megaman. “Megaman 11W GU10 Spotlight.” eco-lighbulbs. Accessed on
October 17, 2007 from http://eco-lightbulbs.com/index.php?main_page=product_info&cPath=42_48&products_id=152

110Messenger, Roger, Jerry Ventre. Photovoltaic Systems Engineering. Boca
Raton: CRC Press, 2000. Microclimate. Wikipedia. Accessed on February 6, 2008 from
http://en.wikipedia.org/wiki/Microclimate National Fire Protection Association. The National Electrical Code Handbook.
Boston: National Fire Protection Association, 2005. National Oceanic and Atmospheric Association. “Current Station and Locations
and Ranges.” Tidal Current Predictions. December 14, 2007. Accessed on July 27, 2007. http://tidesandcurrents.noaa.gov/currents08/tab2pc1.html#104
National Park Service. “Emissions Calculations.” Channel Islands National Park.
December 27, 2000. Accessed on July 12, 2007 from http://www.nps.gov/archive/chis/eemission.htm
National Park Service. “The Industries.” Alcatraz Island Circumnavigation
Tour. Accessed on January 9, 2008 from http://www.nps.gov/archive/alcatraz/tours/circ-nav/stop3.html
National Solar Radiation Data Base. “Data Sets.” Accessed on June 14,
2007 from http://rredc.nrel.gov/solar/old_data/nsrdb/ Pacific Gas & Electric. “Electric Rates.” Rates and Regulations. Accessed on
October 2, 2007 from http://www.pge.com/nots/rates/tariffs/electric.shtml#COMMERCIAL
PacWind, Inc. Products. Accessed on September 13, 2007 from
http://www.pacwind.net/ Perez, Ricardo. National Park Service. Phone Interview. August 7, 2007.

111Plant-Based Corrosion Inhibitors. DACCO SCI, INC. -- Corrosion
Engineering, Materials Technology, Electrochemistry. 11 Apr. 2008 <http://www.daccosci.com/plant_ extracts.htm>
Polagye, Brian. PhD Candidate at University of Washington. Personal Interview
on July 27, 2007. “Wind Degradation.” Email received on October 17, 2007. “Alcatraz Cable Spec.” Email received on September 26, 2007.
Previsic, Mirko. Revision. “Fwd: Alcatraz Cable Spec.” Forwarded email
received from Brian Polagye on September 26, 2007. Renewable Devices. “Specifications.” The Swift Rooftop Energy System.
Accessed on September 12, 2007 from http://www.renewabledevices.com/swift/specification.htm
Renewable Energy, ME 442. “Class Notes.” University of Washington. Winter, 2007. Renewable Resource Data Center. “TMY2 Data Files” Accessed on October 12,
2007 from http://rredc.nrel.gov/solar/old_data/nsrdb/tmy2/ Roy, D., G. P. Simon, M. Forsyth, and J. Mardel. "Towards a better understanding of the cathodic disbondment performance of polyethylene coatings on steel." Advances in Polymer Technology 21.1 (2002): 44-58. San Francisco Bay. Google Maps. Accessed on January 7, 2008 from
http://maps.google.com/. Sanyo. “HIT Standard Solar Panels.” Solar Products. Accessed on June 22,
2007 from http://us.sanyo.com/solar/index.cfm?productID=1554 Savonius Wind Turbine. Wikipedia. Accessed on February 3 from
http://en.wikipedia.org/wiki/Savonius_wind_turbine

112Si-COAT: Technology that Sticks.” By CSL Silicones Inc. (2000) Si-COAT 579 versus Epoxy/Urethan 3-Coat System. by CSL Silicones Inc.
(2004)
SunEnergy. “Technical Specifications – SunEnergy Three Phase Hybrid.” Products. Accessed on October 17, 2007 from http://www.aesltd.com.au/solar-inverter-products.php
SunPower. “SunPower 315 Data Sheet.” Solar Panels for Businesses.
Accessed on June 22, 2007 from http://www.SunPowercorp.com/Products-and-Services/Commercial-Solar-Panels.aspx
Technical Information: Halar ECTFE 6914. by Solvay Solexis Inc.. 30 Jan. 2008. Tide. Wikipedia. Accessed on January 15, 2008 from
http://en.wikipedia.org/wiki/Tide Twindell, John, Tony Weir. “Renewable Energy Resources.” Taylor and Francis
Group,1986. USGS. “San Francisco Central Bay.” Near Real Time Current Velocity Maps.
Accessed on September 6, 2007 from http://sfports.wr.usgs.gov/SFPORTS/vec_map/centbay.html
Verdant Power. “Free Flow Turbine Projects.” Accessed on July 30, 2007 from
http://www.verdantpower.com/wp-content/themes/Verdant/downloads/VerdantPower_FFTechProj.pdf
Walker, Andy. National Renewable Energy Laboratory. “Alcatraz Report.” Email
from Andy received June 22, 2007.
Wilcox, Geoff. SunPower. Phone Interview on July 6, 2007.

113 Wiles, John. “Photovoltaic Power Systems and the 2005 National Electrical
Codes Suggested Practices.” Photovoltaic Systems Research and Development. February 2005. Sandia National Laboratories. Accessed on November 9, 2005 from <http://www.sandia.gov/pv/docs/John_Wiles_Code_Corner.htm>.
Windside Turbines. “Technical Data Page.” Products. Accessed on
September 12 from http://www.windside.com/technical.html#WS-2B

114Appendix A: Energy Consumption Calculations
The average daily fuel consumption is 175 gallons per day and 7.3 gallons per
hour. This corresponds to an average 50% load on the generator and thus an
efficiency of 38.4%, however, the load varies between 75% of the rated capacity
during the daytime and 25% during the nighttime. This was determined from the
energy audit performed in Chapter 4. Also, there are additional power losses to
heat caused by friction in the gear box and resistance in the transmission lines.
Therefore, a conservative estimate of 34.5% is used for efficiency to convert the
lower heating value of diesel into electric energy. The equation used to convert
diesel consumption into electrical energy consumption per day is:
ηρ ***785.3* LHVFuelEC = Equation: A1
where,
o Ec is the electrical energy consumed each day at Alcatraz Island (kJ/day)
o Fuel is the diesel consumption per day (gallons/day)
o 3.785 is the conversion from liters to gallons
o ρ is the density of diesel fuel (kg/liter)
o LHV is the lower heating value of diesel fuel (kJ/kg)
o η is the efficiency of the generator
Diesel fuel characteristics:
o Higher Heating Value (HHV): 45.9 MJ/kg
o Lower Heating Value (LHV): 43.0 MJ/kg
o Density (ρ): 850 g/L

115The resulting value of Equation A1 is in kJ/day. In order to get average
power, this value has to be divided by the number of seconds in the day. The
result of Equation A2 is the average power in kW.
)24*3600/(CEP = Equation: A2

116Appendix B: Summer Energy Demand
Building/Room Lighting
/Appliance Quantity Power
(W)
Percent of time
used
Daily Usage
(hr)
Total Power (kW)
EnergykWh/day
Barracks - Dock Level
Book Store flood light 17 75 50% 12 1.275 15.3 television 1 200 50% 12 0.2 2.4 cash register 1 150 50% 12 0.15 1.8 telephone 1 25 100% 24 0.025 0.6 beverage cooler 1 250 100% 24 0.25 6
Visitor Center incandescent bulb 6 60 50% 12 0.36 4.32
visitor computer 2 150 50% 12 0.3 3.6 Electrical Room F40T12 fixture 2 78 20% 4.8 0.156 0.7488
Storage incandescent bulb 1 150 20% 4.8 0.15 0.72
First Aid F40T12 fixture 5 78 50% 12 0.39 4.68
Canopy incandescent bulb 1 300 50% 12 0.3 3.6
CFL bulb 10 28 50% 12 0.28 3.36 Perimeter HID 6 250 50% 12 1.5 18 PA speaker 1 110 20% 4.8 0.11 0.528 Conservancy Admin Office
incandescent bulb 6 75 50% 12 0.45 5.4
incandescent bulb 2 60 50% 12 0.12 1.44
telephone 3 25 100% 24 0.075 1.8 computer 2 120 100% 24 0.24 5.76 monitor 2 150 50% 12 0.3 3.6 printer 1 150 50% 12 0.15 1.8 Conservancy Retail Office
incandescent bulb 4 75 50% 12 0.3 3.6
computer 2 120 100% 24 0.24 5.76 monitor 2 150 50% 12 0.3 3.6 printer 2 150 50% 12 0.3 3.6 bill counter 1 60 25% 6 0.06 0.36
Conservancy Break Room F40T12 fixture 5 78 50% 12 0.39 4.68 refrigerator 1 775 100% 24 0.775 18.6 microwave 1 1500 10% 2.4 1.5 3.6 toaster oven 1 1225 10% 2.4 1.225 2.94 coffee urn 3 500 50% 12 1.5 18

117 television 1 175 10% 2.4 0.175 0.42
water heater/cooler 1 500 50% 12 0.5 6
Restrooms - Dock Level
Men’s toilet/urinal 6 0 0 0 sink 2 0 0 0 hand dryer 2 2000 25% 6 4 24 F40T12 fixture 2 78 50% 12 0.156 1.872 CFL bulb 1 28 50% 12 0.028 0.336 Women’s toilet 6 0 0 0 sink 2 0 0 0 hand dryer 2 2000 25% 6 4 24 F40T12 fixture 1 78 50% 12 0.078 0.936 CFL bulb 3 28 50% 12 0.084 1.008 air curtain 1 600 100% 24 0.6 14.4 Staff F40T12 fixture 1 78 20% 4.8 0.078 0.3744
Electrical Room incandescent bulb 6 60 100% 24 0.36 8.64
water pump 1 1000 40% 9.6 1 9.6 sump pump 2 1000 40% 9.6 2 19.2 compressor 2 2700 40% 9.6 5.4 51.84 water heater 1 4500 40% 9.6 4.5 43.2 Restroom Perimeter F40T12 fixture 2 78 100% 24 0.156 3.744
CFL bulb 5 28 100% 24 0.14 3.36 Restroom - Cell House Level
Men’s toilet/urinal 2 0 0 0 sink 1 0 0 0
hand dryer 1 2000 25% 6 2 12 F40T12 fixture 1 78 50% 12 0.078 0.936 CFL bulb 2 28 50% 12 0.056 0.672 Women’s toilet 2 0 0 0 sink 1 0 0 0 hand dryer 1 2000 25% 6 2 12 F40T12 fixture 1 78 50% 12 0.078 0.936 CFL bulb 2 28 50% 12 0.056 0.672 Staff toilet 1 0 0 0 sink 1 0 0 0
F40T12 fixture 1 78 20% 4.8 0.078 0.3744

118
Electrical Room incandescent bulb 4 60 100% 24 0.24 5.76
water pump 1 1000 40% 9.6 1 9.6 sump pump 2 1000 40% 9.6 2 19.2 compressor 2 2700 40% 9.6 5.4 51.84 water heater 1 4500 40% 9.6 4.5 43.2 Restroom Perimeter 100% 24 0 0 Barracks - Upper Level Entrance flood light 8 75 100% 24 0.6 14.4 F40T12 fixture 6 78 100% 24 0.468 11.232 Book Store flood light 35 75 50% 12 2.625 31.5 F40T12 fixture 2 78 50% 12 0.156 1.872 cash register 1 150 50% 12 0.15 1.8 television 1 250 50% 12 0.25 3 telephone 1 25 100% 24 0.025 0.6
Theater incandescent bulb 8 25 100% 24 0.2 4.8
exit sign 5 52 100% 24 0.26 6.24
projection system 4 2000 50% 12 8 96
speaker 16 20 50% 12 0.32 3.84 Show Rooms flood light 31 90 40% 9.6 2.79 26.784 television 1 200 50% 12 0.2 2.4
Walk way incandescent bulb 10 60 100% 24 0.6 14.4
F40T12 fixture 1 78 100% 24 0.078 1.872 exit sign 2 52 100% 24 0.104 2.496 Kitchen/Lunch Room
incandescent bulb 2 60 50% 12 0.12 1.44
F40T12 fixture 4 78 50% 12 0.312 3.744 refrigerator 1 725 100% 24 0.725 17.4 freezer 1 600 100% 24 0.6 14.4 coffee maker 1 1000 50% 12 1 12 microwave 2 1500 10% 2.4 3 7.2 toaster oven 1 1225 10% 2.4 1.225 2.94 toaster 1 800 10% 2.4 0.8 1.92 water heater 1 2500 30% 7.2 2.5 18 Interpretation Office Park Service Offices (3)
incandescent bulb 6 60 50% 12 0.36 4.32
incandescent bulb 10 40 50% 12 0.4 4.8
F40T12 fixture 8 78 50% 12 0.624 7.488 CFL bulb 1 28 50% 12 0.028 0.336 computer 9 120 50% 12 1.08 12.96

119 monitor 9 150 50% 12 1.35 16.2 television 1 175 10% 2.4 0.175 0.42 vcr 1 120 10% 2.4 0.12 0.288 telephone 7 25 100% 24 0.175 4.2 fax machine 1 120 100% 24 0.12 2.88 printer 5 150 50% 12 0.75 9 copier 1 250 50% 12 0.25 3 electric heater 2 1500 0% 0 3 0 electric heater 1 500 0% 0 0.5 0
elevator 1 15,000 5% ~20 times/day 15 18
Storage Room incandescent bulb 6 60 100% 24 0.36 8.64
CFL bulb 3 28 100% 24 0.084 2.016 Conservancy Office
incandescent bulb 1 60 50% 12 0.06 0.72
F40T12 fixture 4 78 50% 12 0.312 3.744 flood light 6 90 50% 12 0.54 6.48 computer 3 120 100% 24 0.36 8.64 monitor 3 150 50% 12 0.45 5.4 printer 2 150 50% 12 0.3 3.6 electric heater 2 1,000 0% 0 2 0
Change Counting Room F40T12 fixture 1 78 50% 12 0.078 0.936 change counter 2 50 25% 6 0.1 0.6 Sally Port Electric Shop F40T12 fixture 6 78 40% 9.6 0.468 4.4928 welder 1 5000 0% 0 5 0 electric saw 1 400 0% 0 0.4 0 Kitchen/Lunch Room microwave 1 1200 0% 0 1.2 0 refrigerator 1 600 0% 0 0.6 0
Perimeter incandescent bulb 3 200 50% 12 0.6 7.2
HID 7 450 50% 12 3.15 37.8 CFL bulb 4 28 100% 24 0.112 2.688 Cell House
MP3 Rental Incandescent bulb 2 60 50% 12 0.12 1.44
4F40T12 fixture 6 159 50% 12 0.954 11.448 CFL bulb 2 28 50% 12 0.056 0.672 exit sign 1 52 100% 24 0.052 1.248 MP3 charger 1 2000 100% 24 2 48
electric wall heater 2 2000 0% 0 4 0
Dining Hall Incandescent bulb 13 52 50% 12 0.676 8.112

120
Kitchen Incandescent bulb 4 52 50% 12 0.208 2.496
Hospital ER Incandescent bulb 1 300 10% 2.4 0.3 0.72
Hospital Upstairs
Incandescent bulb 19 52 10% 2.4 0.988 2.3712
Cell Block A West
Incandescent bulb 56 52 100% 24 2.912 69.888
Cell Block A East
Incandescent bulb 36 52 0% 0 1.872 0
CFL bulb 6 13 0% 0 0.078 0 Cell Block A East Wall
Incandescent bulb 2 52 100% 24 0.104 2.496
CFL bulb 3 13 100% 24 0.039 0.936
Cell Block B Incandescent bulb 94 52 100% 24 4.888 117.312
CFL bulb 18 13 100% 24 0.234 5.616
Cell Block C Incandescent bulb 80 52 100% 24 4.16 99.84
CFL bulb 32 13 100% 24 0.416 9.984
Cell Block D Incandescent bulb 21 52 100% 24 1.092 26.208
Cell Block D West Wall
Incandescent bulb 27 52 100% 24 1.404 33.696
Cell Block Ceiling
Incandescent bulb 15 300 100% 24 4.5 108
Library Ceiling Incandescent bulb 2 200 100% 24 0.4 9.6
Control Room Incandescent bulb 5 52 100% 24 0.26 6.24
F40T12 fixture 18 78 100% 24 1.404 33.696
Visitation Incandescent bulb 4 100 100% 24 0.4 9.6
Warden Office Incandescent bulb 4 52 100% 24 0.208 4.992
Barber Shop CFL bulb 2 13 100% 24 0.026 0.624
Shower Room Incandescent bulb 8 100 100% 24 0.8 19.2
Chapel Incandescent bulb 7 52 10% 2.4 0.364 0.8736
Citadel Incandescent bulb 29 60 5% 1.2 1.74 2.088
Hallway Incandescent bulb 3 150 100% 24 0.45 10.8
CFL bulb 3 28 100% 24 0.084 2.016 exit sign 2 52 100% 24 0.104 2.496 Book Store F40T12 fixture 5 78 50% 12 0.39 4.68 flood light 550 50 50% 12 27.5 330 cash register 4 150 50% 12 0.6 7.2 television 4 225 50% 12 0.9 10.8
electric wall heater 2 2000 0% 0 4 0

121Park Service Offices (2)
Incandescent bulb 3 52 50% 12 0.156 1.872
Incandescent bulb 4 60 50% 12 0.24 2.88
F40T12 fixture 4 78 50% 12 0.312 3.744 computer 3 120 50% 12 0.36 4.32 monitor 3 150 50% 12 0.45 5.4
electric wall heater 2 2000 0% 0 4 0
elevator 1 15000 5% 1.2 15 18 Conservancy Offices (3) F40T12 fixture 22 78 50% 12 1.716 20.592 computer 2 120 100% 24 0.24 5.76 monitor 2 150 50% 12 0.3 3.6 printer 5 150 50% 12 0.75 9
electric wall heater 3 2000 0% 0 6 0
Conservancy Conference Room
fluorescent lighting 0 0 0
electric wall heater 1 2000 0% 0 2 0
Kitchen/Lunch Room F40T12 fixture 17 78 50% 12 1.326 15.912 refrigerator 2 725 100% 24 1.45 34.8 freezer 1 600 100% 24 0.6 14.4 toaster oven 2 1225 10% 2.4 2.45 5.88 toaster 1 800 10% 2.4 0.8 1.92 coffee maker 1 1000 50% 12 1 12 microwave 2 1500 10% 2.4 3 7.2 water heater 1 2500 30% 7.2 2.5 18 television 1 175 10% 2.4 0.175 0.42 vcr 1 110 10% 2.4 0.11 0.264
electric wall heater 1 2000 0% 0 2 0
Roof Incandescent bulb 12 300 50% 12 3.6 43.2
Perimeter Incandescent bulb 7 150 50% 12 1.05 12.6
Incandescent bulb 4 75 50% 12 0.3 3.6
Removed Incandescent bulb -20 52 100% 24 -1.04 -24.96
Installed CFL bulb 20 13 100% 24 0.26 6.24 0 0 Removed F40T12 fixture 0 78 20% 4.8 0 0 Removed F40T12 fixture 0 78 40% 9.6 0 0 Removed F40T12 fixture -53 78 50% 12 -4.134 -49.608 Removed F40T12 fixture -27 78 100% 24 -2.106 -50.544 Installed F32T8EB fixture 0 58 20% 4.8 0 0

122Installed F32T8EB fixture 0 58 40% 9.6 0 0 Installed F32T8EB fixture 27 58 100% 24 1.566 37.584 Installed F32T8EB fixture 53 58 50% 12 3.074 36.888 Light House light house light 1 1500 100% 24 1.5 36 motor 1 2500 100% 24 2.5 60 Miscellaneous Electric Cars 3 1000 50% 12 3 36 electric tram 2 1000 50% 12 2 24 total 250.51 2361.8

123Appendix C: Solar Energy Availability Analysis
Solar Angles
o θ = solar incidence angle
The angle between a vector normal to the surface of a solar collector and
the direct beam radiation vector.
o Φ = latitude angle
The angle between the equator and the location north or south of a solar
collector.
o δ = solar declination angle
Tilt of the earth’s axis of rotation with respect to the sun (varies between
23.5°N during the summer solstice and -23.5°S at the winter solstice),
which is represented by Equation C1.
)365
)285(*360sin(*5.23 n+=δ Equation: C11
Where n represents the day of the year, starting with January 1 and
ending on December 31.
o ω = hour angle
The angle between the longitudinal position of a solar collector and the
longitude where solar noon is occurring on the earth. Solar noon is
defined as the time when the sun reaches the highest point in the sky
relative to a location. The sun rotates 15° per hour, with solar noon
defined as the zero hour angle, decreasing to the east and increasing to
1 Renewable Energy

124the west. Standard time must be converted to a 24 hour scale, then
solar noon cab be calculated to convert standard time into solar time. The
hour angle can be found using the following equations.
2)( SunsetSunriseSolarNoon +
= Equation: C2
SolarNoondardTimeSSolarTime −= tan Equation: C3
o15*SolarTime=ω Equation: C4
The remaining solar angles are depicted in the following figure and defined
below.
Diagram of the Solar Angles: θz, θ, β and γ.2
2 Renewable Energy

125o β = panel tilt angle
Angle between a solar collector and the horizontal surface of the earth
o γ = solar azimuth angle
The angle between a vectors from a collector to the sun projected on the
ground and a vector facing due south
o θz = solar zenith angle
Angle between a vector normal to the horizontal surface of the earth and
the direct beam radiation vector
For a solar collector placed on a horizontal surface, the amount of solar radiation
that the collector receives is defined by the solar zenith angle, given by the
following equation.
)cos()cos()cos()sin()sin()cos( ωδφδφθ +=z Equation: C23
If a solar module is tilted off of the horizontal surface, the panel tilt angle and
solar azimuth angle have to be incorporated into the analysis. The new equation
for the angle between a vector normal to a panel and the direct solar radiation is
defined in Equation C3.
)cos(*)cos(*)cos(*)sin(*)sin()cos(*)cos(*)cos(*)cos(
)cos(*)sin(*)sin(*)sin()sin(*)cos(*)sin(*)cos(
)sin(*)cos(*)sin()cos(
δωγβφδωβφδωγβδγβφ
δβφθ
+++−
=
Equation: C34
3 Renewable Energy 4 Renewable Energy

126Once the solar incidence angle has been determined, it is possible to
calculate how much beam and diffuse solar radiation is received by the module.
For a horizontal module the equation is simply the total global solar energy flux
striking a horizontal surface.
dbt GGG += )cos(* θ Equation: C45
Where,
o Gt is the total solar energy flux striking a horizontal surface (W/m²)
o Gb is the direct beam solar energy flux (W/m²)
o Gd is the diffuse solar energy flux on a horizontal surface (W/m²)
Solar radiation is almost always measured in terms of its direct and diffuse
components. If a module is tilted off of the horizontal, though, a reflected
radiation term has to be included in the analysis. This is portion of the total
radiation that is reflected off of a horizontal surface and onto a tilted collector.
The total solar flux received by a collector is determined with Equation C5.
)2
(sin**)2
(cos*)cos(* 22 βρβθ tdbC GGGG ++= Equation: C56
where,
o GC is the total solar energy flux striking a collector (W/m²)
o ρ is the reflectivity of the ground, ranging between 0.2 for regular ground
and 0.8 for snow.
The power produced by a solar panel installation is a function of the total solar
flux striking the panels, the area of the panels and their efficiency.
5 Renewable Energy 6 Renewable Energy

127
η** AGP C= Equation: C67
o P is the power available from the solar modules (W)
o A is the total surface area of the solar modules (m²)
o η is the efficiency of the solar modules
Solar modules are temperature dependent and all modules have a rated
temperature associated with their rated efficiency. For every degree above the
rated temperature the module efficiency decreases by a given percentage, and
for every degree below the rated temperature the efficiency increases by the
same percentage. The efficiency of solar modules is commonly rated for a
collector temperature of 25°C. The temperature of a solar collector is not simply
the temperature of the ambient air, but is a function of the solar flux striking the
panel and the wind speed that provides convective cooling of the module. The
collector temperature is defined in the following relationship.
)(**)*()(**** 44ambCskyCC TTAUbaTTAAG −++−= σε Equation: C78
where,
o ε is the emissivity of thermal radiation to the environment
o σ is the Stefan-Boltzman constant (5.67e-8 W/m²-K4)
o Tc is the temperature of the collector (K)
o Tamb is the ambient air temperature (K)
o Tsky is the sky temperature (Tamb – 6K)
o a is a constant (5.7W/m²-K)
o b is a constant (3.8 W/m²-K-m/s)
7 Renewable Energy 8 Renewable Energy

128o U is the wind speed (m/s)
Equation C7 is a quadratic equation that has to be solved for the collector
temperature. Once that is known, the temperature corrected power output of the
solar modules can be calculated.
)25(*1(* −−= Ccoeftc TTPP ) Equation: C89
o Ptc is the temperature corrected power output of the solar modules (W)
o Tcoef is the temperature coefficient, or the percentage of the power change
per degree (.29%/°C for the Sanyo 200 W)
Once the power output of a solar system is known it is possible to calculate the
total energy produced. Energy is defined as power multiplied by time, for
example W*hr. All of the solar irradiation, wind and temperature data is given on
an hourly basis, so the total energy produced each hour is the power multiplied
by one hour. The energy production each month is the sum of the energy
produced each hour over the month. Likewise, the yearly energy production is
the sun of the energy produced each hour for the entire year.
9 Renewable Energy

129Appendix D: Wind Energy Availability Analysis
Wind power is founded on the idea that energy is available from a pressure
difference created across an area or boundary. A pressure drop across a
boundary results in a loss in kinetic energy across the same boundary, with little
change in potential energy. The kinetic energy that is lost is then converted into
another kind of energy, which can be used to move a turbine. When that
pressure change, and thus energy change, is determined on a per time basis, it
becomes power. The amount of power available from the wind is represented by
the following equation.
3***21 UAPw ρ= Equation: D110
where,
o Pw is the power available from the wind (J/s or W)
o ρ is the density of air (kg/m³)
o A is the cross sectional area perpendicular to the direction of the wind (m²)
o U is the speed of the wind (m/s)
It is impossible for all of the power of the wind to be imparted to a wind turbine.
The portion of power transferred, or efficiency, is completely dependent upon the
change in the speed of the wind as is passes through the blades of the turbine.
The best possible condition occurs when the speed of the wind through the
turbine is 2/3 of the wind speed upstream from the turbine and the speed of the
wind downstream of the turbine is 1/3 of the upstream wind speed. This situation
corresponds to a 59% transfer of the wind power into the power output of a
turbine, and is known as the Betz Criterion. The relationship between upstream,
through, and downstream wind speed is dictated by the size of a turbine, the 10 Renewable Energy
130number, the axis of rotation, the ability to adjust the pitch of the blades and
the tip speed ratio of the blades. The Betz limit is an extremely ideal case and is
not achievable with current turbine technology. The efficiency of wind turbine
ranges between 15% and 48%. The power output of a wind turbine is given in
Equation D2.
ηρ ****21 3UAPw = Equation: D2
o P is the power output of a wind turbine (W) o As is the swept area of the blades of a wind turbine (m²) o η is the efficiency of a wind turbine
Similar to the solar energy analysis, wind speed data is available every hour so
the power production each hour is calculated, multiplied by one hour, and added
together to obtain monthly and yearly energy production values. A turbine
cannot produce power at any wind speed because a minimum speed is required
just to turn the blades. This is called the cut in wind speed, and is usually around
1-5 m/s. Therefore, any wind that is below the cut in wind speed of a turbine has
to be excluded from the analysis. Likewise, wind turbines have a cut out speed
at which they cease to produce power and shut down, this prevents them from
becoming damaged in very high winds. Any wind that is greater than the cut out
speed of the turbine must also be excluded from the power output calculation.
The final consideration is the behavior of the wind as it travels past a turbine.
After the wind passes the first row of wind turbines its speed is reduced to 60-
70% of its original speed, then there is only a slight decline after each
subsequent row. All of these considerations were included in the calculation of
wind energy output.

131Appendix E: Tidal Energy Availability Analysis
The equation for the power available from tidal currents is almost identical to the
equation for wind power availability. Both are proportional to the density of the
fluid that is moving and the cube of the speed of the fluid. In this case tidal
power, it is common to characterize a site by the tidal power density, rather than
calculate the specific power output of a turbine. This simplifies the calculation to
the following equation.
3**21 UPT ρ= Equation: E111
Where
o PT is the power density of the tidal current (W/m²)
o ρ is the density of water (kg/m³)
o U is the speed of the water (m/s)
Tidal current speed data is not available on an hourly basis, as it was for the wind
and solar data, but only the two maximum flood and ebb current velocities are
given for each day. Brian Polagye has created a code, based on the EPRI tidal
current estimation methodology report, which can predict the hourly current
velocity based upon the four daily maximum current velocities. Once the hourly
current velocity is known, the hourly power density can be calculated. The
average power density for the year is used to characterize the site.
11 Polagye

132Appendix F: Pumped Storage Capacity Analysis
A pumped storage energy systems works by harnessing excess energy
produced during the day from a renewable energy system or generator to pump
water up to the height of the water tower where it then has potential energy. The
water is stored at this elevation until a time when energy can no longer be
produced by the renewable resource, and then it is discharged back down to sea
level and run through a hydroelectric turbine where its potential energy is
converted into kinetic energy. The total amount of energy that can be produced
by this method is dependent upon the height of the storage reservoir, the amount
of water, and the efficiency of each component. The number of hours a system
can be run or the power rating can be modified by changing the size of the
discharge pipe. The first parameter calculated is the velocity of the jet stream at
the location of the turbine, seen in Equation F1.
gHVJ **5.= Equation: F112
Where,
o VJ is the velocity of the jet stream (m/s)
o H is the height of the tower (m)
o g is gravity (9.8 m/s²)
The next relationship is used to calculate the power available from the jet stream.
HQgPJ ***ρ= Equation: F213
o PJ is the power of the jet stream of water (W)
12 Renewable Energy 13 Renewable Energy

133o ρ is the density of water (kg/m³)
o Q is the flow rate of the water (m³/s)
The water flow rate is completely dependent upon the dimensions of the pipe that
the water travels through and the velocity of the jet stream, which is dependent
upon the height of the reservoir. The height of a reservoir cannot usually be
modified, but the diameter of the penstock can be changed in order to change
the power available from the jet stream. This will also have an effect on how long
the system can produce power, which is a function of the volume of water in the
reservoir and the flow rate of the water. The electrical power put out by the
turbine is a portion of the total power available from the jet stream.
GTPJE PP ηηη ***= Equation: F314
Where
o PE is the electrical output of the turbine (W)
o ηP is the efficiency of the penstock (~90%)
o ηT is the efficiency of the turbine (~85%)
o ηG is the efficiency of the generator (~98%)
Pump storage is not efficient on as small scale, but it work well for a utility scale
System. This is because of the initial power losses in the pump, around 80%,
and the low efficiency of a small, Pelton Wheel turbine around 80-85%.15
14 Renewable Energy 15 Harris

134Appendix G: Economic Analysis – Annuity Method
Energy that is purchased from the power grid has an energy cost assigned to it
that dictates the resulting monthly bill based on the amount consumed. For non
grid energy, such as a renewable energy system or diesel generator, the cost of
energy has to be calculated based on the energy production and the total cost.
This value is generally calculated on a per year basis and the energy cost is
defined by the following equation.
P
P
EC
COE = Equation: F116
Where,
o COE is the cost of energy ($/kWh)
o Cp is the production cost ($)
o Ep is the amount of energy produced (kWh)
Although it is relatively easy to determine the yearly energy production of an
energy system, it is not as simple to determine the total yearly cost to produce
the energy. The production costs include the capital expense of the equipment
and the operational cost to run and maintain the system. For a diesel generator,
the operational costs also include the cost of fuel for the year and the equivalent
cost of its pollutants on the environment. Operational costs are defined on a per
year basis, but the capital expense is a lump sum used to purchase and install all
of the necessary equipment. If the entire capital was paid in the first year of
operation, the production cost would be extremely high and thus the cost of
energy, making the project unfeasible. It is common to obtain a loan to cover the
capital expenses up front and then pay a portion of the loan back every year over
16 Renewable Energy

135the life of the equipment. This method converts the capital expense into a
reasonable yearly cost and is referred to as the annualized method.
As mentioned, the capital expense is not only the cost of the equipment, but the
cost to get then system running, including permits and installation. Installation is
sometimes estimated as a percentage of the capital cost, in this case a value of
10% is used. After the total capital expense is known, it can be converted into a
yearly cost using the capital recovery factor given and defined below.
niiCRF
)1(1 +−= Equation: F217
o CRF is the capital recovery factor, or the percentage of the capital that has
to be paid each year for the duration of the project
o i is the annual interest rate of the loan
o n is the duration of the project in years
The yearly capital cost is then obtained by multiplying the total capital cost by the
CRF. For this project an interest of 8% is incorporated, and the project is defined
for 20 years because that is the lifetime of the solar panels. The annual
production cost is now defined by this equation.
ageAnnualSalvOpExCapExC pannual −+= Equation: F318
o Cpannual is the annual cost of energy production
o CapEx is the total capital expense
o OpEx is the operating expense
17 Renewable Energy 18 Renewable Energy

136o Annual Salvage is the salvage value of the equipment at the end of the
project converted to an annual gain
The equipment is assumed to have no salvage value at the end of the project, so
there is no recovery cost included in the analysis.

137Appendix H: Wiring Diagrams for the 346 kW Solar Array Although the 346 kW system is very similar to the 115 kW system as far as
components, there are a couple of main differences. First of all, the SunEnergy
Solar Regulator (charge controller) can accept a maximum of 6 inputs. In order
to minimize the amount of regulators required, the optimal sub-array for this
system is composed of nine strings instead of six as shown in Figure 52.

138
Figure 52: Sub-array for the 346 kW system.

139Thus, the source circuit conductors and over-current protection devices have
been sized to accommodate the larger current. There is also one extra input to
the battery bank as shown in Figure 53. Where the 115 kW array has a positive
input corresponding to the generator and one solar regulator, the 346 kW array
has two inputs for each solar regulator. If an additional power generator such as
wind should be incorporated into this system, there would be additional inputs to
the positive bus shown in Figure 55. Take note that the maximum charging
current should still be limited to 800 amps for any additional power generator
added to the system.
The other main difference is the larger inverter required for the 346 kW array. A
SunEnergy 400kVA inverter has been selected for this system. The batteries
can now be charged at the full charging rate of C/10, 800 amps. Thus, the
conductors and over-current devices on the AC side of the system have been
augmented to 800 kcmil and 1000A fuses to allow for this increased current.

140
Figure 53: Battery bank wiring for the 346 kW array.

141
Figure 54: DC to AC wiring diagram for the 346 kW system.

142
Figure 55: Inverter to Generator Wiring Diagram for the 346 kW system.

143
Figure 56: Main Generator Bus Diagram for the 346 kW system.