Embed Size (px)
Citation preview
For updated information, please visit www.ibef.orgJanuary 2021
Renewable Energy
2
Executive Summary 3
Advantage India 4
Market Overview and Trends 6
Strategies Adopted 12
Growth Drivers 14
Opportunities 20
Key Industry Contacts 24
Appendix 26
Table of Contents
3
Executive summary
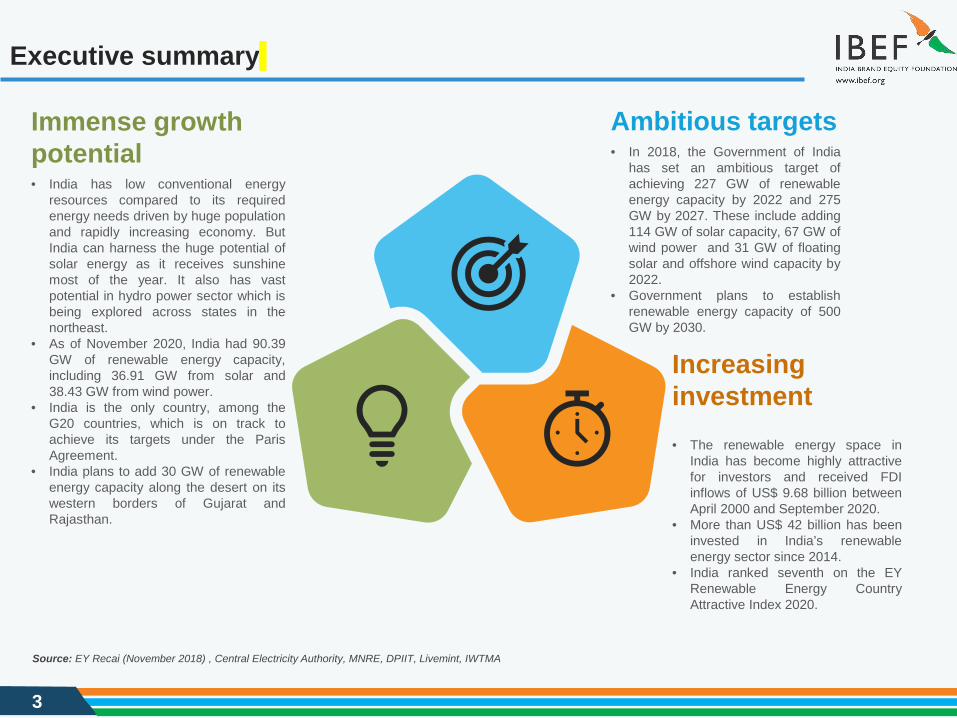
Increasing investment• The renewable energy space in
India has become highly attractivefor investors and received FDIinflows of US$ 9.68 billion betweenApril 2000 and September 2020.
• More than US$ 42 billion has beeninvested in India’s renewableenergy sector since 2014.
• India ranked seventh on the EYRenewable Energy CountryAttractive Index 2020.
Immense growth potential• India has low conventional energy
resources compared to its requiredenergy needs driven by huge populationand rapidly increasing economy. ButIndia can harness the huge potential ofsolar energy as it receives sunshinemost of the year. It also has vastpotential in hydro power sector which isbeing explored across states in thenortheast.
• As of November 2020, India had 90.39GW of renewable energy capacity,including 36.91 GW from solar and38.43 GW from wind power.
• India is the only country, among theG20 countries, which is on track toachieve its targets under the ParisAgreement.
• India plans to add 30 GW of renewableenergy capacity along the desert on itswestern borders of Gujarat andRajasthan.
Ambitious targets• In 2018, the Government of India
has set an ambitious target ofachieving 227 GW of renewableenergy capacity by 2022 and 275GW by 2027. These include adding114 GW of solar capacity, 67 GW ofwind power and 31 GW of floatingsolar and offshore wind capacity by2022.
• Government plans to establishrenewable energy capacity of 500GW by 2030.
Source: EY Recai (November 2018) , Central Electricity Authority, MNRE, DPIIT, Livemint, IWTMA
4
Advantage India
5
Advantage India
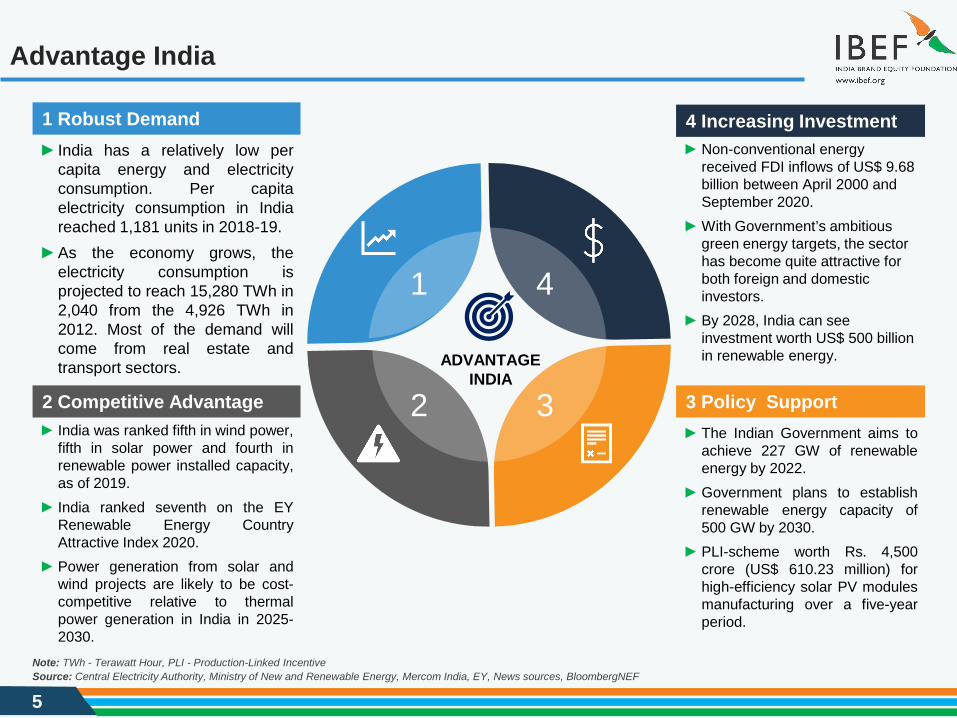
► India has a relatively low percapita energy and electricityconsumption. Per capitaelectricity consumption in Indiareached 1,181 units in 2018-19.
► As the economy grows, theelectricity consumption isprojected to reach 15,280 TWh in2,040 from the 4,926 TWh in2012. Most of the demand willcome from real estate andtransport sectors.
1 Robust Demand
► India was ranked fifth in wind power,fifth in solar power and fourth inrenewable power installed capacity,as of 2019.
► India ranked seventh on the EYRenewable Energy CountryAttractive Index 2020.
► Power generation from solar andwind projects are likely to be cost-competitive relative to thermalpower generation in India in 2025-2030.
2 Competitive Advantage► The Indian Government aims to
achieve 227 GW of renewableenergy by 2022.
► Government plans to establishrenewable energy capacity of500 GW by 2030.
► PLI-scheme worth Rs. 4,500crore (US$ 610.23 million) forhigh-efficiency solar PV modulesmanufacturing over a five-yearperiod.
3 Policy Support
► Non-conventional energy received FDI inflows of US$ 9.68 billion between April 2000 and September 2020.
► With Government’s ambitious green energy targets, the sector has become quite attractive for both foreign and domestic investors.
► By 2028, India can see investment worth US$ 500 billion in renewable energy.
4 Increasing Investment
ADVANTAGE INDIA
1 4
32
Source: Central Electricity Authority, Ministry of New and Renewable Energy, Mercom India, EY, News sources, BloombergNEFNote: TWh - Terawatt Hour, PLI - Production-Linked Incentive

6
Market Overview and Trends
MARKET OVERVIEW
7
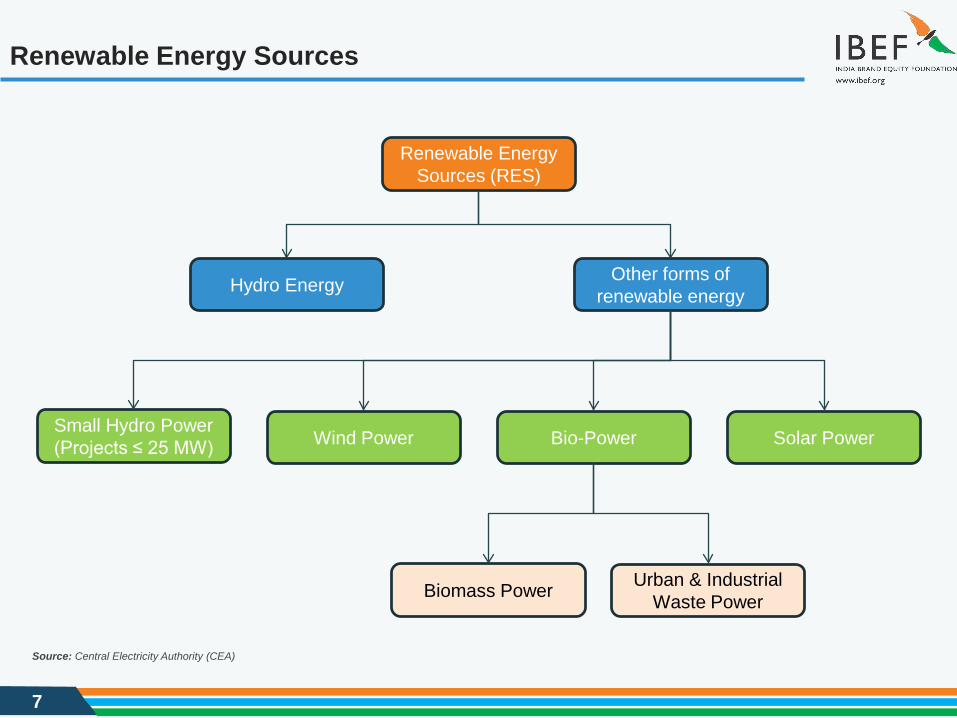
Renewable Energy Sources
Renewable Energy Sources (RES)
Other forms of renewable energyHydro Energy
Solar PowerSmall Hydro Power (Projects ≤ 25 MW) Wind Power Bio-Power
Urban & Industrial Waste PowerBiomass Power
Source: Central Electricity Authority (CEA)
8
Generation capacity has increased at a healthy pace… (1/2)
Source: Central Electricity Authority (CEA), International Renewable Energy Agency (IRENA), MNRENotes: GW- Gigawatt, 1Large Hydro power projects not included as they are not included in renewable energy targets of GOI, 2grid interactive capacity, *- Until November 2020
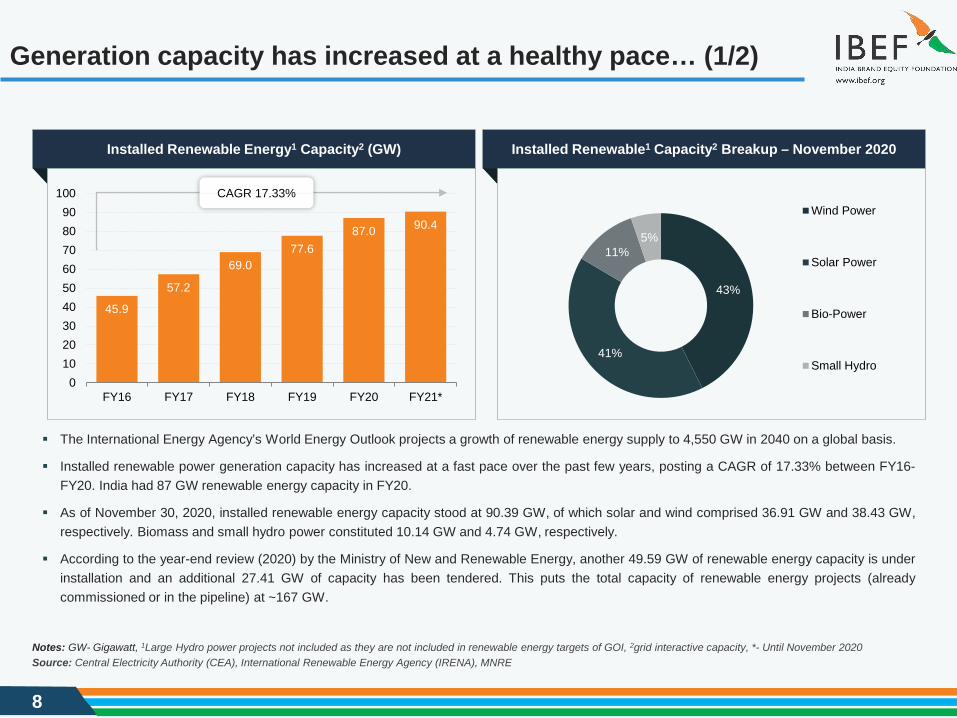
The International Energy Agency’s World Energy Outlook projects a growth of renewable energy supply to 4,550 GW in 2040 on a global basis.
Installed renewable power generation capacity has increased at a fast pace over the past few years, posting a CAGR of 17.33% between FY16-FY20. India had 87 GW renewable energy capacity in FY20.
As of November 30, 2020, installed renewable energy capacity stood at 90.39 GW, of which solar and wind comprised 36.91 GW and 38.43 GW,respectively. Biomass and small hydro power constituted 10.14 GW and 4.74 GW, respectively.
According to the year-end review (2020) by the Ministry of New and Renewable Energy, another 49.59 GW of renewable energy capacity is underinstallation and an additional 27.41 GW of capacity has been tendered. This puts the total capacity of renewable energy projects (alreadycommissioned or in the pipeline) at ~167 GW.
CAGR 17.33%
45.9
57.2
69.077.6
87.0 90.4
0102030405060708090
100
FY16 FY17 FY18 FY19 FY20 FY21*
43%
41%
11%5%
Wind Power
Solar Power
Bio-Power
Small Hydro
Installed Renewable Energy1 Capacity2 (GW) Installed Renewable1 Capacity2 Breakup – November 2020
9
Generation capacity has increased at a healthy pace…(2/2)
65.7
8
81.5
1
101.
84
126.
76
127.
01
0
20
40
60
80
100
120
140
FY16 FY17 FY18 FY19 FY20
Source: CEA, Make in India, MNRE, Mercom IndiaNote: RES - Renewable Energy Source, *Large Hydro power projects not included, SPV - Solar Photovoltaic System, MWeq - Megawatt Equivalent
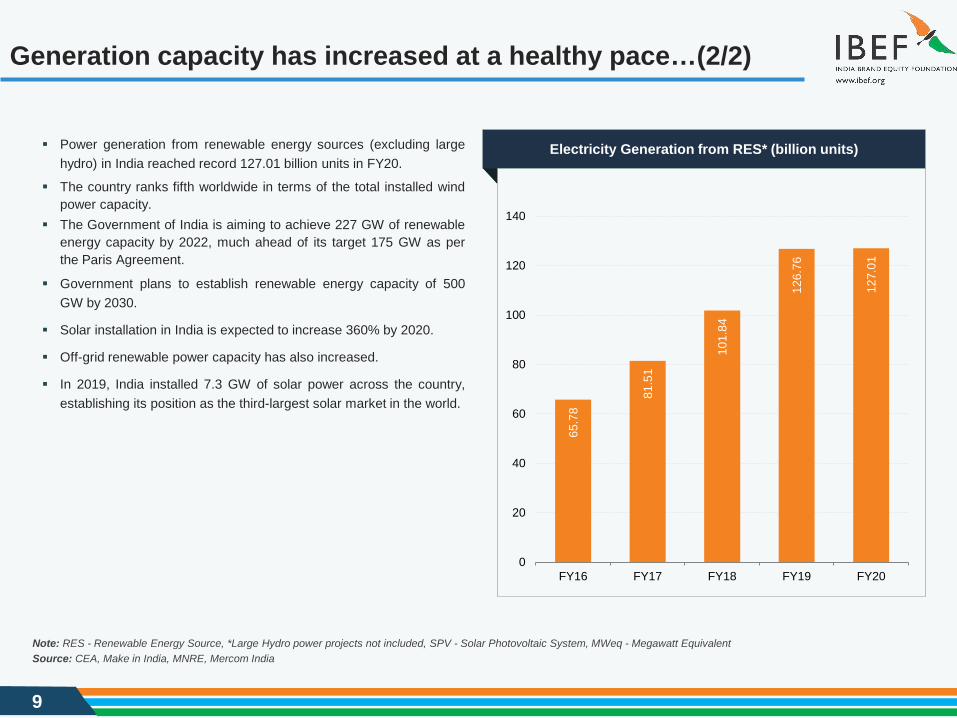
Power generation from renewable energy sources (excluding largehydro) in India reached record 127.01 billion units in FY20.
The country ranks fifth worldwide in terms of the total installed windpower capacity.
The Government of India is aiming to achieve 227 GW of renewableenergy capacity by 2022, much ahead of its target 175 GW as perthe Paris Agreement.
Government plans to establish renewable energy capacity of 500GW by 2030.
Solar installation in India is expected to increase 360% by 2020.
Off-grid renewable power capacity has also increased.
In 2019, India installed 7.3 GW of solar power across the country,establishing its position as the third-largest solar market in the world.
Electricity Generation from RES* (billion units)
10
Solar power generation growth likely to outweigh other sources by 2022
Due to its favourable location in the solar belt (400 S to 400 N), India is one of the best recipientsof solar energy with abundant availability.
Growth in solar power installed capacity is expected to surpass the installed capacity of windpower, reaching 114 GW by 2022. A total of 38 solar parks, with >25 GW of combined capacity,were approved in India until September 2020.
India stands 5th among countries with a maximum installed capacity of solar rooftop installations.Maharashtra, Tamil Nadu and Gujarat account for more than two-thirds of the solar rooftopinstallations in India and have an installed capacity of ~217 MW as of March 2020.
The biggest solar project financed in India is the 709 MW NLC Tangedco PV plant - which iscoming up at a cost of about US$ 500 million.
Adani Group aims to become the world’s largest solar power company by 2025 and the biggestrenewable energy firm by 2030.
In June 2020, Adani Green Energy won a major tender to set up 8 GW of manufacturing-linkedsolar energy project with an investment of Rs. 45,000 crore (US$ 6.38 billion).
In November 2020, SunSource Energy announced that it will develop a 4 MW grid-connectedfloating solar PV power project, along with a 2 MW Battery Energy Storage System in Andamanand Nicobar Islands, which was won in a tender bid with the Solar Energy Corporation of India.
In November 2020, Ladakh got the largest solar power project set-up under the centralgovernment’s 'Make In India' initiative at Leh Indian Air Force Station with a capacity of 1.5 MW.
In December 2020, the solar power tariff dropped to an all-time low of Rs. 1.99 per unit in anauction of projects of 500 MW capacity by the Gujarat Urja Vikas Nigam Ltd. (GUVNL).
The world's largest floating 600 MW solar energy project will be constructed at the OmkareshwarDam in the Khandwa district of Madhya Pradesh at the estimated cost of Rs. 3,000 crore. Theproject is expected to begin power generation by FY23.
Source: CEA, Make in India, India Solar Handbook 2017, MNRE, Mercom India, Bloomberg NEF, Solar Energy Corporation of India, News Article
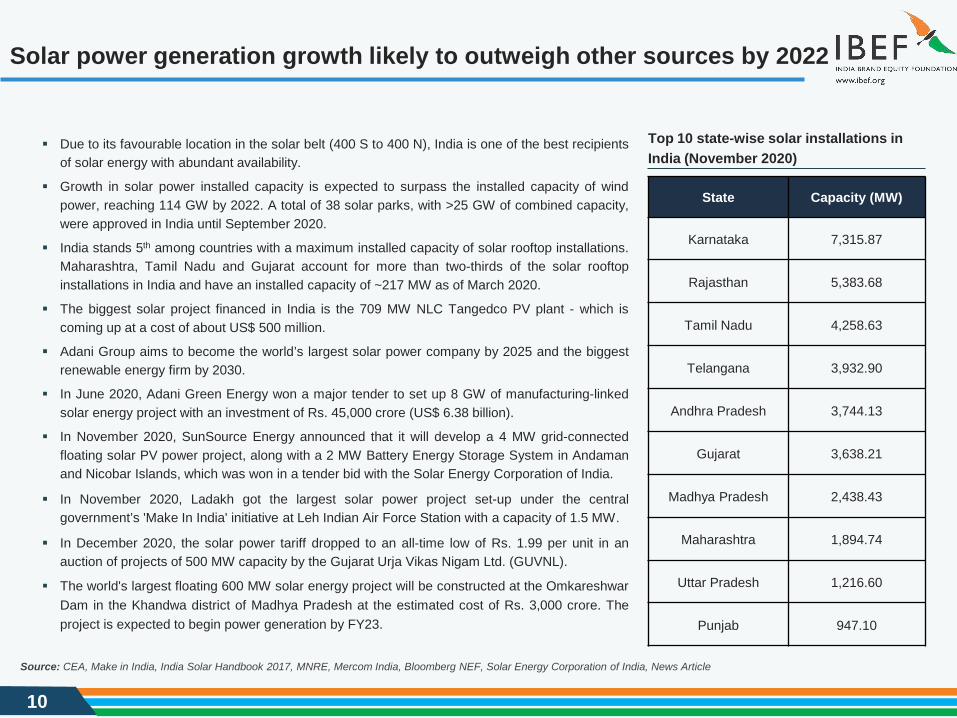
Top 10 state-wise solar installations in India (November 2020)
State Capacity (MW)
Karnataka 7,315.87
Rajasthan 5,383.68
Tamil Nadu 4,258.63
Telangana 3,932.90
Andhra Pradesh 3,744.13
Gujarat 3,638.21
Madhya Pradesh 2,438.43
Maharashtra 1,894.74
Uttar Pradesh 1,216.60
Punjab 947.10
11
Growth in hydro power
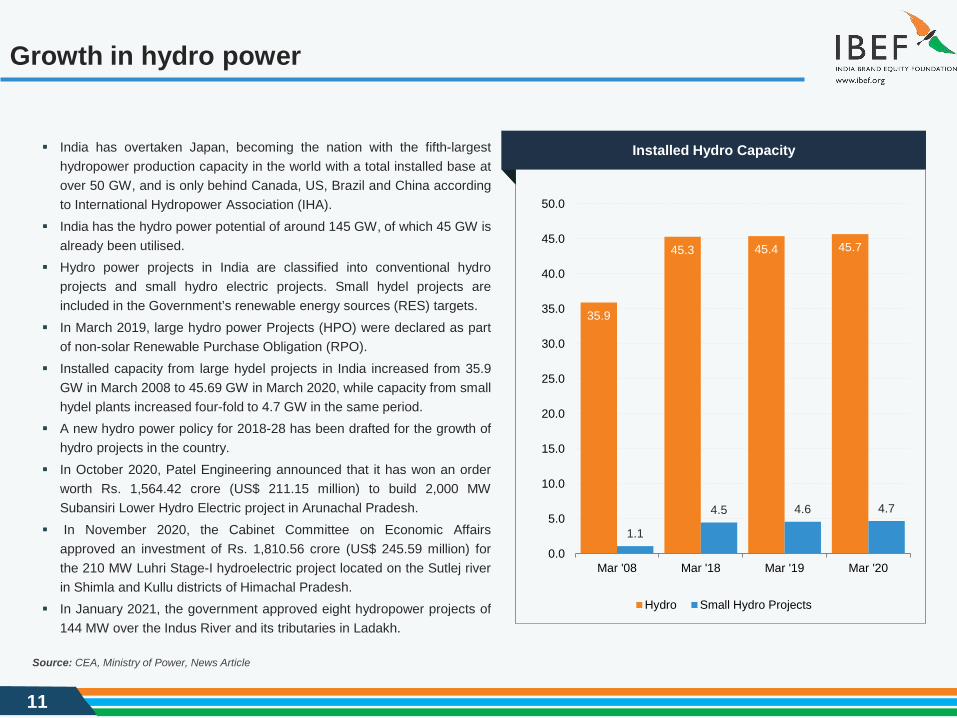
India has overtaken Japan, becoming the nation with the fifth-largesthydropower production capacity in the world with a total installed base atover 50 GW, and is only behind Canada, US, Brazil and China accordingto International Hydropower Association (IHA).
India has the hydro power potential of around 145 GW, of which 45 GW isalready been utilised.
Hydro power projects in India are classified into conventional hydroprojects and small hydro electric projects. Small hydel projects areincluded in the Government’s renewable energy sources (RES) targets.
In March 2019, large hydro power Projects (HPO) were declared as partof non-solar Renewable Purchase Obligation (RPO).
Installed capacity from large hydel projects in India increased from 35.9GW in March 2008 to 45.69 GW in March 2020, while capacity from smallhydel plants increased four-fold to 4.7 GW in the same period.
A new hydro power policy for 2018-28 has been drafted for the growth ofhydro projects in the country.
In October 2020, Patel Engineering announced that it has won an orderworth Rs. 1,564.42 crore (US$ 211.15 million) to build 2,000 MWSubansiri Lower Hydro Electric project in Arunachal Pradesh.
In November 2020, the Cabinet Committee on Economic Affairsapproved an investment of Rs. 1,810.56 crore (US$ 245.59 million) forthe 210 MW Luhri Stage-I hydroelectric project located on the Sutlej riverin Shimla and Kullu districts of Himachal Pradesh.
In January 2021, the government approved eight hydropower projects of144 MW over the Indus River and its tributaries in Ladakh.
Source: CEA, Ministry of Power, News Article
35.9
45.3 45.4 45.7
1.1
4.5 4.6 4.7
0.0
5.0
10.0
15.0
20.0
25.0
30.0
35.0
40.0
45.0
50.0
Mar '08 Mar '18 Mar '19 Mar '20
Hydro Small Hydro Projects
Installed Hydro Capacity

12
Strategies Adopted
RECENT TRENDS AND STRATEGIES
13
Strategies adopted
3
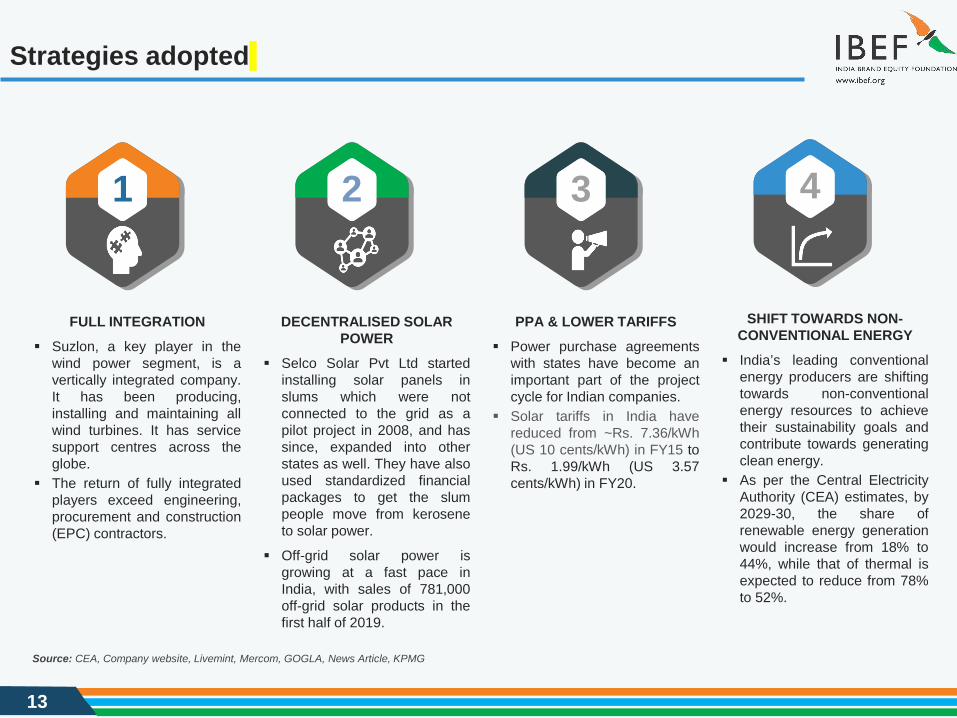
PPA & LOWER TARIFFS Power purchase agreements
with states have become animportant part of the projectcycle for Indian companies.
Solar tariffs in India havereduced from ~Rs. 7.36/kWh(US 10 cents/kWh) in FY15 toRs. 1.99/kWh (US 3.57cents/kWh) in FY20.
2
DECENTRALISED SOLAR POWER
Selco Solar Pvt Ltd startedinstalling solar panels inslums which were notconnected to the grid as apilot project in 2008, and hassince, expanded into otherstates as well. They have alsoused standardized financialpackages to get the slumpeople move from keroseneto solar power.
Off-grid solar power isgrowing at a fast pace inIndia, with sales of 781,000off-grid solar products in thefirst half of 2019.
1
FULL INTEGRATION Suzlon, a key player in the
wind power segment, is avertically integrated company.It has been producing,installing and maintaining allwind turbines. It has servicesupport centres across theglobe.
The return of fully integratedplayers exceed engineering,procurement and construction(EPC) contractors.
4
SHIFT TOWARDS NON-CONVENTIONAL ENERGY
India’s leading conventionalenergy producers are shiftingtowards non-conventionalenergy resources to achievetheir sustainability goals andcontribute towards generatingclean energy.
As per the Central ElectricityAuthority (CEA) estimates, by2029-30, the share ofrenewable energy generationwould increase from 18% to44%, while that of thermal isexpected to reduce from 78%to 52%.
Source: CEA, Company website, Livemint, Mercom, GOGLA, News Article, KPMG

14
Growth Drivers
GROWTH DRIVERS
15
Renewable energy growth drivers
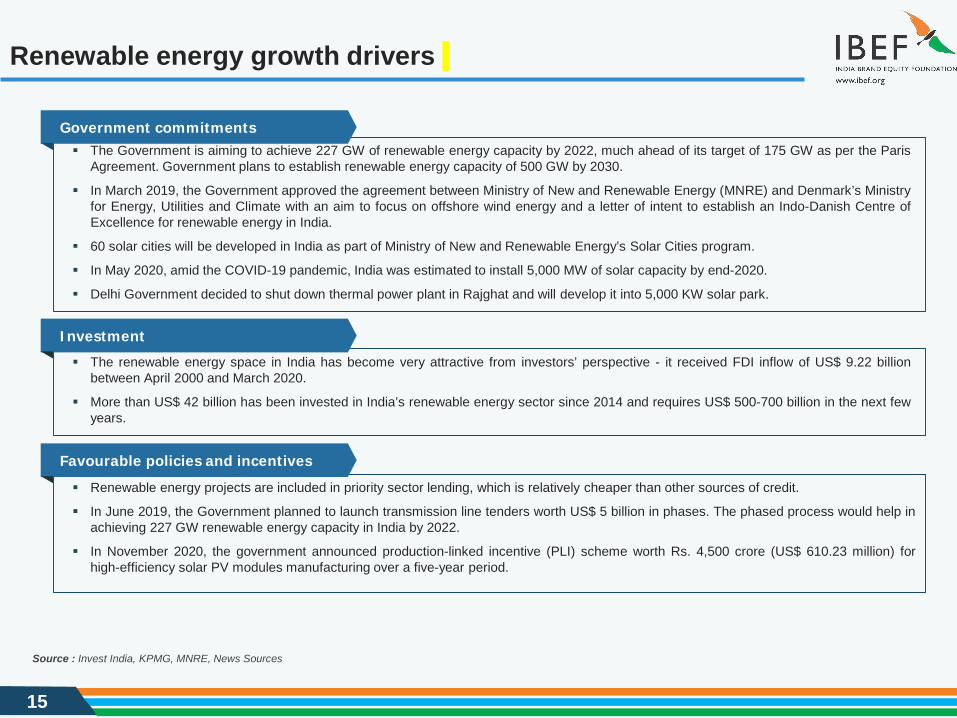
The Government is aiming to achieve 227 GW of renewable energy capacity by 2022, much ahead of its target of 175 GW as per the ParisAgreement. Government plans to establish renewable energy capacity of 500 GW by 2030.
In March 2019, the Government approved the agreement between Ministry of New and Renewable Energy (MNRE) and Denmark’s Ministryfor Energy, Utilities and Climate with an aim to focus on offshore wind energy and a letter of intent to establish an Indo-Danish Centre ofExcellence for renewable energy in India.
60 solar cities will be developed in India as part of Ministry of New and Renewable Energy’s Solar Cities program.
In May 2020, amid the COVID-19 pandemic, India was estimated to install 5,000 MW of solar capacity by end-2020.
Delhi Government decided to shut down thermal power plant in Rajghat and will develop it into 5,000 KW solar park.
Government commitments
Renewable energy projects are included in priority sector lending, which is relatively cheaper than other sources of credit.
In June 2019, the Government planned to launch transmission line tenders worth US$ 5 billion in phases. The phased process would help inachieving 227 GW renewable energy capacity in India by 2022.
In November 2020, the government announced production-linked incentive (PLI) scheme worth Rs. 4,500 crore (US$ 610.23 million) forhigh-efficiency solar PV modules manufacturing over a five-year period.
Favourable policies and incentives
The renewable energy space in India has become very attractive from investors’ perspective - it received FDI inflow of US$ 9.22 billionbetween April 2000 and March 2020.
More than US$ 42 billion has been invested in India’s renewable energy sector since 2014 and requires US$ 500-700 billion in the next fewyears.
Investment
Source : Invest India, KPMG, MNRE, News Sources
16
Government policies
5
4
1 6
3
2
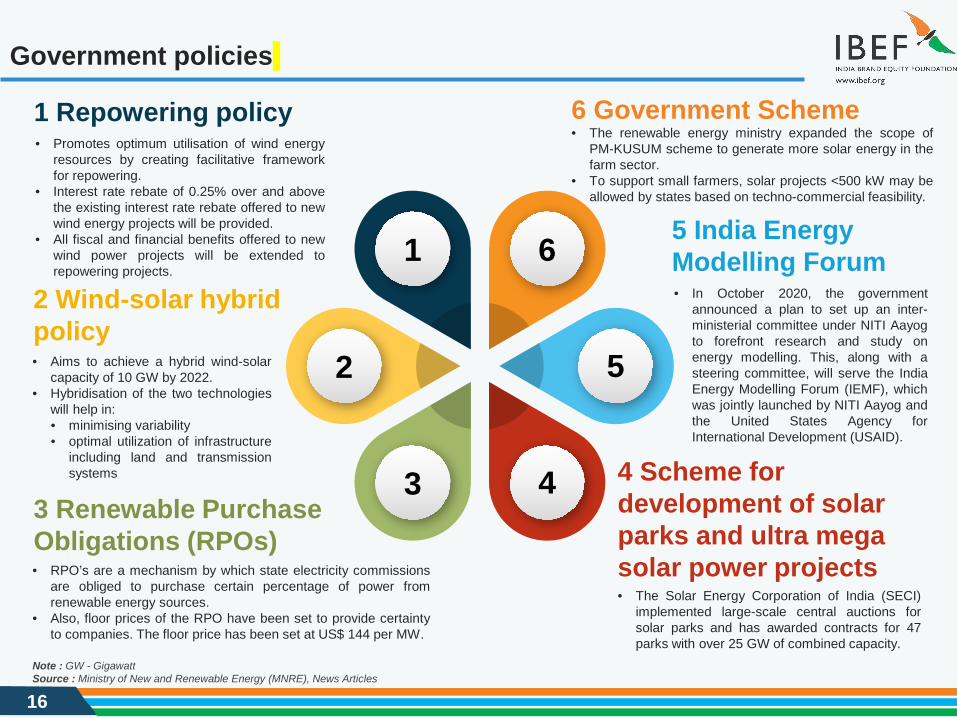
2 Wind-solar hybrid policy• Aims to achieve a hybrid wind-solar
capacity of 10 GW by 2022.• Hybridisation of the two technologies
will help in:• minimising variability• optimal utilization of infrastructure
including land and transmissionsystems
3 Renewable Purchase Obligations (RPOs)• RPO’s are a mechanism by which state electricity commissions
are obliged to purchase certain percentage of power fromrenewable energy sources.
• Also, floor prices of the RPO have been set to provide certaintyto companies. The floor price has been set at US$ 144 per MW.
1 Repowering policy• Promotes optimum utilisation of wind energy
resources by creating facilitative frameworkfor repowering.
• Interest rate rebate of 0.25% over and abovethe existing interest rate rebate offered to newwind energy projects will be provided.
• All fiscal and financial benefits offered to newwind power projects will be extended torepowering projects.
5 India Energy Modelling Forum• In October 2020, the government
announced a plan to set up an inter-ministerial committee under NITI Aayogto forefront research and study onenergy modelling. This, along with asteering committee, will serve the IndiaEnergy Modelling Forum (IEMF), whichwas jointly launched by NITI Aayog andthe United States Agency forInternational Development (USAID).
4 Scheme for development of solar parks and ultra mega solar power projects• The Solar Energy Corporation of India (SECI)
implemented large-scale central auctions forsolar parks and has awarded contracts for 47parks with over 25 GW of combined capacity.
6 Government Scheme• The renewable energy ministry expanded the scope of
PM-KUSUM scheme to generate more solar energy in thefarm sector.
• To support small farmers, solar projects <500 kW may beallowed by states based on techno-commercial feasibility.
Source : Ministry of New and Renewable Energy (MNRE), News Articles Note : GW - Gigawatt
17
Government initiatives
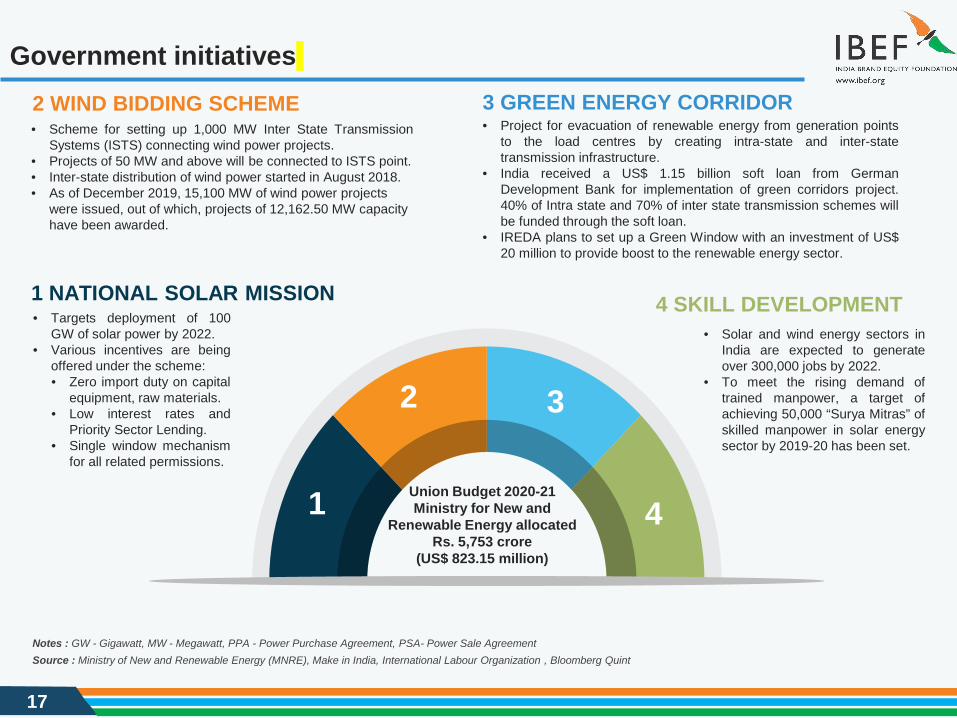
4 SKILL DEVELOPMENT • Solar and wind energy sectors in
India are expected to generateover 300,000 jobs by 2022.
• To meet the rising demand oftrained manpower, a target ofachieving 50,000 “Surya Mitras” ofskilled manpower in solar energysector by 2019-20 has been set.
1 NATIONAL SOLAR MISSION
3 GREEN ENERGY CORRIDOR• Project for evacuation of renewable energy from generation points
to the load centres by creating intra-state and inter-statetransmission infrastructure.
• India received a US$ 1.15 billion soft loan from GermanDevelopment Bank for implementation of green corridors project.40% of Intra state and 70% of inter state transmission schemes willbe funded through the soft loan.
• IREDA plans to set up a Green Window with an investment of US$20 million to provide boost to the renewable energy sector.
2 WIND BIDDING SCHEME• Scheme for setting up 1,000 MW Inter State Transmission
Systems (ISTS) connecting wind power projects.• Projects of 50 MW and above will be connected to ISTS point.• Inter-state distribution of wind power started in August 2018.• As of December 2019, 15,100 MW of wind power projects
were issued, out of which, projects of 12,162.50 MW capacity have been awarded.
• Targets deployment of 100GW of solar power by 2022.
• Various incentives are beingoffered under the scheme:• Zero import duty on capital
equipment, raw materials.• Low interest rates and
Priority Sector Lending.• Single window mechanism
for all related permissions.
Union Budget 2020-21 Ministry for New and
Renewable Energy allocatedRs. 5,753 crore
(US$ 823.15 million)
1
2 3
4
Source : Ministry of New and Renewable Energy (MNRE), Make in India, International Labour Organization , Bloomberg QuintNotes : GW - Gigawatt, MW - Megawatt, PPA - Power Purchase Agreement, PSA- Power Sale Agreement
18
Increasing investments: FDI inflow and key deals… (1/2)
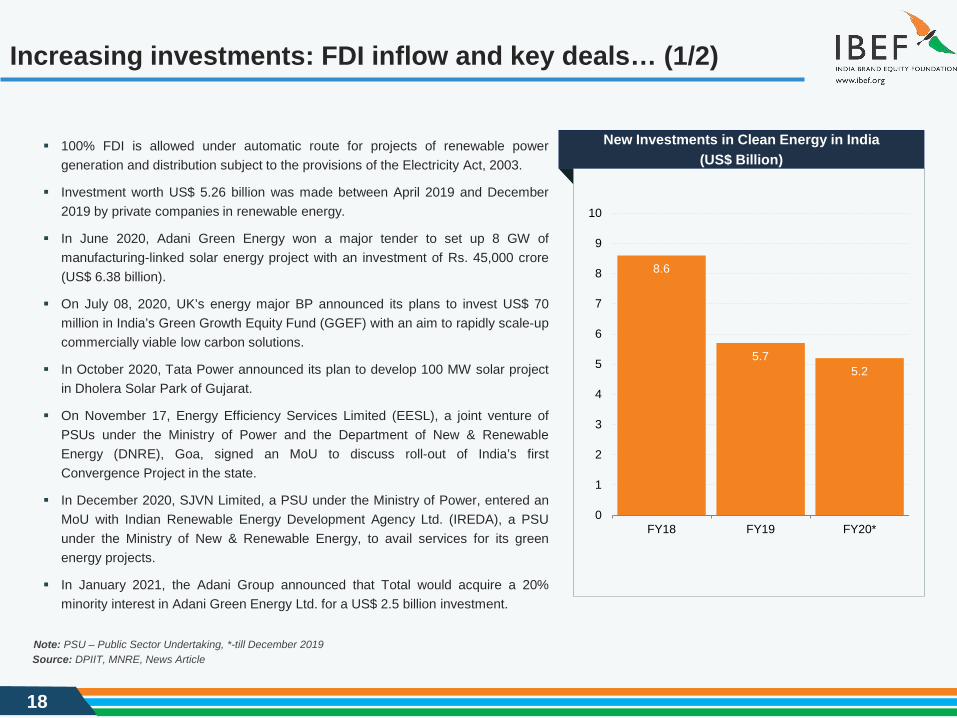
8.6
5.75.2
0
1
2
3
4
5
6
7
8
9
10
FY18 FY19 FY20*
Source: DPIIT, MNRE, News Article
100% FDI is allowed under automatic route for projects of renewable powergeneration and distribution subject to the provisions of the Electricity Act, 2003.
Investment worth US$ 5.26 billion was made between April 2019 and December2019 by private companies in renewable energy.
In June 2020, Adani Green Energy won a major tender to set up 8 GW ofmanufacturing-linked solar energy project with an investment of Rs. 45,000 crore(US$ 6.38 billion).
On July 08, 2020, UK’s energy major BP announced its plans to invest US$ 70million in India’s Green Growth Equity Fund (GGEF) with an aim to rapidly scale-upcommercially viable low carbon solutions.
In October 2020, Tata Power announced its plan to develop 100 MW solar projectin Dholera Solar Park of Gujarat.
On November 17, Energy Efficiency Services Limited (EESL), a joint venture ofPSUs under the Ministry of Power and the Department of New & RenewableEnergy (DNRE), Goa, signed an MoU to discuss roll-out of India’s firstConvergence Project in the state.
In December 2020, SJVN Limited, a PSU under the Ministry of Power, entered anMoU with Indian Renewable Energy Development Agency Ltd. (IREDA), a PSUunder the Ministry of New & Renewable Energy, to avail services for its greenenergy projects.
In January 2021, the Adani Group announced that Total would acquire a 20%minority interest in Adani Green Energy Ltd. for a US$ 2.5 billion investment.
Note: PSU – Public Sector Undertaking, *-till December 2019
New Investments in Clean Energy in India (US$ Billion)
19
Increasing investments: FDI inflow and key deals… (2/2)
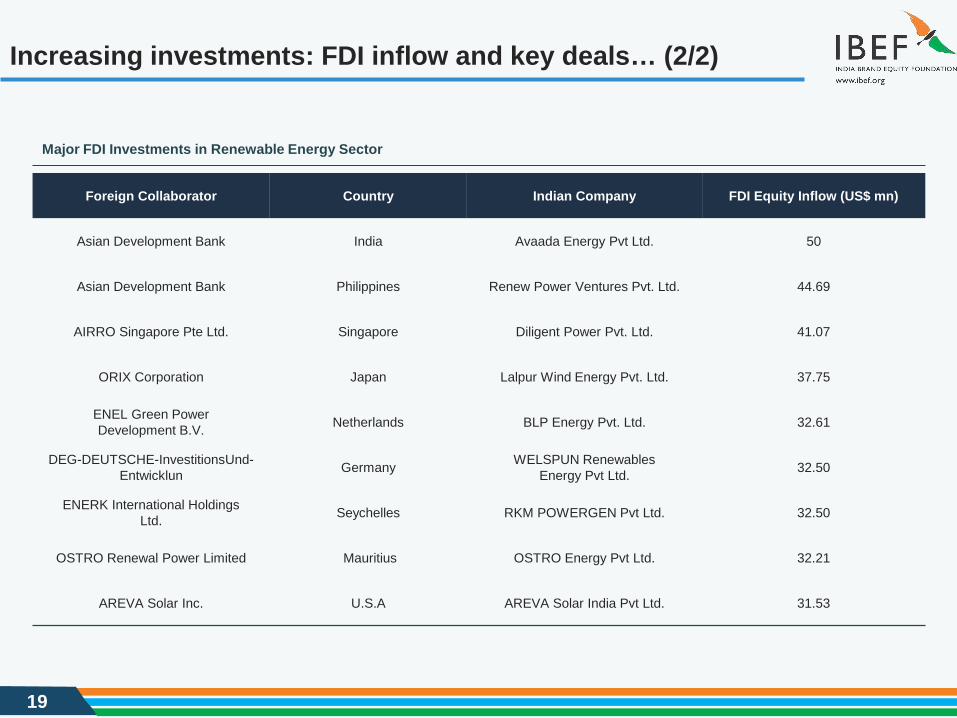
Foreign Collaborator Country Indian Company FDI Equity Inflow (US$ mn)
Asian Development Bank India Avaada Energy Pvt Ltd. 50
Asian Development Bank Philippines Renew Power Ventures Pvt. Ltd. 44.69
AIRRO Singapore Pte Ltd. Singapore Diligent Power Pvt. Ltd. 41.07
ORIX Corporation Japan Lalpur Wind Energy Pvt. Ltd. 37.75
ENEL Green PowerDevelopment B.V. Netherlands BLP Energy Pvt. Ltd. 32.61
DEG-DEUTSCHE-InvestitionsUnd-Entwicklun Germany WELSPUN Renewables
Energy Pvt Ltd. 32.50
ENERK International HoldingsLtd. Seychelles RKM POWERGEN Pvt Ltd. 32.50
OSTRO Renewal Power Limited Mauritius OSTRO Energy Pvt Ltd. 32.21
AREVA Solar Inc. U.S.A AREVA Solar India Pvt Ltd. 31.53
Major FDI Investments in Renewable Energy Sector

20
Opportunities
OPPORTUNITIES
21
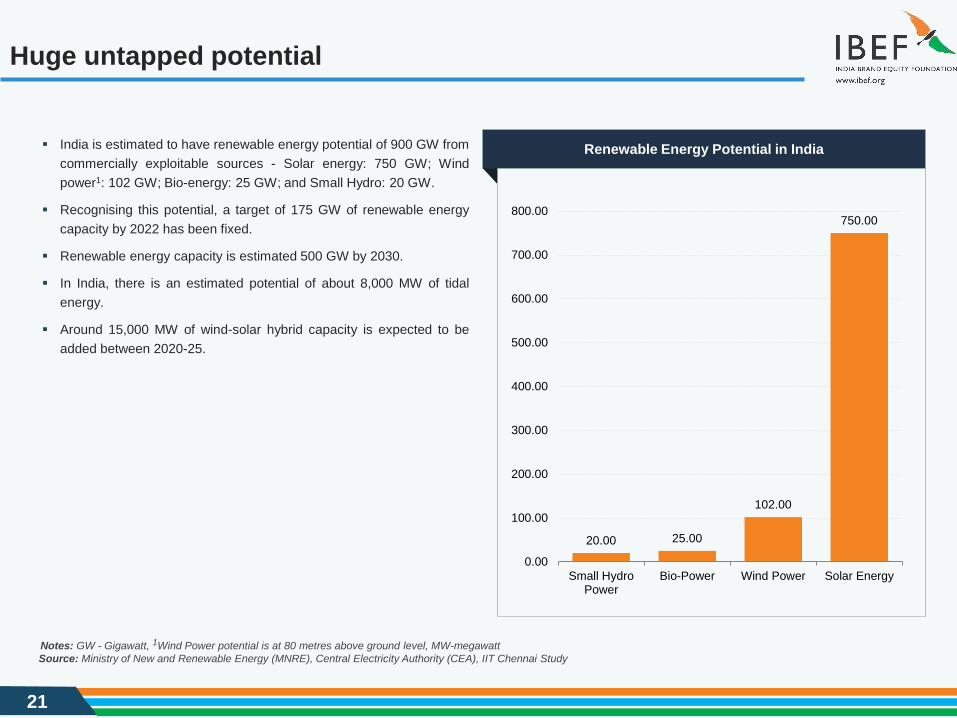
Huge untapped potential
20.00 25.00
102.00
750.00
0.00
100.00
200.00
300.00
400.00
500.00
600.00
700.00
800.00
Small HydroPower
Bio-Power Wind Power Solar Energy
Source: Ministry of New and Renewable Energy (MNRE), Central Electricity Authority (CEA), IIT Chennai StudyNotes: GW - Gigawatt, 1Wind Power potential is at 80 metres above ground level, MW-megawatt
India is estimated to have renewable energy potential of 900 GW fromcommercially exploitable sources - Solar energy: 750 GW; Windpower1: 102 GW; Bio-energy: 25 GW; and Small Hydro: 20 GW.
Recognising this potential, a target of 175 GW of renewable energycapacity by 2022 has been fixed.
Renewable energy capacity is estimated 500 GW by 2030.
In India, there is an estimated potential of about 8,000 MW of tidalenergy.
Around 15,000 MW of wind-solar hybrid capacity is expected to beadded between 2020-25.
Renewable Energy Potential in India
22
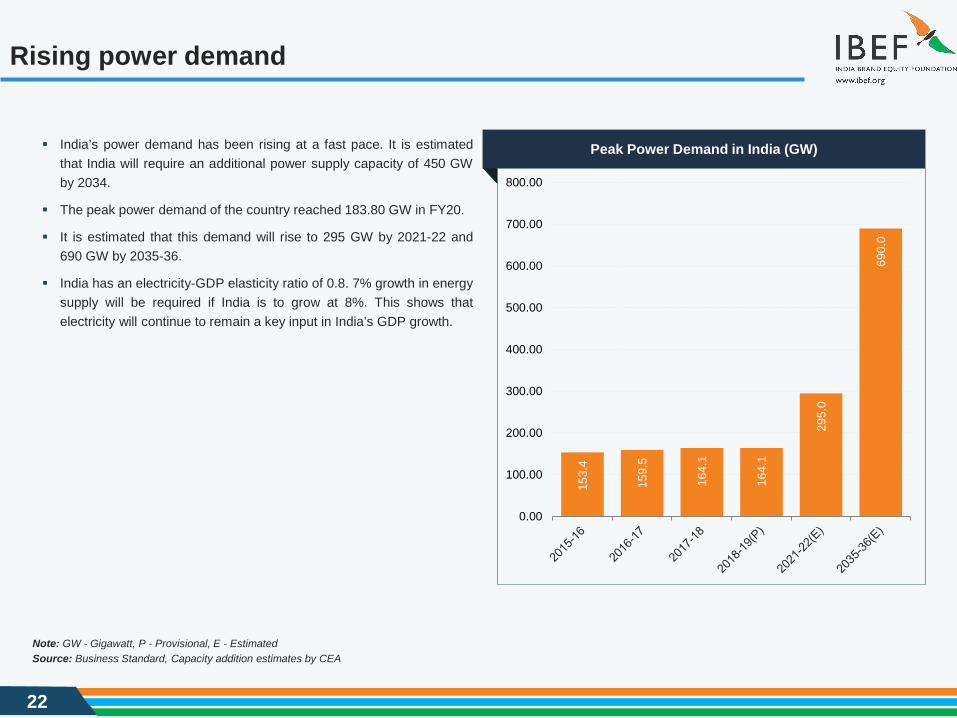
Rising power demand
Source: Business Standard, Capacity addition estimates by CEANote: GW - Gigawatt, P - Provisional, E - Estimated
India’s power demand has been rising at a fast pace. It is estimatedthat India will require an additional power supply capacity of 450 GWby 2034.
The peak power demand of the country reached 183.80 GW in FY20.
It is estimated that this demand will rise to 295 GW by 2021-22 and690 GW by 2035-36.
India has an electricity-GDP elasticity ratio of 0.8. 7% growth in energysupply will be required if India is to grow at 8%. This shows thatelectricity will continue to remain a key input in India’s GDP growth.
153.
4
159.
5
164.
1
164.
1
295.
0
690.
0
0.00
100.00
200.00
300.00
400.00
500.00
600.00
700.00
800.00
Peak Power Demand in India (GW)
23
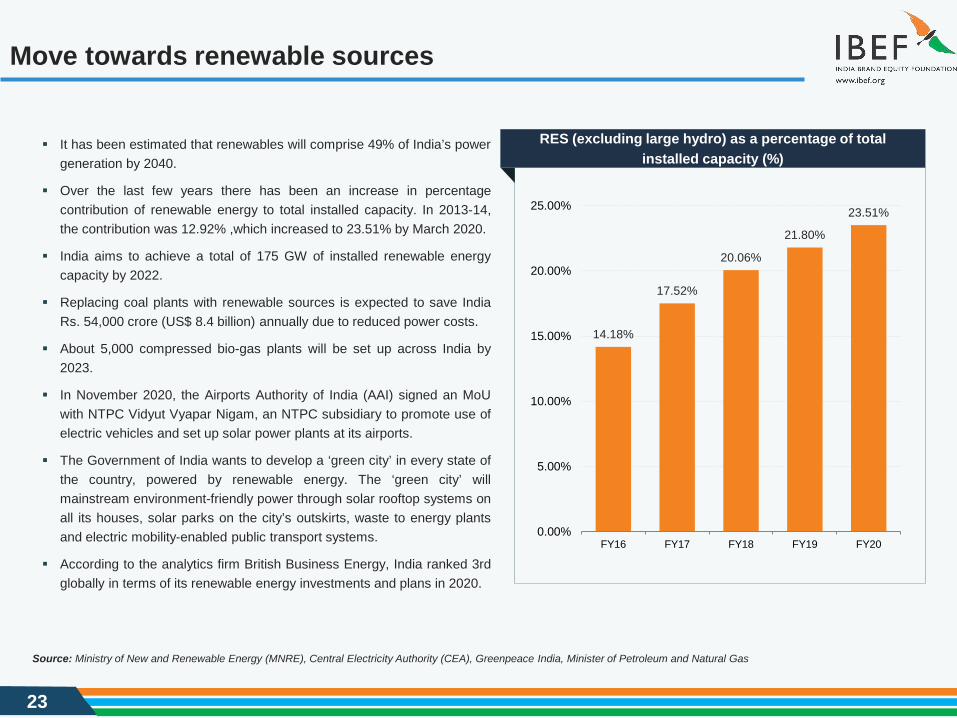
Move towards renewable sources
It has been estimated that renewables will comprise 49% of India’s powergeneration by 2040.
Over the last few years there has been an increase in percentagecontribution of renewable energy to total installed capacity. In 2013-14,the contribution was 12.92% ,which increased to 23.51% by March 2020.
India aims to achieve a total of 175 GW of installed renewable energycapacity by 2022.
Replacing coal plants with renewable sources is expected to save IndiaRs. 54,000 crore (US$ 8.4 billion) annually due to reduced power costs.
About 5,000 compressed bio-gas plants will be set up across India by2023.
In November 2020, the Airports Authority of India (AAI) signed an MoUwith NTPC Vidyut Vyapar Nigam, an NTPC subsidiary to promote use ofelectric vehicles and set up solar power plants at its airports.
The Government of India wants to develop a ‘green city’ in every state ofthe country, powered by renewable energy. The ‘green city’ willmainstream environment-friendly power through solar rooftop systems onall its houses, solar parks on the city’s outskirts, waste to energy plantsand electric mobility-enabled public transport systems.
According to the analytics firm British Business Energy, India ranked 3rdglobally in terms of its renewable energy investments and plans in 2020.
Source: Ministry of New and Renewable Energy (MNRE), Central Electricity Authority (CEA), Greenpeace India, Minister of Petroleum and Natural Gas
14.18%
17.52%
20.06%
21.80%
23.51%
0.00%
5.00%
10.00%
15.00%
20.00%
25.00%
FY16 FY17 FY18 FY19 FY20
RES (excluding large hydro) as a percentage of total installed capacity (%)

24
Key Industry Contacts
25
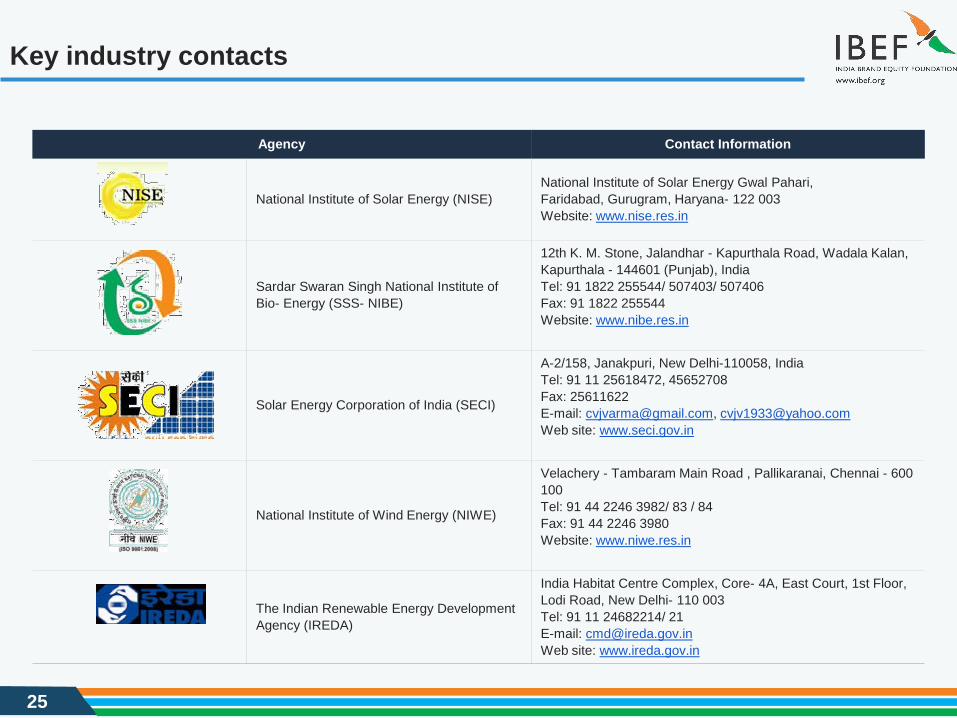
Key industry contacts
Agency Contact Information
National Institute of Solar Energy (NISE)National Institute of Solar Energy Gwal Pahari,Faridabad, Gurugram, Haryana- 122 003Website: www.nise.res.in
Sardar Swaran Singh National Institute of Bio- Energy (SSS- NIBE)
12th K. M. Stone, Jalandhar - Kapurthala Road, Wadala Kalan, Kapurthala - 144601 (Punjab), IndiaTel: 91 1822 255544/ 507403/ 507406Fax: 91 1822 255544Website: www.nibe.res.in
Solar Energy Corporation of India (SECI)
A-2/158, Janakpuri, New Delhi-110058, IndiaTel: 91 11 25618472, 45652708Fax: 25611622E-mail: [email protected], [email protected] site: www.seci.gov.in
National Institute of Wind Energy (NIWE)
Velachery - Tambaram Main Road , Pallikaranai, Chennai - 600 100 Tel: 91 44 2246 3982/ 83 / 84 Fax: 91 44 2246 3980Website: www.niwe.res.in
The Indian Renewable Energy Development Agency (IREDA)
India Habitat Centre Complex, Core- 4A, East Court, 1st Floor, Lodi Road, New Delhi- 110 003Tel: 91 11 24682214/ 21E-mail: [email protected] site: www.ireda.gov.in
26
Appendix
27
Glossary
CAGR: Compound Annual Growth Rate
FDI: Foreign Direct Investment
FY: Indian Financial Year (April to March)
GOI: Government of India
Rs.: Indian Rupee
US$: US Dollar
Wherever applicable, numbers have been rounded off to the nearest whole number
28
Exchange rates
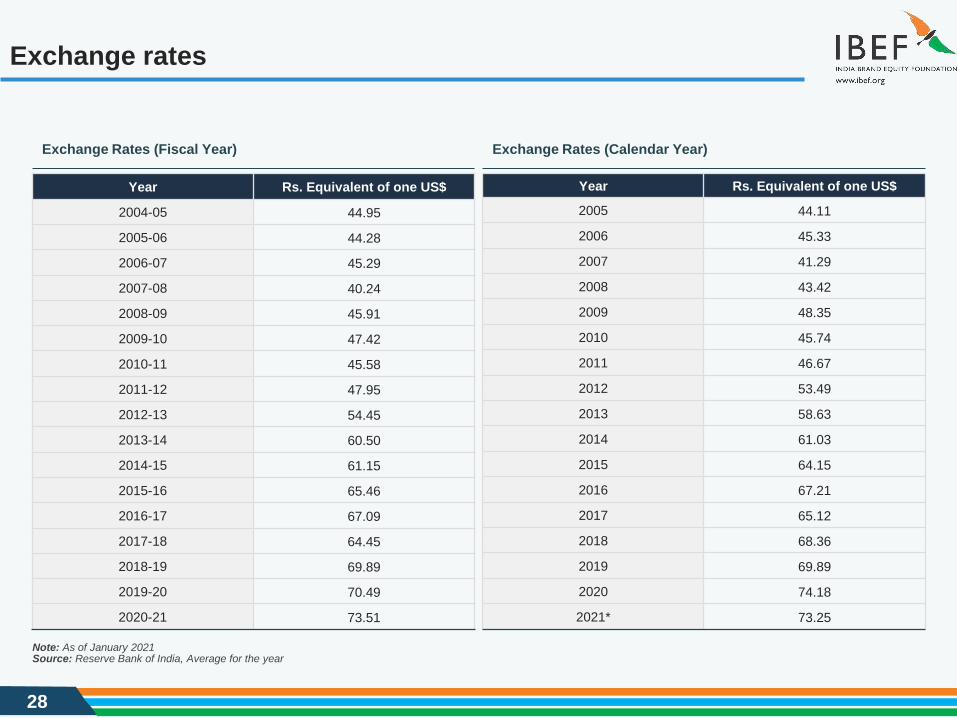
Exchange Rates (Fiscal Year) Exchange Rates (Calendar Year)
Year Rs. Equivalent of one US$
2004-05 44.95
2005-06 44.28
2006-07 45.29
2007-08 40.24
2008-09 45.91
2009-10 47.42
2010-11 45.58
2011-12 47.95
2012-13 54.45
2013-14 60.50
2014-15 61.15
2015-16 65.46
2016-17 67.09
2017-18 64.45
2018-19 69.89
2019-20 70.49
2020-21 73.51
Source: Reserve Bank of India, Average for the yearNote: As of January 2021
Year Rs. Equivalent of one US$
2005 44.11
2006 45.33
2007 41.29
2008 43.42
2009 48.35
2010 45.74
2011 46.67
2012 53.49
2013 58.63
2014 61.03
2015 64.15
2016 67.21
2017 65.12
2018 68.36
2019 69.89
2020 74.18
2021* 73.25
29
Disclaimer
India Brand Equity Foundation (IBEF) engaged Sutherland Global Services private Limited to prepare/update this presentation.
All rights reserved. All copyright in this presentation and related works is solely and exclusively owned by IBEF, delivered during the course ofengagement under the Professional Service Agreement signed by the Parties. The same may not be reproduced, wholly or in part in any materialform (including photocopying or storing it in any medium by electronic means and whether or not transiently or incidentally to some other use of thispresentation), modified or in any manner communicated to any third party except with the written approval of IBEF.
This presentation is for information purposes only. While due care has been taken during the compilation of this presentation to ensure that theinformation is accurate to the best of Sutherland Global Services’ Private Limited and IBEF’s knowledge and belief, the content is not to be construedin any manner whatsoever as a substitute for professional advice.
Sutherland Global Services Private Limited and IBEF neither recommend nor endorse any specific products or services that may have beenmentioned in this presentation and nor do they assume any liability, damages or responsibility for the outcome of decisions taken as a result of anyreliance placed on this presentation.
Neither Sutherland Global Services Private Limited nor IBEF shall be liable for any special, direct, indirect or consequential damages that may arisedue to any act or omission on the part of the user due to any reliance placed or guidance taken from any portion of this presentation.


![[PPT]Chapter 18 Renewable Energy 18-1 Renewable …environmentalscienceclass.weebly.com/.../ch_18_notes.ppt · Web viewChapter 18 Renewable Energy 18-1 Renewable Energy Today Renewable](https://img.pdfslide.us/doc/110x75/5b029fb97f8b9a6a2e900bdf/pptchapter-18-renewable-energy-18-1-renewable-envir-viewchapter-18-renewable.jpg)