Embed Size (px)
Citation preview

November 2013
Renewable Energy & Environmental Technologies

Investment Support and Promotion Agency of Turkey
2
Disclaimer Republic of Turkey Prime Ministry Investment Support and Promotion Agency (ISPAT) submits the information provided by third parties in good faith. ISPAT has no obligation to check and examine this information and takes no responsibility for any misstatement or false declaration. ISPAT does not guarantee the accuracy, currency, reliability, correctness or legality of any information provided by third parties. ISPAT accepts no responsibility for the content of any information, news or article in the document and cannot be considered as approving any opinion declared by third parties. ISPAT explicitly states that; it is not liable for any loss, negligence, tort or other damages caused by actions and agreements based on the information provided by third parties. Deloitte accepts no liability to any party who is shown or gains access to this document. The opinions expressed in this report are based on Deloitte Consulting’s judgment and analysis of key factors. However, the actual operation and results of the analyzed sector may differ from those projected herein. Deloitte does not warrant that actual results will be the same as the projected results. Neither Deloitte nor any individuals signing or associated with this report shall be required by reason of this report to give further consultation, to provide testimony or appear in court or other legal proceedings, unless specific arrangements thereof have been made. All opinions and estimates included in this report constitute our judgment as of this date and are subject to change without notice and may become outdated.

Investment Support and Promotion Agency of Turkey
Acronym Definition
BOTAŞ Petroleum Pipeline Corporation
BRIC Brazil, Russia, India, China
BSR Balancing and Settlement Regulation
CAGR Compound Annual Growth Rate
DSI General Directorate of State Hydraulic Works
EIU Economist Intelligence Unit
EML Electricity Market Law
EMRA/EPDK Energy Market Regulatory Authority
ENTSO-E European Network of Transmission System Operators - Electricity
EPİAŞ Independent Energy Exchange (to be established)
EU European Union
EÜAŞ State Owned Generation Company
FDI Foreign Direct Investment
Glossary of Terms
Acronym Definition
GDP Gross Domestic Product
GHG Greenhouse Gases
GW Gigawatt
GWh Gigawatt Hours
HEPP Hydroelectric Power Plants
IEA International Energy Agency
IPCC Intergovernmental Panel on Climate Change
IPP Independent Power Producer
LEED Leadership in Energy and Environmental Design
LNG Liquefied Natural Gas
LPG Liquefied Petroleum Gas
M&A Mergers and Acquisitions
MoEU Ministry of Environment & Urbanization
3

Investment Support and Promotion Agency of Turkey
Acronym Definition
MENR Ministry of Energy and Natural Resources
MMTCDE Million Metric Tons of Carbon Dioxide Equivalents
MTA The General Directorate of Mineral Research and Exploration
NGO Non-Governmental Organization
NMVOC Non-Methane Volatile Organic Compounds Emissions
OECD Organization for Economic Co-operation and Development
OSB Organized Industrial Zones
PMUM State-Owned Market Operator within TEİAŞ
R&D Research and Development
REL Renewable Energy Law
ROR Run of River
TEDAŞ State-Owned Distribution Company
TEİAŞ State-Owned Transmission Company
Acronym Definition
TETAŞ State-Owned Wholesale Company
TOE Ton of Oil Equivalent
TL Turkish Lira
TSE Turkish Standard Institution
TÜBİTAK Scientific and Technological Research Council of Turkey
TÜİK Turkish Statistical Institute
TWEA Turkish Wind Energy Association
US$ United States Dollar
USDC Unit Service and Depreciation Charge
VAT Value Added Tax
VCM Voluntary Carbon Markets
WPP Wind Energy Power Plant
YEGM General Directorate of Renewable Energy
Glossary of Terms
4

Investment Support and Promotion Agency of Turkey
Introduction
Unprecedented population growth, increasing energy demand, concerns over energy security, and climate change have begun a new era in renewable energy and environmental technologies worldwide.
As the 17th largest economy in the world and 6th
largest in Europe, Turkey is experiencing a precipitous increase in its energy demand. Therefore, Turkey has initiated an ambitious energy policy in which renewable energy plays a significant role. For example, Turkey aspires to have an installed capacity of 30% of renewable energy by 2023. Considering the miniscule 5% share of renewables in 2012, Turkey offers various opportunities for investors within the alternative energy landscape.
Numerous government incentives and funds are available for emerging renewable energy and environmental technologies. Nevertheless, adoption of renewables was accelerated after the amendment of the Renewable Energy Law in 2010, which specifies the feed-in tariffs for different types of technologies. After the revised feed-in tariffs, companies in Turkey have been very eager to integrate renewables into their energy portfolio.
As emerging technologies appear on the horizon supported by various incentives, investments in alternative energy will continue to increase in Turkey.
1
Similar to renewable energy policies, energy efficiency and environmental technologies also play a critical role in Turkey’s energy agenda. Turkey aspires to reduce its energy consumption per unit of GDP (energy intensity) by 20% compared to 2011 levels, which will also create a reduction of greenhouse gasses.
In order to achieve this target, Turkey has set various principles and procedures into the Energy Efficiency Law to promote energy efficiency in all stages of the energy chain including: generation, transmission, distribution and consumption. Energy efficiency improvements also apply to transportation, water management and buildings. Investors can benefit from ample incentives offered by the government and private institutions.
Over the past several years, Turkey has also taken steps towards the improvement of waste water treatment facilities and infrastructure, most importantly Turkey aims to move toward compliance with the EU Environmental Acquis.
This report provides comprehensive information on Turkey’s renewable energy market, environmental technologies and its growing energy efficiency policies. As impressive as these achievements have been in Turkey, tremendous potential still remains in the development of alternative energy and energy efficiency projects.
Investment Support and
Promotion Agency of Turkey
I. Renewable Energy in Turkey

Investment Support and
Promotion Agency of Turkey
A. Renewable Energy Policies
and Regulations in Turkey
i. Overview of the Renewable Energy Market and Targets in Turkey
ii. Licensed and Unlicensed Generation
iii. Energy Sales Options for Renewable Energy Investors

Investment Support and Promotion Agency of Turkey
Renewable energy policies and regulations have a rather short, but effective history in Turkey.
2005 2009 2010 2011 2012 2007
The Law on Utilization of Renewable Energy Resources of the Purpose of Generating Electrical Energy (REL) No: 5346
Geothermal Law No: 5686
Electric Energy Market and Supply Security Strategy Paper: 30% Renewable Energy by 2023
REL Amendment, Published in the Official Gazette No: 6094
Documentation and Support for Renewable Energy Resources Regulation for Unlicensed Electricity Generation
Communique on Measurement Standards for Wind & Solar Energy
RER Support Mechanism is enabled on November 1st 2011
Tender Regulation for License Applications Regarding Energy Generation from Solar Facilities
Renewable energy has been one of the hot topics on Turkey’s energy agenda. Significant progress has been made in the field of renewable energy starting from 2005, after the enactment of the Law on Utilization of Renewable Energy Resources for the Purpose of Generating Electrical Energy (Renewable Energy Law, REL).
Investments in renewable energy technologies remained limited between 2005 and 2010 due to the lack of secondary legislation and relatively low feed-in tariff prices. Nevertheless, the REL amendment in December 2010 introduced higher feed-in tariff rates for separate technologies, and various other monetary and non-monetary incentives.
8

Investment Support and Promotion Agency of Turkey
9
Common Laws & Regulations for Renewable Energy Generation
• Electricity Market Law No: 6446 • Law on Utilization of Renewable Energy
Sources for the Purpose of Generating Electrical Energy Law No: 5346
Geothermal
• Regulation on the Utilization of Geothermal Energy Sources for the Purpose of Electricity Generation
• Geothermal Law
No: 5686
Solar
• Communique on Measurement Standards for Wind & Solar Energy
• Technical Regulation for Evaluating Applications of Solar Energy Generation
Biomass and Waste
• Environmental Law No: 2872
• Solid Waste Control Regulation
• Regulation on the General Principles of Waste Management
Wind
• Technical Regulation for Evaluating Applications of Wind Energy Generation
• Communique on
Measurement Standards for Wind & Solar Energy
Each type of renewable energy has a special regulation enabling secondary regulations to be more precise.
According to the REL, renewable energy resources are defined as non-fossil energy resources such as hydro, wind, solar, geothermal, biomass, biogas (including landfill gas), wave, current and tidal energy.

Investment Support and Promotion Agency of Turkey
Unlocking Turkey’s full renewable energy potential will be achieved by its ambitious renewable energy targets and the resulting investment opportunities.
Increasing installed capacity of wind energy to 20,000 MW by 2023.
Utilizing all economical
and possible 36,000
MW hydroelectricity
potential by 2023.
Utilizing 600 MW of potential geothermal energy by 2023.
Popularizing the use of solar energy in electricity generation and achieving 3,000 MW installed capacity.
Wind Energy Target
Hydropower Target
Geothermal Energy Target
Solar Energy Target
48,000
36,000
2,000 4,000 3,000 2,261
19,609
162 159 0
5,000
10,000
15,000
20,000
25,000
30,000
35,000
40,000
45,000
50,000
55,000
Wind Hydropower Geothermal Biomass/Biogas Solar
MW
Compared to installed capacity, an
abundant renewable energy
potential exists in Turkey.
Figure 1: Installed and Potential Renewable Energy Capacity of Turkey, 2012
10
Source: TEİAŞ, Strategy Paper, YEGM
Investment Support and Promotion Agency of Turkey
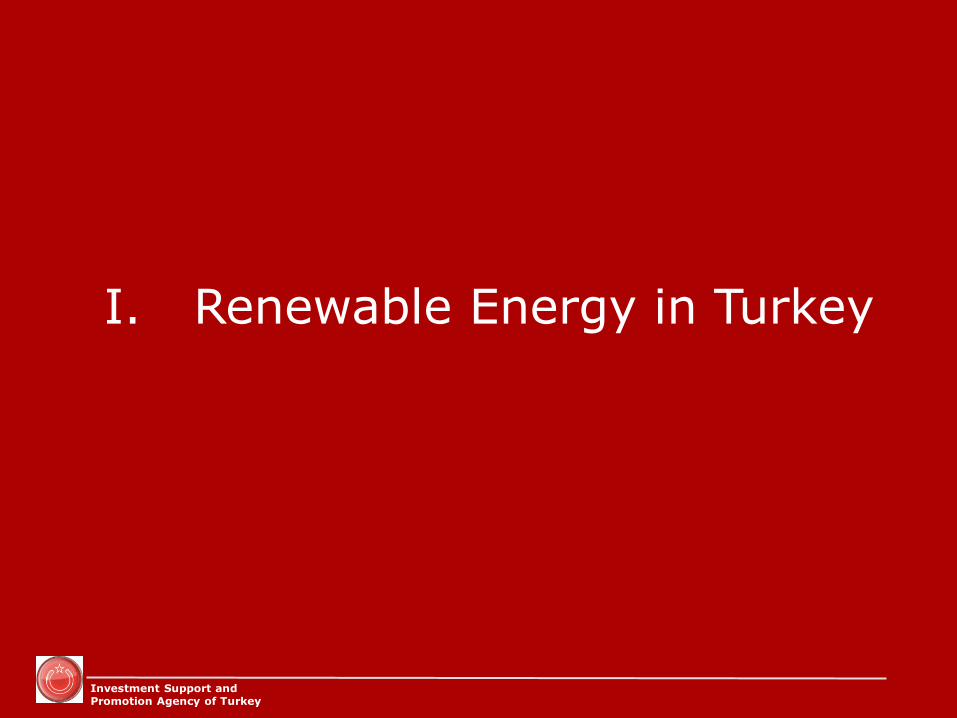
The licensing procedure for renewable energy generation facilities.
Step 1
Step 2
Step 3
Step 4
Step 5
Step 6
• Determining investment principles for the facility such as location, installed capacity, financing method, etc.
• Assessment of the resource.
• For solar and wind energy, gaining grid connection rights through bidding in the tender and if successful in the tender, application for the license.
• Completion of the environmental impact assessment and other related permissions.
• Technical and financial feasibility studies measuring data and completion of project development.
• Obtaining the license after completing necessary documentation if connection right is acquired. Finding financial support, equipment and starting construction.
Power plants that have an installed capacity greater than 1 MW are required to obtain a generation license from the
Energy Market Regulatory Authority (EMRA). The licensing procedure of some of the renewables differ a bit from
others: for solar and wind power plants, grid connection is the most critical step before obtaining a license. The new
Electricity Market Law regulates the tender process for grid connection rights. A tender based on a «contribution fee»
payable to the Transmission System Operator for the first 3 years following commissioning is mandatory for solar and
wind investments whose application cover overlapping or intersecting areas aiming for the same transformatory center.
For small hydros, water usage rights are granted
by General Directorate of State Hydraulic Works
(DSI), which follow a similar procedure: a water
usage fee is payable to DSI, where it can organize
a tender for the water usage rights.
For biomass power plants, a tender is applicable
for those companies who want to build a power
plant that uses landfill as a fuel. In this case,
usage rights of the city landfill is granted through
a tender by the municipality.
Figure 2: The license application process for energy generation from renewable energy.
11
Pre-license application.

Investment Support and Promotion Agency of Turkey
158
418
14 8 9
52
Wind, 24% Solar, 63%
Biomass, 2% Cogeneration, 1%
Hybrid (WEPP +SPP), 1% Hydro, 8%
Figure 3: Total Number of Unlicensed Generation Applications
Figure 5: Breakdown of Technologies for Unlicensed Generation Applications
Figure 4: Power Rating (MW) of Technologies for Unlicensed Generation Applications
Unlicensed generation will gain more popularity in the near future with the updated 1 MW capacity limit.
Source: Li-DER – Unlicensed Electricity Generation Association
659
235
86
Approved, 67%
Denied, 24%
Evaluation, 9%
59.414
114.052 4.017
44.73
1.846 24.916
Wind, 24% Solar, 46%
Biomass, 2% Cogeneration, 18%
Hybrid (WEPP + SPP), 1% Hydro, 10%
• Any natural or legal entity with a capacity of less than 1 MW in its facility can benefit from the feed-in tariff defined by the Renewable Energy Support Mechanism. Further, renewable energy power plants that are installed at the point of consumption without grid connection are regarded as unlicensed, regardless of their installed capacity.
• As described in the Electricity Market Law (EML), distribution companies holding retail licenses are obligated to purchase the excess electricity generated by the unlicensed renewable energy generators via relevant feed-in tariff prices.
• Initially, the capacity limit for unlicensed generation was 500 kW, however, it has been upgraded to 1 MW with the new EML. The updated capacity level of 1 MW is expected to increase interest in utilization of renewable energy technologies especially in households and in industrial sites.
• As of May 2013, unlicensed generation applications account for 249 MW. As seen in Figure 4, the most popular preference for power production is from solar and wind energy resulting in total of 576 applications (see Figure 5) with an installed capacity of 173 MW.
1
Law on Utilization of Renewable Energy Sources for the Purpose of Generating Electrical Energy
2 Regulation Regarding Unlicensed Generation in the Electricity Market
3 Regulation Regarding Documentation and Support of Renewable Energy Resources
4 Agreement for Unlicensed Electricity Generators Regarding Distribution System (DS) Connection
5 Agreement for Unlicensed Electricity Generators Regarding DS Usage
Laws, Regulations and Agreements Regarding Unlicensed Generation
12
Investment Support and Promotion Agency of Turkey
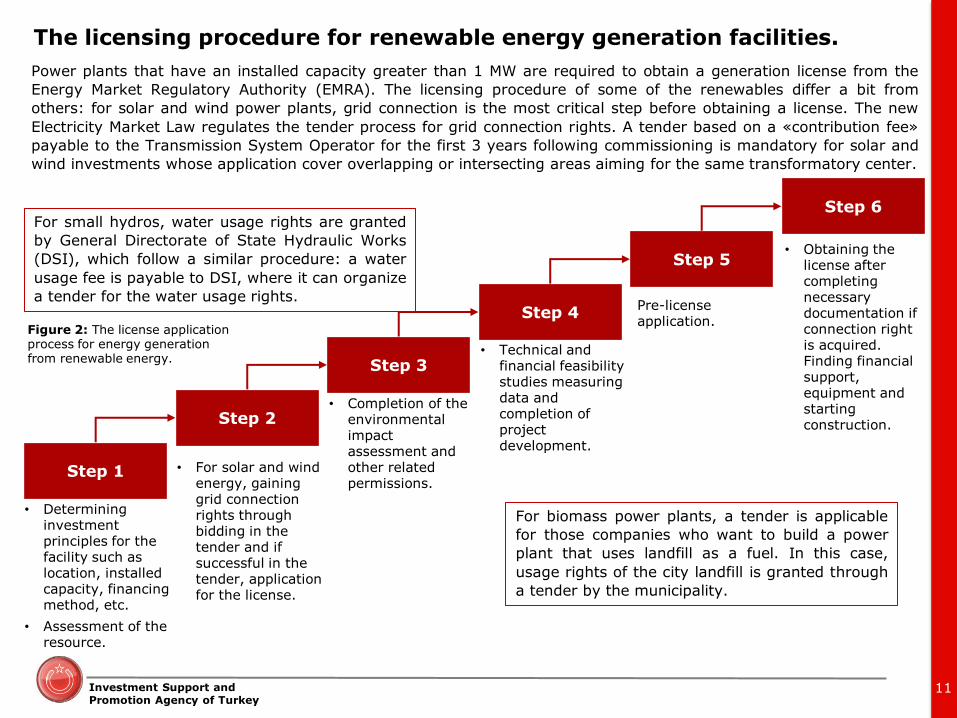
Trade Opportunities for Renewable Energy Resources
Organized Markets
Day-Ahead Market
Bi-lateral Contracts
Wholesale Companies
Distribution Companies
Eligible Consumers
Feed-in Tariff
Price Risk
Sales Risk
High: Seasonal and hourly fluctuations in price. Unpredictable imbalance costs.
None: Can sell all of the proposed amount.
None: Fixed price indexed to USD.
None: Has to sell all of the generation amount.
Revenue Expectation
High volatility: Volatile due to price fluctuations and imbalance costs.
Fixed: Due to fixed prices there are not any surprises in revenue expectations. Investor is not responsible for imbalance costs.
Medium: Prices are negotiable. Possible hedging exists for medium/long term price risks. Reference price is the market price.
Low: Amount is determined according to negotiations. Amount that cannot be sold via bi-lateral contracts can be sold to the day-ahead market.
Low/medium volatility: Possible to guarantee a set revenue through medium/long term contracts.
• Cross-border trading opportunities also exist for renewable energy investors. Turkey was synchronously connected to ENTSO-E in September 2010 and is currently in the trial phase. If Turkey meets all requirements by autumn 2013, Turkey will be a full member of ENTSO-E.
• Turkey has various interconnections with neighboring countries such as Georgia, Iran, Azerbaijan and Syria. Transmission operators of Turkey, Bulgaria and Greece regularly auction interconnection capacities on the Greek and Bulgarian borders of Turkey. Private sector players have shown great interest in these auctions which has resulted in a boost in trade compared to previous years.
Different energy sales options are available for renewable energy investors.
13

Investment Support and
Promotion Agency of Turkey
B. Public and Private Incentives
for Renewable Energy Projects
i. Incentives Provided by the Ministry of Economy
ii. Incentives Provided by the Renewable Energy Support Mechanism
iii. Private Financing Institutions
iv. The Young and Skilled Labor Force of Turkey

Investment Support and Promotion Agency of Turkey
In
vestm
en
ts
• Establishing energy generation facilities; • Provision for domestically manufactured electromechanical systems; • R&D and manufacturing of generation systems by utilizing solar cells and focusing units; • R&D facilities for the generation of electric energy or fuel by utilizing biomass sources
shall be eligible for incentives, based on the decision of the Council of Ministers.
Ac
qu
isit
ion
of
Lan
d
• Utilization permits for the real estate under the ownership of the Treasury or the state in its entirety shall be granted by the Ministry of Environment and Forestry or the Ministry of Finance in exchange for remuneration. A 50% deduction shall be implemented for permission, rent, right of access and usage in the investment period.
• Lease, easement and usufruct permission fees shall be 85% discounted during the initial 10 years of investment & operation of facilities that will be commissioned until December 31, 2015.
• Leasing or easement will be established by the MOF in exchange for remuneration in relation to any publicly owned pasture, quarter, grazing and grassland.
• Collection of the Forest Villagers Development Revenue and Erosion Control Revenue will not be made.
RE
S
Mech
an
ism
(F
eed
-in
Tari
ff)
Generation licenses subject to the RES Support Mechanism that are or will be commissioned before December 31, 2015 will benefit from: • Feed-in tariff (Schedule I) for a period
of ten years. • Local equipment bonus (Schedule II)
for a period of five years, if domestically manufactured mechanical and/or electromechanical equipment is used in the generation facility. Schedule II in Figure 6 demonstrates the total amount of bonuses offered for each technology (the breakdown per component is provided in the upcoming slides).
Schedule I Schedule II
7.3
7.3
10.5
13.3
13.3
13.3
2.3
3.7
2.7
5.6
6.7
9.2
6 8 9 11 12 14 15 17 18 20 21 23 24
Hydro
Wind
Geothermal
Biomass
Solar (PV)
Solar (CSP)
FIT Bonus for local equipment
Figure 6: Feed-in Tariff and Local Equipment Bonus
Government incentives provide the impulse for growth.
15

Investment Support and Promotion Agency of Turkey
©2013 Deloitte Turkey. Member of Deloitte Touche Tohmatsu Limited 16
• Currently, energy investments are eligible to benefit from the General Investment Incentive Program which allows investors to be exempt from custom duty and VAT.
• Even before the General Investment Incentive Scheme, the Ministry of Economy provided incentives to energy projects. For instance, 718 incentives regarding energy generation technologies were issued between 2005 and 2012. 90% of these incentive documents were issued for new projects, whereas the remaining 10% were issued for improving existing ones.
• Out of these 718 documents, an astounding 86% were issued to renewable energy technologies with 615 applications.
• The scope of the General Investment Incentive Program offers incentives for six different renewable energy generation technologies, including hydroelectric, wind, geothermal, biomass, thermal power, cogeneration and solar energy power plants.
• Table 1 demonstrates the incentive documents issued according to energy production technologies between 2005 and 2012. As shown, the highest share of incentive documents were issued to hydroelectricity power plants with 65%, followed by wind which accounts for 11% of renewable energy generation.
• The total number of incentive documents for renewable energy technologies account for an installed capacity of 17,171 MW. The highest share of investment belongs to hydropower with approximately 26 billion TL followed by wind with approximately 7 billion TL.
Facility Type Power (MW)
Investment Amount (TL)
Hydro 12,005 25,781,261,382
Wind 3,081 6,776,348,012
Biomass 83 317,653,795
Geothermal 1,374 792,092,825
Cogeneration 628 404,477,808
Thermal 13,671 4,154,947,422
Total 30,842 38,226,780,244
Table 1: Technical Details of Incentives for Renewable Energy Technologies
Source: Ministry of Economy
The Ministry of Economy provides further incentives for renewable energy technologies.
Investment Support and Promotion Agency of Turkey
17 17
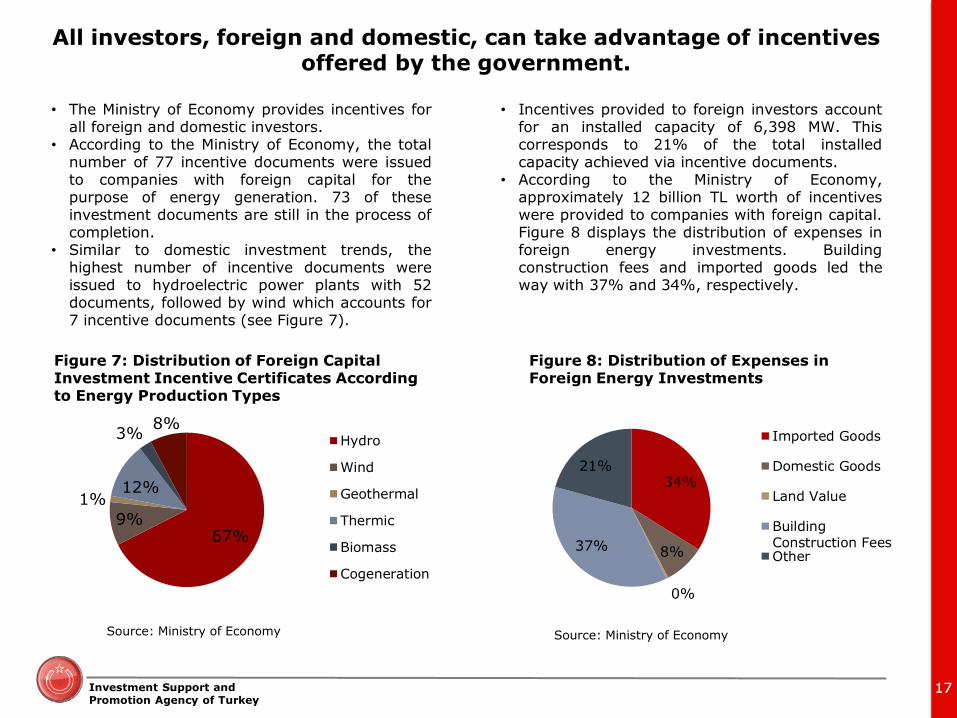
• The Ministry of Economy provides incentives for all foreign and domestic investors.
• According to the Ministry of Economy, the total number of 77 incentive documents were issued to companies with foreign capital for the purpose of energy generation. 73 of these investment documents are still in the process of completion.
• Similar to domestic investment trends, the highest number of incentive documents were issued to hydroelectric power plants with 52 documents, followed by wind which accounts for 7 incentive documents (see Figure 7).
67% 9%
1% 12%
3% 8%
Hydro
Wind
Geothermal
Thermic
Biomass
Cogeneration
Figure 7: Distribution of Foreign Capital Investment Incentive Certificates According to Energy Production Types
• Incentives provided to foreign investors account for an installed capacity of 6,398 MW. This corresponds to 21% of the total installed capacity achieved via incentive documents.
• According to the Ministry of Economy, approximately 12 billion TL worth of incentives were provided to companies with foreign capital. Figure 8 displays the distribution of expenses in foreign energy investments. Building construction fees and imported goods led the way with 37% and 34%, respectively.
Figure 8: Distribution of Expenses in Foreign Energy Investments
34%
8%
0%
37%
21%
Imported Goods
Domestic Goods
Land Value
BuildingConstruction FeesOther
All investors, foreign and domestic, can take advantage of incentives offered by the government.
Source: Ministry of Economy Source: Ministry of Economy

Investment Support and Promotion Agency of Turkey
18
A List of Major Renewable Energy Financing Institutions
Numerous funds exist in Turkey for renewable energy development projects. Major ones can be summarized as TurSEFF and MidSEFF provided by EBRD, the World Bank, the Industrial Development Bank of Turkey (TSKB), the International Finance Corporation (IFC), and the Technology Development Foundation of Turkey (TTGV). TurSEFF offers up to USD 5 million for energy efficiency and energy renewable projects. USD 300,000 are available for Small-Scale Projects, whereas USD 75,000 is granted to Residential Sector Projects. MidSEFF was developed for mid-size sustainable energy financing and was launched by EBRD with support from the European Investment Bank (EIB) and European Commission (EU). This program provides EUR 975 million to those in the private sector developing mid-size projects in renewable energy, waste-to-energy and industrial efficiency. These loans are provided through some of the major banks in Turkey such as Akbank, Denizbank, Finansbank, Garanti, İşbank, Vakıfbank, and Yapı Kredi. Turkey has been a member of the International Finance Corporation (IFC) since 1956, and is the fourth largest client in terms of commitment portfolio. IFC invests in energy efficiency, renewable energy, municipalities and poorer regions of countries. According to their data, IFC invested USD 40 million and mobilized USD 130 million for 13 projects in Turkey. TSKB is one of the most important Turkish banks that provides financing to the private sector for renewable energy projects. TSKB has provided loans to 65 HEPPs, 2 WPPs, 2 GPPs and 1 biomass facility with an installed capacity of 2,150 MW, 53 MW, 58 MW, and 11 MW, respectively. TTGV provides financing for clean production technologies for 1.5 years with a maximum of USD 1 million and 50% of the project budget.
TurSEFF
MidSEFF
The World
Bank
TSKB
IFC
TTGV

Investment Support and Promotion Agency of Turkey
2,457
934
1,523
0 500 1,000 1,500 2,000 2,500 3,000
Total
Vocational School
University
Figure 10: Number of Openings in Energy Specific Institutions for 2012
Source: ÖSYM
19
A positive outlook on the human resources side: a young and skilled labor force combined with favorable wages.
• The liberalization process in the energy sector created a new segment of employment opportunities in Turkey. Developments in the energy sector resulted in the creation of significant and innovative academic departments related to energy and alternative energy technologies.
• Figure 10 demonstrates the openings in universities and vocational schools in energy related departments. There were a total number of 2,457 openings in 2012 within the Turkish education system. 1,523 were in universities, whereas the remaining 934 openings were in vocational schools.
• As Turkey’s energy market continues to evolve, and renewable energy becomes an inevitable part of Turkey’s agenda, the demand for skilled labor will increase dramatically.
• Besides vocational schools and universities, there are various companies and NGOs that provide energy specific training along with graduate and certification programs. Most importantly, these programs are highly popular among students and professionals in the energy field.
• Turkey has a young, dynamic and educated population. However, monthly wages are relatively lower than the EU or the US. According to Turkstat, the average gross monthly wage in Turkey was 2,510 TL in 2010. With regards to minimum wage, Eurostat states that Turkey’s minimum wage was 411 Euros in 2012 (see Figure 11).
0 500 1,000 1,500 2,000
Turkey
Portugal
Greece
Spain
UK
France
Source: Eurostat
Figure 11: Minimum Monthly Wage (EUR)

Investment Support and
Promotion Agency of Turkey
C. The Renewable Energy Market
in Turkey i. Renewable Energy Capacity in Turkey
i. Hydropower ii. Wind iii. Solar iv. Geothermal v. Biomass
ii. Reasons to Invest in Turkey’s Vibrant Renewable Energy Market
iii. Major Public Institutions and NGOs in Renewable Energy

Investment Support and Promotion Agency of Turkey
Hydro Natural
Gas*
Hard Coal** (Local &
Imported) Lignite Fuel Oil Wind Geothermal
Other Renewables
Total
Installed Capacity (MW)
19,609 20,439 5,058 8,143 1,227 2,261 162 159 57,058
Share 34.37% 35.82% 8.87% 14.27% 2.15% 3.96% 0.28% 0.28% 100%
* Including dual fuel plants
** Including local and imported coal plants & asphaltite plants
5%
36%
34%
14%
9% 2%
Renewables Natural Gas HydroLignite Hard Coal Fuel Oil
6%
6% 88%
Waste Geothermal Wind
Figure 12: Turkey’s Installed Capacity Including the Share of Renewables, 2012
The share of renewables in Turkey’s installed capacity is continuously increasing.
• Turkey’s installed capacity in December 2012 was 57,058 MW. Renewables including waste, geothermal and wind accounted for only 5% of the installed capacity, wind energy being the highest with 2,261 MW.
• Regulations designed specifically for wind energy and its growth potential of 48 GW has attracted the interest of domestic and international investors.
• The share of renewables will increase significantly due to the upcoming licensing process for solar power plants and wind project stock.
21
Investment Support and Promotion Agency of Turkey
22
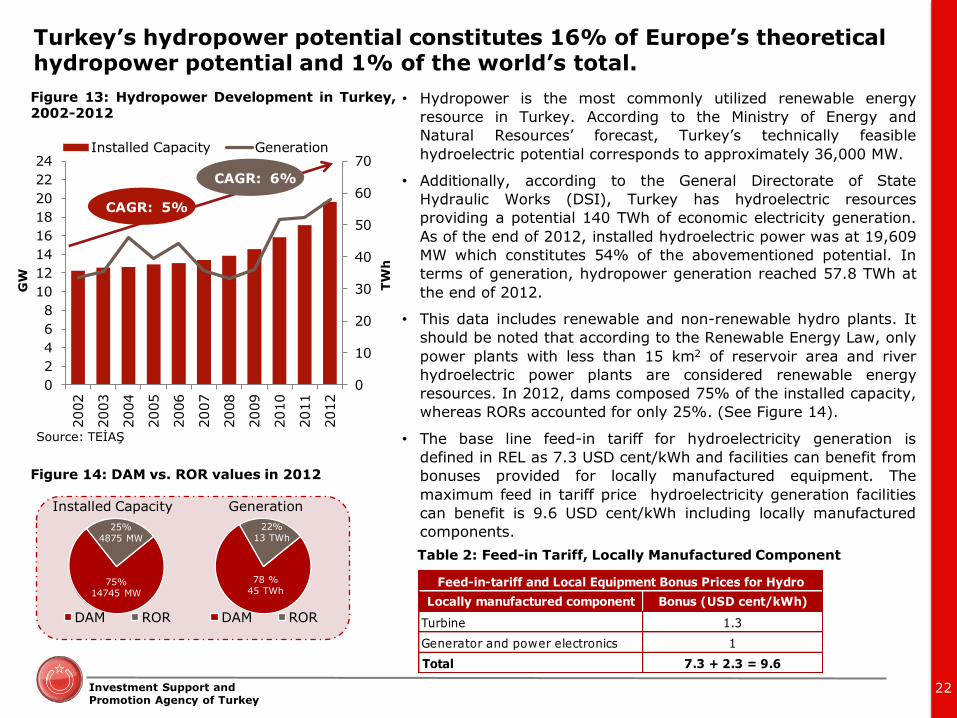
• Hydropower is the most commonly utilized renewable energy
resource in Turkey. According to the Ministry of Energy and
Natural Resources’ forecast, Turkey’s technically feasible
hydroelectric potential corresponds to approximately 36,000 MW.
• Additionally, according to the General Directorate of State
Hydraulic Works (DSI), Turkey has hydroelectric resources
providing a potential 140 TWh of economic electricity generation.
As of the end of 2012, installed hydroelectric power was at 19,609
MW which constitutes 54% of the abovementioned potential. In
terms of generation, hydropower generation reached 57.8 TWh at
the end of 2012.
• This data includes renewable and non-renewable hydro plants. It
should be noted that according to the Renewable Energy Law, only
power plants with less than 15 km2 of reservoir area and river
hydroelectric power plants are considered renewable energy
resources. In 2012, dams composed 75% of the installed capacity,
whereas RORs accounted for only 25%. (See Figure 14).
• The base line feed-in tariff for hydroelectricity generation is
defined in REL as 7.3 USD cent/kWh and facilities can benefit from
bonuses provided for locally manufactured equipment. The
maximum feed in tariff price hydroelectricity generation facilities
can benefit is 9.6 USD cent/kWh including locally manufactured
components.
0
10
20
30
40
50
60
70
0
2
4
6
8
10
12
14
16
18
20
22
24
2002
2003
2004
2005
2006
2007
2008
2009
2010
2011
2012
TW
h
GW
Installed Capacity Generation
CAGR: 5%
CAGR: 6%
DAM ROR
25% 4875 MW
75% 14745 MW
DAM ROR
22% 13 TWh
78 % 45 TWh
Installed Capacity Generation
Figure 14: DAM vs. ROR values in 2012
Source: TEİAŞ
Turkey’s hydropower potential constitutes 16% of Europe’s theoretical hydropower potential and 1% of the world’s total.
Locally manufactured component Bonus (USD cent/kWh)
Turbine 1.3
Generator and power electronics 1
Total 7.3 + 2.3 = 9.6
Feed-in-tariff and Local Equipment Bonus Prices for Hydro
Table 2: Feed-in Tariff, Locally Manufactured Component
Figure 13: Hydropower Development in Turkey, 2002-2012

Investment Support and Promotion Agency of Turkey
23
19,609
6,489 5,882
3,138 3,028 2,566 2,392 2,222
53 0
2,000
4,000
6,000
8,000
10,000
12,000
14,000
16,000
18,000
20,000
Turkey Romania Ukraine Bulgaria Greece Slovakia Poland CzechRepublic
Hungary
MW
Source: TEİAŞ, Economic Intelligence Unit
Figure 15: Installed Hydropower Capacity in Selected Eastern European Countries and Turkey, 2012
Turkey has the highest installed hydropower capacity in Eastern Europe.
One of the major advantages of hydropower is its ability to stabilize the grid through its storage capacity: Hydroelectric power plants allow intermittent sources such as wind and solar energy systems to be integrated to the grid more easily. As technologies based on renewables gain more importance than ever, the relevance of hydropower increases proportionally. As Figure 15 shows, Turkey has the highest hydropower installed capacity among Eastern European countries. Notably, Turkey has 25 river basins which would make 16% of Europe’ s and 1% of the world’s theoretical capacity. Considering Turkey’s ambitious targets regarding renewable energy resources, the need for hydropower plants with hydro pumping technologies will become even more prevalent. Having the potential of 36,000 MW, and an installed capacity of only 19,609 MW of hydropower poses numerous opportunities for investors.

©2013 Deloitte Türkiye. Member of Deloitte Touche Tohmatsu Limited Investment Support and
Promotion Agency of Turkey
Pumped-storage hydroelectricity developments: gateway to higher renewable energy penetration.
Grid reliability is an essential part of Turkey’s system operator, and achieving a stable grid is challenging due to intermittent energy sources such as wind and solar energy. Renewables will not always be available during peak hours, and existence of energy storage technologies such as pumped-storage hydroelectricity (PSH) is needed, due to their rapid start-up nature, and ability to change their electrical output according to varied demand.
The Electrical Power Research Institute stated in 2012 that pumped-storage hydroelectricity constitutes 99% of storage capacity worldwide representing 127,000 MW. It is the quickest and most widespread technique for modern electricity grids.
Turkey has ambitious goals for renewables and their implementation increases constraints on the grid which calls for utilization of pumped-storage systems.
Hydropower in Turkey accounts for 34% of the total installed capacity and has abundant resources for electricity generation. According to a study conducted in 2012 by the Joint Research Center of the European Commission, Turkey has a potential to produce 3,800 GWh from its non-hydropower dams and reservoirs.
One of the main reasons for Turkey’s selection in this research was its large number of dams with 260 large and 413 small dams in operation.
Pumped-storage hydroelectricity (PSH) research in Turkey was initially started by EIE in 2009. Japanese expertise was utilized in PSH co-generated with wind energy. Projections of Turkey’s peak energy demand was also included in the scope of the project. Conceptual designs were created for Gökçekaya and Altınkaya HEPPs rating 1,400 MW and 1,800 MW respectively for possible PSH system implementation.
Currently, there is a project in progress regarding the mitigation of negative effects of wind energy generation on the grid with the utilization of PSH systems, and is located in Yahyalı district of Kayseri. The project will consist of 4 MW PSH and 4x2.5 MW wind turbines.
Turkey realizes the importance of large-scale energy storage for a reliable grid. Therefore, several studies have also been conducted by governmental organizations.
Turkey offers tremendous benefits to investors who utilize the ample resources of hydropower.
24

Investment Support and Promotion Agency of Turkey
25
273
428
529
409
532 2,261
0
300
600
900
1,200
1,500
1,800
2,100
2,400
2,700
3,000
2008 2009 2010 2011 2012 Total
MW
Figure 16: Wind Energy Capacity Additions, 2008 - 2012
An official target of 20 GW, a potential of 48 GW and installed capacity at slightly above 2 GW: the wind energy market offers tremendous opportunity.
• In 2012, wind energy constituted 4% of Turkey’s installed capacity at 2,261 MW. The wind energy share will increase further since there are many projects that are under construction.
• Installed wind capacity experienced significant growth in the last decade at a CAGR of 62% along with an increase of 30% from 2011 to 2012.
• Considering that Turkey is surrounded by the Black Sea, the Marmara Sea, the Aegean Sea and the Mediterranean Sea, it has abundant wind power sources. According to the Ministry of Energy, Turkey’s potential wind capacity is appoximately 48 GW.
• EMRA does not accept wind energy license applications on a rolling basis, instead applications are accepted only on specific pre-determined and pre-announced dates. Application dates and deadlines are announced on EMRA’s website and in the Official Gazette once they are determined.
• The first set of applications in 2007 demonstrated an exceptionally high interest in wind energy with a total of 751 license applications with a potential of 78 GW. Even though this number was later drastically reduced due to grid connection compliance, the high number of license applications indicates interest in investment and the immense potential of the wind energy market.
• The feed-in tariff determined by EMRA for wind energy is 7.3 USD cent/kWh. However, extra bonuses are available for facilities that utilize locally manufactured mechanical and electronic components for their projects (see Table 3).
Table 3: Feed-in Tariff, Locally Manufactured Components, Wind
Locally manufactured component Bonus (USD cent/kWh)
Blade 0.8
Generator and power electronics 1
Turbine tower 0.6
All mechanical equipment in rotor
and nacalle (exluding blade group,
generator, and power electronics) 1.3
Total 7.3 + 3.7 = 11
Feed-in-tariff and Local Equipment Bonus for Wind Power
CAGR: 58%
Source: TEİAŞ

Investment Support and Promotion Agency of Turkey
Source: TWEA Statistics Report
924 MW
255 MW
Marmara
80 MW
Black Sea
72 MW
Central Anatolia
28 MW
Southeastern
Anatolia
384 MW
55 MW
Mediterranean
852 MW
266 MW
Aegean
The Marmara and Aegean regions have the highest wind potential.
The highest share of installed wind capacity belongs to the Marmara region with 924 MW, followed by the Aegean region with 852 MW. Considering the wind power capacity of the seven regions, each possesses immense potential even after the current project stock is completed. Currently, Balıkesir has the highest share of installed operational wind capacity with 27%, followed by İzmir at 17% and Manisa at 15%. İzmir holds the highest share of projects under construction with 23%, followed by Balıkesir with 15% and finally by Tekirdağ at 11%. Considering Izmir has the highest wind speed in the Aegean region, it is not surprising to see the increase of investments and projects within that city.
Figure 17: Cities that have the Highest Installed and Under Construction Wind Capacities
616
391 346
178 135 134 90
423
88
139
36
39 39 48
212
0
100
200
300
400
500
600
700
800
Balikesir
Izm
ir
Manis
a
Hata
y
Osm
aniy
e
Çanakkale
İsta
nbul
Oth
er
MW
Operational Under Construction
26
In operation
Under construction

Investment Support and Promotion Agency of Turkey
85
103.5
105
126
135
159.2
211.9
233,95
245
291,15
0 50 100 150 200 250 300 350
Eksim Yatırım Holding
Ayen Enerji
Fina Enerji
Doğan Enerji
Zorlu Enerji
Aksa
Enerjisa
Polat Enerji
Bilgin Enerji
Demirer Enerji
MW
27
27.5
34
35.75
47.5
50
50.6
50.6
77.7
109
0 20 40 60 80 100 120
Tefirom and Zaf Group
Tektuğ Elektrik
Aksa
Gama Enerji
Boydak Holding
Bilgin Enerji
Güriş
Borusan
Ayen Enerji
Fina Enerji
MW
Figure 18: Installed Operational Capacity According to Investors
Figure 19: Wind Power Plants Under Construction According to Investors
Source: TWEA
Success Stories: The wind energy market attracts the attention of both local and international players.
• Figure 18 demonstrates the installed operational capacity according to investors, and TWEA’s data states that Demirer Enerji had the highest installed capacity in 2012.
• However, more investments were announced by some of the leading companies in Turkey. For example, Türkerler Holding announced 150 million TL investments in wind energy and with plans to increase its capacity to 522 MW.
• As of May 2013, the largest wind farm is located in Balıkesir and belongs to Enerjisa with an installed capacity of 143 MW. Enerjisa, a joint venture between the Turkish conglomerate Sabancı Holding and E.ON, announced its plans to reach an installed capacity of 5,000 MW by 2015 where renewable energy will constitute 5-10% of its portfolio.
• Unprecedented investments in wind energy under these circumstances demonstrate the potential of the wind energy market in Turkey and its ability to exceed current targets that are already being met.
27

Investment Support and Promotion Agency of Turkey
Figure 20: Installed Wind Power Capacity in Selected Eastern European and EU Countries, 2012
Turkey has one of the leading installed wind capacities in Eastern Europe.
28
2,497 2,261
1,905 1,749
684
329 288 269 260 225 147 68 15 0 0 0
500
1,000
1,500
2,000
2,500
Pola
nd
Turk
ey
Rom
ania
Gre
ece
Bulg
ari
a
Hungary
Fin
land
Esto
nia
Czech R
ep.
Lithuania
Cypru
s
Latv
ia
Russia
Malta
Slo
vakia
MW
Interest in wind energy continued to increase in Europe in the last year. According to the European Wind Energy Association (EWEA), the astounding amount of 11,895 MW of wind energy was installed in the EU during 2012. Total investments in the wind energy business was worth between 12.8 to 17.2 billion Euros. In terms of annual installations, Germany held first place with 2,415 new installations, followed by the UK, Italy and Spain.
In terms of installed wind capacity in Eastern European countries, Turkey is leading the way with an installed capacity of 2,261 MW – an amount that is higher than Romania, Greece, Bulgaria, Hungary and other Eastern European countries displayed in Figure 20.
It is also important to note that in the list of candidate countries for the EU which includes Serbia and Turkey; Turkey has the highest installed wind capacity among all the candidate countries.
The large wind energy potential of Turkey and its investment friendly environment has enabled various projects to be implemented over the years. Nevertheless, in order to achieve its 2023 targets and compete with Western European countries, Turkey still has significant investment potential.
Source: EWEA

Investment Support and Promotion Agency of Turkey
29
Table 4: Average Solar Radiance and Average Sunshine Duration.
Region
Average
sunshine
duration
(hour/year)
Total average
solar radiance
(kWh/m2)
SE Anatolia 2,993 1,460
Mediterranean 2,956 1,390
E Anatolia 2,664 1,365
C Anatolia 2,628 1,314
Aegean 2,738 1,304
Marmara 2,409 1,168
Black Sea 1,971 1,120
Turkey has abundant potential for solar power, especially in SE Anatolia and the Mediterranean region.
• Turkey’s abundant source of solar power is a well-known and often cited fact. Despite this abundance, Turkey has not utilized solar energy efficiently until recently, and requires significant investment to tap its full potential.
• Momentum for solar power accelerated after the enactment of REL which specified a feed-in tariff price of 13.3 USD cent/kWh for solar power plants. The publication of the Tender Regulation Regarding Electricity Generation from Solar Energy by EMRA also sparked interest by providing the processes for participating in solar power tenders.
• According to the General Directorate of Renewable Energy, the average annual radiation in Turkey is 2,640 hours per year and the average solar radiation received is 1,311 kWh/m2 per year.
• Table 4 demonstrates the average sunshine duration (hour/year) and total average solar radiance (kW/m2) in the seven main regions of Turkey.
• Southeastern Anatolia has the highest average sunshine duration along with the highest average solar radiance total followed by the Mediterranean and the Eastern Anatolian regions.
• Compared to some of the leading European Union member states in solar power, Turkey has the highest sunshine duration among Germany, Spain and the Czech Republic (see Figure 21).
• The Turkish solar energy sector offers an exceptionally high untapped potential, and a concise regulatory framework enables investors to participate in the solar power market effectively.
Figure 21: Sunshine Duration of Selected Countries
0
50
100
150
200
250
300
350
400
Ocak
Şubat
Mart
Nis
an
Mayıs
Haziran
Te
mm
uz
Ağusto
s
Eylü
l
Ekim
Kasım
Ara
lık
Türkiye Almanya İspanya Çek CumhuriyetiTurkey Germany Spain Czech Rep.
Jan.
Feb.
Marc
h
April
May
June
July
Aug.
Sept.
Oct.
Nov.
Dec.
Source: YEGM, National Oceanic and Atmospheric Administration

Investment Support and Promotion Agency of Turkey
30
Concentrated Solar Panel (CSP) Photovoltaic Module (PV)
PV cells convert solar radiation into electricity by using semiconductor cells. Currently, PVs dominate the solar market and global PV installed capacity grew by 74% in 2011. Generous subsidies around the world have been the main drivers of this significant growth. Even though prices of PVs have fallen dramatically over the years, additional reductions are needed for further implementation. Research and development projects exist in many Turkish universities as well as in government institutions for the development and adaptation of efficient PV modules.
CSPs use various mirror configurations to convert the energy captured by solar power into heat. The thermal energy generated is then used in a steam turbine or a heat engine to produce electricity. Use of CSPs gained popularity in recent years and global installed capacity grew by 35% in 2011. CSPs have the ability to be utilized with conventional power generation plants, such as natural gas, which allows CSPs to be integrated into electricity grids easily. As seen in Table 5, CSP technology has the highest feed-in tariff with 22.5 USD cent/kWh, which includes all local equipment bonuses, followed by PVs with 20 USD cent/kWh.
Locally manufactured component Bonus (USD cent/kWh)
PV panel integration and production of structural solar mechanics0.8
PV Modules 1.3
PV Module Cells 3.5
Inverter 0.6
Material which focuses radiation on
PV Module 0.5
Total 13.3 + 6.7 = 20
Feed-in-tariff and Local Equipment Bonus Prices for Solar PV
Table 5: Feed-in Tariff, Locally Manufactured Components, CSP
Table 6: Feed-in Tariff and Incentives, Locally Manufactured Components, PV
PVs are prevalent in the solar market, yet interest and investments in CSPs are growing.
Locally manufactured component Bonus (USD cent/kWh)
Radiation collector tube 2.4
Reflective surface 0.6
Sun tracking system 0.6
Mechanical components of heat
energy storage system 1.3
Mechanical components of the steam
generation system 2.4
Stirling engine 1.3
Panel integration and production of
structural solar mechanics 0.6
Total 13.3 + 9.2 = 22.5
Feed-in-tariff and Local Equipment Bonus Prices for CSP

Investment Support and Promotion Agency of Turkey
31
The stabilization of solar energy regulations has captured the attention of major energy players.
2,022
1,543
933
517
217 19 6 6 4 3 2
0
500
1,000
1,500
2,000
2,500Czech R
ep.
Gre
ece
Bulg
ari
a
Slo
vakia
Slo
venia
Malta
Rom
ania
Lithuania
Hungary
Pola
nd
Latv
ia
MW
Figure 22: Installed Solar Power Capacity in Selected EU and Eastern European Countries, 2012
Solar energy, especially photovoltaics, experienced exceptional growth in the past few years and has become more mainstream. According to the European Photovoltaic Industry Association, installed PV capacity in 2012 exceeded 100 GW. Even though Turkey currently does not possess large scale solar power plants, the seeds towards the implementation of solar power were planted in mid-2012. In June 2012, the first applications were received by EMRA for solar power plants greater than 1 MW. Astounding interest in solar energy was observed during this process when EMRA received 496 applications. EMRA had specified that only 600 MW of solar energy will be implemented into the grid and even though the date for the second round of applications has not been determined. Next application process is expected to propose 2,500 MW of available solar power.
Source: EurObserv’ER 2013
Investment Support and Promotion Agency of Turkey
32
0
20
40
60
80
100
120
140
160
1802002
2003
2004
2005
2006
2007
2008
2009
2010
2011
2012
MW
CAGR: 25%
Figure 23: Installed Geothermal Power, 2002-2012
Source: TEİAŞ
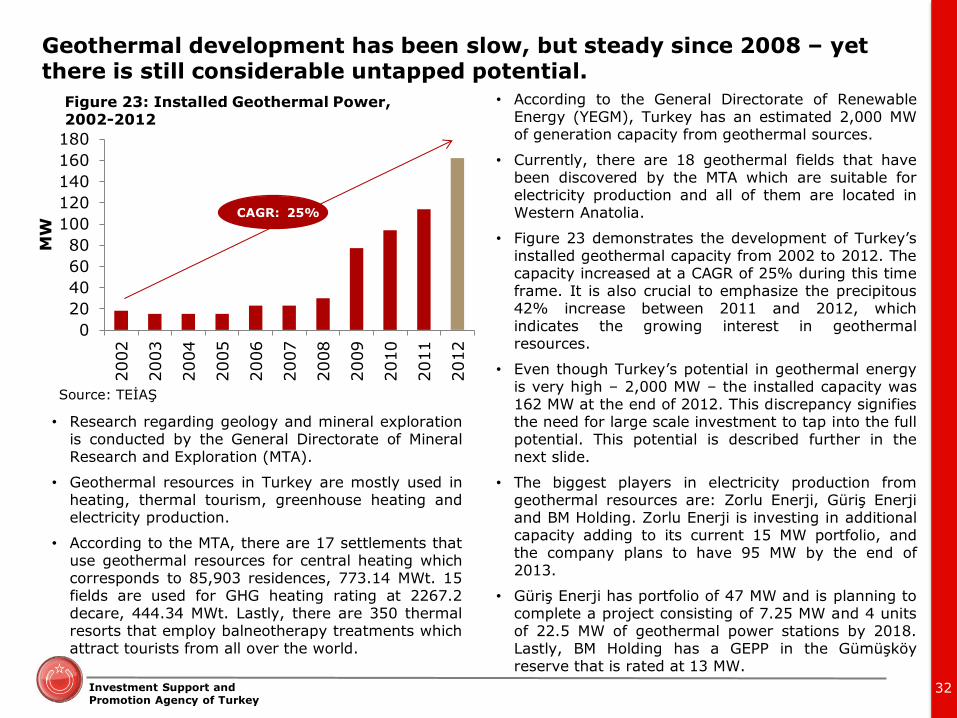
Geothermal development has been slow, but steady since 2008 – yet there is still considerable untapped potential.
• Research regarding geology and mineral exploration is conducted by the General Directorate of Mineral Research and Exploration (MTA).
• Geothermal resources in Turkey are mostly used in heating, thermal tourism, greenhouse heating and electricity production.
• According to the MTA, there are 17 settlements that use geothermal resources for central heating which corresponds to 85,903 residences, 773.14 MWt. 15 fields are used for GHG heating rating at 2267.2 decare, 444.34 MWt. Lastly, there are 350 thermal resorts that employ balneotherapy treatments which attract tourists from all over the world.
• According to the General Directorate of Renewable Energy (YEGM), Turkey has an estimated 2,000 MW of generation capacity from geothermal sources.
• Currently, there are 18 geothermal fields that have been discovered by the MTA which are suitable for electricity production and all of them are located in Western Anatolia.
• Figure 23 demonstrates the development of Turkey’s installed geothermal capacity from 2002 to 2012. The capacity increased at a CAGR of 25% during this time frame. It is also crucial to emphasize the precipitous 42% increase between 2011 and 2012, which indicates the growing interest in geothermal resources.
• Even though Turkey’s potential in geothermal energy is very high – 2,000 MW – the installed capacity was 162 MW at the end of 2012. This discrepancy signifies the need for large scale investment to tap into the full potential. This potential is described further in the next slide.
• The biggest players in electricity production from geothermal resources are: Zorlu Enerji, Güriş Enerji and BM Holding. Zorlu Enerji is investing in additional capacity adding to its current 15 MW portfolio, and the company plans to have 95 MW by the end of 2013.
• Güriş Enerji has portfolio of 47 MW and is planning to complete a project consisting of 7.25 MW and 4 units of 22.5 MW of geothermal power stations by 2018. Lastly, BM Holding has a GEPP in the Gümüşköy reserve that is rated at 13 MW.

Investment Support and Promotion Agency of Turkey
• According to the European Geothermal Energy Council (EGEC), Turkey is one of the hottest markets in Europe for geothermal energy.
• Figure 24 demonstrates the major EU players in electricity production from geothermal sources. The EGEC predicts an installed capacity of 976 MW will be achieved in Turkey by 2016. Considering Turkey’s current installed capacity, 814 MW of investment opportunity exists if the potential given by the EGEC is to be reached.
• In Europe there are a total of 62 geothermal power plants for electricity generation and 15% of these plants exist in Turkey.
• The Electrical Energy Supply Security Strategy Paper written by Ministry of Energy and Resources, on the other hand, aims for a capacity of 600 MW by 2023.
• The Renewable Energy Support Mechanism’s feed-in tariff for geothermal energy is 10.5 USD cent/kWh. Extra incentives exist for steam or gas turbines, generators, power electronics components, steam injectors and vacuum compressors manufactured in Turkey which equals 13.3 USD cent/kWh.
33
923 925 976
33 42 88
2 5 10 20
0100200300400500600700800900
1,000
Italy
Icela
nd
Turk
ey
Port
ugal
Fra
nce
Germ
any
Cro
atia
Czech
Rep.
Hungary
Spain
MW
2012
2016
Source: European Geothermal Energy Council, 2012
Figure 24: Highest Installed Geothermal Capacities in EU
Table 7: Feed-in Tariff and Incentives, Locally Manufactured Components, Geothermal Energy
Locally manufactured component Bonus (USD cent/kWh)
Steam or gas turbines 1.3
Generator and power electronics 0.7
Steam injector or vacuum compressor 0.7
Total 10.5 + 2.7 = 13.2
Feed-in-tariff and Local Equipment Bonus Prices for Geothermal
Turkey is one of the hottest markets in Europe for geothermal energy.

Investment Support and Promotion Agency of Turkey
• The role of biomass in the share of renewables experienced significant growth especially in the last few years. Steady growth in the early 2000s gained momentum after 2007 due to the enactment of the Renewable Energy Law.
• According to REL, biomass is a resource obtained from agricultural and forestry products including vegetable oil waste, agricultural harvesting waste as well as from organic waste, and from the byproducts formed after their processing.
0
20
40
60
80
100
120
140
160
1802002
2003
2004
2005
2006
2007
2008
2009
2010
2011
2012
MW
Source: TEİAŞ
Figure 25: Installed Biomass Capacity in Turkey, 2002-2012
34
Biomass is one of the rising stars of renewable energy.
• At the end of 2012, installed biomass capacity in Turkey was 158 MW, this was an increase of 26% compared to 2011 (see Figure 25).
• It is also important to note that installed biomass capacity increased at a CAGR of 19% in the last decade. The given installed capacity combines the installed capacity of electricity generation from all types of biomass activities.
• Considering the potential gasification capacity of 600 MW from forestry waste, Turkey continues to hold opportunities for investors.
• Waste management and disposal are high priorities in the public sector. In 2010, a total of 3 billion TL worth of investment was allocated by the government to environmental technologies where 91 million TL was used for waste management activities.
• Some of the major municipalities in Turkey such as Ankara, Istanbul and Adana already utilize electricity generation from waste. Major players in the industry include ITC (Integrated Solid Waste Management Systems) and Ortadoğu Enerji.
CAGR: 19%

Investment Support and Promotion Agency of Turkey
35
Locally manufactured component Bonus (USD cent/kWh)
Steam boiler with fluid bed 0.8
Liquid or gas fired steam boiler 0.4
Gasification or gas removal group 0.6
Steam or gas turbine 2
Internal combustion or stirling engine 0.9
Generator and power electronics 0.5
Cogeneration system 0.4
Total 13.3 + 5.6 = 18.9
Feed-in-tariff and Local Equipment Bonus Prices for Biomass
Table 8: Feed-in Tariff and Incentives, Locally Manufactured Components, Biomass Including Landfill Gas
Biomass investments are eligible for a high feed-in tariff similar to solar power investments.
• The feed-in tariff applied to biomass and biogas projects is 13.3 USD cent/kWh which also includes electricity generation from landfill.
• Biomass technologies receive the second highest incentive rate after solar CSP technologies. The total feed-in tariff that can be applied to biomass technologies is 18.9 USD cent/kWh.
• Generation of electricity from waste has attracted the attention of foreign investors. The South Korean company CEV-Clean Energy & Vehicle has a project in Gaziantep to produce 3.3 MW of electricity from methane gas. Additionally, the company is involved in a research and development project regarding solid waste storage and its ability to be utilized in electricity generation.
Investment Tip: The high feed-in tariff of 18.9 USD cent/kWh, is similar to solar power investments and makes biomass investments very attractive. Biomass power plants have the advantage of high capacity and this allows the plant to operate as a base load power plant. Since biomass power plants do not compete for grid connection rights - unlike solar and wind projects - this makes them even more attractive for investment.

Investment Support and Promotion Agency of Turkey
36
USD cent/ kWh
Turkey (Min. FIT)
Turkey (Including Local Bonus)
Slovakia Bulgaria Ukraine Armenia Latvia
Solar 13.3 20 15.8 11.4 25.3 - 31
Wind 7.3 11 10.4 7.2 8.4 8.9 5
Biomass 13.3 18.9 14.9 16.1 16.2 8.9 7
Hydro 7.3 9.6 8.2 10.8 5.6 2.0 11
Geothermal 10.5 13.2 25.3 - - - -
Turkey has relatively higher feed-in tariffs than many other countries in Europe and the Caucasus.
A Feed-in tariff (FIT) is a pricing mechanism designed to promote investment in renewable energy technologies. FITs have been implemented by various countries all around the world in the last two decades to provide long term contracts to renewable energy producers. In many cases, FIT payments are awarded for 10 to 20 years depending on the economic policy adopted.
Countries leading in renewable energy implementation such as Germany and Spain have advocated the use of FITs. After successfully integrating renewable energy resources into their portfolios, Western European countries have started to lower their FIT levels. For instance, Spain has completely removed their FIT structure since the country has achieved its renewable energy targets. As Western European countries reach a maturation level in the renewable market, Eastern Europe and the Middle East offer various opportunities.
As seen in Table 9, Turkey has one of the highest levels of FIT within Eastern Europe with regards to various technologies.
Table 9: Feed-in Tariff Comparison of Turkey and Selected Countries

Investment Support and Promotion Agency of Turkey
A growing
economy that
drives energy
consumption and
thus, demand
Strong political
focus on
liberalization and in
establishing a
competitive and
transparent market
Competitive
incentive
packages
Availability of
skilled human
resources at
cost competitive
rates
Availability of
various trading
opportunities
(especially for
electricity)
Ambitious 2023
targets in
renewable energy
utilization
Feed-in tariffs and
numerous
incentives are
provided for
renewable energy
projects
Strong political
focus on
promoting
investments
Transparent
market structure
and rules with well
run government
agencies
Availability of
interconnections
with neighboring
countries
37
Various reasons exist to invest in Turkey’s vibrant renewable energy
market
• Turkey’s successful emerging economy creates a broad spectrum of investment opportunities. Ambitious energy targets for 2023 such as 125 GW of installed capacity, compared to 2012’s 57 GW and 30% renewable installed capacity by 2023 can only be achieved through significant investment.
• Turkey offers tremendous benefits for foreign and domestic investors such as exemption from VAT and customs duty. The government’s feed-in tariffs over the course of 10 years is another reason that investors are attracted to the renewable energy market.
• As universities enhance their alternative energy programs, the labor force in Turkey becomes more knowledgeable and innovative regarding renewable energy projects.
• Due to its geographical location and connection with ENTSO-E cross-border trade opportunities also exist for investors who are interested in renewable energy projects.

Investment Support and Promotion Agency of Turkey 38
Güriş İnşaat ve Mühendislik A.Ş. undertook the biggest geothermal projects in Turkey with a capacity of 47.4 MW including all construction, mechanical installation and electricity related operations.
Zorlu Doğal Elektrik Üretimi A.Ş. possesses the operational rights of the first geothermal power plant in Turkey, the Denizli Kızıldere Electric Power Plant. The plant’s capacity is 15 MW. The company is trying to increase the company’s installed capacity from 80 MW to 95 MW in 2013.
ITC provides a combination of processes from the rehabilitation of wild landfills, design and operation of sanitary landfills, energy production from biomethanazation, gasification incineration, RDF production and the like. The company’s facilities are located in Ankara, Adana, Konya, Bursa and Antalya. The company undertakes waste management operations in several plants located in Ankara. Regarding their total power plants, 100 MW is in operation and 80 MW is under construction. 200 MW installed capacity, which will supply the energy demands of approx. 500,000 households, will be put into operation once the projects are completed.
Soma RES has 140.1 MW installed capacity and 119 wind turbines. An investment of 170 million Euros was made for the project. Currently, Polat Enerji is undertaking the Geycek RES project which will have an installed capacity of 150 MW and 190 million Euros of investment will be made for the project.
Aksa Enerji has three WEPPs in operation. The largest is Şamlı WEPP with a capacity of 90 MW. Şamlı’s capacity will increase by 24 MW thanks to an agreement signed with Vestas. The company has 1 wind project under construction which will have a capacity of 30 MW once completed.
Rotor Elektrik Üretim A.Ş, which is operating within Zorlu Energy Group, built a WEPP in Osmaniye which has a generation capacity of 135 MW. Zorlu Energy also built the first WEPP in the country with an installed capacity of 56.4 MW. The first phase of this project has been completed.
Some selected major renewable energy success stories are…

Investment Support and Promotion Agency of Turkey
©2013 Deloitte Turkey. Member of Deloitte Touche Tohmatsu Limited 39
GENSED – Turkish Photovoltaic Industry Association
• Assists firms in the solar energy sector to obtain solar related laws and regulations by connecting them to government ministries.
• Gathers organizations working in the production and distribution of electricity obtained from solar energy under a single roof and creates a forum for their concerns.
TWEA – Turkish Wind Energy Association
• Turkey’s most important non-governmental organization dealing with wind energy. It is also the official branch of EWEA in Turkey.
• Expanding the use of wind energy.
• Capacity building for wind energy.
Li-DER – Unlicensed Electricity Generation Association
• Supports individuals and organizations who work on the production of unlicensed electricity through capacity building.
• Works to increase usage of unlicensed electricity in Turkey.
• At the forefront of the formation of regulatory standards.
BIYOGAZDER – Association of Biogas Investments Development
• Capacity building: Informs investors and lawmakers about production of electricity, thermal energy and natural gas from biogas.
• Builds sample facilities and helps in determining the feasibility of current ones.
• Supports research and development in the biogas sector.
TJD – Geothermal Association of Turkey
• Supports the research of geothermal resources and implementation.
• Creates a platform where experts gather to share information from the industry.
• Works to increase the awareness of geothermal usage not only for electricity production but also in heating, cooling and tourism.
RESSİAD – Wind and Hydropower Plants Businessmen’s Association
• Gathers private sector organizations working in wind and the hydroelectric energy sector under one roof.
• Solves problems regarding production of electricity from wind and hydro power in Turkey.
Several NGOs are active in developing the capacity necessary for increasing renewable investments.

Investment Support and
Promotion Agency of Turkey
E. Air Quality & Greenhouse Gas
Emission Control
i. Greenhouse Gas Emissions in Turkey
ii. Greenhouse Gas Emissions by Sector
iii. The Current and Future State of Carbon Markets in Turkey
Investment Support and Promotion Agency of Turkey
41
0
50
100
150
200
250
300
350
400
450
2000
2001
2002
2003
2004
2005
2006
2007
2008
2009
2010
2011
MM
TC
DE
CO2 CH4 N2O F Gases
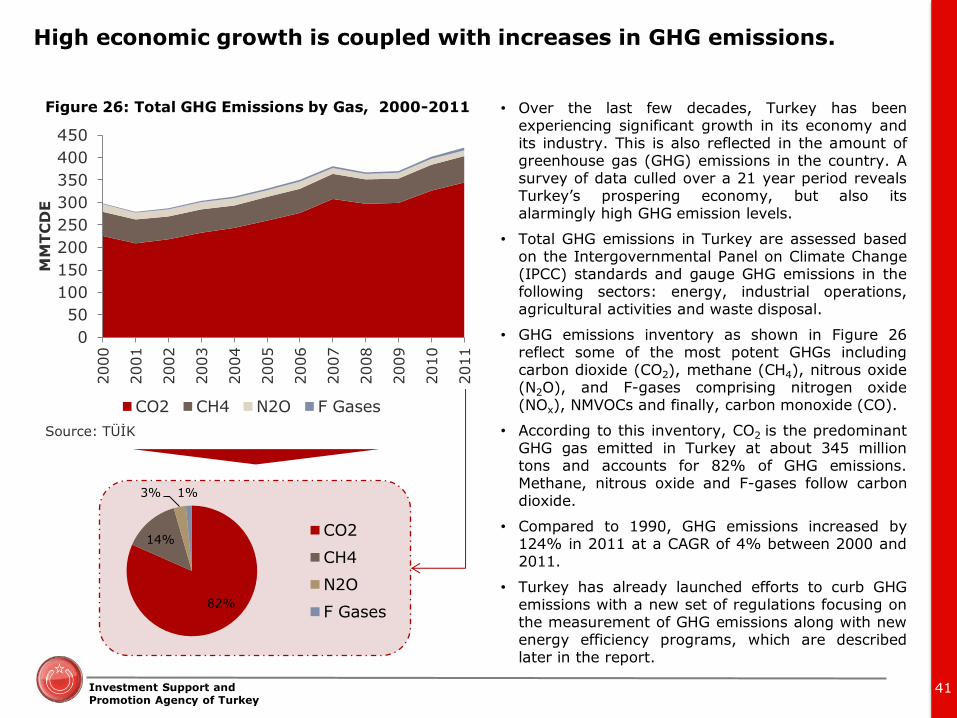
Figure 26: Total GHG Emissions by Gas, 2000-2011
Source: TÜİK
High economic growth is coupled with increases in GHG emissions.
82%
14%
3% 1%
CO2
CH4
N2O
F Gases
• Over the last few decades, Turkey has been experiencing significant growth in its economy and its industry. This is also reflected in the amount of greenhouse gas (GHG) emissions in the country. A survey of data culled over a 21 year period reveals Turkey’s prospering economy, but also its alarmingly high GHG emission levels.
• Total GHG emissions in Turkey are assessed based on the Intergovernmental Panel on Climate Change (IPCC) standards and gauge GHG emissions in the following sectors: energy, industrial operations, agricultural activities and waste disposal.
• GHG emissions inventory as shown in Figure 26 reflect some of the most potent GHGs including carbon dioxide (CO2), methane (CH4), nitrous oxide (N2O), and F-gases comprising nitrogen oxide (NOx), NMVOCs and finally, carbon monoxide (CO).
• According to this inventory, CO2 is the predominant GHG gas emitted in Turkey at about 345 million tons and accounts for 82% of GHG emissions. Methane, nitrous oxide and F-gases follow carbon dioxide.
• Compared to 1990, GHG emissions increased by 124% in 2011 at a CAGR of 4% between 2000 and 2011.
• Turkey has already launched efforts to curb GHG emissions with a new set of regulations focusing on the measurement of GHG emissions along with new energy efficiency programs, which are described later in the report.
Investment Support and Promotion Agency of Turkey
42
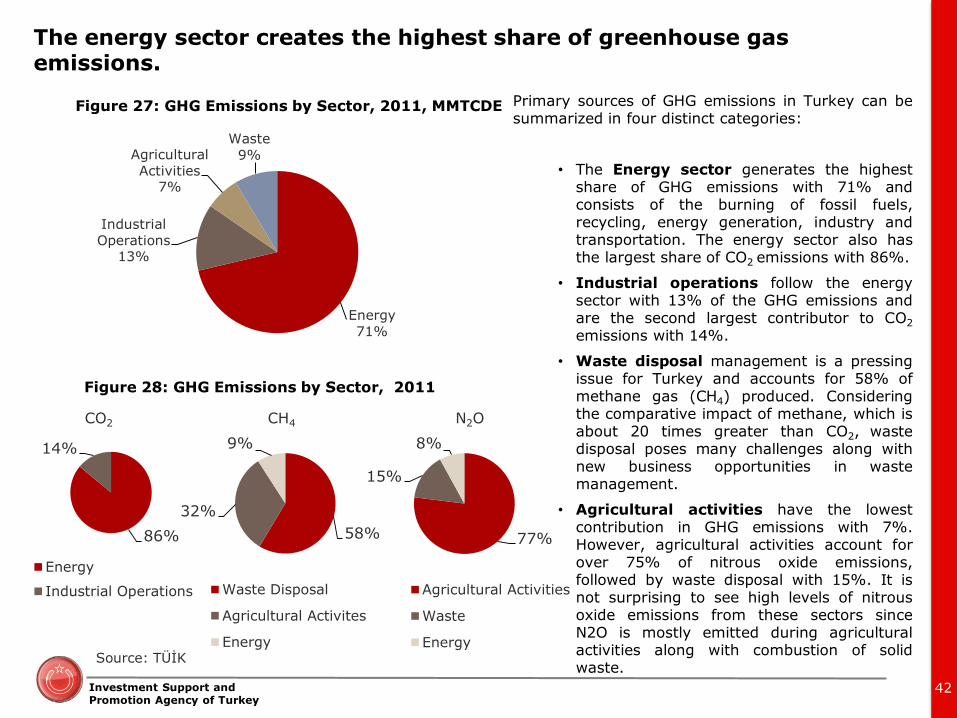
The energy sector creates the highest share of greenhouse gas emissions.
Energy 71%
Industrial Operations
13%
Agricultural Activities
7%
Waste 9%
Figure 27: GHG Emissions by Sector, 2011, MMTCDE Primary sources of GHG emissions in Turkey can be summarized in four distinct categories:
• The Energy sector generates the highest share of GHG emissions with 71% and consists of the burning of fossil fuels, recycling, energy generation, industry and transportation. The energy sector also has the largest share of CO2 emissions with 86%.
• Industrial operations follow the energy sector with 13% of the GHG emissions and are the second largest contributor to CO2
emissions with 14%.
• Waste disposal management is a pressing issue for Turkey and accounts for 58% of methane gas (CH4) produced. Considering the comparative impact of methane, which is about 20 times greater than CO2, waste disposal poses many challenges along with new business opportunities in waste management.
• Agricultural activities have the lowest contribution in GHG emissions with 7%. However, agricultural activities account for over 75% of nitrous oxide emissions, followed by waste disposal with 15%. It is not surprising to see high levels of nitrous oxide emissions from these sectors since N2O is mostly emitted during agricultural activities along with combustion of solid waste.
Figure 28: GHG Emissions by Sector, 2011
CO2 CH4 N2O
Source: TÜİK
86%
14%
Energy
Industrial Operations
58%
32%
9%
Waste Disposal
Agricultural Activites
Energy
77%
15%
8%
Agricultural Activities
Waste
Energy

Investment Support and Promotion Agency of Turkey
43
59%
29%
1%
3% 2%
6%
Hydro
Wind
Biogass
Geothermal
EnergyEfficiency
Source: The Carbon Market in Turkey, Ministry of Environment and Urban Planning
Figure 29: Carbon Mitigation Projects
As fragmented carbon markets emerge globally, Turkey expects to launch its carbon market by 2015.
• The Kyoto Protocol has crucial significance in managing greenhouse gas emissions by imposing a cap-and-trade system. Not only did the Kyoto Protocol set binding obligations to reduce greenhouse gasses in industrialized countries, it also initiated the establishment of the carbon market. Although, the Kyoto Protocol set out to propose a global solution to greenhouse gas emissions, its success remains debatable since countries with the largest emissions such as the United States and China never actually signed the treaty.
• Besides the Kyoto Protocol, myriad carbon markets and regulations are appearing on the horizon. Turkey is not obliged to a quantitative reduction commitment due to its ‘special circumstances’ in the Kyoto Protocol (listed under Annex I, but not Annex B), and is one of the many countries that plan to pursue their own policies. The abovementioned special condition has prevented Turkey from engaging in flexibility mechanisms including the Clean Development Mechanism and Joint Implementation.
• Even though Turkey cannot participate in CDM and JI projects, it performs in voluntary markets where carbon credits are bought by companies and organizations that are interested in balancing or neutralizing their carbon emissions. In May 2012, there were a total of 201 GHG mitigation projects. Hydro projects account for 59% of GHG emission reduction projects followed by wind with 29% and geothermal with 6%. Other projects include biogas, energy efficiency and energy generation from waste.
The National Climate Change Action Plan • Plans to carry out negotiations to ensure Turkey’s
participation in the most advantageous way into the existing and new, global and regional carbon markets in 2013.
• Aims to finalize studies to establish the carbon market in Turkey by 2015.
Energy Efficiency Strategy Paper • Related to the context of sustainable financing
mechanisms (with the exception of members of the public who seek applications related to energy efficiency and renewable energy sources), and is concerned with developing the infrastructure of carbon trading and the carbon market which shall be completed by mid-2014.

Investment Support and Promotion Agency of Turkey
44
Integrated Pollution Prevention and Control in Turkey will start a new era in the industry.
As was previously mentioned, the energy sector and industrial operations generate the highest share of GHG emissions in Turkey. A strong economy and continuous growth is expected to increase the share of hazardous GHG emissions and the implementation of Integrated Pollution Prevention and Control (IPPC) in Turkey will decrease the emission levels significantly. It is important to note that IPPC is a European Union Directive enacted in 2008 in order to prevent hazardous air and water emissions caused by industrial and agricultural activities.
Turkey realizes the importance and consequences that can be encountered due to these emissions and has taken several steps to integrate environmental protection policies. For instance, The Turkish Industrial Strategy Document published by the Ministry of Industry and Trade for the years between 2011 and 2014 states that preparations for the implementation of the IPPC legislation will continue until it is adopted.
According to the European Commission the IPPC Directive is based on several main principles and they are as follows:
1. An Integrated Approach
• The permit must take into account the following environmental criteria, emissions in the air, water and land, generation of waste, use of raw materials, energy efficiency, noise, and prevention of accidents. The IPPC Directive looks at the environment as a whole.
2. The Best Available Techniques (BAT)
• In order to determine the Best Available Techniques, the Commission arranges meetings between experts in EU member states and within the industry and environmental organizations. Implementation of BAT in Turkish companies will require immense investments.
3. Flexibilty
• The Directive allows licensing authorities to determine permit conditions such as, the technical characteristics of an installation, its geographical location and the conditions of the local environment.
4. Public Participation
• According to the Directive, the public has a right to participate in the decision making process and has a right to access permit applications in order to give opinions, the permits themselves, the results of the monitoring of the emissions and the like.
Source: European Commission

Investment Support and
Promotion Agency of Turkey
F. Special Focus: Electric Vehicles
i. The Current State of Electric Vehicles in Turkey
Investment Support and Promotion Agency of Turkey
46
30%
50%
5% 9%
59%
22%
14% 12%
40%
11%
56%
43%
52% 51%
34%
61% 60%
42%
50%
45%
14%
7%
43% 40%
7%
17%
26%
46%
10%
44%
0%
10%
20%
30%
40%
50%
60%
70%
Brazil China France Germany India Spain Italy U.S. Turkey UK
% o
f R
esp
on
den
ts
Potential first movers Might be willing Not likely to consider
Source: Deloitte Analysis
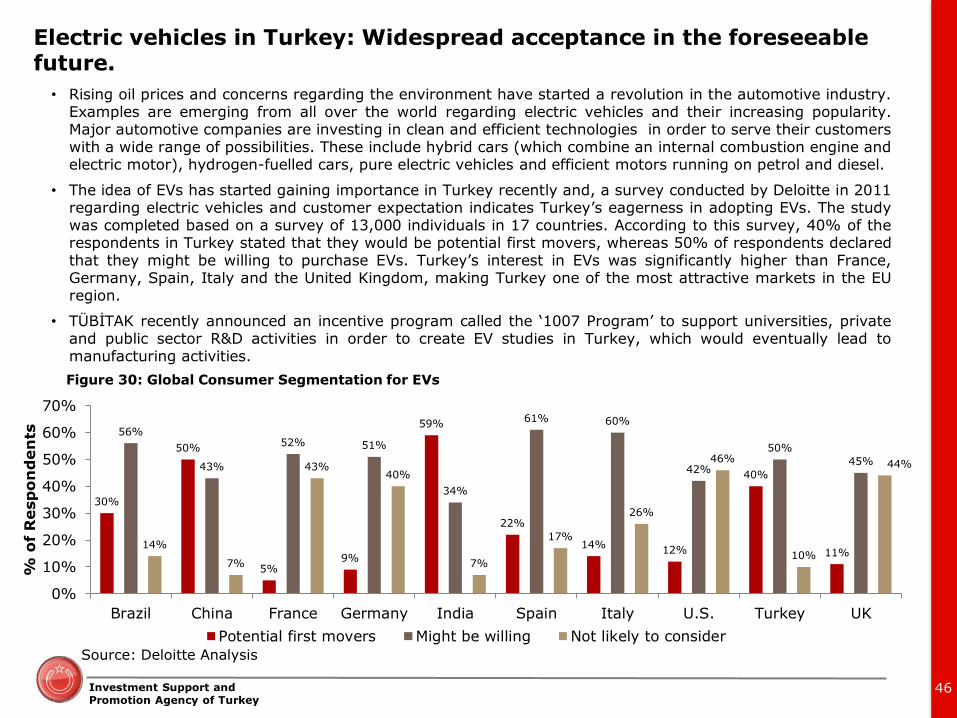
Figure 30: Global Consumer Segmentation for EVs
Electric vehicles in Turkey: Widespread acceptance in the foreseeable future.
• Rising oil prices and concerns regarding the environment have started a revolution in the automotive industry. Examples are emerging from all over the world regarding electric vehicles and their increasing popularity. Major automotive companies are investing in clean and efficient technologies in order to serve their customers with a wide range of possibilities. These include hybrid cars (which combine an internal combustion engine and electric motor), hydrogen-fuelled cars, pure electric vehicles and efficient motors running on petrol and diesel.
• The idea of EVs has started gaining importance in Turkey recently and, a survey conducted by Deloitte in 2011 regarding electric vehicles and customer expectation indicates Turkey’s eagerness in adopting EVs. The study was completed based on a survey of 13,000 individuals in 17 countries. According to this survey, 40% of the respondents in Turkey stated that they would be potential first movers, whereas 50% of respondents declared that they might be willing to purchase EVs. Turkey’s interest in EVs was significantly higher than France, Germany, Spain, Italy and the United Kingdom, making Turkey one of the most attractive markets in the EU region.
• TÜBİTAK recently announced an incentive program called the ‘1007 Program’ to support universities, private and public sector R&D activities in order to create EV studies in Turkey, which would eventually lead to manufacturing activities.

Investment Support and
Promotion Agency of Turkey
II. Energy Efficiency in Turkey

Investment Support and
Promotion Agency of Turkey
A. Energy Efficiency
i. The Global Outlook on Energy Efficiency
ii. The Development of Energy Efficiency in Turkey
iii. Turkey’s Targets In Regards to Energy Efficiency
iv. Potential Sectors for Energy Efficiency
v. Green Buildings
vi. Smart Grid
vii. Incentives for Energy Efficiency Projects

Investment Support and Promotion Agency of Turkey
Negawatts are on the rise globally…
49
• Energy efficiency improvements refer to a reduction in the energy used for a given service (heating, lighting, etc.) or level of activity.
• Energy intensity, defined as the amount of energy used to produce a unit of gross domestic product (GDP), is the most common proxy for energy efficiency improvements; although effects of the economy, climate and industry dynamics should also be considered.
• In many countries, energy efficiency policies are introduced in the field of industry, building and transportation. Policies that target the industry sector consist of tax and R&D incentives, equipment performance standards, energy management programs, etc. For the building sector, labeling the energy usage of buildings and appliances is becoming mandatory as well as energy conservation policies for residential and commercial buildings. In the transportation sector, fuel economy policies as well as increasing the share of public transport are other measures for creating energy efficiency.
• While the increasing energy demand drives capacity investments in megawatts, there is a great emphasis on increasing «negawatts», which is energy conserved by energy efficiency measures.
260.06
244.78
232.24
226.18
227.47
200.00 220.00 240.00 260.00 280.00
1990-1994
1995-1999
2000-2004
2005-2009
2010-2012
TOE per USD Million Source: EIU
Figure 31: Energy Intensity Development of World
• Figure 31 shows the global energy intensity, indicating that energy intensity has fallen over the years with an increasing emphasis on the energy efficiency and energy management activities. The reason of this decline can be explained with both energy efficiency improvements as well as transition away from energy intensive industries1.
1: World Energy Outlook, 2012

Investment Support and Promotion Agency of Turkey
And Turkey is committed to this change…
50
98.30%
1.70%
Import Domestic Production
88.20%
11.80%
Import Domestic Production
Figure 33: Turkey’s Petroleum Supply
Figure 34: Turkey’s Natural Gas Supply
Source: EMRA Source: EMRA
Source: BP Statistical Review of World Energy, June 2013
• Strengthening its energy security via decreasing the dependency on the importation of its energy resources is one of Turkey’s top priorities.
• Dependency on energy imports, especially oil and gas, is a primary concern of the government. Therefore, investments in local energy resources and energy efficiency are highly favored.
• Turkey’s primary energy consumption can be seen in Figure 32. Oil, natural gas and hydro power have the highest share in primary energy consumption.
• Nearly all natural gas is imported while over 88% of petroleum is imported, as seen in Figure 33 and 34.
• Energy import dependency is also one of the major concerns for electricity generation. According to TEİAŞ’s data, in 2012 the share of energy generated by natural gas was 45%.
• In addition to increasing the share of domestic energy resources (coal, hydrocarbon and renewables, including hydropower) in its total electricity generation, Turkey gives importance to energy efficiency projects to overcome this dependency.
Figure 32: Primary Energy Consumption of Turkey, 2012
26.4%
35.0%
26.3%
11.0% 1.3%
Oil
Natural gas
Coal
Hydro
Renewables

Investment Support and Promotion Agency of Turkey
To promote energy efficiency measures, several regulations have been enacted over the years in Turkey.
51
2008 2011 2012 2007
The Regulation on the Principles and Procedures for Increasing Energy Efficiency in Transportation This regulation covers the principles and procedures regarding effective use of energy in vehicles and promotes public transportation.
The Regulation of Energy Performance of Buildings This regulation covers the principles and procedures regarding effective and efficient use of energy and energy resources in buildings, the prevention of energy waste and the protection of the environment.
Notification Regarding Energy Efficiency Support This notification covers principles and procedures applicable to increasing and promoting energy efficiency of industrial enterprises.
Energy Efficiency Law No: 5627 This law covers principles and procedures applicable to increasing and promoting energy efficiency in the energy generation, transmission, distribution and consumption phases in industrial establishments, buildings, power generation plants, transmission facilities, distribution networks and transport, raising energy awareness in the general public and utilizing renewable energy sources.
Energy Efficiency Strategy Paper This paper defines the energy efficiency targets for the period of 2012-2023.
The Regulation on Increasing Efficiency in the Use of Energy Sources and Energy* This regulation directs the efficient use of energy, alleviating the burden of energy costs on the economy.
The Year of Energy Efficiency 2008 was declared The Year of Energy Efficiency to draw attention to energy waste and the importance of energy efficiency.
*This regulation was published in 2008 and updated in 2011.

Investment Support and Promotion Agency of Turkey
The Energy Efficiency Strategy Paper has been published for the period of 2012-2023 and its aims are to…
52
Reduce energy intensity and energy losses in the industry and services sectors.
Enable the use of energy effectively and efficiently in the public sector.
Decrease the energy demand and carbon emission of buildings: promoting sustainable environment-friendly buildings using renewable energy sources.
Reduce the unit fossil fuel consumption of motorized vehicles, increasing public transportation on roadways, railways and in maritime transport, and preventing unnecessary fuel consumption in urban transportation.
Enable market transformation through energy efficient products.
Increase efficiency in production, transmission and distribution of electricity and decrease energy losses and harmful environmental emissions.
Strengthen institutional capacities and collaborations, increase the use of state of the art technology and awareness activities and developing financial support for these innovations

Investment Support and Promotion Agency of Turkey
The need for reductions in energy intensity enables the huge potential in energy efficiency projects in Turkey.
53
• When viewing total energy consumption, the
industrial sector has the highest share with
33% in total amount. Approximately 50% of
the total electricity consumption belongs to the
industrial sector as well, and the same
percentage is also true for the natural gas
consumption of industries.
• The basic structure of the major industries in
Turkey is energy-intensive and includes such
things as the base metal, chemical, stone and
soil industries.
Figure 35: Energy Consumption by Sectors, 2012
33%
16%
27%
7%
17%
Industry
Transport
Residential
Commercial& Public
Sector
Other
Source: EIU estimates
0
0.1
0.2
0.3
0.4
0.5
0.6
TO
E p
er t
hou
san
d 2
00
5 U
S
Doll
ars o
f G
DP
Calc
ula
ted
U
sin
g P
PS
EU Average OECD Average
Figure 36: Energy Intensity of Selected Countries, 2010
Source: OECD Fact book

Investment Support and Promotion Agency of Turkey
Authorized energy efficiency consulting companies (ESCOs) are performing energy efficiency services in industrial enterprises and buildings.
54
• Companies that provide energy efficiency services require authorization by the Directorate of Renewable Energy (YEGM) or institutions authorized by YEGM, such as NGOs and universities.
• Energy efficiency services refer to consulting, training, audit and implementation services. The activities conducted by authorized companies (ESCOs) are:
• Carrying out training, certification, audit and consulting activities under service contracts made with industrial establishments, building owners or management.
• Preparing projects for implementing the measures identified by energy efficiency audits.
• Implementing changes according to the projects under implementation agreements to guarantee energy savings.
• There are two types of authorization certificates: one for the industrial sector and one for the building sector. The two types of certificates call for different benchmarks, e.g. in order to obtain an industry ESCO authorization, the ESCO should provide proof of significant experience in at least one of the industrial segments such as iron, steel, cement, etc., and should limit its activity to the sector that it has proven experience.
• Currently, there are 33 active energy efficiency consulting companies in Turkey. 9 of them are authorized to provide certificates for both industry and buildings, 17 of them are authorized to provide building certificates and 7 of them are authorized to provide industry certificates.
• Certified Energy Managers offer another option when adopting efficiency measures. Delegating or employing a Certified Energy Manager is an obligation for high energy consuming industrial establishments and buildings. Energy managers are responsible for activities such as analyzing energy consuming equipment including their maintenance and calibration, market analysis for efficiency improvement projects, energy audits as well as presenting the feasibility of these projects to the management board. In Turkey, there are approximately 5000 Certified Energy Managers as of 2013.
17
7
9 Building
Industry
Industry and
Building
Figure 37: Number of Energy Efficiency Companies in Turkey
Source: The Directorate General of Renewable Energy, 2013

Investment Support and Promotion Agency of Turkey
The total amount of savings potential for the industrial sector is estimated at 5.7 million TOE, which corresponds to 2.85 billion USD.
55
Sub-Sectors Energy Efficiency Potential
(%)
Total Energy Usage by Industry
(%)
Amount of Potential
Saving(TOE)
Base Metal 20 25 1,531,400
Stone and Soil 18 19 1,047,478
Textile 35 8.5 911,183
Chemical 18 12 661,565
Food 25 7.5 574,275
Paper 20 4 245,024
Machinery 10 3 91,884
Other 10 21 643,188
Total 5,705,996
• The high energy intensity of the industrial sector means
an estimated 20% potential for energy efficiency. The
energy efficiency and savings potential by sub-sectors
are shown in Table 10.
Source: Chamber of Mechanical Engineers
*1 TOE is taken as 500 USD.
*The number of enterprises are taken from sector
reports of the Ministry of Industry and sector
associations.
Base Metal 1,000
Stone and Soil 3,000
Textile 90,000
Chemicals 22,000
Food 40,000
Paper 50
Machinery 8,000
Number of Industrial Enterprises
Investment Tip: In Turkey, due to the large number of energy intensive industrial facilities, there is great opportunity for energy efficiency services.
Table 10: Energy Efficiency and Saving Potential by Sectors

Investment Support and Promotion Agency of Turkey
Energy efficiency applications in the industrial sector offer various business opportunities along with integrated solutions.
56
Consulting services cover:
• audits for energy
consumption, heat, waste,
water use, etc.
• identification of projects for
improvement of energy and
resource use and
• conducting the feasibility
studies for these projects
Implementation refers to the
services that both design energy
efficiency measures and their
implementation to achieve the
benchmark that has been
established by the ESCO.
According to regulation, ESCOs
are required to commit to the
performance level in the design
phase and undersign it.
Implementation (Turn-Key)
Consulting Equipment & Material
Equipment and material covers
the production and sales of
energy efficient equipment,
ranging from cogeneration and
trigeneration equipment,
efficient motors, energy
management software, lighting
equipment, insulation materials,
etc.
Investment Tip: Opportunities exist in all three segments, but especially within implementation and equipment & material. Global companies are already active in these segments. Highly qualified turn-key solution providers are needed as the energy efficiency sector is in its earliest stage, and know-how is of the utmost importance.
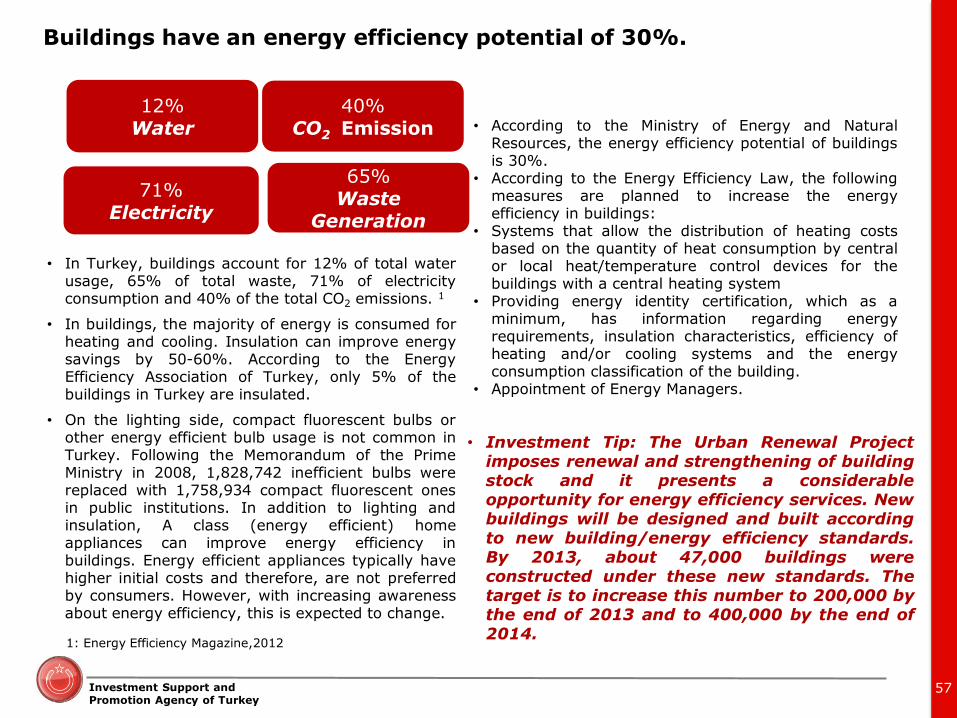
Investment Support and Promotion Agency of Turkey
Buildings have an energy efficiency potential of 30%.
57
12% Water
65% Waste
Generation
71% Electricity
• In Turkey, buildings account for 12% of total water usage, 65% of total waste, 71% of electricity consumption and 40% of the total CO2 emissions. 1
• In buildings, the majority of energy is consumed for heating and cooling. Insulation can improve energy savings by 50-60%. According to the Energy Efficiency Association of Turkey, only 5% of the buildings in Turkey are insulated.
• On the lighting side, compact fluorescent bulbs or other energy efficient bulb usage is not common in Turkey. Following the Memorandum of the Prime Ministry in 2008, 1,828,742 inefficient bulbs were replaced with 1,758,934 compact fluorescent ones in public institutions. In addition to lighting and insulation, A class (energy efficient) home appliances can improve energy efficiency in buildings. Energy efficient appliances typically have higher initial costs and therefore, are not preferred by consumers. However, with increasing awareness about energy efficiency, this is expected to change.
40% CO2 Emission
1: Energy Efficiency Magazine,2012
• According to the Ministry of Energy and Natural Resources, the energy efficiency potential of buildings is 30%.
• According to the Energy Efficiency Law, the following measures are planned to increase the energy efficiency in buildings:
• Systems that allow the distribution of heating costs based on the quantity of heat consumption by central or local heat/temperature control devices for the buildings with a central heating system
• Providing energy identity certification, which as a minimum, has information regarding energy requirements, insulation characteristics, efficiency of heating and/or cooling systems and the energy consumption classification of the building.
• Appointment of Energy Managers.
• Investment Tip: The Urban Renewal Project imposes renewal and strengthening of building stock and it presents a considerable opportunity for energy efficiency services. New buildings will be designed and built according to new building/energy efficiency standards. By 2013, about 47,000 buildings were constructed under these new standards. The target is to increase this number to 200,000 by the end of 2013 and to 400,000 by the end of 2014.

Investment Support and Promotion Agency of Turkey
The concept of green buildings is an emerging trend in Turkey - and all over the world.
58
• Green buildings are constructions that are environmentally responsible and resource efficient throughout a building's life-cycle: from site selection to design, construction, operation, maintenance, renovation and destruction.
• Green buildings are certified by several green building institutions. Green building certification delivers energy and water efficient, healthy, environmentally friendly cost saving buildings to the market.1
27
56
1
BREEAM
LEED
DGBN
• In Turkey, there are 84 certified green buildings. The majority of them are certified by LEED.
• As of January 2013, the Turkish Standard Institution (TSE) also finalized its study regarding issuing green building certifications. With this latest development, the number of green building certificates in Turkey is expected to rise.
• Although the cost of green building construction is more than regular construction by approx. 5-10%, the overall energy cost can be reduced by upwards of 50-70% in these buildings due to improvements in efficiency.
• Under the scope of the Urban Renewal Project, an estimated 6.5 million buildings are to be rebuilt in Turkey. Using green building practices, 30,000 tWh energy can be saved annually from these buildings.
Figure 38: Number of Certified Buildings, Turkey
Source: Green Building Association of Turkey
1: U.S. Green Building Council
Investment Tip: The Ministry of Health has recently required all new hospital buildings to be «green», which paves the way for green public buildings and indicates the potential for growth within this sector.

Investment Support and Promotion Agency of Turkey
Waste heat recovery, cogeneration and trigeneration technologies offer opportunities in efficient energy generation.
59
• According to the Turkish Cogeneration and Clean Energy Association, when electricity is produced with a steam turbine of 100 MW, 25 MW of heat energy is wasted per hour.
• Utilization of waste heat in thermal plants is an opportunity for energy efficiency. In Turkey, 20,000 MW of thermal capacity is available by utilizing this waste.
• The waste heat can be utilized in various areas such as greenhouse cultivation, cooling and heating systems and regional heating.
• In addition, cogeneration and trigeneration technologies are becoming widespread. Cogeneration and trigeneration mean simultaneous generation of electrical power and thermal energy.
• These technologies achieve greater energy efficiency than conventional systems producing power, heat or cooling separately. These technologies are suitable for:
• Hotels • Hospitals and health facilities • Shopping centers • Educational facilities and universities • Multi-dwelling residential buildings
• In industrial facilities the use of these technologies has been common since 1992. Especially in industries such as cement, steel and glass manufacturing, which require high temperatures for these processes, would benefit greatly from waste heat recovery systems.
• In Turkey, only a small number of hospitals and shopping centers benefit from cogeneration or trigeneration. However, there is growing awareness of the benefits of these investments.
• In addition to an increase in efficiency, these systems allow on-site generation where consumption and generation are within the same location. Thus, transmission and distribution losses are prevented.
4 127 200 332 837 1,040
1,560 2,056
2,734 3,200
3,800 4,500
5,000 5,300 5,700 5,800 6,000
6,400 6,700 6,900 7,120
0
2,000
4,000
6,000
8,000
1992
1993
1994
1995
1996
1997
1998
1999
2000
2001
2002
2003
2004
2005
2006
2007
2008
2009
2010
2011
2012
Figure 39: Cogeneration Development, Turkey
MW
Major Players in the Sector are:

©2013 Deloitte Türkiye. Member of Deloitte Touche Tohmatsu Limited Investment Support and
Promotion Agency of Turkey
Smart Grid technology will pave the way for several new applications - and will create a paradigm shift.
60
• According to the Institute of Electrical and Electronics Engineers, the smart grid has come to describe the next-generation electrical power system that is typified by the increased use of communications and information technology in the generation, delivery and consumption of electrical energy.
• Balancing supply and demand has become increasingly difficult due to intermittent nature of renewable resources and electricity consumption habits. The smart grid is the solution that will balance supply and demand, reduce struggles with shortages during peak demand as well as increase service quality.
• In fact, Turkey has witnessed the deployment of smart grid technology in the power market with AMI, SCADA and Energy Management Systems. These can be considered the key elements of the emerging smart grid systems.
• Application of SCADA is very common especially among electricity distribution companies due to requirements regarding the quality and continuity of electricity supply. Investments in these systems are expected to increase following the liberalization of the market due to increasing penalties related with quality requirements.
• Smart grids can be divided into three components. These are:
Advanced Metering Infrastructure
Demand Response
Grid Management Programs
• Reducing loss & theft, quick restoration after power disturbances
• Reduce peak demand, decrease consumption
• Automatic meter reading, reduce bad debt
Recipe for Demand Side Management : Demand Response
Demand response is defined as the changes in electric usage by end-use customers from their normal consumption patterns in response to changes in the price of electricity over time, or to incentive payments designed to induce lower electricity use at times of high wholesale market prices or when system reliability is jeopardized.
In the Regulation on Increasing Efficiency in Energy Resources and Energy Use of 2011, participation of industrial and commercial consumers to such demand side management programs is included.
Since demand response reduces the need for investment in flexible, peaking power plants, increasing interest is expected regarding this issue.
Smart grids will enable the implementation of demand response practices and a possible demand response market like the ones in the US or France.
«Turkey will spend $5 billion on smart grid technologies by 2015 to modernize its electricity sector» proceedings from Turkey’s Smart Grid Workshop in February 2013.

Investment Support and Promotion Agency of Turkey
YEGM promotes energy efficiency activities through incentive programs.
61
• Efficiency Improvement Projects refer to measures that eliminate energy waste and inefficiencies in industrial businesses.
• Businesses engaged in the production of goods, of which electricity consumption exceeds 1000 TOE except the ones engaging in electricity generation, and all kind of businesses engaged in the production of goods are able to receive this grant.
• To receive support, an energy audit should be conducted by an authorized energy efficiency company. Only the projects that are approved by YEGM can receive support and only as long as the project cost and payback period terms are satisfied.
• The maximum amount that can be granted to each project is 1 million TL, of which the payback period should be less than 2 years.
• Although the budget for this grant planned to allocate 5 million TL annually, only 20%-30% of the budget was utilized each year between 2009-2012. However, the number of projects that have applied for this grant in 2013 is greater than the total of the last 4 years combined. Thus, the grants to be allocated is expected to increase in the upcoming years.
• Companies who commit to reducing their energy intensity by a minimum average of 10% in three years can enter into an agreement with YEGM and 20% of the company’s energy cost will be covered up to a limit of 200,000 TL.
• The aim of these voluntary agreements is to promote the use of waste, cogeneration and renewables as energy sources.
• In 2009 and 2010, a total of 22 companies made agreements with YEGM, a very small number when compared to the total number of industrial enterprises in Turkey.
Support of Efficiency Improvement Projects
Support of Voluntary Agreements

Investment Support and Promotion Agency of Turkey
Several domestic and international financing options exist in addition to incentives provided by Turkish institutions.
62
• KOSGEB supports activities such as energy audit services,
consultations for energy efficiency improvement projects and energy manager training programs that SMEs get from authorized energy efficiency companies.
• 50%-60% of the cost of these services are covered by KOSGEB as long as the maximum limits are not exceeded.
• The aim is to ease the financing of energy efficiency projects such as waste utilization, improvement on production processes and technology improvements.
• The total amount of support varies between $100,000 and $1,000,000, and will reach a maximum of 50% of the total cost of the project. The repayment period is 4 years with a one year grace period.
The Small and Medium Industry Development Organization (KOSGEB)
The Technology Development Foundation of Turkey (TTGV)
• These entities were developed by the European Bank for Reconstruction and Development for energy efficiency projects.
• Energy efficiency projects in the industrial and the construction sector such as the thermal isolation of
buildings, application of micro-cogeneration and trigeneration or building management systems are financed with the support of these credits.
Turkey’s Sustainable Energy Financing Facility(TurSEFF), Turkey’s Mid-Size Sustainable
Energy Financing Facility (MidSEFF)
Other Financing Options for Energy Efficiency Projects

Investment Support and
Promotion Agency of Turkey
Waste Water Treatment

Investment Support and Promotion Agency of Turkey
Regulatory Structure and Incentives
64
Environmental Law
According to the Regulation on the Principles and Procedures Regarding the Incentives
Applied to Waste Water Treatment Facilities, the energy cost of these facilities can be
covered up to 50% by the Ministry of Environment and Urban Planning.
• Within the scope of this incentive, the Ministry granted approximately 27 million TL to 159 facilities in 2012.
• Today, with 412 waste water treatment facilities, 530 of 2950 municipalities are being served.
• The Ministry has set a target regarding waste water treatment by 2023. According to this target, the Ministry plans to provide waste water treatment services to all of the municipalities by that date.
Regulation on Urban Waste Water Treatment
The Regulation on the Principles and Procedures Regarding the Incentives Applied to Waste Water Treatment Facilities
The Regulation on the Control of Water Pollution
Communiqué on the Technical Procedures of Waste Water Treatment Facilities
Public Institution: The Ministry of Environment and Urban Planning
Some Waste Water Treatment Plant Equipment and Services Companies

Investment Support and Promotion Agency of Turkey
Waste water treatment has increased over the years, and the Ministry’s target is 100% by 2023.
65
Figure 41: Amount of Waste Water Discharged from Municipal Sewers
0
500
1000
1500
2000
2500
3000
3500
4000
1994 1996 1998 2001 2002 2004 2006 2008 2010
Treated Untreated
Million m
3
0
500
1000
1500
2000
2006 2007 2008 2009 2010
Investment Expenditures Current Expenditures
Million T
L
Figure 40: Amount of Public Spending on Waste Water Management • According to the Turkish Statistical Institute, 76%
of waste water discharged was treated in 2010. • Looking at data for the history of waste water
treatment shows that the percentage of treatment has increased significantly over years.
• Figure 40 shows that each year, Turkey spends a considerable amount of its public spending on waste water treatment.
CAGR: 18.6%
CAGR: 8.4%

Investment Support and Promotion Agency of Turkey
66
There are huge investment needs regarding construction of waste water treatment facilities and infrastructure, as well as the renovation of existing ones.
Figure 42: Waste Water Treatment Investment Needs
0
200
400
600
800
1000
1200
1400
1600
2007 2008 2009 2010 2011 2012 2013 2014 2015 2016 2017 2018 2019 2020 2021 2022 2023
Wastewater treatment facilities (new) Wastewater treatment infrastructure (new)
Wastewater treatment facilities (renewal) Wastewater treatment infrastructure (renewal)
Million E
uro
Source: EU Integrated Environmental Approximation Strategy, 2006
In 2006 the Ministry of the Environment and Forestry* conducted a study within the scope of complying with the EU’s environmental acquis. This study examined waste water treatment investment needs up to 2023 and put emphasis on the investment opportunities in this sector.
*: The Ministry was divided into the Ministry of Environment and Urban Planning and the Ministry of Forestry and Water Works in 2011.
• Investment Tip: The economic life-cycle of a waste water treatment facility is 10-15 years, which creates an investment need for renewal.

Investment Support and Promotion Agency of Turkey
For comments on the report and additional information please contact:
[email protected] www.invest.gov.tr Head Office Address: Kavaklıdere Mahallesi Akay Caddesi No:5
Çankaya/ANKARA 06640 Phone: (+90 312) 413 89 00
Office Address: Dünya Ticaret Merkezi A1 Blok Kat:8 No:296
Yeşilköy/İSTANBUL 34149 Phone: (+90 212) 468 69 00
USA Öner AYAN [email protected] Olivia CURRAN [email protected]
GERMANY Kemal KAFADAR [email protected] Ole Von BEUST Rezzo SCHLAUCH Wolf Ruthart BORN
CHINA Hui ZHAO [email protected]
FRANCE Utku BAYRAMOĞLU [email protected] Selçuk ÖNDER [email protected]
INDIA Sanjeev KATHPALIA [email protected] Fariha ANSARİ [email protected]
UK Ahmet İPLİKÇİ [email protected] Muhammed AKDAĞ [email protected]
JAPAN Hitoshi SEKI [email protected] Saya ASHIBE [email protected]
CANADA Murat ÖZDEMİR [email protected]
SAUDI ARABIA Mustafa GÖKSU [email protected]
RUSSIA Eduard ZUBAIROV [email protected]
SOUTH KOREA Veyis TOPRAK [email protected]
SPAIN Yasemen KORUKÇU [email protected]
ISPAT Worldwide

Investment Support and Promotion Agency of Turkey
Deloitte refers to one or more of Deloitte Touche Tohmatsu Limited, a UK private company limited by guarantee, and its network of member firms, each of which is a legally separate and independent entity. Please see www.deloitte.com/about for a detailed description of the legal structure of Deloitte Touche Tohmatsu Limited and its member firms. Deloitte provides audit, tax, consulting, and financial advisory services to public and private clients spanning multiple industries. With a globally connected network of member firms in more than 150 countries, Deloitte brings world-class capabilities and high-quality service to clients, delivering the insights they need to address their most complex business challenges. Deloitte has in the region of 200,000 professionals, all committed to becoming the standard of excellence. ©2013 Deloitte Turkey. Member of Deloitte Touche Tohmatsu Limited
68