Embed Size (px)
Citation preview

Renewable energy capacity study for the West Midlands
A final annex document to Telford & Wrekin Council
March 2011

Renewable energy capacity study for the West Midlands A final annex document to Telford & Wrekin Council
Contents
Annex A: Review of Local Studies ..................................................................................... A-1
Annex B: Accessible resource methodology and assumptions..................................... B-1
Annex C: References ........................................................................................................... C-1
Annex D: Stakeholder workshops...................................................................................... D-1
Annex E: Projections to 2050 ............................................................................................. E-1
Annex F: Energy Crops Low Scenario............................................................................... F-1
Annex G: Grid annexes .......................................................................................................G-1
Contact: Rachel Brisley Tel: 0161 475 2115 email: [email protected]
Chris Fry Date: 24/03/11 Approved by:
Associate Director

A-1
Annex A: Review of Local Studies
Table A-1 : Review of local studies:
Document Summary
Evidence of detailed resource assessment and degree to which this is consistent with the DECC renewable capacity assessment methodology
Geographical scope Relevance to this study
Regional and sub-regional general resource assessments
Birmingham Energy Strategy Carbon Descent Scenarios Draft v4 (2010)
This study focuses on the potential for reducing demand, increasing energy efficiency and potential for renewable energy in Birmingham.
The limitations of potential and the assumptions made to get to these limitations are presented for a range of measures not limited to renewable energy (in transport and grids, for example).
Managed woodland (partially consistent – all wood calculated together, but using the same fuel requirement per MW of capacity)
Waste wood (partially consistent – as with managed wood)
Solar PV (partially consistent – constrains resource further than DECC methodology to account for high number of flats)
Solar thermal (inconsistent – not assessed in DECC methodology)
Large-scale wind (consistent)
Medium wind turbines (inconsistent – not assessed in DECC methodology)
Small wind turbines (consistent)
Heat pumps (partially consistent – either only provides number of homes or method of calculation not indicated)
Birmingham City (20-25km from the outskirts of the city for the assessment of energy crops and woody materials)
Some of the data will be useful for the resource assessment, e.g. for the microgeneration assessment, the number of suitable south-facing roofs will prove useful.
The maximum potential capacity for a range of biomass supply streams is provided (though method not stated).
For those technologies whose assessment was consistent with the DECC methodology, this study will be useful for cross-checking data.
Renewable and Low Carbon Energy Resource Assessment and Feasibility Study – Warwickshire and Solihull (2010)
The aim of the study is to inform the partner Authorities about the potential viability and the deliverability of various renewable and low carbon options (within development and as decentralised generation) through the preparation
Wind energy and Biomass (Fully consistent) Warwickshire and Solihull which includes the LA’s of Stratford-on-Avon, Warwick, North Warwickshire, Nuneaton & Bedworth, Rugby , Solihull and
The study uses development forecasts which expects the provision of 55,800 dwellings between 2006 and 2026, which was amended to 54,000 as part of the WMRSS review undertaken in 2009.

A-2
Document Summary
Evidence of detailed resource assessment and degree to which this is consistent with the DECC renewable capacity assessment methodology
Geographical scope Relevance to this study
of an evidence base. The findings of the study are to be used to inform each individual LA’s LDF in accordance with PPS1 and PPS22 in support of the aim of achieving a 30% carbon reduction cut by 2020 in the region.
The study looks at current and future energy consumption, existing and potential low and zero carbon energy generation capacity, low carbon policies and targets
Warwickshire County. The identified capacity within the study area is approx 28MW (less than 1% of demand) with a further 57MW being planned.
Land potentially available for wind energy will typically offer a marginal opportunity and therefore may only attract limited commercial interest.
There is good potential biomass resource.
Microgeneration can meet 1.3-3.9% or the areas heat and power energy
Overall 9.5% (large contribution from wind in Stratford-on-Avon and Rugby) of the areas heat and energy needs could be met from low carbon sources – exceeding the 4% target in the regional energy strategy
Staffordshire Renewable energy Study (2010)
Aim of the study was to assess the technical potential, viability and deliverability of various renewable and low carbon options through the preparation of a local evidence basis. The evidence base includes an analysis of low carbon potential, investigation of suitable carbon standards for new development, recommendations for planning policy and associated non-planning measures to support effective planning policy. The study also included a review of a number of major development sites within the study areas to examine the viability
Yes – two scenarios presented: base case and elevated case. The assessment covers: wind energy resources and constraints (partially consistent with DECC methodology), microgeneration (not consistent) biomass using one scenario (consistent with DECC), hydropower (from an analysis of 17 sites across the sub-region), and also calculates the renewable energy potential associated with meeting changing building regulations. It does not include an analysis of landfill or sewage gas.
Staffordshire – Cannock Chase, East Staffordshire, Lichfield, Newcastle, Stafford, Staffordshire County, Staffordshire Moorlands, South Staffordshire and Tamworth
Wind, biomass and hydro resource assessments of direct relevance and will be taken into account in the study.
Useful and of relevance for development of planning policy guidance.

A-3
Document Summary
Evidence of detailed resource assessment and degree to which this is consistent with the DECC renewable capacity assessment methodology
Geographical scope Relevance to this study
and delivery implications for achieving higher carbon standards in practice which is covered in a separate report and has not been reviewed for this study.
Stoke on Trent Renewable Energy Assessment (2009)
The purpose of the report is to ascertain Stoke-on-Trent’s renewable energy generation potential, and to provide guidance on how the city can meet and exceed its share of the carbon reduction, fuel poverty and energy targets. It provides an evidence base to assist in determining which renewable energy technologies are the most effective to be integrated into the existing housing stock.
Wind (partially consistent method of calculation not detailed), biomass (fully consistent), solar thermal and solar photovoltaic (partially consistent – solar thermal is not assessed in DECC methodology), ground and air source heat pumps (partially consistent method of calculation not described).
Stoke-on Trent A dual approach in the deployment of renewable energy technologies is required to meet the council’s targets, both micro generation technologies and large scale renewable.
Micro wind, solar hot water and passive solar design are the most suitable.
Energy and climate change strategies and action plans
West Midlands Climate Change Action Plan (2007)
The action plan sets out the actions that regional organisations can and should take over the next three years. The action plan identifies six priorities:
• Plan for low carbon, well adapted sustainable communities
• Facilitate the transition to a low carbon economy
• Ensure the delivery of substantial carbon reductions and climate change adaption measures
N/A West Midlands The action plan contains detailed actions, timescales and Lead organisation against each of the six priorities.

A-4
Document Summary
Evidence of detailed resource assessment and degree to which this is consistent with the DECC renewable capacity assessment methodology
Geographical scope Relevance to this study
• Ensure that regional partners lead by example by significantly reducing carbon emissions
• Increase awareness and understanding of the implications of climate change
• Establish appropriate regional carbon reduction targets and transparent framework for monitoring progress.
West Midlands Regional Energy Strategy (2004)
The strategy aims to ensure a sustainable, secure and affordable supply of energy and strengthen the regions economy. It consists of four headline objectives and an action plan:
• Improving energy efficiency
• Increasing the use of Renewable Energy Resources
• Maximising uptake or business opportunities
• Ensuring focused and integrated delivery and implementation.
N/A West Midlands Improving energy efficiency targets against each of the four strategy objectives as well as the action plan detailing what is likely to occur will be useful.
West Midlands Climate Change State of the Region Report 2009
The report explains the challenges and opportunities that climate change may present to the built environment, natural resources (water, land use and food),
No The West Midlands Understanding of the importance of factoring climate change into planning and investment decisions and how the cost of adapting our

A-5
Document Summary
Evidence of detailed resource assessment and degree to which this is consistent with the DECC renewable capacity assessment methodology
Geographical scope Relevance to this study
transport, health, energy and waste and to business, skills and education. The report also provides practical ways of adapting to and taking advantage of these challenges and opportunities in the region.
behaviour can be minimised.
The report highlights an expected gap in waste treatment capacity by 2020 and the need for the adoption of an ‘equivalent self sufficiency’ approach for each Waste Planning Authority in the region.
It concludes that there are opportunities ahead for businesses operating in the environmental technologies sector, new drivers for innovation and to become self sufficient in energy supply as well as benefits for the regional tourism industry however challenges exist relating to the regions infrastructure in terms of the need for new infrastructure to facilitate adaption and mitigation and the ability to procure large scale infrastructure to drive low carbon development.
Biomass studies
West Midlands Biomass Resource Study (2009)
The study identifies accessible biomass resources in the West Midlands.
Energy crops – SRC and miscanthus (partially consistent – different yields have been used)
Straw, baled wheat straw only (partially consistent – DECC methodology also includes oil seed rape)
Woodland arisings (partially consistent – woodland arisings cover various resources which are treated separately in the DECC methodology, for example managed woodland and waste wood).
West Midlands – regional level assessment (not individual local authorities)
The data sources will be highly useful for this resource assessment.
If any assumptions are more applicable to the West Midlands (upon further research and consultation with relevant stakeholders) than those set out in the DECC methodology, we propose to use assumptions from this study.

A-6
Document Summary
Evidence of detailed resource assessment and degree to which this is consistent with the DECC renewable capacity assessment methodology
Geographical scope Relevance to this study
West Midlands Wood Energy Strategy
The strategy outlines key actions that need to be taken to increase the use of wood as a fuel in the West Midlands.
Expanding the market by getting the main players working together, raising awareness of wood as a fuel and increasing the installation of wood boilers were identified as important actions of the strategy.
N/A West Midlands While this document provides useful background, it does not provide any data relevant to the resource assessment.
Emissions research
West Midlands Regional Carbon Dioxide Emissions Study 2009
The study forms part of the partial revision of the WMRSS and includes the development of carbon trajectories for various housing scenarios. The aim of the study was to provide carbon dioxide emissions estimates for the business-as-usual and housing scenarios in 2026 from 365,000 to 445,600 additional houses
The study also considers the impacts of sub-regional variations in impact, and urban and rural development patterns in the context of likely transport infrastructure
No The West Midlands and its sub-regions
Contains carbon reduction targets
The study indicates that carbon emissions will decrease from the 2006 base year when projected into the future driven by fuel use and fuel efficiency.
New development is encouraged close to existing public transport links and discouraged where there is little public transport provision.
Progress towards regional and national CO2 targets is monitored against the following indicators: Greenhouse gas emissions, CO2 emissions by end user, aviation and shipping emissions, renewable electricity, electricity generation,
A-7
Document Summary
Evidence of detailed resource assessment and degree to which this is consistent with the DECC renewable capacity assessment methodology
Geographical scope Relevance to this study
household energy use, road transport, private vehicles, road freight, manufacturing sector, service sector and public sector.
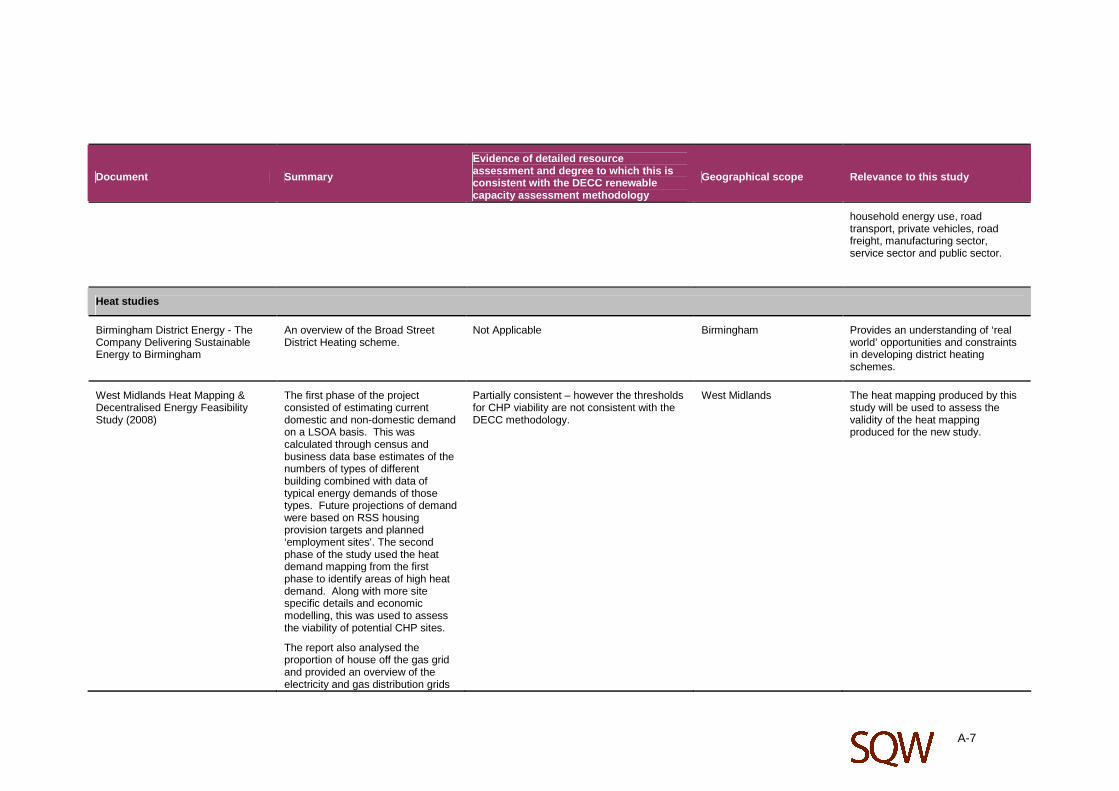
Heat studies
Birmingham District Energy - The Company Delivering Sustainable Energy to Birmingham
An overview of the Broad Street District Heating scheme.
Not Applicable Birmingham Provides an understanding of ‘real world’ opportunities and constraints in developing district heating schemes.
West Midlands Heat Mapping & Decentralised Energy Feasibility Study (2008)
The first phase of the project consisted of estimating current domestic and non-domestic demand on a LSOA basis. This was calculated through census and business data base estimates of the numbers of types of different building combined with data of typical energy demands of those types. Future projections of demand were based on RSS housing provision targets and planned ‘employment sites’. The second phase of the study used the heat demand mapping from the first phase to identify areas of high heat demand. Along with more site specific details and economic modelling, this was used to assess the viability of potential CHP sites.
The report also analysed the proportion of house off the gas grid and provided an overview of the electricity and gas distribution grids
Partially consistent – however the thresholds for CHP viability are not consistent with the DECC methodology.
West Midlands The heat mapping produced by this study will be used to assess the validity of the heat mapping produced for the new study.
A-8
Document Summary
Evidence of detailed resource assessment and degree to which this is consistent with the DECC renewable capacity assessment methodology
Geographical scope Relevance to this study
in the region
Hydropower studies
EA, Hydropower guide for developers and communities
Guidelines for developers of hydropower schemes to assist in thinking through the issues.
Hydropower assessment. Overview of guidelines and the planning process.
Very relevant as it provides an overview of planning guidance. This document will be used as a reference.
Mapping hydropower opportunities and sensitivities in the West Midlands, Environment Agency (2010)
Nationwide hydropower resource assessment.
Hydropower resource assessment divided into outputs at a regional scale. Method is generally consistent with the DECC method. Low power sites <25 kW were included in the study. Low barriers <1 m were included in the study.
Nationwide study for England and Wales. All of west midlands areas covered with no power or barrier height lower limits set for viability and inclusion of potential scheme.
Forms key background information and set of sites for subset selection as the basis of this study.
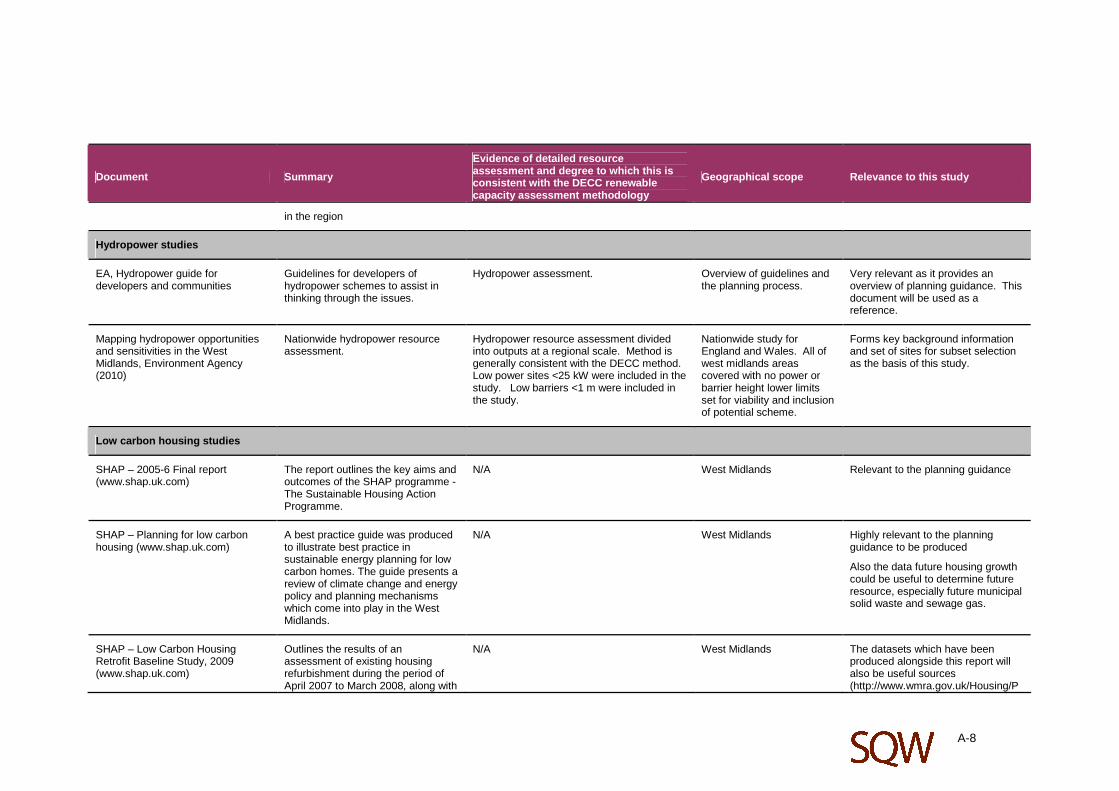
Low carbon housing studies
SHAP – 2005-6 Final report (www.shap.uk.com)
The report outlines the key aims and outcomes of the SHAP programme - The Sustainable Housing Action Programme.
N/A West Midlands Relevant to the planning guidance
SHAP – Planning for low carbon housing (www.shap.uk.com)
A best practice guide was produced to illustrate best practice in sustainable energy planning for low carbon homes. The guide presents a review of climate change and energy policy and planning mechanisms which come into play in the West Midlands.
N/A West Midlands Highly relevant to the planning guidance to be produced
Also the data future housing growth could be useful to determine future resource, especially future municipal solid waste and sewage gas.
SHAP – Low Carbon Housing Retrofit Baseline Study, 2009 (www.shap.uk.com)
Outlines the results of an assessment of existing housing refurbishment during the period of April 2007 to March 2008, along with
N/A West Midlands The datasets which have been produced alongside this report will also be useful sources (http://www.wmra.gov.uk/Housing/P

A-9
Document Summary
Evidence of detailed resource assessment and degree to which this is consistent with the DECC renewable capacity assessment methodology
Geographical scope Relevance to this study
recommendations for future refurbishment. The CO2 savings as a result of the refurbishment and the costs were detailed.
ublications_Guidance_and_Research/Low_Carbon_Housing_data_sets.aspx)
SHAP – West Midlands Framework for Low Carbon Housing Planning (www.shap.uk.com) 2008
This is a framework for reducing the climate change impact of housing in the region. The study takes a forward look at how it will achieve its vision for low carbon housing by 2016.
The key elements identified by the study that could form part of a model local framework for action include:
• LA’s providing leadership and coordination through their Sustainable Community Plans and sharing of best practice at sub-regional level
• Establishing a strong evidence base including high quality meaningful survey data
• Developing pilot house-type demonstrators in order to build a knowledge base of the ‘kit of parts’ and installers for each typology
• Supporting community engagement and outreach especially at the point properties change hands
• Novel financial mechanisms e.g. low cost finance and equity release for owner occupiers, roof space agreements and
No West Midlands Housing accounts for up to 30% of the regions CO2 emissions
Provides the context of the state of the regions current housing stock regarding energy efficiency and policies and programmes implemented to date to raise the energy efficiency of the housing stock and the requirement to meet the targets within the regional Energy Strategy e.g. a refurbishment rate of 20,000 properties per annum by 2011 rising to 80,000 properties per annum by 2016, matched by a new build replacement rate of 4,000 properties per annum.
A-10
Document Summary
Evidence of detailed resource assessment and degree to which this is consistent with the DECC renewable capacity assessment methodology
Geographical scope Relevance to this study
economies of scale achieved through enveloping works in terraced streets.
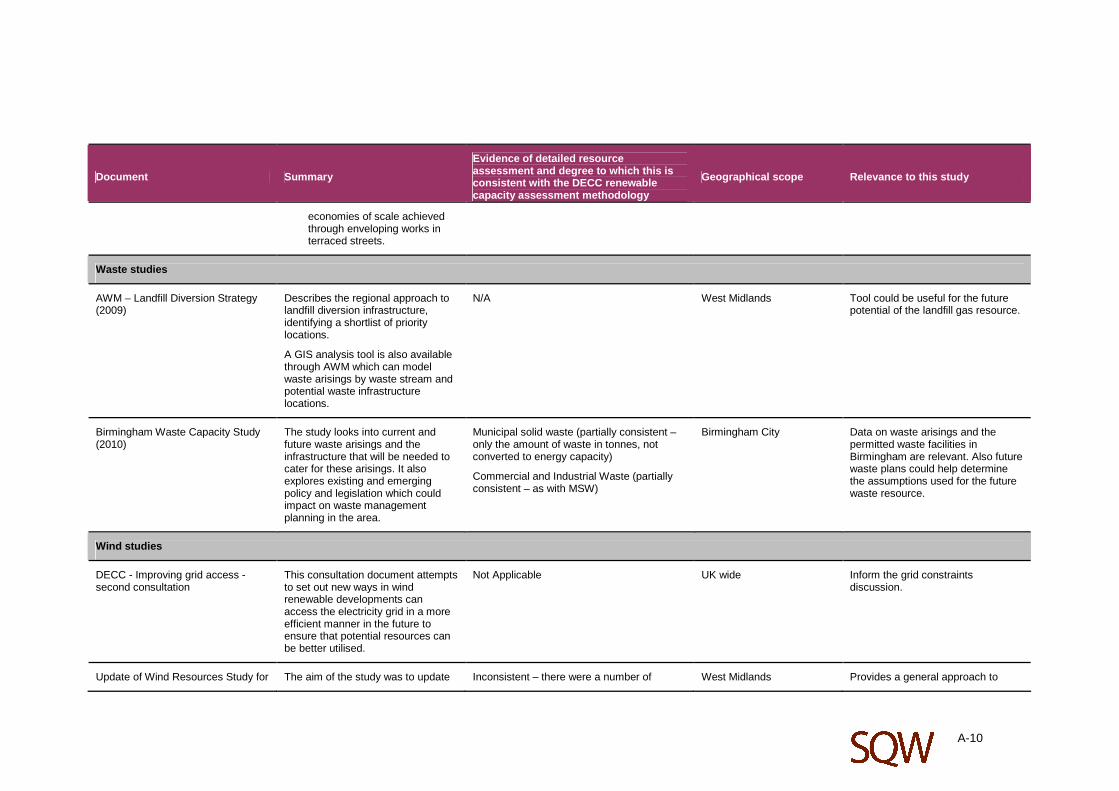
Waste studies
AWM – Landfill Diversion Strategy (2009)
Describes the regional approach to landfill diversion infrastructure, identifying a shortlist of priority locations.
A GIS analysis tool is also available through AWM which can model waste arisings by waste stream and potential waste infrastructure locations.
N/A West Midlands Tool could be useful for the future potential of the landfill gas resource.
Birmingham Waste Capacity Study (2010)
The study looks into current and future waste arisings and the infrastructure that will be needed to cater for these arisings. It also explores existing and emerging policy and legislation which could impact on waste management planning in the area.
Municipal solid waste (partially consistent – only the amount of waste in tonnes, not converted to energy capacity)
Commercial and Industrial Waste (partially consistent – as with MSW)
Birmingham City Data on waste arisings and the permitted waste facilities in Birmingham are relevant. Also future waste plans could help determine the assumptions used for the future waste resource.
Wind studies
DECC - Improving grid access - second consultation
This consultation document attempts to set out new ways in wind renewable developments can access the electricity grid in a more efficient manner in the future to ensure that potential resources can be better utilised.
Not Applicable UK wide Inform the grid constraints discussion.
Update of Wind Resources Study for The aim of the study was to update Inconsistent – there were a number of West Midlands Provides a general approach to

A-11
Document Summary
Evidence of detailed resource assessment and degree to which this is consistent with the DECC renewable capacity assessment methodology
Geographical scope Relevance to this study
the West Midlands (2008) the previous report produced in 2004 and review the economically viable wind resource available across the West Midlands region and key wind development constraints, using an updated GIS Mapping Tool.
The GIS method was similar, but not exactly the same as, the DECC methodology. There were three stages;
• Identifying areas with sufficient wind – i.e. areas above 6m/s at 45magl were deemed suitable
• High level practical resource filtering – i.e. identifying areas unsuitable for development – e.g. urban areas and AONB.
• Prioritising practical resource filtering – i.e. identifying areas with minimal on aviation and military activities constraints.
The results showed that 59% of the land in the West Midlands had sufficient wind resource, 30% of the region was estimated to have a suitable high level practical resource and a high proportion of that resource may be subject to military and aviation constraints.
inconsistencies with the DECC methodology including the wind threshold being set higher.
West Midland spatial constraints.
West Midlands Wind Energy Information Tool: Assessment of Wind Energy Resource (2004)
The report presented an assessment of the large scale wind energy resource available in the West Midlands Region for electricity generation by 2010; based on a wind energy resource tool developed
Inconsistent West Midlands Provides a general approach to West Midland spatial constraints.
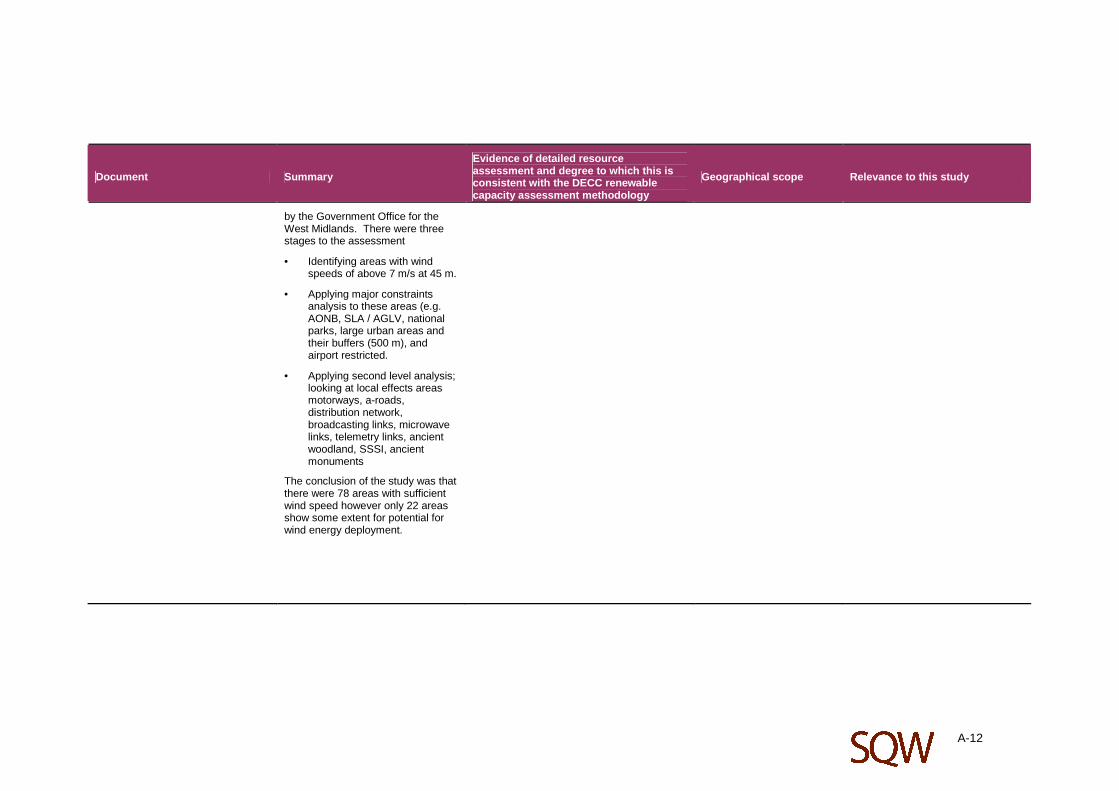
A-12
Document Summary
Evidence of detailed resource assessment and degree to which this is consistent with the DECC renewable capacity assessment methodology
Geographical scope Relevance to this study
by the Government Office for the West Midlands. There were three stages to the assessment
• Identifying areas with wind speeds of above 7 m/s at 45 m.
• Applying major constraints analysis to these areas (e.g. AONB, SLA / AGLV, national parks, large urban areas and their buffers (500 m), and airport restricted.
• Applying second level analysis; looking at local effects areas motorways, a-roads, distribution network, broadcasting links, microwave links, telemetry links, ancient woodland, SSSI, ancient monuments
The conclusion of the study was that there were 78 areas with sufficient wind speed however only 22 areas show some extent for potential for wind energy deployment.
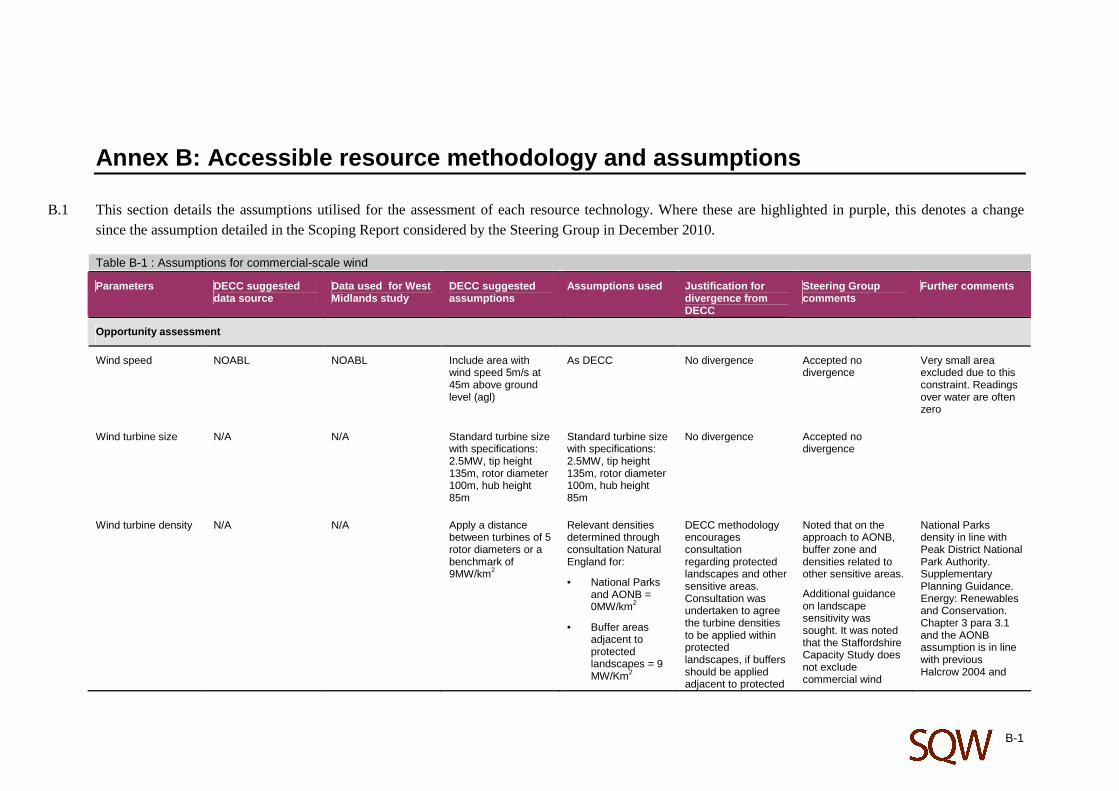
B-1
Annex B: Accessible resource methodology and assumptions
B.1 This section details the assumptions utilised for the assessment of each resource technology. Where these are highlighted in purple, this denotes a change since the assumption detailed in the Scoping Report considered by the Steering Group in December 2010.
Table B-1 : Assumptions for commercial-scale wind
Parameters DECC suggested data source
Data used for West Midlands study
DECC suggested assumptions
Assumptions used Justification for divergence from DECC
Steering Group comments
Further comments
Opportunity assessment
Wind speed NOABL NOABL Include area with wind speed 5m/s at 45m above ground level (agl)
As DECC No divergence Accepted no divergence
Very small area excluded due to this constraint. Readings over water are often zero
Wind turbine size N/A N/A Standard turbine size with specifications: 2.5MW, tip height 135m, rotor diameter 100m, hub height 85m
Standard turbine size with specifications: 2.5MW, tip height 135m, rotor diameter 100m, hub height 85m
No divergence Accepted no divergence
Wind turbine density N/A N/A Apply a distance between turbines of 5 rotor diameters or a benchmark of 9MW/km2
Relevant densities determined through consultation Natural England for:
• National Parks and AONB = 0MW/km2
• Buffer areas adjacent to protected landscapes = 9 MW/Km2
DECC methodology encourages consultation regarding protected landscapes and other sensitive areas. Consultation was undertaken to agree the turbine densities to be applied within protected landscapes, if buffers should be applied adjacent to protected
Noted that on the approach to AONB, buffer zone and densities related to other sensitive areas.
Additional guidance on landscape sensitivity was sought. It was noted that the Staffordshire Capacity Study does not exclude commercial wind
National Parks density in line with Peak District National Park Authority. Supplementary Planning Guidance. Energy: Renewables and Conservation. Chapter 3 para 3.1 and the AONB assumption is in line with previous Halcrow 2004 and

B-2
Parameters DECC suggested data source
Data used for West Midlands study
DECC suggested assumptions
Assumptions used Justification for divergence from DECC
Steering Group comments
Further comments
• Other sensitive areas (such as bird sensitive areas) = 4.5MW/ Km2
• Areas outside of all mapped exclusion areas/constraint = 9MW/km2
landscapes and if consideration should be taken of other sensitive areas (e.g. bird sensitive areas)
farms from protected landscapes although there is no presumption in their favour.
2008 assessments
No buffer zone has been recommended in line with PPS22 paragraph 14
50% deployment in high and medium sensitivity areas was agreed through consultation with RSPB for the North West RLC study.
In the West Midlands area there are no substantial areas of BAP blanket bog outside SSSIs and National Parks – therefore no peat specific deployment density is recommended.
Constraints assessment
Non accessible areas OS Strategi, MOD Exclude: roads, (A,B, motorways), railways, inland waters (rivers, canals, lakes reservoirs), airports, MOD training sites, built up areas (settlement polygons)
No divergence Noted that MOD training sites will only be applied if the information is made available during consultation.
No divergence
The OS strategi dataset used to identify areas of settlements, does not cover smaller settlements such as hamlets; however the buffers used constraint the available land around major communication

B-3
Parameters DECC suggested data source
Data used for West Midlands study
DECC suggested assumptions
Assumptions used Justification for divergence from DECC
Steering Group comments
Further comments
links should act to cover most of these.
Exclusion areas OS Strategi www.magic.gov.uk
MOD
Exclude:
• Ancient semi-natural woodland
• Sites of historic interest (with no buffer)
• 150m buffer (tip height + 10%) around roads and rail
• 600m buffer around OS Strategi settlement edges
• 5km buffer around airports
• Civic Air Traffic Control Constraints
• Mod training areas
• Explosive safeguarded areas, danger areas near ranges
No divergence Accepted no divergence
No divergence
MOD constraints Consultation with MOD
Consultation with MOD
Consultation with MOD to determine
Consultation with MOD
No divergence Accepted no divergence
MOD did not respond during the time period

B-4
Parameters DECC suggested data source
Data used for West Midlands study
DECC suggested assumptions
Assumptions used Justification for divergence from DECC
Steering Group comments
Further comments
constraints associated with the sites/estates/Air Traffic Control/radar/safeguarded areas/danger areas and MOD bylaws
of the study and therefore capacity is likely to be constrained further on this basis
Projections to 2030 and 2050
Wind speed and other variables unlikely to change significantly and therefore the capacity was assumed to remain the same.
Summary of methodology
The analysis was undertaken using GIS data. All opportunities (wind speed above the threshold) were mapped and then constraints (non-accessible and exclusion areas) collated in GIS and removed from the opportunities layer. This left a layer of ‘unconstrained’ land which was examined in terms of the density of turbines it could potentially accommodate. Consultation with Natural England and others determined the approach to protected landscapes and other sensitive areas
Source: Maslen Environmental
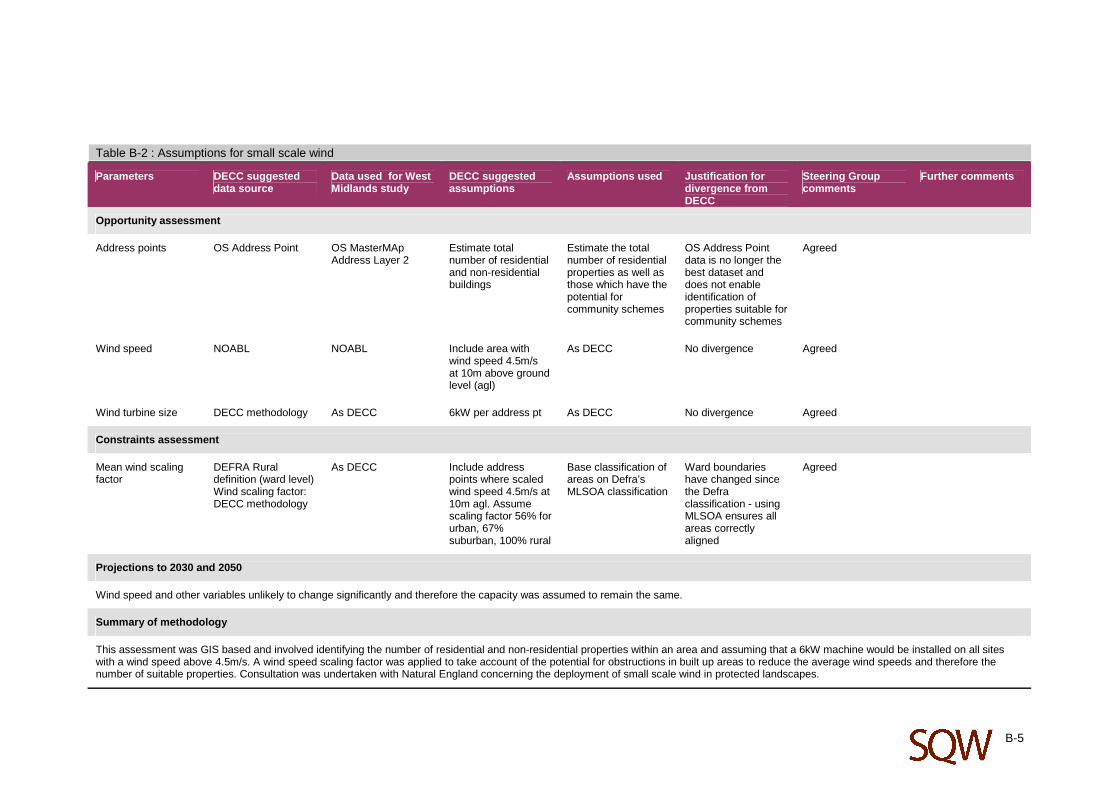
B-5
Table B-2 : Assumptions for small scale wind
Parameters DECC suggested data source
Data used for West Midlands study
DECC suggested assumptions
Assumptions used Justification for divergence from DECC
Steering Group comments
Further comments
Opportunity assessment
Address points OS Address Point OS MasterMAp Address Layer 2
Estimate total number of residential and non-residential buildings
Estimate the total number of residential properties as well as those which have the potential for community schemes
OS Address Point data is no longer the best dataset and does not enable identification of properties suitable for community schemes
Agreed
Wind speed NOABL NOABL Include area with wind speed 4.5m/s at 10m above ground level (agl)
As DECC No divergence Agreed
Wind turbine size DECC methodology As DECC 6kW per address pt As DECC No divergence Agreed
Constraints assessment
Mean wind scaling factor
DEFRA Rural definition (ward level) Wind scaling factor: DECC methodology
As DECC Include address points where scaled wind speed 4.5m/s at 10m agl. Assume scaling factor 56% for urban, 67% suburban, 100% rural
Base classification of areas on Defra’s MLSOA classification
Ward boundaries have changed since the Defra classification - using MLSOA ensures all areas correctly aligned
Agreed
Projections to 2030 and 2050
Wind speed and other variables unlikely to change significantly and therefore the capacity was assumed to remain the same.
Summary of methodology
This assessment was GIS based and involved identifying the number of residential and non-residential properties within an area and assuming that a 6kW machine would be installed on all sites with a wind speed above 4.5m/s. A wind speed scaling factor was applied to take account of the potential for obstructions in built up areas to reduce the average wind speeds and therefore the number of suitable properties. Consultation was undertaken with Natural England concerning the deployment of small scale wind in protected landscapes.

B-6
Table B-3 : Assumptions for plant biomass – managed woodland
Parameters DECC suggested data source
Data used for West Midlands study
DECC suggested assumptions
Assumptions used Justification for divergence from DECC
Steering Group comments
Further comments
Opportunity assessment
Existing and potential feedstock
FC Woodfuel Resource Tool National Inventory Woodlands and Trees
FC Woodfuel Resource Tool and National Inventory of Woodland and Trees (NIWT).
Consultation with the Forestry Commission to check if more disaggregated data is available.
To assess the volume of woodfuel in the region apply one of two options: Option 1: Use the Forestry Commission Research tool that provides data on regional woodfuel resource by different types of forestry product at a sustainable level of production. Option 2: Bring forward and increase the accuracy of the National Forest Inventory (NFI) woodfuel forecast by the Forestry Commission which is expected to be released in 2011 (for conifers) and 2012 (for broad leaves).
We followed up option 1 as option 2 is not viable within the timeframes of this study. This is because the new datasets from the Forestry Commission (the National Forest Inventory) will now not be available until 2015, upon completion of the new inventory.
A local assessment can be derived from the regional data of the FC Woodfuel Resource Tool by disaggregating to a county level based on the percentage split of woodland types stated in the NIWT dataset. The data was disaggregated further to lower tier local authority level based on land areas.
Divergence as data only available for regional level from source proposed in the DECC methodology. It is therefore necessary to refine the analysis for local level calculations.
It was queried why option 2 is not viable which is explained under proposed assumptions.
We consulted with the FC to see whether tier 2 local authority data/GIS data is available. As these were not obtained, county data was disaggregated based on percentage split of land area in each LA.
Discussions with the FC as to whether they can provide some preliminary data from the new inventory (the National Forest Inventory) were held. As newer data were unavailable, the NIWT, although from 1995-99, is the most accurate and complete existing dataset.
Fuel requirement – electricity odt/ME
DECC methodology DECC methodology 6000odt/year = 1MW 6000odt/year = 1MW Also assumption that 1 cubic metre is equivalent to 1 green
No divergence from the central assumption.
Accepted no divergence

B-7
tonne Assume a loss of 50% when converting green tones to oven dried tonnes
Fuel requirement – heat odt/MW
Biomass Energy Centre
Biomass Energy Centre
Low grade timber, and stemwood >14cm diameter and conifer stumps: 18 GJ/odt. Stemwood l<14cm diameter, branches, tips and foliage: 12.5 GJ/odt. Plant conversion efficiency: 80%. Plant availability: 80%.
Low grade timber, and stemwood >14cm diameter and conifer stumps: 18 GJ/odt. Stemwood l<14cm diameter, branches, tips and foliage: 12.5 GJ/odt. If detailed data on wood type is unavailable, use 18GJ/odt for all types. Plant conversion efficiency: 80%. Capacity factor: to be investigated (range of 20 to 45%).
Divergence on fuel requirement only if data not detailed enough to apply DECC assumptions – discussions with the FC in the NW suggested 18GJ/odt as an estimate for all managed wood. 80% availability thought to be unrealistically high – this was the expert view provided by the Peter Fox of the Forestry Commission during discussions for the North West resource capacity assessment. The 45% capacity facor figure was chosen as it was the middle CT factor (no evidence was found to suggest that the other two would be more applicable).
Requested justification for 80% availability being considered as unrealistically high – explanation provided under reasons for divergence from DECC.
The Carbon Trust guidance provides the following capacity factors (Biomass heating: a practical guide for potential users, 2009):
• 20% for general occupancy building
• 45% for service applications
• 60% for process applications
Constraints assessment
Exclusions of woodfuel potential
Forestry Commission statistics
Forestry Commission statistics and consultation with
Applied exclusions based on: • Woodfuel that is
uneconomic to
The FC Tool is able to constrain wood arisings on economic/logistical
No divergence as the DECC methodology is not specific as to the nature and extent
Accepted no divergence
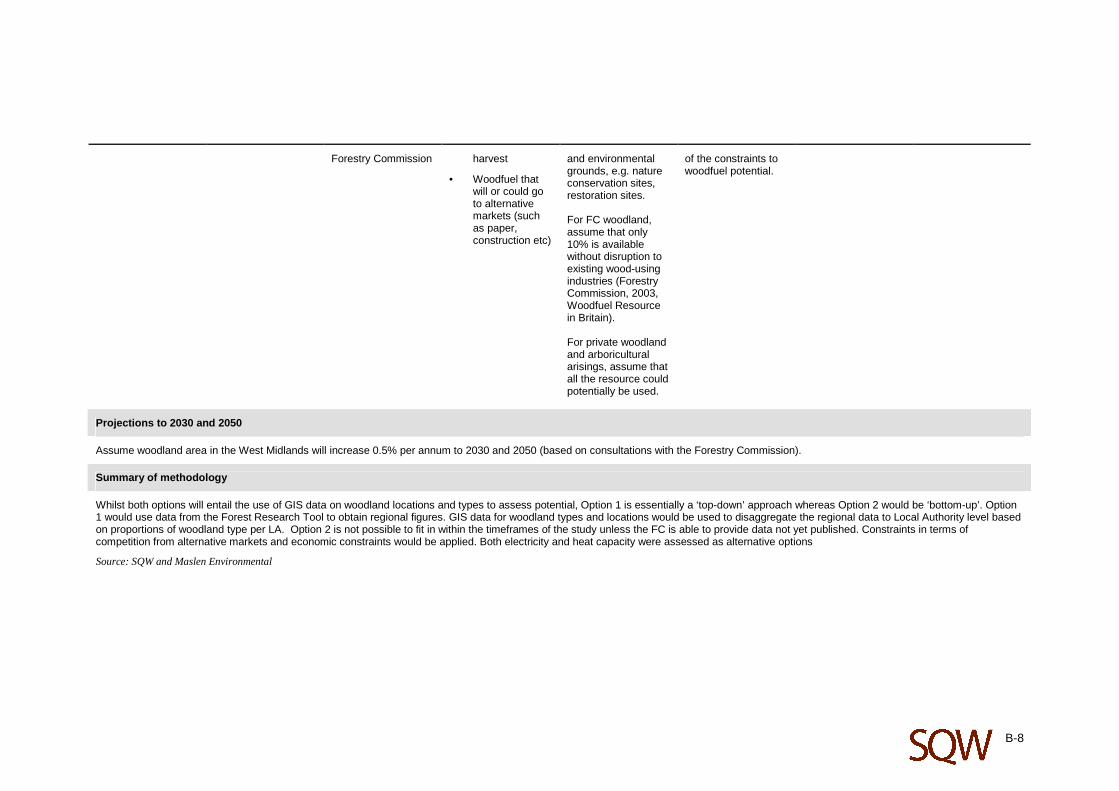
B-8
Forestry Commission harvest
• Woodfuel that will or could go to alternative markets (such as paper, construction etc)
and environmental grounds, e.g. nature conservation sites, restoration sites. For FC woodland, assume that only 10% is available without disruption to existing wood-using industries (Forestry Commission, 2003, Woodfuel Resource in Britain). For private woodland and arboricultural arisings, assume that all the resource could potentially be used.
of the constraints to woodfuel potential.
Projections to 2030 and 2050
Assume woodland area in the West Midlands will increase 0.5% per annum to 2030 and 2050 (based on consultations with the Forestry Commission).
Summary of methodology
Whilst both options will entail the use of GIS data on woodland locations and types to assess potential, Option 1 is essentially a ‘top-down’ approach whereas Option 2 would be ‘bottom-up’. Option 1 would use data from the Forest Research Tool to obtain regional figures. GIS data for woodland types and locations would be used to disaggregate the regional data to Local Authority level based on proportions of woodland type per LA. Option 2 is not possible to fit in within the timeframes of the study unless the FC is able to provide data not yet published. Constraints in terms of competition from alternative markets and economic constraints would be applied. Both electricity and heat capacity were assessed as alternative options
Source: SQW and Maslen Environmental

B-9
Table B-4 : Assumptions for plant biomass – energy crops
Parameters DECC suggested data source
Data used for West Midlands study
DECC suggested assumptions
Assumptions used Justification for divergence from DECC
Steering Group comments
Further comments
Opportunity assessment
Existing resource Existing resource Use uptake data from Woodland Grant Scheme (SRC prior to 2005) and Energy Crops Scheme (SRC and miscanthus since 2001)
National Non-Food Crops Centre
Natural England Energy Crop Scheme GIS data
Existing areas of established SRC, miscanthus and SRF
Use Natural England’s GIS data for energy crop schemes and consult NE on other schemes that need to be considered.
Accepted no divergence – data enhanced with spatial data from Natural England.
Available land (High scenario)
Available land (High scenario)
Rural Payments Agency (PRA/IACS), Defra (for agricultural land classification and Regional Energy Crop Opportunity Maps and Guidance) and Natural England
Rural Payments Agency (PRA/IACS), Defra (for agricultural land classification and Regional Energy Crop Opportunity Maps and Guidance) and Natural England
Assume that all available arable land and pasture will be planted with energy crops and refer to Defra’s Energy Crop Opportunity Maps for yield bands and benchmarks. Quantify for each energy crop category defined and where spatial overlaps occur use the energy crop with the highest yield band.
Only divergence from the DECC methodology if spatial data are not available.
Accepted no divergence providing spatial data available
Available land (Medium scenario)
As above RPA or Defra Agricultural and Horticultural Census
Assume that energy crops are planted only on land no longer needed for food production, i.e. all abandoned arable
Consulted with the RPA to determine if spatial data on abandoned land is available. If unavailable, bare and fallow land (all arable
Only divergence from the DECC methodology if spatial data are not available.
Agreed Spatial data not available – used Defra Agricultural and Horticultural Census

B-10
land and pasture. land not currently in production) from the Defra Agricultural and Horticultural Census will be used in its place.
A ratio of 9:1 is proposed for the proportion of miscanthus and SRC.
Available land (Low scenario)
As above Natural England Assume new crops will only be planted to the extent of submitted application to the Energy Crop Scheme (ECS) for 2010.
Assume new crops will only be planted to the extent of submitted application to the Energy Crop Scheme (ECS) for 2010.
No divergence, unless 2010 data is not yet available (2009 would be used in this instance instead)
Accepted no divergence
Yield No data required No data required Apply the following biomass yields: • 10 odt/ha –
short rotation coppice (SRC)
• 15 odt/ha – miscanthus
Increase these yields by 10% for 2020.
Apply the following biomass yields: • 10 odt/ha –
short rotation coppice (SRC)
• 15 odt/ha – miscanthus
Increase these yields by 10% for 2020.
No divergence Queried why 10% yield is being reviewed. This is because the DECC methodology was concerned with capacity assessments in 2020, and this study is looking to 2030.
Considered 10% increase in yield also appropriate for the resource assessment in 2030. The increase in yield was recommended by the DECC methodology for 2020
Fuel requirement (electricity)
No data required No data required Apply a benchmark of 6,000 odt/year per 1 MW for electricity to convert the amount of total biomass feedstock to installed capacity.
Apply a benchmark of 6,000 odt/year per 1 MW for electricity to convert the amount of total biomass feedstock to installed capacity.
No divergence Accepted no divergence
Fuel requirement (heat)
No data required Natural England and DECC Digest of UK Energy Statistics
Apply standard calorific values of woodfuel categories: 12.5 GJ/odt (for
Miscanthus: 17GJ/odt; SRC: 18.6GJ/odt
Calorific values for energy crops based on benchmarks in Natural England:
View that 80% availability is excessive was queried and
The Carbon Trust guidance provides the following capacity factors (Biomass

B-11
woodchip); 17 GJ/odt (for wood pellets); 13 GJ/odt (for baled miscanthus).
For all fuel categories, apply plant conversion efficiency of 80% and plant availability of 80%.
Plant conversion efficiency: 80%. Capacity factor: to be investigated (range of 20 to 45%).
Planting and Growing miscanthus Best Practice Guidelines July 2007 and DUKES Annex A.
80% availability thought to be unrealistically high – (this was the expert view provided by the Peter Fox of the Forestry Commission during discussions for the North West resource capacity assessment. We will investigate which capacity factor is most appropriate for the likely biomass heating systems to be installed in the West Midlands.
justification provided heating: a practical guide for potential users, 2009):
• 20% for general occupancy building
• 45% for service applications
60% for process applications
Constraints
Exclusion areas Multi Agency ‘MAGIC’ database
MAGIC and IACS databases, Natural England, English Heritage
Exclude from the assessment the following areas: • Permanent
pasture/ grassland
• Public rights of way (PRoW)
• PRoW buffer – 3m (Miscanthus), 5m (SRC)
• Common land
• SPS Cross
Exclude areas specified by DECC methodology including public rights of way according to statutory requirements apart from PRoW buffer.
For SPS Cross compliance buffers alongside field boundaries, reduce area by percentage based on average field size to account for these exclusion
No data are available on PRoW buffers. For SPS Cross compliance buffers, percentage was based on the average field size in the IACS database.
Suggested that assessment should use statutory requirements for public rights of way – addressed under proposed assumptions
B-12
compliance buffers alongside field boundaries
• Nature conservation and historic designations
areas.
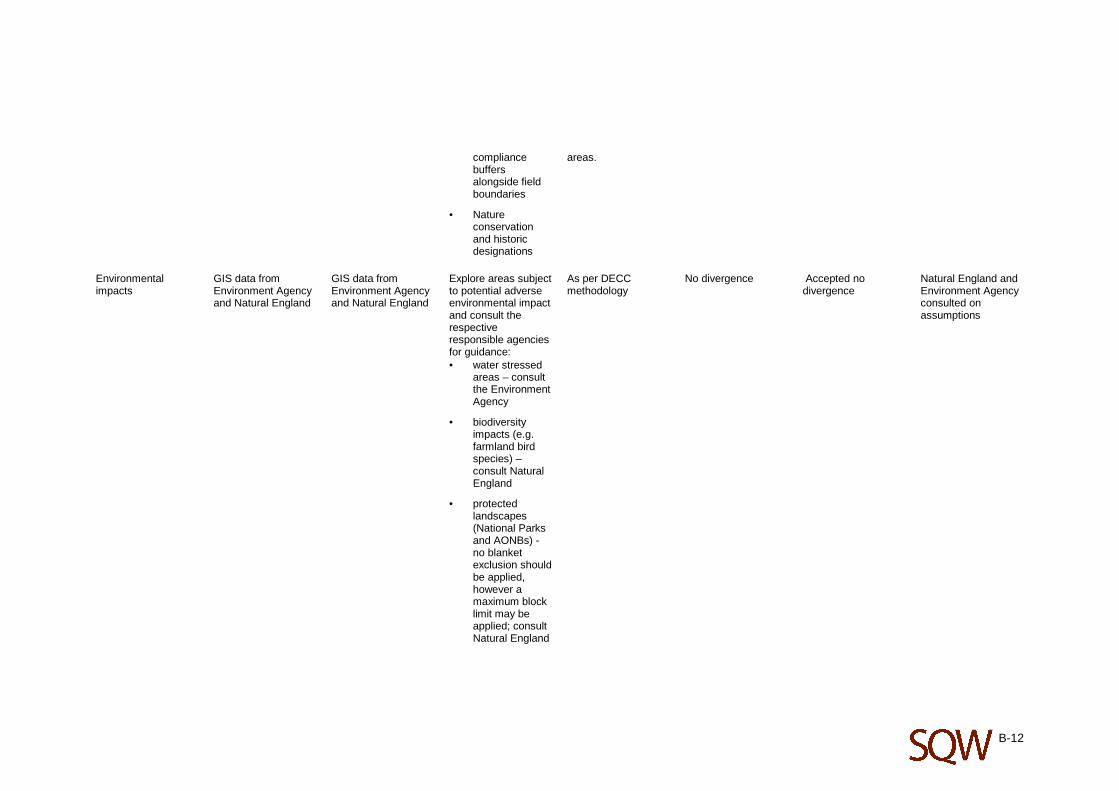
Environmental impacts
GIS data from Environment Agency and Natural England
GIS data from Environment Agency and Natural England
Explore areas subject to potential adverse environmental impact and consult the respective responsible agencies for guidance: • water stressed
areas – consult the Environment Agency
• biodiversity impacts (e.g. farmland bird species) – consult Natural England
• protected landscapes (National Parks and AONBs) - no blanket exclusion should be applied, however a maximum block limit may be applied; consult Natural England
As per DECC methodology
No divergence Accepted no divergence
Natural England and Environment Agency consulted on assumptions

B-13
Projections to 2030 and 2050
The DECC methodology states that yields from energy crops could increase by 10% to 2020, this assumption has also been used as an indication of capacity available to 2030. The medium scenario projections to 2050 are much more difficult to determine, fluctuations are expected, but cannot be accurately predicted, as this scenario is based on ‘land not in food production’ being made available for energy crop production. Changes to this scenario (up to 2050) are very much dependent on agro-economic and climate change factors amongst others. Therefore no predictions of potential capacity to 2050 have been made.
Summary of proposed methodology
The DECC methodology requires the generation of estimates for heat and electricity from biomass energy crops under three scenarios - high, medium and low as follows:
• High – Assumes that all available arable land and pasture will be planted with energy crops
• Medium – Assumes that all abandoned land and pasture will be planted with energy crops
• Low – Assumes that new crops will only be planted to the extent of submitted applications to the Energy Crop Scheme.
The high scenario, as defined in the DECC methodology, is acknowledged to be neither possible nor desirable due to other uses of the land that are not considered within the assessment (such as food production). This scenario is entirely theoretical. The medium scenario was used, but the assessment was also undertaken for the low scenario – results are provided in Annex F
GIS data was used to make the analysis as spatially relevant as possible. The approach to protected landscapes was discussed with Natural England.
Both electricity and heat capacity were assessed as alternative options
Source: SQW

B-14
Table B-5 :Assumptions for plant biomass – waste wood
Parameters DECC suggested data source
Data used for West Midlands study
DECC suggested assumptions
Assumptions used Justification for divergence from DECC
Steering Group comments
Further comments
Opportunity assessment
Existing and potential feedstock
Forestry Commission/WRAP
WRAP (2009) Wood Waste Market in the UK Housing allocations data
For sawmill waste: regional level assessment of sawmill throughput For construction wood waste: use regional data and disaggregate on the basis of new housing allocations employee numbers in each local authority. For future additional feedstock: increase existing feedstock by 1% per year
All wood waste used except for MSW which was assessed separately Regional waste was disaggregated to local authority level based on employee numbers in each area. Future additional feedstock as per DECC methodology
Used WRAP report because it is considered to be more reliable than DECC data and sawmill report is no longer published by the Forestry Commission. DECC methodology details steps to arrive at a regional assessment. Refinement of the analysis was required for the local authority level assessment.
This has been changed from the suggestion to use housing allocations to using projected employee numbers because waste wood is from industry, not municipal waste wood which is already covered in MSW. This will align waste wood with the methodology for C&I.
It was suggested that the WRAP report may not contain the best data for sawmill waste – this was checked with FC/WRAP and it was agreed that this was still the most appropriate data source.
Fuel requirements (electricity)
Biomass Energy Centre
Biomass Energy Centre
For electricity: use benchmark of 6,000 odt/year per 1MW
For electricity: used benchmark of 6,000 odt/year per 1MW
No divergence Accepted no divergence
Fuel requirements (heat)
Biomass Energy Centre
Biomass Energy Centre
Apply standard calorific values
12.5GJ/odt and assumed that wood is of poorer odt quality
Plant conversion efficiency: 80%. Capacity factor:
Calorific value for heat introduced as not specified in the DECC methodology – this has been supplied by the Biomass Energy
Agreed The Carbon Trust guidance provides the following capacity factors (Biomass heating: a practical guide for potential users, 2009):

B-15
45% Centre
80% availability thought to be unrealistically high – this was the expert view provided by the Peter Fox of the Forestry Commission during discussions for the North West resource capacity assessment. We will investigate which capacity factor is most appropriate for the likely biomass heating systems to be installed in the West Midlands.
• 20% for general occupancy building
• 45% for service applications
• 60% for process applications
Constraints assessment
Available feedstock No data required No data required Assume 50% of resource is available
Assume 50% of resource is available
Agreed
Projections to 2030 and 2050
For future additional feedstock it was assumed that existing feedstock should be increased by 1% per year as recommended by the DECC methodology
Summary of proposed methodology
The proposed method identified the amount of sawmill and construction wood waste in the region. Both electricity and heat capacity were assessed as alternative options. Sub-regional arisings data was disaggregated on the basis of number of employees in each local authority in the West Midlands. An assumption that only 50% of this resource will be available for biomass due to competing demands was applied.
Source: SQW

B-16
Table B-6 : Assumptions for plant biomass – agricultural arisings (straw)
Parameters DECC suggested data source
Data used for West Midlands study
DECC suggested assumptions
Assumptions used Justification for divergence from DECC
Steering Group comments
Further comments
Opportunity assessment
Existing and potential feedstock
Defra Agricultural and Horticultural Survey – England
Defra (2010) June Census of Agriculture and Horticulture – England
Use data of existing feedstock of all wheat and oil seed rape straw only
Used data of existing feedstock of all wheat and oil seed rape straw only
Assumed 3.5 tonnes per ha of wheat and 1.5 tonnes per ha of oil seed rape
Assumptions relating to tonnage of wheat and oil seed rape are from the Biomass Energy Centre as DECC does not give guidance on these parameters
Agreed As local authority results were only available for 2007 and not 2009 (county data), the local authority results were therefore estimated using 2007 distribution prorated
Assumed area for the cultivation of straw in the West Midlands remains unchanged in 2030 and 2050
Fuel requirement N/A N/A Apply benchmark of 6,000 odt of baled straw per 1MW capacity
Applied benchmark of 6,000 odt of baled straw per 1MW capacity
No divergence Accepted no divergence
Constraints assessment
Available feedstock Defra Agricultural and Horticultural Survey – England
Defra (2010) June Census of Agriculture and Horticulture – England
Apply 1.5 tonnes of straw per annum per head of cattle in the region
From the total amount of straw produced in each area, subtract either the total animal bedding requirement or 50% of the total amount of straw, whichever is less.
Applied 1.5 tonnes of straw per annum per head of cattle in the region and subtracted either the total animal bedding requirement or 50% of the total amount of straw, whichever is less
No divergence unless evidence is found that animal bedding requirement is more extensive in the WM than elsewhere
Noted that in the West Midlands wheat straw is a particularly valuable resource for animal bedding. It is often imported from the East of England to meet demand. This may have implications for the amount available for biomass.
There may be particular reasons for proposing a divergence in the DECC methodology for competing uses for straw. Wheat straw is a particularly valuable resource for animal bedding in the West Midlands and often needs to be imported from elsewhere. This will

B-17
Parameters DECC suggested data source
Data used for West Midlands study
DECC suggested assumptions
Assumptions used Justification for divergence from DECC
Steering Group comments
Further comments
require further investigation.
Projections to 2030 and 2050
Assumed area for the cultivation of straw in the West Midlands remains unchanged in 2030 and 2050
Summary of proposed methodology
The assessment methodology involved identifying the amount of wheat & oilseed rape straw available from the Agricultural and Horticultural Census. A reduction in the quantity of feedstock available was applied to take account of the demand for straw for cattle bedding. It is important to note that there is substantial variation in the range of gas from different feedstocks and the recoverable gas from different technologies.
Source: SQW

B-18
Table B-7 : Assumptions for animal biomass – wet organic waste
Parameters DECC suggested data source
Data used for West Midlands study
DECC suggested assumptions
Assumptions used Justification for divergence from DECC
Steering Group comments
Further comments
Opportunity assessment
Existing and potential feedstock
ADAS Manure Management Database, Defra Agricultural and Horticultural Survey – England and Food and Drink Federation
For livestock data: Defra (2010) June Census of Agriculture and Horticulture – England
For manure factor: Biomass Energy Centre
For food and drink waste: ADAS (2009) National Study into Commercial and Industrial Waste Arisings
For manure and slurry: use data on number of livestock multiplied by a manure factor
For food and drink waste: use data from Defra and food and drink federation
For manure and slurry: used data on livestock numbers multiplied by a manure factor
For food and drink waste: used data for food (the food, drink and tobacco and retail and wholesale sectors, animal and vegetable and non-metallic waste only) from ADAS (2009) National Study into Commercial and Industrial Waste Arisings. This gave data to county/unitary authority level – disaggregated to local authority level based on employees in each local authority.
For food and drink waste, the ADAS study is the most up to date and complete data source. DECC also only specifies a methodology for the assessment at a regional level.
Amended post Steering Group review of approach
As local authority results for animal numbers were only available for 2007 and not 2009, the local authority results were therefore estimated using 2007 distribution prorated.
Change from initial draft to base disaggregation to local authority level on the number of employees in each local authority rather than housing allocations because of the industrial nature of the data.
Biogas yield UK National Non-Food Crops Centre (NNFCC)
UK National Non-Food Crops Centre (NNFCC)
Assume biogas yields of 25m3/t for cattle, 26m3/t for pigs and 46m3/t for food and drink
Assumed biogas yields of 25m3/t for cattle, 26m3/t for pigs and 46m3/t for food and drink
No divergence Accepted no divergence
Feedstock requirements
N/A N/A Apply benchmark of 37,000 tonnes of wet organic waste
Applied benchmark of 37,000 tonnes of wet organic waste
No divergence Accepted no divergence

B-19
required per 1MW capacity per year
required per 1MW capacity per year
Constraints assessment
Limits to extraction N/A N/A
Assume 80% of the resources can be collected
Assumed 80% of the resources could be collected
No divergence
Competing uses
N/A N/A
For manure and slurry: assume 100% of total resource is available for energy
For food and drink: assume 50% of total resources is available for energy
For manure and slurry: assumed 100% of total resource was available for energy
For food and drink: assumed 50% of total resources was available for energy
No divergence
Noted that in practical terms usable manures will in the first instance be likely to come from indoor pigs, poultry and dairy cattle. Overwintering of beef cattle on wheat straw may be another source, but is often valued as a fertiliser and soil conditioner. This may of course be more valuable after anaerobic digestion.
Projections to 2030 and 2050
Assumed animal numbers in the West Midlands remain unchanged in 2030 and 2050. Food and drink waste in 2030 and 2050 was increased by 0.5% per annum based on a UK benchmark for increases to employee numbers.
Summary of proposed methodology
The assessment methodology used data on the number of livestock (cattle and pigs) multiplied by a manure facture (i.e. amount of manure per head per year); for food and drink waste the methodology used data on the animal and vegetable and non-metallic waste fraction of the total food, drink and tobacco and retail and wholesale sectors wastes.
The methodology applied a benchmark of 37,000 tonnes of wet organic waste required per 1 MW capacity per year.

B-20
Table B-8 : Assumptions for animal biomass - poultry
Parameters DECC suggested data source
Data used for West Midlands study
DECC suggested assumptions
Assumptions used Justification for divergence from DECC
Steering Group comments
Further comments
Opportunity assessment
Existing and potential new feedstock
Defra Agricultural and Horticultural Survey – England
Defra (2010) June Census of Agriculture and Horticulture – England
Use data on poultry numbers and excreta factor per head of poultry
Only include broiler birds to calculate poultry numbers
Used data on poultry numbers and excreta factor per head of poultry
Assumed that per 1,000 broiler birds, 16.5 tonnes of litter is typically produced per annum (Biomass Energy Centre)
No divergence Accepted no divergence
As local authority results were only available for 2007 and not 2009, the local authority results were therefore estimated using 2007 distribution prorated.
Feedstock requirements
N/A N/A Apply benchmark of 11,000 tonnes of poultry litter required for 1MW capacity per annum
Apply benchmark of 11,000 tonnes of poultry litter required for 1MW capacity per annum
No divergence Accepted no divergence
Constraints assessment
Available feedstock N/A N/A Assume 100% of the resource is available for energy
Assumed 100% of the resource is available for energy
No divergence In practical terms there could be location issues as some of the main production areas in Herefordshire and Shropshire could be off gas grid and remote from good electric grid connections. There are also issues around AONB location of chicken sheds which could

B-21
Parameters DECC suggested data source
Data used for West Midlands study
DECC suggested assumptions
Assumptions used Justification for divergence from DECC
Steering Group comments
Further comments
pose a practical constraint.
Projections to 2030 and 2050
Assumed poultry numbers in the West Midlands remain unchanged in 2030 and 2050.
Summary of proposed methodology
The assessment methodology used data on poultry numbers and excreta factor for head of poultry (from Defra) to calculate the total resource produced per year. Assumptions on litter were taken from Biomass Energy Centre.
The methodology applied a benchmark of 11,000 tonnes of poultry litter required for 1MW capacity per annum.
Source: SQW
B-22
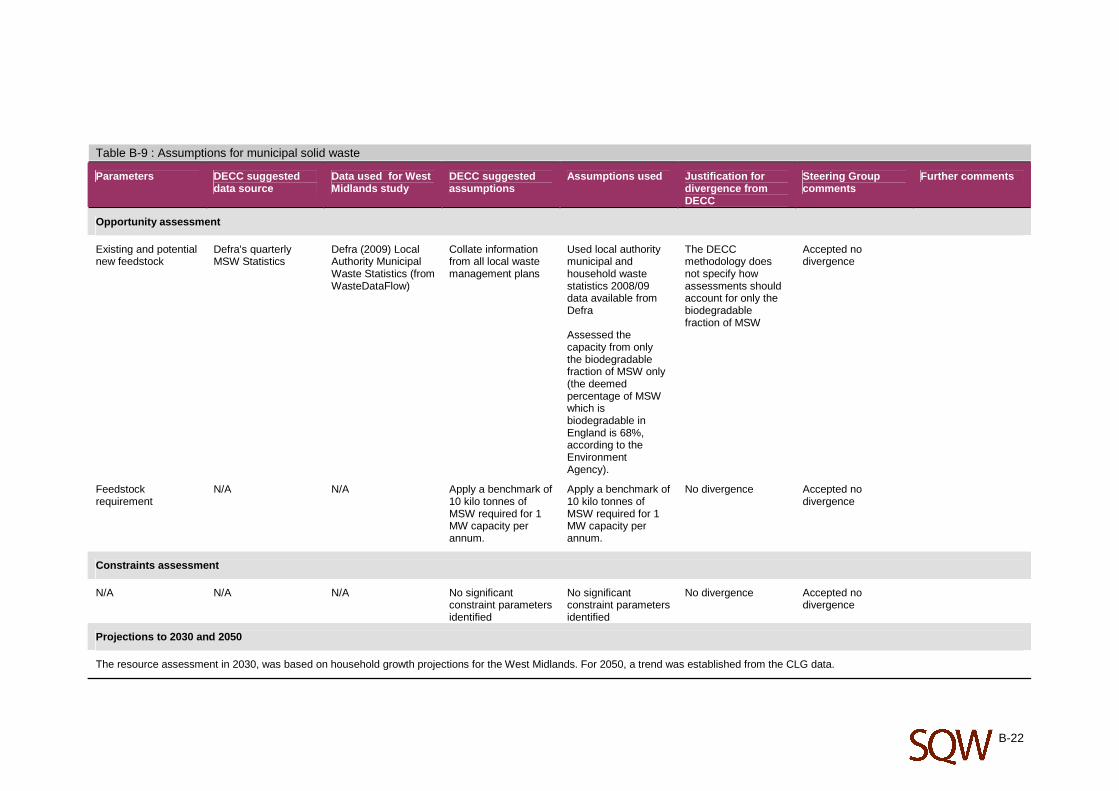
Table B-9 : Assumptions for municipal solid waste
Parameters DECC suggested data source
Data used for West Midlands study
DECC suggested assumptions
Assumptions used Justification for divergence from DECC
Steering Group comments
Further comments
Opportunity assessment
Existing and potential new feedstock
Defra's quarterly MSW Statistics
Defra (2009) Local Authority Municipal Waste Statistics (from WasteDataFlow)
Collate information from all local waste management plans
Used local authority municipal and household waste statistics 2008/09 data available from Defra Assessed the capacity from only the biodegradable fraction of MSW only (the deemed percentage of MSW which is biodegradable in England is 68%, according to the Environment Agency).
The DECC methodology does not specify how assessments should account for only the biodegradable fraction of MSW
Accepted no divergence
Feedstock requirement
N/A N/A Apply a benchmark of 10 kilo tonnes of MSW required for 1 MW capacity per annum.
Apply a benchmark of 10 kilo tonnes of MSW required for 1 MW capacity per annum.
No divergence Accepted no divergence
Constraints assessment
N/A N/A N/A No significant constraint parameters identified
No significant constraint parameters identified
No divergence Accepted no divergence
Projections to 2030 and 2050
The resource assessment in 2030, was based on household growth projections for the West Midlands. For 2050, a trend was established from the CLG data.
B-23
Parameters DECC suggested data source
Data used for West Midlands study
DECC suggested assumptions
Assumptions used Justification for divergence from DECC
Steering Group comments
Further comments
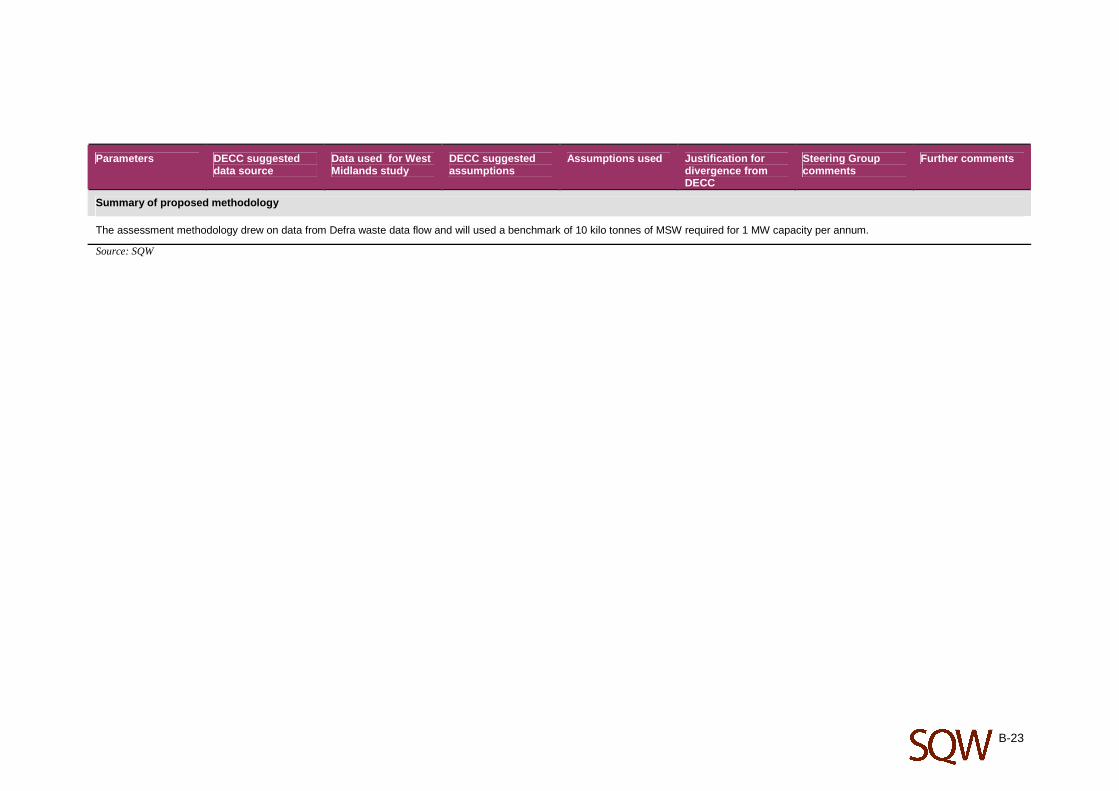
Summary of proposed methodology
The assessment methodology drew on data from Defra waste data flow and will used a benchmark of 10 kilo tonnes of MSW required for 1 MW capacity per annum.
Source: SQW
B-24
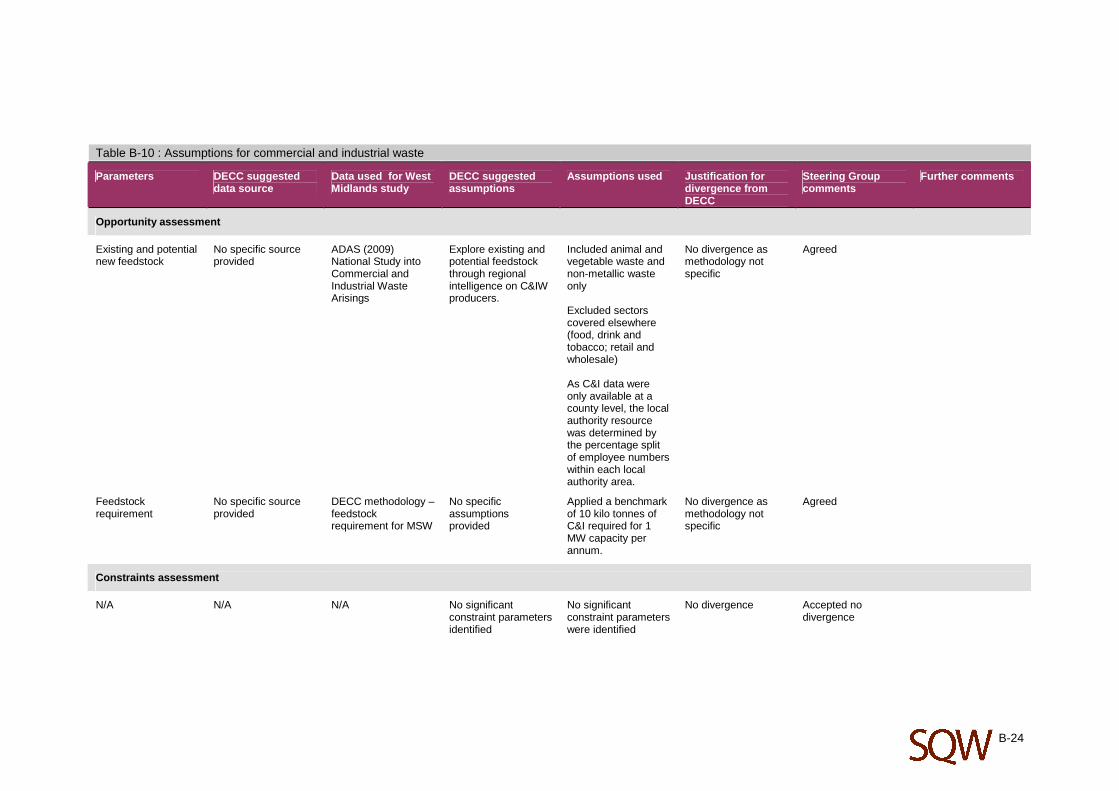
Table B-10 : Assumptions for commercial and industrial waste
Parameters DECC suggested data source
Data used for West Midlands study
DECC suggested assumptions
Assumptions used Justification for divergence from DECC
Steering Group comments
Further comments
Opportunity assessment
Existing and potential new feedstock
No specific source provided
ADAS (2009) National Study into Commercial and Industrial Waste Arisings
Explore existing and potential feedstock through regional intelligence on C&IW producers.
Included animal and vegetable waste and non-metallic waste only Excluded sectors covered elsewhere (food, drink and tobacco; retail and wholesale) As C&I data were only available at a county level, the local authority resource was determined by the percentage split of employee numbers within each local authority area.
No divergence as methodology not specific
Agreed
Feedstock requirement
No specific source provided
DECC methodology – feedstock requirement for MSW
No specific assumptions provided
Applied a benchmark of 10 kilo tonnes of C&I required for 1 MW capacity per annum.
No divergence as methodology not specific
Agreed
Constraints assessment
N/A N/A N/A No significant constraint parameters identified
No significant constraint parameters were identified
No divergence Accepted no divergence

B-25
Parameters DECC suggested data source
Data used for West Midlands study
DECC suggested assumptions
Assumptions used Justification for divergence from DECC
Steering Group comments
Further comments
Projections to 2030 and 2050
The resource assessment in 2030 and 2050, was based on employee number growth using a UK-wide benchmark of 0.5% per annum.
Summary of proposed methodology
The assessment methodology drew on data from the ADAS (2009) National Study into Commercial and Industrial Waste Arisings.
The methodology applied of 10 kilo tonnes required for 1 MW capacity per annum
Source: SQW

B-26
Table B-11 : Assumptions for Biogas – landfill gas
Parameters DECC suggested data source
Data used for West Midlands study
DECC suggested assumptions
Assumptions used Justification for divergence from DECC
Steering Group comments
Further comments
Opportunity assessment
Available resource Environment Agency's Waste Management Licence Data OFGEM RO Register
OFGEM RO Register Refer to the inventory of landfill sites and their size and capacity to calculate total available biogas resource.
All current landfill sites in the West Midlands from the OFGEM RO register
No divergence Accepted no divergence
Lifetime of resource As above BERR landfill gas production forecast study
Refer to the inventory of landfill sites and their age
Assumed that the present day capacity will continue flat for five years to 2015, then straight line reduction until the capacity in 2030 is 20% of today's capacity
Age of current landfill sites does not account for potential for new sites by 2030, if old are reaching the end of their current life. Instead, landfill gas production forecasts will be used, available from BERR.
Agreed
Constraints assessment
N/A N/A N/A No significant constraint parameters identified
No significant constraint parameters identified
No divergence Accepted no divergence
Projections to 2030 and 2050
Assumed that the present day capacity will continue flat for five years to 2015, then straight line reduction until the capacity in 2030 is 20% of today's capacity, no capacity in 2050.
Summary of proposed methodology
The assessment methodology referred to the inventory of landfill sites and their size and capacity to calculate total available biogas resource.
B-27
Parameters DECC suggested data source
Data used for West Midlands study
DECC suggested assumptions
Assumptions used Justification for divergence from DECC
Steering Group comments
Further comments
Relevant data was also sourced from the BERR landfill gas production forecast study to forecast landfill gas potential.
Source: SQW

B-28
Table B-12 : Assumptions for Biogas – sewage gas
Parameters DECC suggested data source
Data used for West Midlands study
DECC suggested assumptions
Assumptions used Justification for divergence from DECC
Steering Group comments
Further comments
Opportunity assessment
Available resource Water utilities OFGEM RO Register Refer to the inventory of sewage treatment sites and their size and capacity to calculate total available resource.
All ‘live’ sewage gas sites in the West Midlands local authorities from the OFGEM RO register
No divergence Accepted no divergence
Potential and new resource
Water utilities OFGEM RO Register
ONS population projections
Refer to water utility business plans and forecasts
Assumed a 50% increase in capacity from 2010 to 2030 based on more efficient technology and smaller units becoming more economically viable, hence being able to be deployed at smaller treatment works
Assumption of an increase in capacity is based on more efficient technology and smaller units becoming more economically viable, hence being able to be deployed at smaller treatment works
Agreed The resource assessment in 2030, was based on population growth projections for the West Midlands. For 2050, a trend was established from ONS data which forecasts to 2033.
Constraints assessment
N/A N/A N/A No significant constraint parameters identified
No significant constraint parameters were identified
No divergence Accepted no divergence
Projections to 2030 and 2050
Assumed a 50% increase in capacity from 2010 to 2030 based on more efficient technology and smaller units becoming more economically viable, hence being able to be deployed at smaller treatment works
Summary of proposed methodology
The assessment methodology drew on data from the inventory of sewage treatment sites, their size and capacity to calculate total available resource.

B-29
Parameters DECC suggested data source
Data used for West Midlands study
DECC suggested assumptions
Assumptions used Justification for divergence from DECC
Steering Group comments
Further comments
An increase in capacity based on more efficient technology and smaller units was applied, along with an increase due to population growth.
Source: SQW

B-30
Table B-13 : Assumptions for co-firing
Parameters DECC suggested data source
Data used for West Midlands study
DECC suggested assumptions
Assumptions used Justification for divergence from DECC
Steering Group comments
Further comments
Opportunity assessment
Available resource DUKES inventory of coal and oil-fired plants
DECC Digest of UK Energy Statistics 2010 edition (DUKES) and Ofgem, Renewables & CHP Register (to cross-check results)
Estimate total coal and oil-fired plant capacity (MW) in 2015 (taking into account plants that are scheduled for closure as a result of the Large Combustion Plant Directive)
Estimated total coal and oil-fired plant capacity in 2011 and 2030 (taking into account plants that are scheduled for closure as a result of the Large Combustion Plant Directive and the Industrial Emissions Directive, depending on data availability)
Change in policy (new directive) accounts for update to methodology proposed by DECC.
Agreed While co-firing involves the burning of biomass, it is not covered in the other biomass resource assessments because a significant part of the biomass comes from imports.
Potential and new resource
N/A N/A Apply a benchmark of 10% of combusted fuel to be from biomass
Applied a benchmark of 10% of combusted fuel to be from biomass
No divergence Accepted no divergence
Constraints assessment
Policy framework N/A N/A Assume that co-firing of biomass will be an attractive option until at least 2027 (financial incentives through the Renewables Obligation will continue until 2027).
Assumed that co-firing of biomass will still be in place in 2030 (RO has been extended to 2037 for new projects)
Change in policy accounts for update to methodology proposed by DECC.
Agreed

B-31
Parameters DECC suggested data source
Data used for West Midlands study
DECC suggested assumptions
Assumptions used Justification for divergence from DECC
Steering Group comments
Further comments
Projections to 2030 and 2050
Estimated total coal and oil-fired plant capacity in 2011 and 2030 (taking into account plants that are scheduled for closure as a result of the Large Combustion Plant Directive and the Industrial Emissions Directive, depending on data availability).
Assumed that co-firing of biomass will still be in place in 2030 (RO has been extended to 2037 for new projects), but not in 2050.
Summary of proposed methodology
The assessment methodology drew on data from DECC on the capacity of coal and oil-fired power stations and applied a benchmark of 10% of combusted fuel to be from biomass.
An increase in capacity based on more efficient technology and smaller units was applied.
Source: SQW

B-32
Table B-14 : Assumptions for hydropower
Parameters DECC suggested data source
Data used for West Midlands study
DECC suggested assumptions
Assumptions used Justification for divergence from DECC
Steering Group comments
Further comments
Opportunity assessment
Hydropower opportunities
Mapping Hydropower opportunities in England and Wales (2009)
GIS data barriers from EA study Mapping Hydropower opportunities
Agreed
Site selection - infrastructure
ETSU or Joule study GIS data barriers from EA study Mapping Hydropower opportunities
Select sites where there are existing barriers only.
Select sites where there are existing barriers only. Exclude canal lock barriers.
Canal locks unlikely to be suitable for development owing to conflict of interest and low flows.
Agreed
Site selection - capacity
- GIS data barriers from EA study Mapping Hydropower opportunities
No lower limit on power
Power limit imposed. Sites greater than 50 kW only chosen.
Need to limit the number of sites to those that can be assessed within the timescale of the project – approx 30 sites.
Agreed
Site selection - head values
ETSU study rejected sites
GIS data barriers from EA study Mapping Hydropower opportunities
Head values of greater than 1m only likely to be economically viable.
Four sites included: two on Severn and two Teme with heads lower than 1m.
Higher power sites greater than 50 kW.
Agreed
Head values ETSU study LIDAR and river model data.
ETSU head values valid.
Use river models in preference and LIDAR data to obtain head information. Reject SAR data.
More accurate information available. SAR data is too inaccurate for low head study.
Agreed
Plant efficiency ETSU study Turbine supplier efficiency curves.
80% plant efficiency Develop typical flow- efficiency curves for turbines
Agreed
Power estimation ETSU study Flow duration curves Mean flow used for Develop regionalised FDC will give better Agreed

B-33
Parameters DECC suggested data source
Data used for West Midlands study
DECC suggested assumptions
Assumptions used Justification for divergence from DECC
Steering Group comments
Further comments
from gauging sites. power calculation flow duration curve for each site.
indication of range of power and energy available.
Head loss Joule Study Joule study 0.2 m headloss is typical loss in low head schemes.
0.2 m headloss - Agreed
Projections to 2030 and 2050
No future predictions are made on changes to the potential small hydropower capacity by 2030 or 2050. It is unlikely that up to 2050 the Environment Agency would allow significantly more barriers to be built across rivers, as this runs contrary to many of their aims. This means that the potential capacity is unlikely to increase. However, it may decrease, if the Environment Agency achieves a number of its aims, under the individual River Basin Management Plans, to remove barriers which have a negative impact on fish passage1. Climate change could also have an impact on the available resource, by changing the flow duration curves at a site (i.e. the pattern of flow rates through a river).
Summary of methodology
Analysis of approximately 30 sites.
A regionalised FDC method adopted for the transfer of data from gauged to ungauged sites.
Head data from river models/LIDAR.
Flow-head relationships will be obtained from the hydraulic models where these are available. For other sites on the tributaries of the Severn typical flow-head curves will be extracted from the models and applied to the unmodelled sites.
The power and annual energy estimation will be calculated for each site using a calculation which integrates the FDC, the head at the appropriate flow, a representative headloss figure, representative turbine and generator efficiencies at the range of flows.
Turbine operating envelopes from Hydra software/manufacturers.
For each site the distance to the grid will be determined.
Environmental criteria: Method developed by Entec (2010) will be used as a framework for a methodology to identify environmental constraints. The following categories and criteria applied by Entec will be used as a minimum in this study: Category 1 (SAC/SPA connectivity); Category 2 (supporting Annex II Habitats Directive species); Category 3 (presence of brown trout; will be adapted to include Atlantic Salmon); Category 5 (protected species data; still outstanding); Category 6 & 7 (other designated areas; some data still outstanding); Criteria 5 (proximity of WFD failing stretches).
The Water Framework Directive status of each water body associated with a potential hydropower site will be obtained from EA records. Initial assessments of the hydromorphology of the potential sites will be conducted recording morphological stability issues and flow types visible from aerial imagery. This will be supplemented by available RHS data. River Basin Management Plan actions
1 http://www.environment-agency.gov.uk/research/planning/33106.aspx

B-34
Parameters DECC suggested data source
Data used for West Midlands study
DECC suggested assumptions
Assumptions used Justification for divergence from DECC
Steering Group comments
Further comments
associated with each of the potential hydropower sites will be collated and reviewed.
Environmental mitigation measures are to be included for each site based on the likely turbine selection.
Site visits will be made to 6 of the preferred sites to verify the desk based GIS exercise. A reach based dynamic assessment will improve on the initial aerial hydromorphic survey.
Indicative costing data for scheme development and mitigation measures will be provided. Indicative economic analysis.
Source: Maslen Environmental

B-35
Table B-15 : Assumptions for microgeneration – solar energy
Parameters DECC suggested data source
Data used for West Midlands study
DECC suggested assumptions
Assumptions used Justification for divergence from DECC
Steering Group comments
Further comments
Opportunity assessment
Existing roof space CLG statistics
English housing Survey
ONS data
Include:
25% of all domestic properties including flats
40% of commercial properties
80% of industrial buildings
Use NLUD classification within address data to classify as residential, commercial and industrial. Others excluded. Unless categorised in NLUD as dwelling, address point must be postal/mutli-occupancy and permanent building. In relation to Solar Thermal all suitable domestic addresses included and an additional 10% of the suitable commercial properties (as defined for Solar PV)
DECC recommends the use of CLG statistics, the English housing Survey and ONS data. None of these data sources provide the correct data for the assessment. Use of data from the National Land and Property Gazetteer has been considered, but Address Layer 2 data will already have been processed for wind technologies, so this was more readily available. 40% of all commercial properties included (not just hereditaments due to data limitations). We included 10% of suitable commercial properties in the calculations for solar thermal potential.
.
Agreed
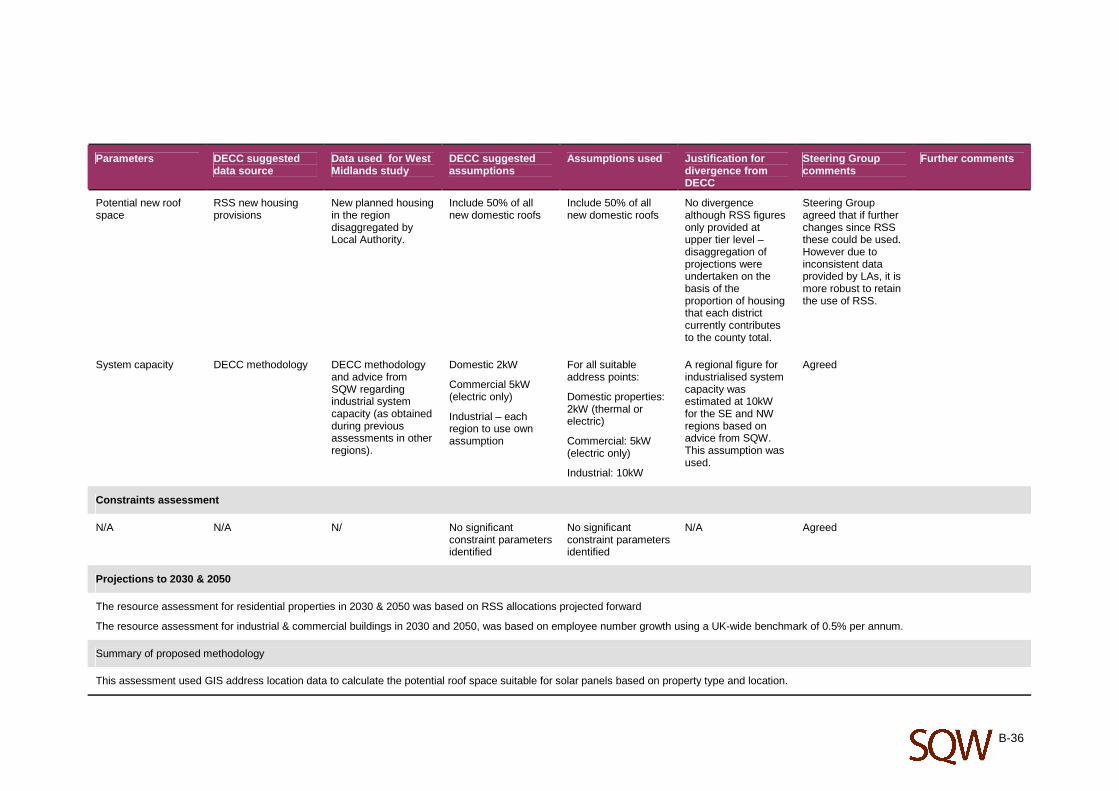
B-36
Parameters DECC suggested data source
Data used for West Midlands study
DECC suggested assumptions
Assumptions used Justification for divergence from DECC
Steering Group comments
Further comments
Potential new roof space
RSS new housing provisions
New planned housing in the region disaggregated by Local Authority.
Include 50% of all new domestic roofs
Include 50% of all new domestic roofs
No divergence although RSS figures only provided at upper tier level – disaggregation of projections were undertaken on the basis of the proportion of housing that each district currently contributes to the county total.
Steering Group agreed that if further changes since RSS these could be used. However due to inconsistent data provided by LAs, it is more robust to retain the use of RSS.
System capacity DECC methodology DECC methodology and advice from SQW regarding industrial system capacity (as obtained during previous assessments in other regions).
Domestic 2kW
Commercial 5kW (electric only)
Industrial – each region to use own assumption
For all suitable address points:
Domestic properties: 2kW (thermal or electric)
Commercial: 5kW (electric only)
Industrial: 10kW
A regional figure for industrialised system capacity was estimated at 10kW for the SE and NW regions based on advice from SQW. This assumption was used.
Agreed
Constraints assessment
N/A N/A N/ No significant constraint parameters identified
No significant constraint parameters identified
N/A Agreed
Projections to 2030 & 2050
The resource assessment for residential properties in 2030 & 2050 was based on RSS allocations projected forward
The resource assessment for industrial & commercial buildings in 2030 and 2050, was based on employee number growth using a UK-wide benchmark of 0.5% per annum.
Summary of proposed methodology
This assessment used GIS address location data to calculate the potential roof space suitable for solar panels based on property type and location.

B-37
Table B-16 : Assumptions for microgeneration – heat pumps
Parameters DECC suggested data source
Data used for West Midlands study
DECC suggested assumptions
Assumptions used Justification for divergence from DECC
Steering Group comments
Further comments
Opportunity assessment
Existing building stock
CLG statistics, English Housing Survey, ONS data
OS MasterMap Address Layer 2;
ONS 2001 census statistics KS16 (Household Spaces and Accommodation Type)
Off-gas grid data source: Centre for Sustainable Energy (Identifying and Quantifying the Prevalence of Hard to Treat Homes, 2006)
Include:
Domestic – 100% of all off-grid properties, 75% detached and semi-detached properties, 50% of terraced properties, 25% of flats;
Commercial – no assumption supplied.
Use NLUD classification within address data to classify as residential, commercial and industrial. Others excluded. Unless categorised in NLUD as dwelling, address point must be postal/multi-occupancy and permanent building. For domestic properties, use breakdown between different property types from key statistics table KS016 (it is possible that as one of the outcomes of the heat mapping, this assumption can be refined). Percentage of off-gas properties per Local Authority calculated using rural fuel poverty data from Centre for Sustainable Energy (or consult with DECC about latest datasets). Assumed that all off-gas
Only domestic and commercial properties considered. DECC recommends the use of CLG statistics, the English Housing Survey and ONS data. None of these data sources provide the correct data for this assessment. Use of data from the National Land and Property Gazetteer has been considered, but Address Layer 2 data had already have been processed for wind technologies, so this was more readily available. Discussions with SQW on the SE and NW studies indicated that the omitted figure for commercial properties should be 10%.
Agreed
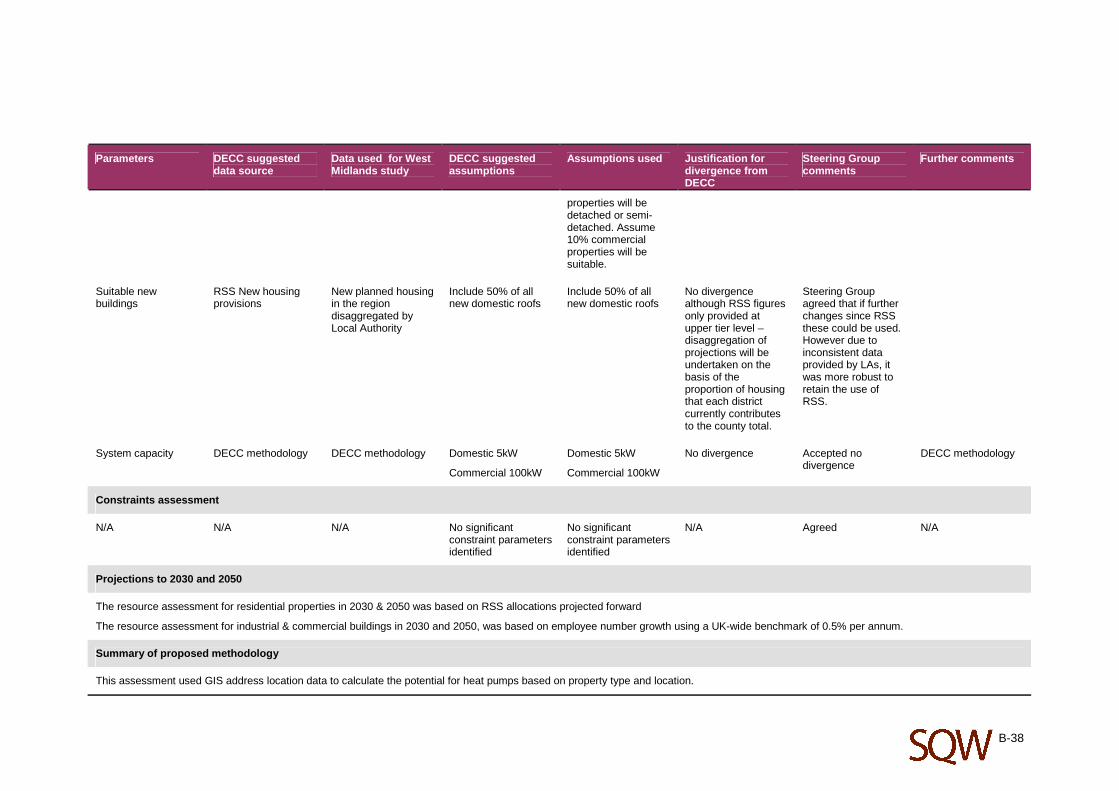
B-38
Parameters DECC suggested data source
Data used for West Midlands study
DECC suggested assumptions
Assumptions used Justification for divergence from DECC
Steering Group comments
Further comments
properties will be detached or semi-detached. Assume 10% commercial properties will be suitable.
Suitable new buildings
RSS New housing provisions
New planned housing in the region disaggregated by Local Authority
Include 50% of all new domestic roofs
Include 50% of all new domestic roofs
No divergence although RSS figures only provided at upper tier level – disaggregation of projections will be undertaken on the basis of the proportion of housing that each district currently contributes to the county total.
Steering Group agreed that if further changes since RSS these could be used. However due to inconsistent data provided by LAs, it was more robust to retain the use of RSS.
System capacity DECC methodology DECC methodology Domestic 5kW
Commercial 100kW
Domestic 5kW
Commercial 100kW
No divergence Accepted no divergence
DECC methodology
Constraints assessment
N/A N/A N/A No significant constraint parameters identified
No significant constraint parameters identified
N/A Agreed N/A
Projections to 2030 and 2050
The resource assessment for residential properties in 2030 & 2050 was based on RSS allocations projected forward
The resource assessment for industrial & commercial buildings in 2030 and 2050, was based on employee number growth using a UK-wide benchmark of 0.5% per annum.
Summary of proposed methodology
This assessment used GIS address location data to calculate the potential for heat pumps based on property type and location.
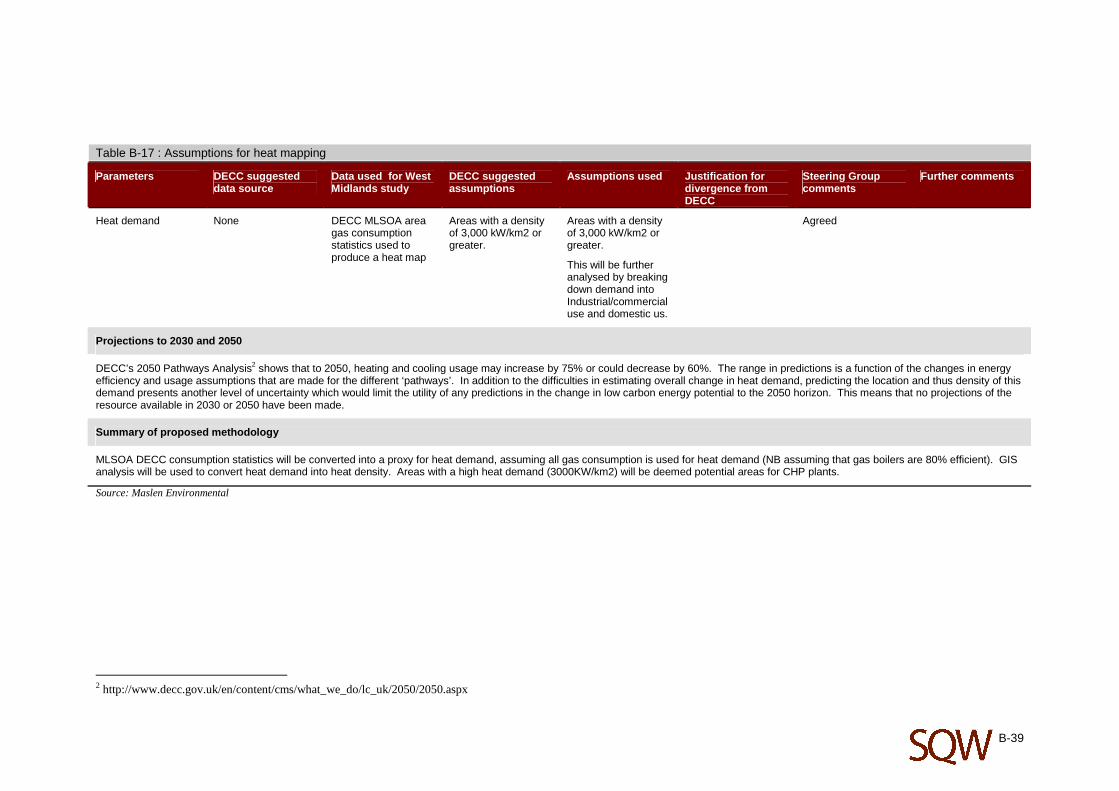
B-39
Table B-17 : Assumptions for heat mapping
Parameters DECC suggested data source
Data used for West Midlands study
DECC suggested assumptions
Assumptions used Justification for divergence from DECC
Steering Group comments
Further comments
Heat demand None DECC MLSOA area gas consumption statistics used to produce a heat map
Areas with a density of 3,000 kW/km2 or greater.
Areas with a density of 3,000 kW/km2 or greater.
This will be further analysed by breaking down demand into Industrial/commercial use and domestic us.
Agreed
Projections to 2030 and 2050
DECC’s 2050 Pathways Analysis2 shows that to 2050, heating and cooling usage may increase by 75% or could decrease by 60%. The range in predictions is a function of the changes in energy efficiency and usage assumptions that are made for the different ‘pathways’. In addition to the difficulties in estimating overall change in heat demand, predicting the location and thus density of this demand presents another level of uncertainty which would limit the utility of any predictions in the change in low carbon energy potential to the 2050 horizon. This means that no projections of the resource available in 2030 or 2050 have been made.
Summary of proposed methodology
MLSOA DECC consumption statistics will be converted into a proxy for heat demand, assuming all gas consumption is used for heat demand (NB assuming that gas boilers are 80% efficient). GIS analysis will be used to convert heat demand into heat density. Areas with a high heat demand (3000KW/km2) will be deemed potential areas for CHP plants.
Source: Maslen Environmental
2 http://www.decc.gov.uk/en/content/cms/what_we_do/lc_uk/2050/2050.aspx
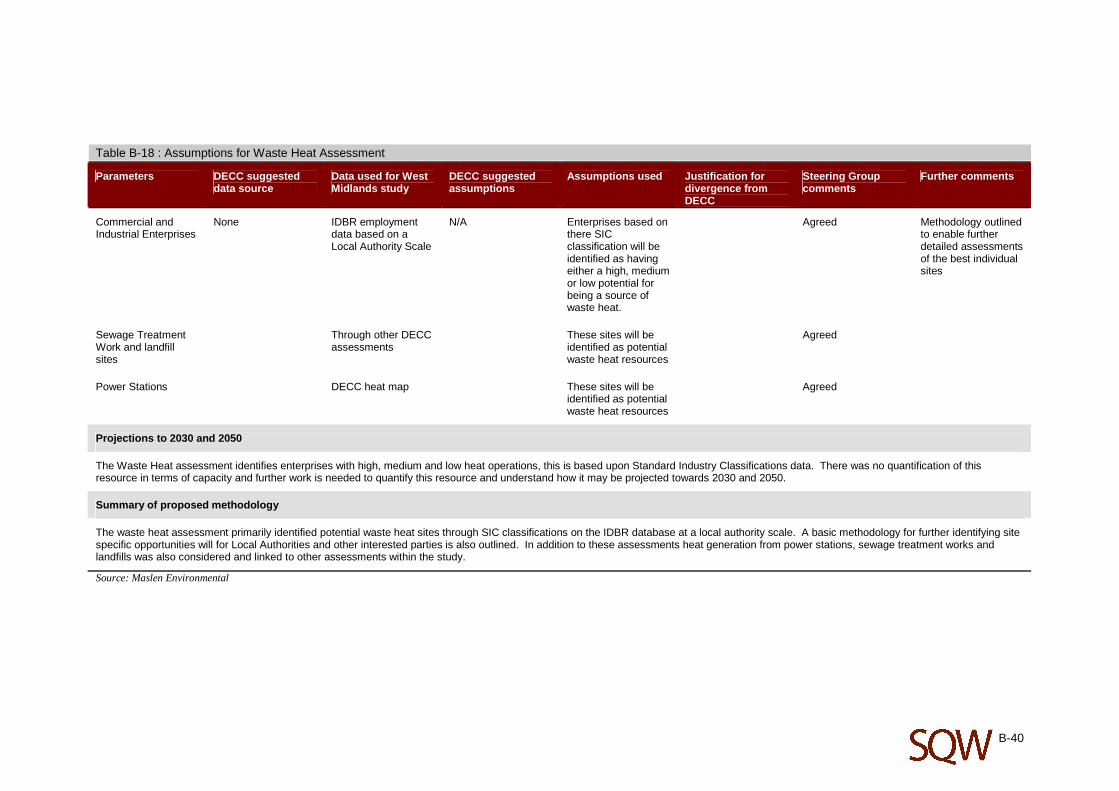
B-40
Table B-18 : Assumptions for Waste Heat Assessment
Parameters DECC suggested data source
Data used for West Midlands study
DECC suggested assumptions
Assumptions used Justification for divergence from DECC
Steering Group comments
Further comments
Commercial and Industrial Enterprises
None IDBR employment data based on a Local Authority Scale
N/A Enterprises based on there SIC classification will be identified as having either a high, medium or low potential for being a source of waste heat.
Agreed Methodology outlined to enable further detailed assessments of the best individual sites
Sewage Treatment Work and landfill sites
Through other DECC assessments
These sites will be identified as potential waste heat resources
Agreed
Power Stations DECC heat map These sites will be identified as potential waste heat resources
Agreed
Projections to 2030 and 2050
The Waste Heat assessment identifies enterprises with high, medium and low heat operations, this is based upon Standard Industry Classifications data. There was no quantification of this resource in terms of capacity and further work is needed to quantify this resource and understand how it may be projected towards 2030 and 2050.
Summary of proposed methodology
The waste heat assessment primarily identified potential waste heat sites through SIC classifications on the IDBR database at a local authority scale. A basic methodology for further identifying site specific opportunities will for Local Authorities and other interested parties is also outlined. In addition to these assessments heat generation from power stations, sewage treatment works and landfills was also considered and linked to other assessments within the study.
Source: Maslen Environmental

B-41
Table B-19 : Grid Assessment
Parameters DECC suggested data source
Data used for West Midlands study
DECC suggested assumptions
Assumptions used Justification for divergence from DECC
Agreement required from the Steering Group
Further comments
Electricity transmission network
None National Grid Transmission Data for WM region
None Used to plot 132kV transmission lines across the WM.
Agreed
Electricity distribution network
None EON distribution network data cd for the WM
None Used to plot 66kV, 33kV and where data allows 11kV distribution lines across the WM by Local Authority scale
Agreed
Gas transmission network
None National Grid Transmission Data for WM region
None Used to plot large scale transmission pipelines throughout the WM
Agreed
Gas distribution network
None National Grid distribution data for WM region
None Used to plot distribution scale pipelines throughout the WM at Local Authority scale
Agreed
Summary of proposed methodology
Through consultation with EON, and the National Grid, data was obtained then analysed to determine current electricity and gas distribution network, to understand areas with and without connection. Studies and data from these stakeholders ensured areas nearing capacity were fully understood. Investment programmes and timescales were analysed to understand future extension of the networks. In addition interviews were conducted with the key DNO representatives to ensure qualitative evidence was also recorded. DNOs whilst governed by Ofgem have a number of different approvals and processes when connecting RLCs to their network which was also explored. The cost of connecting to the grid was predominantly driven by distance from energy source to connection and current load at a particular site. By understanding the costs of connecting to the grid through EON consultation, it enabled further information to be gathered and constraints mapping of commercial wind to be more realistic.
Outputs from this analysis was used to identify grid constraints. This will be presented in GIS format to assess areas whose current grid service would limit RLC development.
Source: Maslen Environmental

C-1
Annex C: References
Table C-1 : References
• ADAS, 2009. National Study into Commercial and Industrial Waste Arisings.
• Biffa et al, 2007. Landfill gas generator’s response to the reform of the Renewables Obligation (RO).
• Birmingham District Energy - The Company Delivering Sustainable Energy to Birmingham
• Birmingham Energy Strategy Carbon Descent Scenarios Draft v4 (2010)
• Birmingham Waste Capacity Study (2010)
• Carbon Trust, 2009. Biomass Boilers: A practical guide for potential usersAdvantage West Midlands, Landfill Diversion Strategy, (2009)
• Centre for Sustainable Energy, Identifying and quantifying the prevalence of hard to treat homes (2006)
• CLG, 2007, Generalised Land Use Database Statistics for England 2005.
• DECC - Improving grid access - second consultation
• DECC, UK Renewable Energy Strategy (2009)
• DCLG, 2010. Household projections by district, England, 1991-2033.
• Defra, 2009. Agricultural and Horticultural Survey.
• Defra, 2008. Waste Wood as a Biomass Fuel.
• Environment Agency, Hydropower guide for developers and communities – Environment Agency
• Environment Agency, Mapping hydropower opportunities and sensitivities in the West Midlands (2010)
• Forestry Commission, 2003, Woodfuel Resource Tool
• Forestry Commission, 2002, National Inventory of Woodland and Trees (County Reports)
• Forestry Commission, 2003, Woodfuel in Britain: Main Report
• NNFCC, 2008. National and regional supply/demand balance for agricultural straw in Great Britain.
• Ofgem, 2010. Renewables and CHP Register, Accredited Stations.
• ONS, 2010. 2008-based subnational population projections by sex and quinary age.
• ONS, 2009. Annual Business Inquiry Employee Job estimates.
• Renewable and Low Carbon Energy Resource Assessment and Feasibility Study – Warwickshire and Solihull (2010)
• SHAP – 2005-6 Final report (www.shap.uk.com)
• SHAP – Low Carbon Housing Retrofit Baseline Study (2009) (www.shap.uk.com
• SHAP – Planning for low carbon housing (www.shap.uk.com)
• Staffordshire Renewable Energy Study (2010)
• Stoke on Trent Renewable Energy Assessment (2009)
• West Midlands Climate Change Action Plan (2007)
• UKCES, 2008. Working Futures 2007-2017.
• Update of Wind Resources Study for the West Midlands (2008)
• West Midlands Biomass Resource Study (2009)
• West Midlands Regional Carbon Dioxide Emissions Strategy (2009)
• West Midlands Climate Change State of the Region Report (2009)
• West Midlands Heat Mapping & Decentralised Energy Feasibility Study (2008)
• West Midlands Regional Energy Strategy (2004)
• West Midlands Regional Spatial Strategy
• West Midlands Wind Energy Information Tool: Assessment of Wind Energy Resource (2004)
• West Midlands Wood Energy Strategy

D-1
Annex D: Stakeholder workshops
D.1 Two stakeholder workshops were held on 24 January 2011: the first concerned the regional and local authority resource assessments, whilst the second was specifically concerned with the middle Severn hydro assessment. The agendas for both are detailed below:
24 January 2011, 10:00 – 13:00 at the Environment Agency, Sapphire East, 550 Streetsbrook Road, Solihull, West Midlands,
B91 1QT
The purpose of the event is to provide an opportunity for key stakeholders in the region to:
Understand the scope and methodology used to assess the West Midlands resource base
Engage with the interim results of the resource assessment
Understand how the results of the resource assessment will be taken forward into an evidence base for planning policy development
Influence the final form and content of guidance for the development of planning policy concerning renewable energy deployment.
Agenda
9:45 Arrival and refreshments
10:00 Welcome and introduction to the study and overview of the West Midlands Local Authority Low Carbon Economy Programme (Telford & Wrekin Council)
10:15 Overview of the study methodology and schedule for the rest of the morning (SQW). Followed by Q&A.
(Overview to highlight key issues including initial thoughts on planning policy guidance from LAs, variation in stage of LDF development and recognition that this is a politically contentious area – management of this can be helped by the independent and objective evidence base that we will be providing. This session should also include the explanation of ground rules giving participants an opportunity to amend/add to these – within time limits…)
10:35 Study results to date – renewable energy resource assessment (SQW). Followed by Q&A.
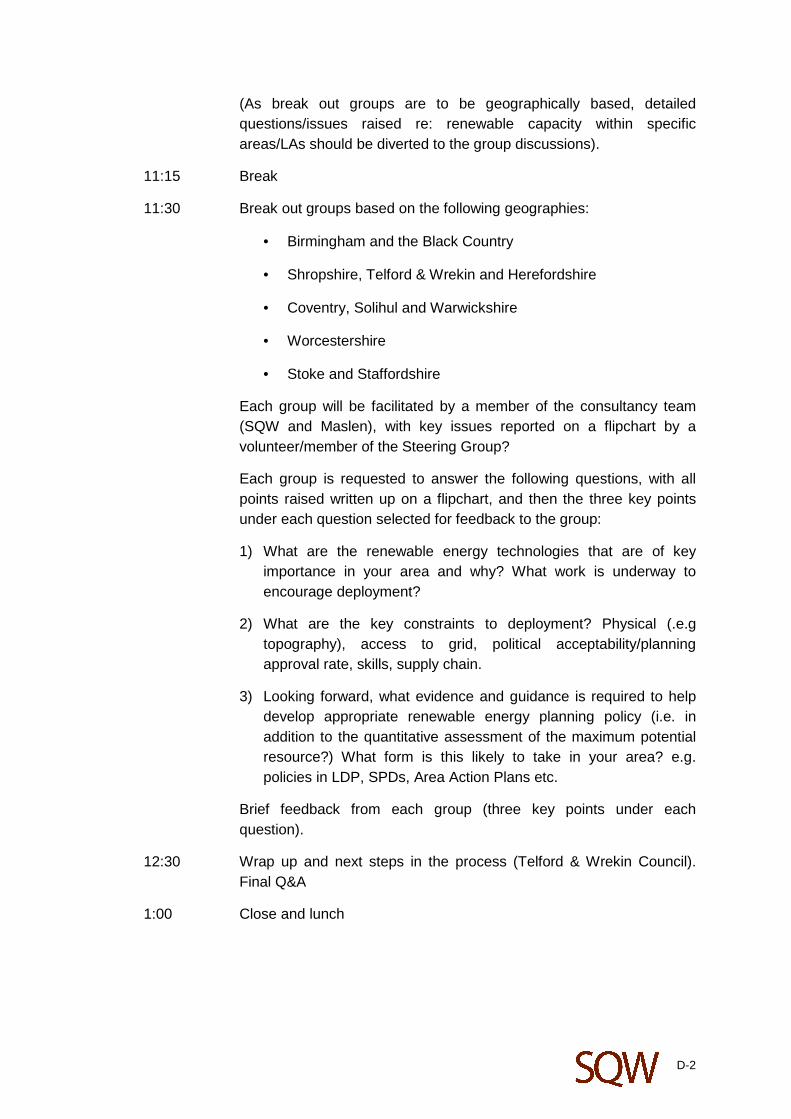
D-2
(As break out groups are to be geographically based, detailed questions/issues raised re: renewable capacity within specific areas/LAs should be diverted to the group discussions).
11:15 Break
11:30 Break out groups based on the following geographies:
• Birmingham and the Black Country
• Shropshire, Telford & Wrekin and Herefordshire
• Coventry, Solihul and Warwickshire
• Worcestershire
• Stoke and Staffordshire
Each group will be facilitated by a member of the consultancy team (SQW and Maslen), with key issues reported on a flipchart by a volunteer/member of the Steering Group?
Each group is requested to answer the following questions, with all points raised written up on a flipchart, and then the three key points under each question selected for feedback to the group:
1) What are the renewable energy technologies that are of key importance in your area and why? What work is underway to encourage deployment?
2) What are the key constraints to deployment? Physical (.e.g topography), access to grid, political acceptability/planning approval rate, skills, supply chain.
3) Looking forward, what evidence and guidance is required to help develop appropriate renewable energy planning policy (i.e. in addition to the quantitative assessment of the maximum potential resource?) What form is this likely to take in your area? e.g. policies in LDP, SPDs, Area Action Plans etc.
Brief feedback from each group (three key points under each question).
12:30 Wrap up and next steps in the process (Telford & Wrekin Council). Final Q&A
1:00 Close and lunch

D-3
Renewable Energy Capacity Study for the West Midlands
Stakeholder event - detailed agenda for the afternoon session
24 January 2011
24 January 2011, 13:15 – 16:30 at the Environment Agency, Sapphire East, 550 Streetsbrook Road, Solihull, West Midlands,
B91 1QT
The purpose of the event is to provide an opportunity for key stakeholders in the region to:
Understand the scope and methodology used to assess the hydropower opportunities and constraints within the middle Severn
Engage with the interim results of the resource assessment
Understand how the results of the resource assessment will be taken forward into an evidence base for planning policy development in the West Midlands
Influence the final form and content of guidance for the development of a catchment framework for hydropower development on the Middle Severn.
Agenda
13:15 Arrival and refreshments
13:30 Welcome and introduction to the Severn catchment hydropower deployment study in conjunction with the West Midlands Renewable Energy Study (Environment Agency)
13:45 Summary of the agenda and introduction of the ground-rules (SQW/Maslen/CO2Sense)
13:50 Overview of the hydropower study methodology. Followed by Q&A. (Maslen)
14:15 Presentation of the key findings of the Middle Severn Hydropower Capacity study, followed by Q&A. (Maslen)
15:15 Break
15:30 Break-out into 3 groups.

D-4
Each group will be facilitated by a member of the consultancy team (Maslen, CO2Sense and SQW), with key issues reported on a flipchart by a volunteer/member of the Steering Group.
Each group is requested to answer the following questions, with all points raised written up on a flipchart, these are then selected for feedback to the group:
1) What are your thoughts on sustainable hydropower deployment in the West Midlands and are there any opportunities or constraints that we should be aware of? (15mins total)
2) What do ‘we’ as stakeholders, need to do better to deploy sustainable hydropower in the West Midlands? (15mins total)
3) Looking forward, what evidence and guidance is required to help develop appropriate hydropower planning policy?
16:15 Wrap up and next steps in the process. Final Q&A (SQW)
16:30 Close.

E-1
Annex E: Projections to 2050
E.1 Within this Annex, resource assessments are provided for the following technologies at 2050. Annex B provides further detail on the assumptions used that underpin the assessments.
• Biomass
• Microgeneration
Biomass
Table E-1 :Potential accessible managed woodland resource by local authority, 2050
Local authority Electricity (MW Capacity)
Percentage of Elec. Total (%)
Heat (MW Capacity)
Percentage of Heat Total (%)
Herefordshire 46 18 266 18
Telford & Wrekin 4 2 27 2
Shropshire 77 30 448 31
Stoke on Trent 0.1 0.04 1 0.07
Birmingham and Solihull
2 0.8 13 0.9
Coventry 1 0.4 3 1
Wolverhampton, Sandwell, Walsall and Dudley
0.1 0.04 4 0.3
STAFFORDSHIRE TOTAL
50 20 286 20
WARWICKSHIRE TOTAL
38 15 214 15
WORCESTERSHIRE TOTAL
34 13 197 13
WEST MIDLANDS TOTAL
253 100 1460 100
Source: SQW
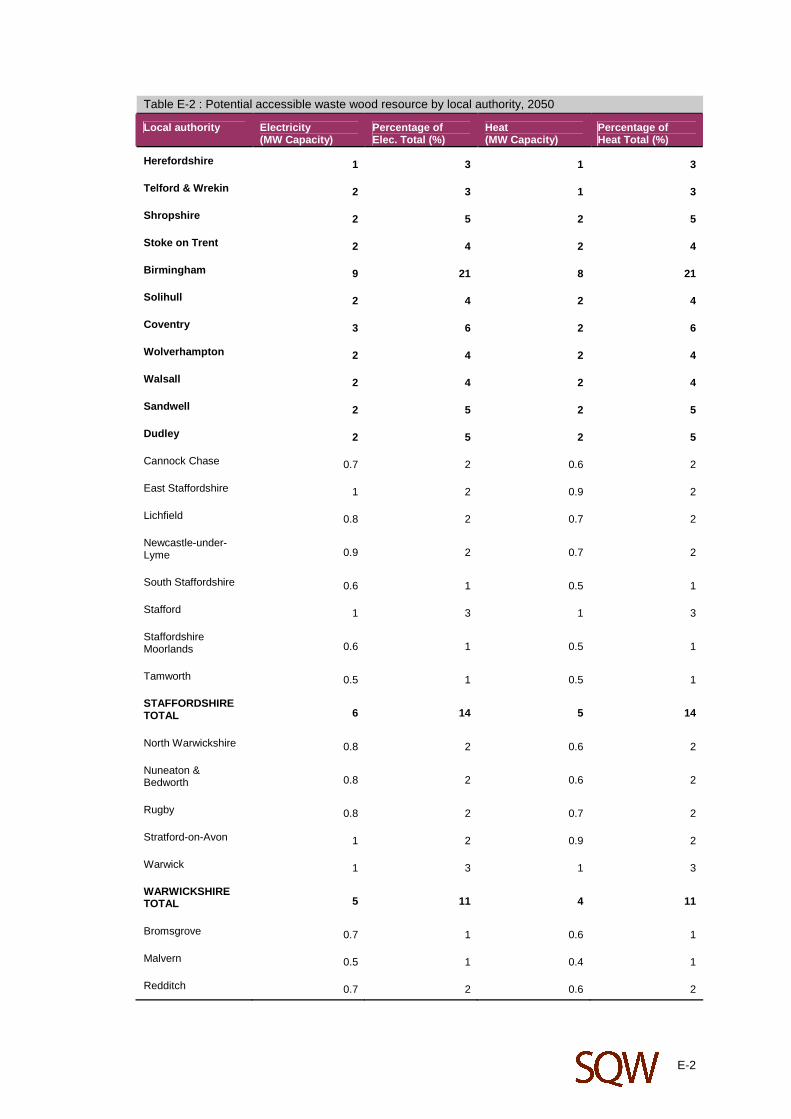
E-2
Table E-2 : Potential accessible waste wood resource by local authority, 2050
Local authority Electricity (MW Capacity)
Percentage of Elec. Total (%)
Heat (MW Capacity)
Percentage of Heat Total (%)
Herefordshire 1 3 1 3
Telford & Wrekin 2 3 1 3
Shropshire 2 5 2 5
Stoke on Trent 2 4 2 4
Birmingham 9 21 8 21
Solihull 2 4 2 4
Coventry 3 6 2 6
Wolverhampton 2 4 2 4
Walsall 2 4 2 4
Sandwell 2 5 2 5
Dudley 2 5 2 5
Cannock Chase 0.7 2 0.6 2
East Staffordshire 1 2 0.9 2
Lichfield 0.8 2 0.7 2
Newcastle-under-Lyme 0.9 2 0.7 2
South Staffordshire 0.6 1 0.5 1
Stafford 1 3 1 3
Staffordshire Moorlands 0.6 1 0.5 1
Tamworth 0.5 1 0.5 1
STAFFORDSHIRE TOTAL 6 14 5 14
North Warwickshire 0.8 2 0.6 2
Nuneaton & Bedworth 0.8 2 0.6 2
Rugby 0.8 2 0.7 2
Stratford-on-Avon 1 2 0.9 2
Warwick 1 3 1 3
WARWICKSHIRE TOTAL 5 11 4 11
Bromsgrove 0.7 1 0.6 1
Malvern 0.5 1 0.4 1
Redditch 0.7 2 0.6 2

E-3
Local authority Electricity (MW Capacity)
Percentage of Elec. Total (%)
Heat (MW Capacity)
Percentage of Heat Total (%)
Worcester 1 2 0.8 2
Wychavon 0.9 2 0.8 2
Wyre Forest 0.6 1 0.6 1
WORCESTERSHIRE TOTAL 4 10 4 10
WEST MIDLANDS TOTAL 45 100 39 100
Source: SQW
Table E-3 : Potential accessible agricultural arising (straw) resource, 2050
Local authority Electricity (MW Capacity) Percentage of Total (%)
Herefordshire 9 18
Telford & Wrekin 2 3
Shropshire 12 24
Stoke on Trent 0 0
Birmingham 0.2 0
Solihull 0.5 1
Coventry 0.1 0
Wolverhampton 0 0
Walsall 0 0
Sandwell 0 0
Dudley 0 0
Cannock Chase 0.09 0
East Staffordshire 1 2
Lichfield 2 4
Newcastle-under-Lyme 0.2 0
South Staffordshire 2 3
Stafford 2 4
Staffordshire Moorlands 0.1 0
Tamworth 0.06 0
STAFFORDSHIRE TOTAL 7 15
North Warwickshire 2 4
Nuneaton & 0.3 1

E-4
Local authority Electricity (MW Capacity) Percentage of Total (%)
Bedworth
Rugby 2 5
Stratford-on-Avon 7 14
Warwick 2 3
WARWICKSHIRE TOTAL 13 26
Bromsgrove 0.5 1
Malvern 2 5
Redditch 0.1 0
Worcester 0 0
Wychavon 4 7
Wyre Forest 0.4 1
WORCESTERSHIRE TOTAL 7 14
WEST MIDLANDS TOTAL 51 100
Source: SQW
Table E-4 : Potential accessible animal biomass resource, 2050
Local authority Electricity (MW Capacity) Percentage of Total (%)
Herefordshire 38 21
Telford & Wrekin 3 2
Shropshire 58 32
Stoke on Trent 0.5 0
Birmingham 1 0
Solihull 1 1
Coventry 0.4 0
Wolverhampton 0.1 0
Walsall 0.3 0
Sandwell 0.3 0
Dudley 0.2 0
Cannock Chase 0.3 0
East Staffordshire 9 5
Lichfield 3 1
Newcastle-under- 5 3
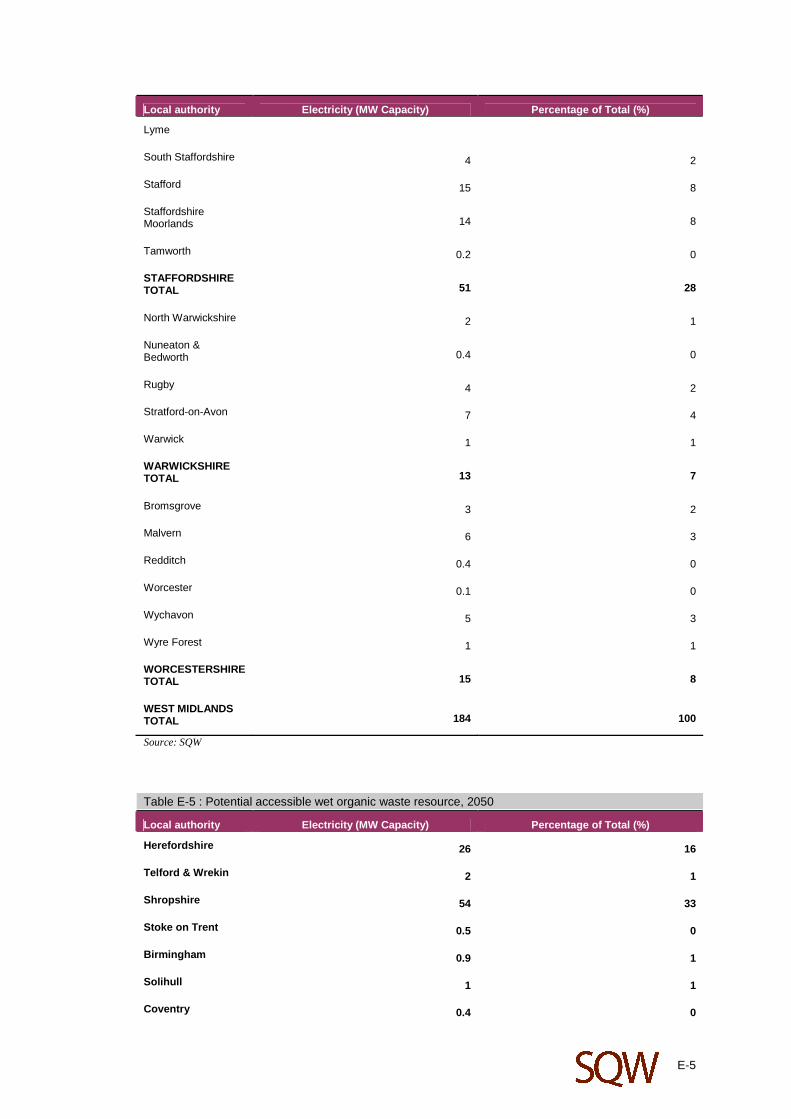
E-5
Local authority Electricity (MW Capacity) Percentage of Total (%)
Lyme
South Staffordshire 4 2
Stafford 15 8
Staffordshire Moorlands 14 8
Tamworth 0.2 0
STAFFORDSHIRE TOTAL 51 28
North Warwickshire 2 1
Nuneaton & Bedworth 0.4 0
Rugby 4 2
Stratford-on-Avon 7 4
Warwick 1 1
WARWICKSHIRE TOTAL 13 7
Bromsgrove 3 2
Malvern 6 3
Redditch 0.4 0
Worcester 0.1 0
Wychavon 5 3
Wyre Forest 1 1
WORCESTERSHIRE TOTAL 15 8
WEST MIDLANDS TOTAL 184 100
Source: SQW
Table E-5 : Potential accessible wet organic waste resource, 2050
Local authority Electricity (MW Capacity) Percentage of Total (%)
Herefordshire 26 16
Telford & Wrekin 2 1
Shropshire 54 33
Stoke on Trent 0.5 0
Birmingham 0.9 1
Solihull 1 1
Coventry 0.4 0

E-6
Local authority Electricity (MW Capacity) Percentage of Total (%)
Wolverhampton 0.1 0
Walsall 0.3 0
Sandwell 0.3 0
Dudley 0.2 0
Cannock Chase 0.3 0
East Staffordshire 9 6
Lichfield 3 2
Newcastle-under-Lyme 5 3
South Staffordshire 4 2
Stafford 15 9
Staffordshire Moorlands 14 8
Tamworth 0.2 0
STAFFORDSHIRE TOTAL 50 30
North Warwickshire 2 1
Nuneaton & Bedworth 0.4 0
Rugby 4 2
Stratford-on-Avon 6 4
Warwick 1 1
WARWICKSHIRE TOTAL 12 7
Bromsgrove 3 2
Malvern 5 3
Redditch 0.4 0
Worcester 0.1 0
Wychavon 5 3
Wyre Forest 1 1
WORCESTERSHIRE TOTAL 15 9
WEST MIDLANDS TOTAL 166 100
Source: SQW

E-7
Table E-6 :Potential accessible poultry litter resource, 2050
Local authority Electricity (MW Capacity) Percentage of Total (%)
Herefordshire 12 63
Telford & Wrekin 0.8 4
Shropshire 4 22
Stoke on Trent 0 0
Birmingham 0 0
Solihull 0 0
Coventry 0 0
Wolverhampton 0 0
Walsall 0 0
Sandwell 0 0
Dudley 0 0
Cannock Chase 0 0
East Staffordshire 0.2 1
Lichfield 0 0
Newcastle-under-Lyme 0 0
South Staffordshire 0.4 2
Stafford 0.03 0
Staffordshire Moorlands 0.06 0
Tamworth 0 0
STAFFORDSHIRE TOTAL 0.6 3
North Warwickshire 0 0
Nuneaton & Bedworth 0 0
Rugby 0.06 0
Stratford-on-Avon 0.9 5
Warwick 0.01 0
WARWICKSHIRE TOTAL 1 5
Bromsgrove 0.03 0
Malvern 0.4 2
Redditch 0 0
Worcester 0 0

E-8
Local authority Electricity (MW Capacity) Percentage of Total (%)
Wychavon 0.01 0
Wyre Forest 0.02 0
WORCESTERSHIRE TOTAL 0.5 2
WEST MIDLANDS TOTAL 18 100
Source: SQW
Table E-7 : Potential accessible Municipal Solid Waste resource, 2050
Local authority Electricity (MW Capacity) Percentage of Total (%)
Herefordshire 8 3
Telford & Wrekin 8 3
Shropshire 15 6
Stoke on Trent 12 5
Birmingham 49 20
Solihull 9 4
Coventry 15 6
Wolverhampton 13 5
Walsall 12 5
Sandwell 13 5
Dudley 13 6
Cannock Chase 4 2
East Staffordshire 5 2
Lichfield 5 2
Newcastle-under-Lyme 5 2
South Staffordshire 4 2
Stafford 5 2
Staffordshire Moorlands 4 2
Tamworth 3 1
STAFFORDSHIRE TOTAL 34 14
North Warwickshire 3 1
Nuneaton & Bedworth 5 2

E-9
Local authority Electricity (MW Capacity) Percentage of Total (%)
Rugby 4 2
Stratford-on-Avon 5 2
Warwick 5 2
WARWICKSHIRE TOTAL 22 9
Bromsgrove 4 2
Malvern 2 1
Redditch 3 1
Worcester 3 1
Wychavon 4 2
Wyre Forest 4 1
WORCESTERSHIRE TOTAL 19 8
WEST MIDLANDS TOTAL 243 100
Source: SQW
Table E-8 : Potential accessible Commercial & Industrial Waste resource, 2050
Local authority Electricity (MW Capacity) Percentage of Total (%)
Herefordshire 5 3
Telford & Wrekin 6 4
Shropshire 7 4
Stoke on Trent 7 4
Birmingham 30 19
Solihull 6 4
Coventry 10 6
Wolverhampton 6 4
Walsall 8 5
Sandwell 10 6
Dudley 9 5
Cannock Chase 3 2
East Staffordshire 4 2
Lichfield 3 2
Newcastle-under-Lyme
3 2

E-10
Local authority Electricity (MW Capacity) Percentage of Total (%)
South Staffordshire 2 1
Stafford 4 3
Staffordshire Moorlands
2 1
Tamworth 2 1
STAFFORDSHIRE TOTAL
23 15
North Warwickshire 2 1
Nuneaton & Bedworth
2 2
Rugby 3 2
Stratford-on-Avon 3 2
Warwick 5 3
WARWICKSHIRE TOTAL
16 10
Bromsgrove 3 2
Malvern 2 1
Redditch 3 2
Worcester 4 3
Wychavon 4 2
Wyre Forest 3 2
WORCESTERSHIRE TOTAL
18 11
WEST MIDLANDS TOTAL
160 100 Source: SQW

E-11
Table E-9 : Potential accessible sewage gas resource, 2050
Local authority Electricity (MW Capacity) Percentage of Total (%)
Herefordshire 0 0
Telford & Wrekin 0.5 1
Shropshire 1.4 4
Stoke on Trent 3.9 10
Birmingham 18.3 48
Solihull 0.4 1
Coventry 0 0
Wolverhampton 1.2 3
Walsall 0 0
Sandwell 0 0
Dudley 0 0
Cannock Chase 0 0
East Staffordshire 1.5 4
Lichfield 0 0
Newcastle-under-Lyme
0 0
South Staffordshire 2.1 6
Stafford 0.6 2
Staffordshire Moorlands
0.6 2
Tamworth 0 0
STAFFORDSHIRE TOTAL
4.9 13
North Warwickshire 0.4 1
Nuneaton & Bedworth
0 0
Rugby 0.4 1
Stratford-on-Avon 1.2 3
Warwick 3.9 10
WARWICKSHIRE TOTAL
5.7 15
Bromsgrove 0 0
Malvern 0 0
Redditch 0 0
Worcester 1.2 3

E-12
Local authority Electricity (MW Capacity) Percentage of Total (%)
Wychavon 0 0
Wyre Forest 0.7 2
WORCESTERSHIRE TOTAL
1.6 5
WEST MIDLANDS TOTAL
38.1 100
Source: SQW
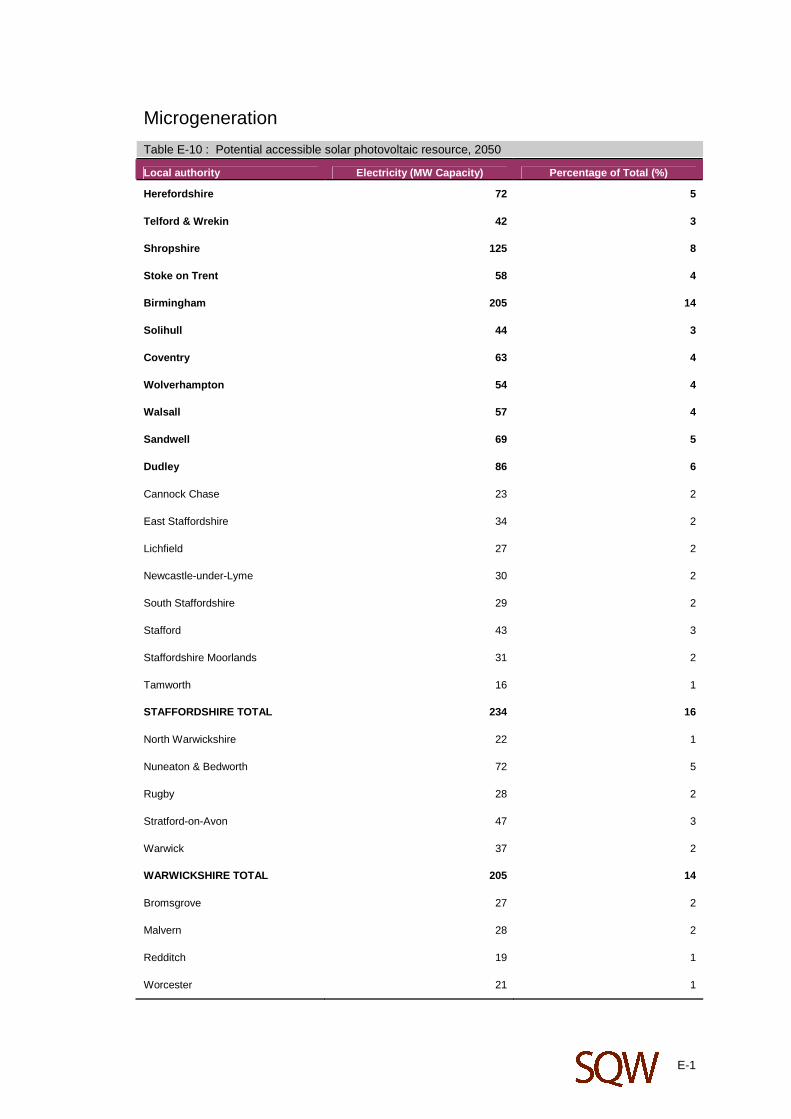
E-1
Microgeneration
Table E-10 : Potential accessible solar photovoltaic resource, 2050
Local authority Electricity (MW Capacity) Percentage of Total (%)
Herefordshire 72 5
Telford & Wrekin 42 3
Shropshire 125 8
Stoke on Trent 58 4
Birmingham 205 14
Solihull 44 3
Coventry 63 4
Wolverhampton 54 4
Walsall 57 4
Sandwell 69 5
Dudley 86 6
Cannock Chase 23 2
East Staffordshire 34 2
Lichfield 27 2
Newcastle-under-Lyme 30 2
South Staffordshire 29 2
Stafford 43 3
Staffordshire Moorlands 31 2
Tamworth 16 1
STAFFORDSHIRE TOTAL 234 16
North Warwickshire 22 1
Nuneaton & Bedworth 72 5
Rugby 28 2
Stratford-on-Avon 47 3
Warwick 37 2
WARWICKSHIRE TOTAL 205 14
Bromsgrove 27 2
Malvern 28 2
Redditch 19 1
Worcester 21 1

E-2
Local authority Electricity (MW Capacity) Percentage of Total (%)
Wychavon 38 3
Wyre Forest 26 2
WORCESTERSHIRE TOTAL 159 11
WEST MIDLANDS TOTAL 1474 100
Source: SQW
Table E-11 : Potential accessible solar heat resource, 2050
Local authority Electricity (MW Capacity) Percentage of Total (%)
Herefordshire 57 5
Telford & Wrekin 33 3
Shropshire 97 8
Stoke on Trent 48 4
Birmingham 178 15
Solihull 38 3
Coventry 54 4
Wolverhampton 45 4
Walsall 46 4
Sandwell 54 4
Dudley 74 6
Cannock Chase 19 2
East Staffordshire 27 2
Lichfield 22 2
Newcastle-under-Lyme 25 2
South Staffordshire 24 2
Stafford 36 3
Staffordshire Moorlands 24 2
Tamworth 13 1
STAFFORDSHIRE TOTAL 190 16
North Warwickshire 17 1
Nuneaton & Bedworth 72 6
Rugby 23 2
Stratford-on-Avon 37 3
Warwick 31 3

E-3
Local authority Electricity (MW Capacity) Percentage of Total (%)
WARWICKSHIRE TOTAL 181 15
Bromsgrove 20 2
Malvern 24 2
Redditch 15 1
Worcester 18 1
Wychavon 32 3
Wyre Forest 20 2
WORCESTERSHIRE TOTAL 130 11
WEST MIDLANDS TOTAL 1225 100
Source: SQW
Table E-12 : Potential accessible heat pump resource, 2050
Local authority Total electricity (MW capacity)
Air source heat pumps (MW capacity)
Ground source heat pumps (MW capacity)
Percentage of Total (%)
Herefordshire 507 405 101 4
Telford & Wrekin 315 252 63 3
Shropshire 889 711 178 8
Stoke on Trent 476 381 95 4
Birmingham 1743 1395 349 15
Solihull 368 294 74 3
Coventry 550 440 110 5
Wolverhampton 525 420 105 5
Walsall 450 360 90 4
Sandwell 480 384 96 4
Dudley 619 495 124 5
Cannock Chase 205 164 41 2
East Staffordshire 247 197 49 2
Lichfield 215 172 43 2
Newcastle-under-Lyme
236 189 47 2
South Staffordshire 219 175 44 2
Stafford 308 247 62 3
Staffordshire Moorlands
219 176 44 2

E-4
Local authority Total electricity (MW capacity)
Air source heat pumps (MW capacity)
Ground source heat pumps (MW capacity)
Percentage of Total (%)
Tamworth 130 104 26 1
STAFFORDSHIRE TOTAL
1780 1424 356 15
North Warwickshire 149 119 30 1
Nuneaton & Bedworth
475 380 95 4
Rugby 212 170 42 2
Stratford-on-Avon 338 271 68 3
Warwick 293 234 59 3
WARWICKSHIRE TOTAL
1467 1174 293 13
Bromsgrove 213 170 43 2
Malvern 228 182 46 2
Redditch 170 136 34 1
Worcester 204 163 41 2
Wychavon 326 261 65 3
Wyre Forest 224 179 45 2
WORCESTERSHIRE TOTAL
1365 1092 273 12
WEST MIDLANDS TOTAL
11535 9228 2307 100
Source: SQW

F-1
Annex F: Energy Crops Low Scenario
Table F-1 : Energy Crops Low Scenario
Local authority Electricity Capacity (MWe)
Heat Capacity (MWh) Percentage of Total (%)
Herefordshire 0.03 0.1 1
Telford & Wrekin 0.5 3 23
Shropshire 0.4 2 17
Stoke on Trent 0 0 0
Birmingham 0 0 0
Solihull 0 0 0
Coventry 0 0 0
Wolverhampton 0 0 0
Walsall 0 0 0
Sandwell 0 0 0
Dudley 0 0 0
Cannock Chase 0 0 0
East Staffordshire 0.2 1 8
Lichfield 0.2 0.8 6
Newcastle-under-Lyme 0.3 1 11
South Staffordshire 0.03 0.2 1
Stafford 0.6 3 25
Staffordshire Moorlands 0.01 0.05 0.4
Tamworth 0 0 0
STAFFORDSHIRE TOTAL 1 7 52
North Warwickshire 0 0 0
Nuneaton & Bedworth 0 0 0
Rugby 0.01 0.07 0.6
Stratford-on-Avon 0.01 0.07 0.5
Warwick 0 0 0
WARWICKSHIRE TOTAL 0.03 0.1 1
Bromsgrove 0.04 0.2 2
Malvern 0.05 0.2 2
Redditch 0 0 0

F-2
Local authority Electricity Capacity (MWe)
Heat Capacity (MWh) Percentage of Total (%)
Worcester 0 0 0
Wychavon 0.05 0.3 2
Wyre Forest 0 0 0
WORCESTERSHIRE TOTAL 0.1 0.8 6
WEST MIDLANDS TOTAL 2 13 100
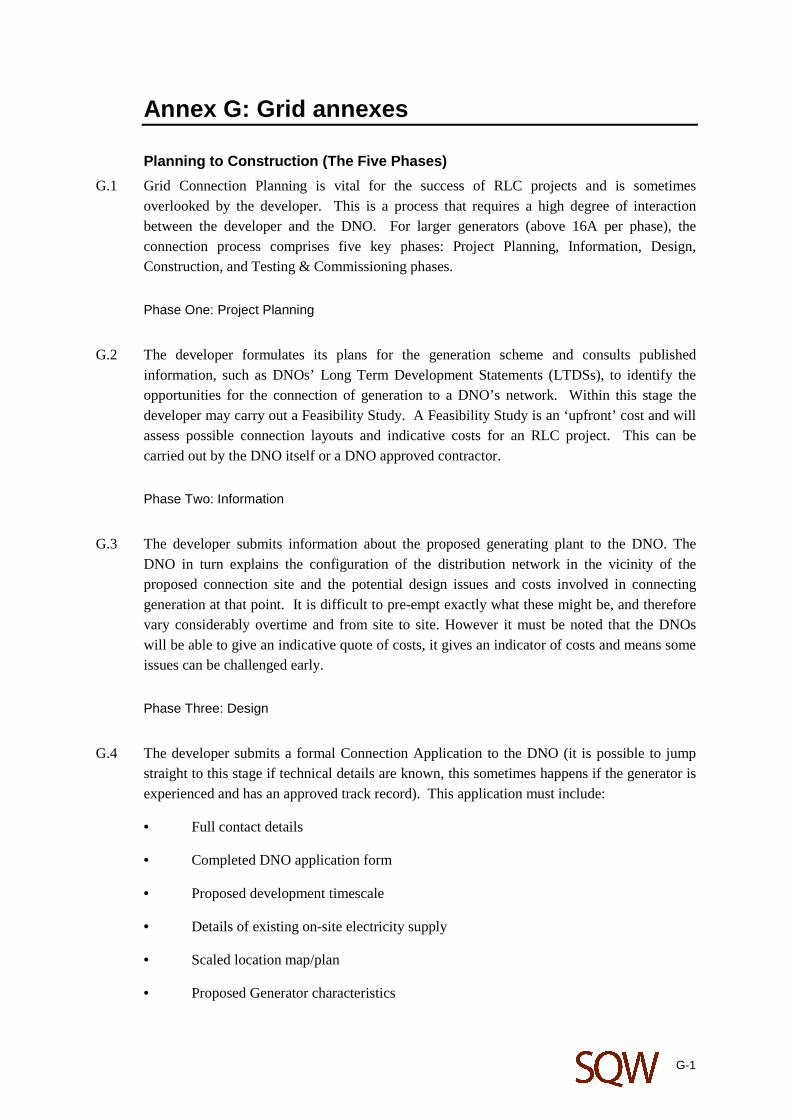
G-1
Annex G: Grid annexes
Planning to Construction (The Five Phases)
G.1 Grid Connection Planning is vital for the success of RLC projects and is sometimes overlooked by the developer. This is a process that requires a high degree of interaction between the developer and the DNO. For larger generators (above 16A per phase), the connection process comprises five key phases: Project Planning, Information, Design, Construction, and Testing & Commissioning phases.
Phase One: Project Planning
G.2 The developer formulates its plans for the generation scheme and consults published
information, such as DNOs’ Long Term Development Statements (LTDSs), to identify the opportunities for the connection of generation to a DNO’s network. Within this stage the developer may carry out a Feasibility Study. A Feasibility Study is an ‘upfront’ cost and will assess possible connection layouts and indicative costs for an RLC project. This can be carried out by the DNO itself or a DNO approved contractor.
Phase Two: Information
G.3 The developer submits information about the proposed generating plant to the DNO. The
DNO in turn explains the configuration of the distribution network in the vicinity of the proposed connection site and the potential design issues and costs involved in connecting generation at that point. It is difficult to pre-empt exactly what these might be, and therefore vary considerably overtime and from site to site. However it must be noted that the DNOs will be able to give an indicative quote of costs, it gives an indicator of costs and means some issues can be challenged early.
Phase Three: Design
G.4 The developer submits a formal Connection Application to the DNO (it is possible to jump
straight to this stage if technical details are known, this sometimes happens if the generator is experienced and has an approved track record). This application must include:
• Full contact details
• Completed DNO application form
• Proposed development timescale
• Details of existing on-site electricity supply
• Scaled location map/plan
• Proposed Generator characteristics

G-2
• Intended operational characteristics e.g. 24/7.
G.5 The DNO produces detailed connection designs and costings, and identifies how much of the connection construction work could be carried out by a third party (the Contestable Work) and how much the DNO must undertake itself (the Non-Contestable work).
G.6 These costs obviously depend on what the specifications are and where the site is. In general terms the engineer will look at the application on a site by site basis and will consider areas such as:
• Voltage Level Headroom – electrical current allowed on the network.
• Physical sign of assets – current infrastructure in the area, its condition, does it need upgrading.
• Integration with National Grid (NG) – cannot export to NG without an agreement, the RLC generator has an agreement with the DNO and also has an agreement with NG known as a TEC (Transmission Entry Capacity).
• This design phase can take up to 90 calendar days for the engineer to process the application3.
Phase Four: Construction
G.7 The developer enters into contracts with the DNO and, if so desired, a third party contractor
for the construction of the connection and these parties carry out the necessary physical works.
Phase Five: Testing & Commissioning
G.8 The DNO and the developer complete the necessary Connection and Use of System Agreements, the developer tests and commissions the generating plant (noting that the DNO may wish to witness these tests) and the DNO carries out the necessary tests on the connection and ‘energises’ it, thereby connecting the developer’s plant to the distribution network.
Connection Costs
G.9 The following table provides indicative costs for some of the main elements of this work.
Table G-1 : Indicative costs for connection works:
Works Approx. Cost
Cable trenching and reinstatement
In public highway (tarmac) £50-£100 per metre
In fields or rough ground £20-£40 per metre
3 Jarrett,K, et al. DTI, Feb 2004

G-3
Works Approx. Cost
11kV equipment* (up to 5MW capacity)
Underground cable £20-£50 per metre
Overhead line £10-£45 per metre
Switching substation (no transformer) £15,000-£50,000
33kV equipment* (up to 20MW capacity)
underground cable £20-£100 per metre
Overhead line £20-£55 per metre
Switching substation (no transformer) £100,000-£250,000
Source: Maslen Environment (*costs include supply, installation, testing and commissioning, but excludes O&M).132kV costs vary widely and indicative costs cannot be presented.
G.10 For costs such as trenching and cabling it depends greatly on the length of circuit or distance required. The lower unit costs in the table only apply to cases where several kilometres of circuit are needed. Developers should note that these are estimates and relate only to the cost of the infrastructure on the DNO side of the 'point of supply' and is possible that not all of the reinforcement costs will have been included.
G.11 In addition to the DNO connection charges (within the five planning to construction phases), there are a number of other charges which developers should be aware of, these can include:
• Distribution use-of-system charges – charges vary in accordance with Price Control Reviews carried out by Ofgem.
• Top-up and stand-by charges – Top-up supplies cover any routine shortfall between the output of the generator and the on-site demand. Stand-by supplies cover demands in exceptional circumstances such as generator outages or to cover the generator’s own auxiliary load during start-up.
• Metering and data management charges - Distributed generation is bound by certain metering and data management requirements - the developer must contract services of Meter Operators.
• Charges for use of the National Grid transmission system - If NG needs to carry out work on the NG system in order to accommodate the generating plant, connection may be delayed. NG will generally charge their connected customer - the DNO - for the work it carries out. The DNO is likely to pass this cost on to the developer.