Embed Size (px)
Citation preview
Renewable Energy Build Out: Progress to Date and the Path Ahead
Steven G. ChalkDeputy Assistant Secretary for Renewable EnergyU.S. Department of Energy
August 4, 2008

U.S. Renewable Electricity Capacity by
Source (2000-2007)
Status of Renewable Electricity in the U.S.
Although renewable energy (excluding hydropower) is still a relatively small portion of both U.S. and global electricity supplies, U.S. renewable energy installations have nearly doubled since 2000
Sources: EIA, AWEA, IEA PVPS, Navigant, SEIA, GEA
MW
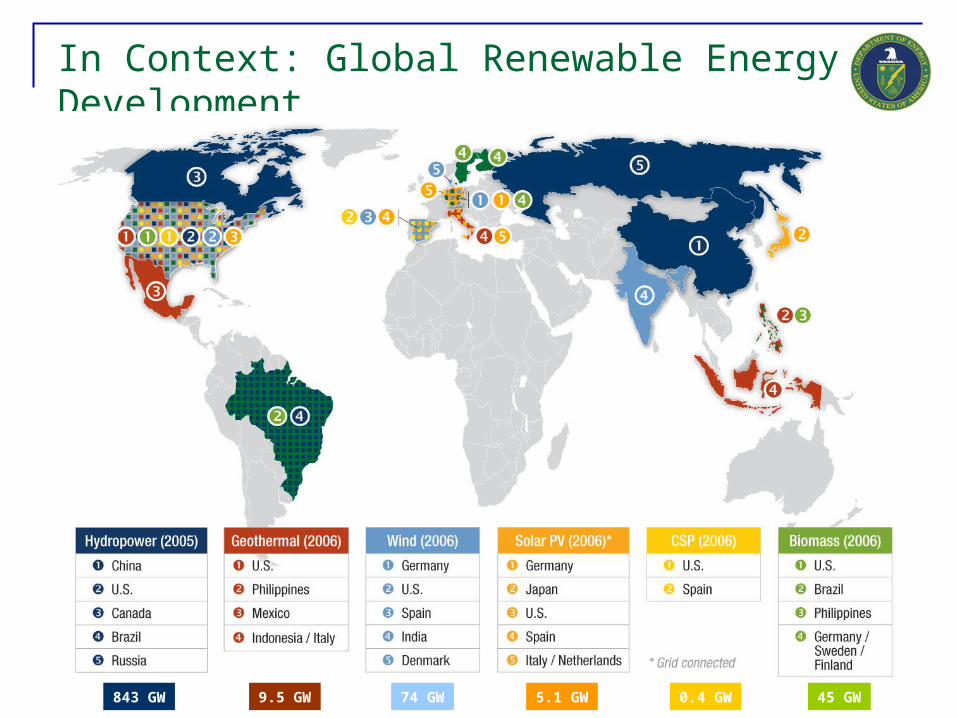
In Context: Global Renewable Energy Development
843 GW 9.5 GW 74 GW 5.1 GW 0.4 GW 45 GW

0
10
20
30
40
50
60
70
80
90
2002 2003 2004 2005 2006 2007 (projected)
UnitedStates
EuropeanUnion
2006EU: 9.1% of total installed capacityUS: 2.5% of total installed capacity
Renewable Electricity Installed Capacity (2002-2007) –United States and the European Union
Gig
aw
att
s
United States European Union
GDP (2006) $13,060 Billion $13,080 Billion
Total Nameplate Capacity (2006) 1,076 GW 720 GW
*Excludes Hydropower
What Europe has done to promote GW-scale clean energy:
• EU renewable energy targets have been in place since 1997
• In March 2007, EU leaders reached a binding agreement that 20% of the 27 member countries’ energy should be produced from renewable sources by 2020
• Individual countries have large incentives for RE development, including renewable portfolio standards, feed-in tariffs, capital subsidies, and other fiscal incentives
• Instituted stable, long-term policies
Germany’s Renewable Energy Sources Act (EEG) first regulated feed-in tariffs in 1991, and underwent major updates in 2000 and 2004. EEG stipulates purchase amounts of renewable energy for local power companies (with feed-in tariffs provided for a set duration at a declining rate).
.
U.S. and European Renewable Electricity Installed Capacity*U.S. and European Renewable Electricity Installed Capacity*
Although total electric capacity is lower in the European Union than the United States, the EU has more renewable electricity capacity installed

Past Investments Have Dramatically Reduced Renewable Energy Costs

Renewable energy can come online at a rate and scale that matters
0%
20%
40%
60%
80%
100%
2000 2001 2002 2003 2004 2005 2006 2007
Per
cen
t o
f A
nn
ua
l Ca
pa
city
Ad
diti
ons
0
20
40
60
80
100
To
tal A
nn
ua
l Ca
pa
city
Ad
diti
on
s (G
W)
Wind Other Renewable
Gas (CCGT) Gas (non-CCGT)
Coal Other non-Renewable
Total Capacity Additions (right axis)
Source: EIA, Ventyx, AWEA, IREC, Berkeley Lab
Renewable energy has been contributing to a growing portion of U.S. electric capacity additions (40% in 2007; up from 1% in 2002)
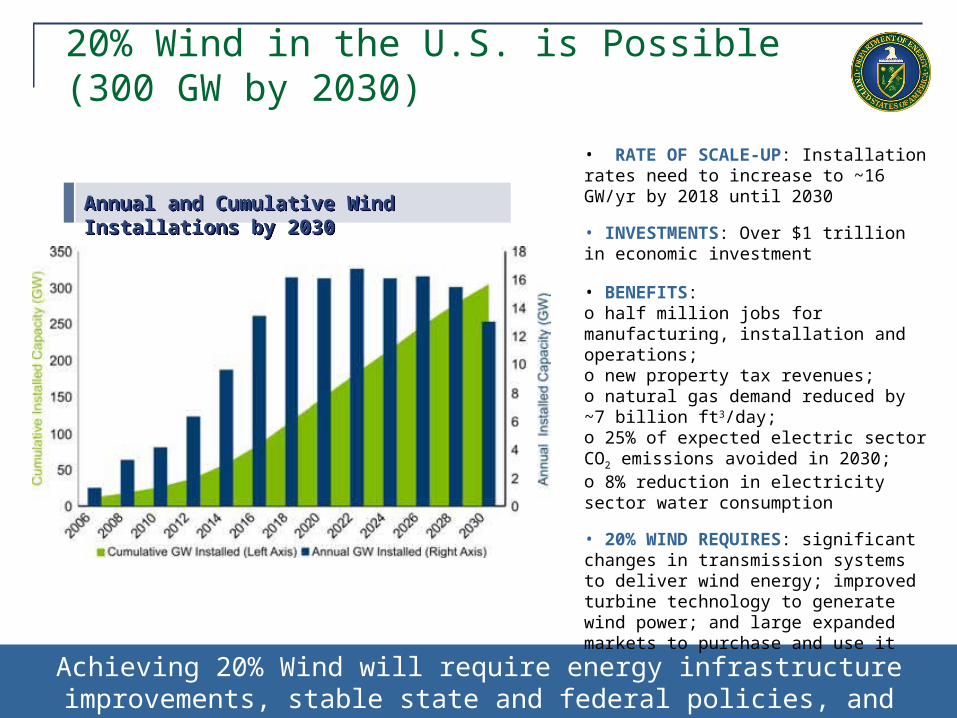
20% Wind in the U.S. is Possible (300 GW by 2030)
Annual and Cumulative Wind Installations by 2030Annual and Cumulative Wind Installations by 2030
Achieving 20% Wind will require energy infrastructure improvements, stable state and federal policies, and technology improvements
• RATE OF SCALE-UP: Installation rates need to increase to ~16 GW/yr by 2018 until 2030
• INVESTMENTS: Over $1 trillion in economic investment
• BENEFITS: o half million jobs for manufacturing, installation and operations; o new property tax revenues; o natural gas demand reduced by ~7 billion ft3/day; o 25% of expected electric sector CO2 emissions avoided in 2030; o 8% reduction in electricity sector water consumption
• 20% WIND REQUIRES: significant changes in transmission systems to deliver wind energy; improved turbine technology to generate wind power; and large expanded markets to purchase and use it
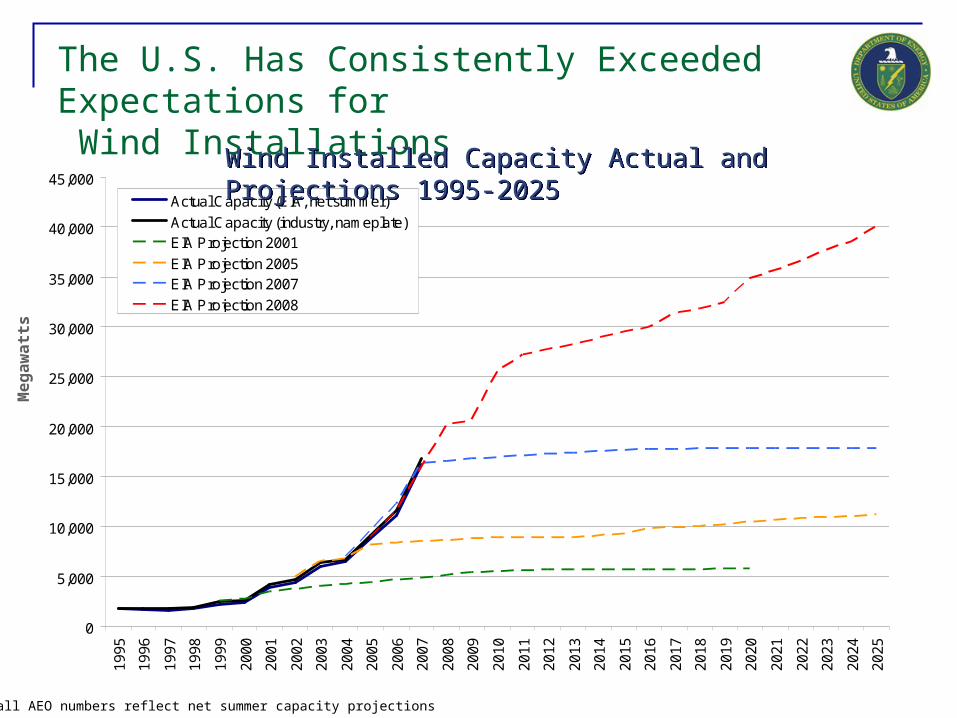
The U.S. Has Consistently Exceeded Expectations for Wind Installations
0
5,000
10,000
15,000
20,000
25,000
30,000
35,000
40,000
45,000
19
95
19
96
19
97
19
98
19
99
20
00
20
01
20
02
20
03
20
04
20
05
20
06
20
07
20
08
20
09
20
10
20
11
20
12
20
13
20
14
20
15
20
16
20
17
20
18
20
19
20
20
20
21
20
22
20
23
20
24
20
25
Actual Capacity (EIA, net summer)
Actual Capacity (industry, nameplate)EIA Projection 2001
EIA Projection 2005EIA Projection 2007
EIA Projection 2008
Note: all AEO numbers reflect net summer capacity projections
Me
ga
wa
tts
Wind Installed Capacity Actual and Projections 1995-2025Wind Installed Capacity Actual and Projections 1995-2025

• Enhanced Geothermal Systems (EGS): engineered reservoirs that have been stimulated to extract economical amounts of heat from unproductive geothermal resources.
• DOE-sponsored, MIT-led study “The Future of Geothermal Energy”
• Found: potential to tap up to 100 GW of energy in the first 10 km of rock underneath the U.S. by 2050 (one-tenth of current U.S. generating capacity)
• Congress funded DOE Geothermal Program in Fiscal Year 2008 with $20 million – this is being used primarily to explore R&D and demonstration projects of EGS systems
EGS Exploration and DevelopmentEGS Exploration and Development
Future GW-Scale Renewable Energy Technologies: Enhanced Geothermal Systems (EGS)

Opportunity to limit the risk of substantial upfront drilling costs of geothermal energy (hydrothermal and EGS)
The Problem: High risk, significant early-
stage drilling costs necessary to quantify
geothermal potential of a site inhibit the deployment of
geothermal energy.
Potential Solution: Cost-Shared Exploratory Drilling Program
• Developer must have an adequate resource site and ability to successfully develop and finance the project in order to be eligible for funding.
• Government provides ~30% cost for drilling exploratory wells; developer provides other ~70%. Government cost-share may vary depending on risk.
• Developer repays government (with interest) upon drilling a successful well.• Information obtained from drilling both successful & unsuccessful wells is
provided to the government.• Government compiles a database of drilling information.
U.S. EGS Resource Map (10 km depth)U.S. EGS Resource Map (10 km depth)

New Effort: Water Power Technologies
• It is estimated the resource potential of ocean energy is on par with conventional hydropower (which currently makes up 7% of U.S. electricity generation)
Worldwide Commercial Plants in Operation
Type/
Project NameLocation Technology
Size (MW)
Year of Op.
WAVE
Aguçadora Wave ParkPóvoa de Varzim, Portugal
Pelamis Wave Energy Converter 2.25 2007
TIDAL
RITE ProjectEast River, New York
Verdant Free Flow Turbines 0.120 2007
TIDAL
Annapolis Royal PlantBay of Fundy, Nova Scotia
Tidal barrage; Straflo turbine-generator 20 1984
TIDAL
La RanceBretagne, France Tidal barrage, Bulb
Turbines 240 1966
Wave: Pelamis—Ocean Power Delivery
Tidal: Verdant—Power RITE Turbine
• Fiscal Year 2008 – Congress appropriated $10 million for Water Power R&D

Pro
du
ctRoadblocks to Renewable Energy Growth
Barriers Potential Solutions
TransmissionPlan, build and pay for new transmission using the Power Marketing Authorities’ eminent domain; build cost of transmission into electricity purchase price
Grid integrationIncreased R&D and public-private collaboration for load balancing and RE storage technologies; experiment in suitable sites, such as Hawaii
Siting Interagency collaboration (e.g., between DOE and DOI) that works to create Programmatic Environmental Impact Statements and open federal lands for RE developmentPermitting
Public perception and education
Promote link between greenpower and siting/permitting/transmission
Financing
Recognition of life cycle costing; Use power purchasing authority of the government to stimulate development (to meet pre-existing EPAct 2005 goals); Loan guarantees; Clean Energy Bank; Long-term power purchase agreements
Manufacturing and materialsIncentives for domestic, high-quality materials and manufacturing supply-
chain to support rapid growth; strategic materials
Qualified workforce development
Partner with universities, community colleges, and vocational schools to expand curricula and enrollment
Uncertain policy environment (e.g., on-again-off-again production tax credit)
Need for stable, long-term production incentives that are phased out over time. Need policies for investors (for capital risk, supply-chain development, project development cycle, etc.)
Access to: 1. Market 2. Capital 3. Product
Mar
ket
Ca
pita
l
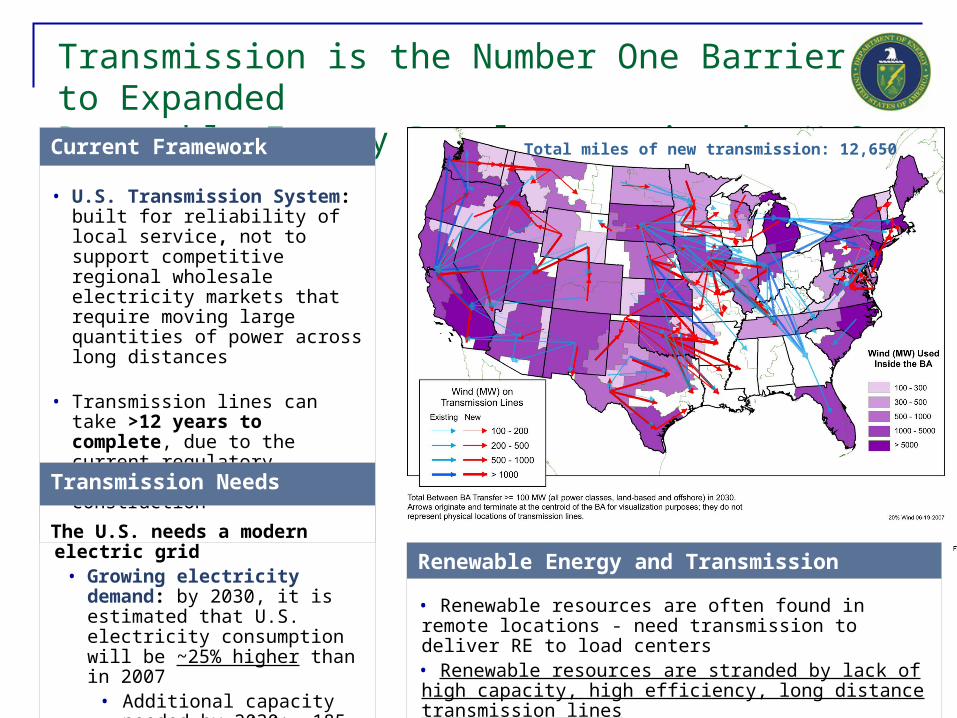
Transmission is the Number One Barrier to Expanded Renewable Energy Development in the U.S.
Current Framework
• U.S. Transmission System: built for reliability of local service, not to support competitive regional wholesale electricity markets that require moving large quantities of power across long distances
• Transmission lines can take >12 years to complete, due to the current regulatory environment, planning and construction
Transmission Needs
The U.S. needs a modern electric grid
• Growing electricity demand: by 2030, it is estimated that U.S. electricity consumption will be ~25% higher than in 2007
• Additional capacity needed by 2030: ~185 GW
Total miles of new transmission: 12,650
Renewable Energy and Transmission
• Renewable resources are often found in remote locations - need transmission to deliver RE to load centers• Renewable resources are stranded by lack of high capacity, high efficiency, long distance transmission lines
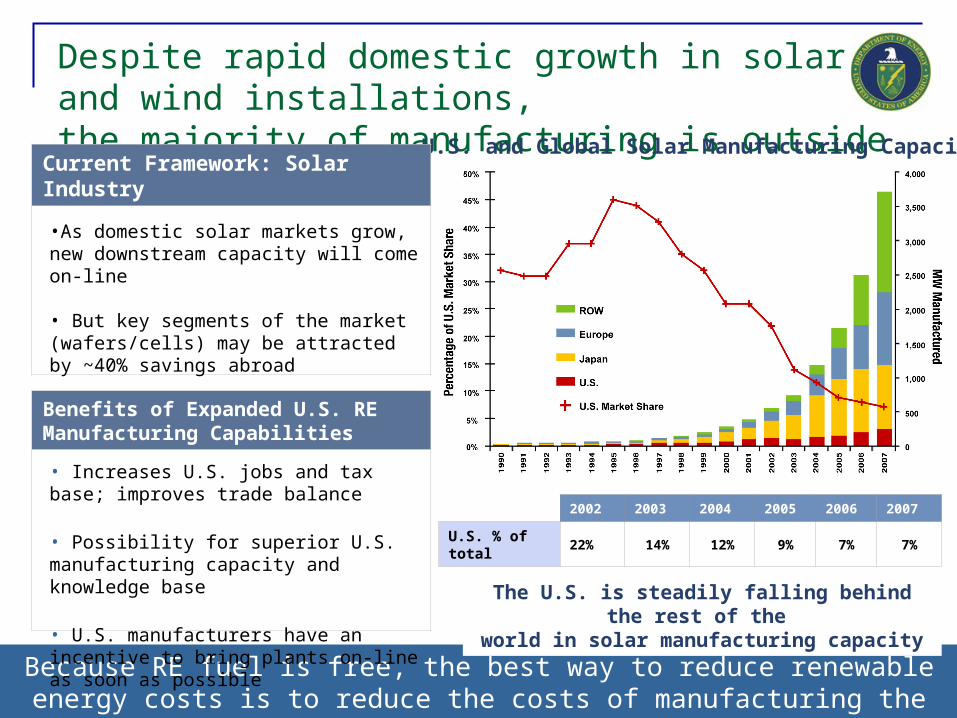
Despite rapid domestic growth in solar and wind installations, the majority of manufacturing is outside the U.S.
Because RE fuel is free, the best way to reduce renewable energy costs is to reduce the costs of manufacturing the ‘widgets;’ manufacturing also creates jobs and RE expertise within the U.S.
The U.S. is steadily falling behind the rest of the world in solar manufacturing capacity
2002 2003 2004 2005 2006 2007
U.S. % of total 22% 14% 12% 9% 7% 7%
U.S. and Global Solar Manufacturing CapacityCurrent Framework: Solar Industry
•As domestic solar markets grow, new downstream capacity will come on-line
• But key segments of the market (wafers/cells) may be attracted by ~40% savings abroad
Benefits of Expanded U.S. RE Manufacturing Capabilities
• Increases U.S. jobs and tax base; improves trade balance
• Possibility for superior U.S. manufacturing capacity and knowledge base
• U.S. manufacturers have an incentive to bring plants on-line as soon as possible
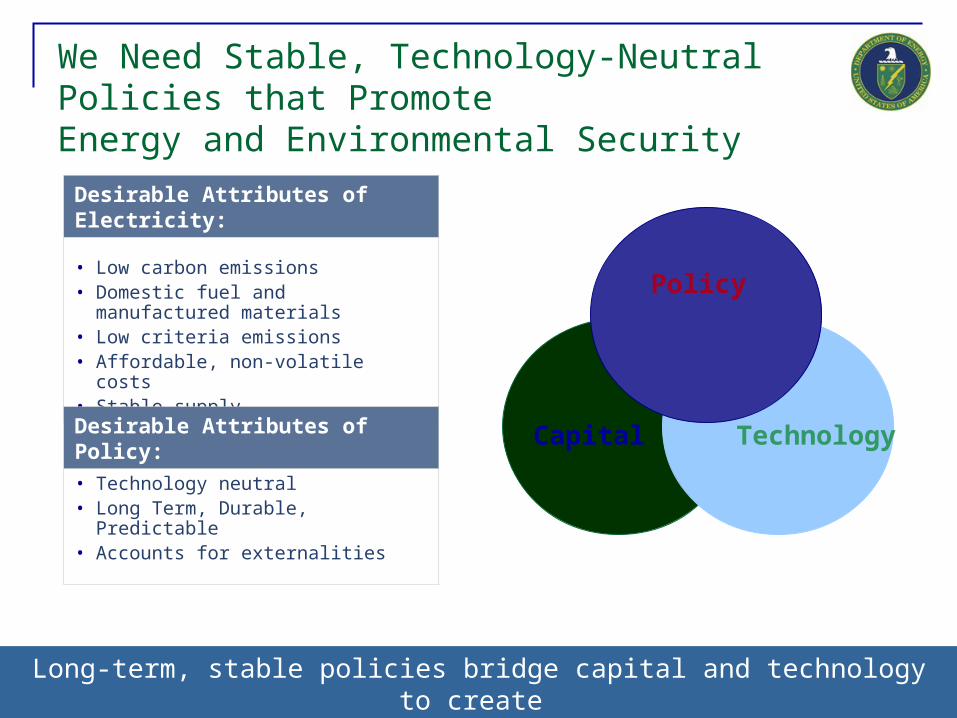
We Need Stable, Technology-Neutral Policies that Promote Energy and Environmental Security
Long-term, stable policies bridge capital and technology to create a robust renewable energy market
Desirable Attributes of Electricity:
• Low carbon emissions• Domestic fuel and manufactured
materials• Low criteria emissions• Affordable, non-volatile costs• Stable supply
Desirable Attributes of Policy:
• Technology neutral• Long Term, Durable, Predictable• Accounts for externalities
Capital Technology
Policy