Embed Size (px)
Citation preview
lable at ScienceDirect
Renewable Energy 35 (2010) 2094e2101
Contents lists avai
Renewable Energy
journal homepage: www.elsevier .com/locate/renene
Renewable electricity consumption in the EU-27: Are cross-countrydifferences diminishing?
Adolfo Maza*, María Hierro, José VillaverdeUniversity of Cantabria, Department of Economics, Avda. de los Castros s/n, 39005 Santander, Spain
a r t i c l e i n f o
Article history:Received 2 September 2009Accepted 13 February 2010Available online 12 March 2010
Keywords:Density functionHighest density regionRenewable electricityViolin plots and b convergence
* Corresponding author. Tel.: þ34 942 201652; fax:E-mail address: [email protected] (A. Maza).
1 The acronym EU refers to the European Union of2 Other positive features of RES-E are its low risk,
(Verbruggen, 2008 [1]).3 The EU is a good example of applied electricity ref
effective competition to energy markets (Glachant an
0960-1481/$ e see front matter � 2010 Elsevier Ltd.doi:10.1016/j.renene.2010.02.012
a b s t r a c t
The aim of this paper is to analyse cross-country differences for shares of renewable electricity in the EU-27 for the period 1996e2005. We carry out a standard convergence analysis and then examine theevolution of the entire distribution, namely the external shape, intra-distributional dynamics and ergodicdistribution. Our main results are as follows. First, there has been a clear convergence pattern forrenewable electricity shares across countries. Second, the shape of the distribution has varied signifi-cantly over time, with more countries positioned around the mean in 2005 than in 1996. Third, theanalysis shows that intra-distributional mobility has been relatively high, especially in those countrieswith the highest share in the initial year of our sample. Fourth, in spite of this, large cross-countrydifferences will likely persist for RES-E shares in the hypothetical long-term equilibrium, which impliesthat a major impulse to national RES-E support policies will be necessary in the coming years to shortenthis gap.
� 2010 Elsevier Ltd. All rights reserved.
1. Introduction
Generating electricity from renewable energy sources (“RES-E”)represents a promising option for the European Union (EU)1 asa whole and for each Member State. The increase in the supply ofRES-E provides invaluable environmental benefits in regard togreenhouse gas emissions, thus playing an important role inmitigating climate change according to the EU's commitment for2012 and beyond.2 From an economic point of view, severalbenefits stem from RES-E promotion, such as the generation oflocal job opportunities (Scott et al., 2008 [2]), the development ofnew technologies that can stimulate competitiveness in theenergy sector,3 and the reduction of EU dependence on traditionalsources of imported energy. This last question is especiallychallenging for the EU. The expanding globalization and risingstandards of living are likely to cause a higher per capita electricitydemand in the EU in the near future, and this increased demandcould exacerbate the already serious economic problem ofvulnerability related to fossil-fuel import dependency and
þ34 942 201603.
27 Member Countries.affordability and accessibility
orms intending to bring mored Lévêque, 2008 [3]).
All rights reserved.
increasing energy prices4 (Meyer, 2003; Coenraads and Voogt,2006; Hillebrand et al., 2006; Ragwitz and Huber, 2006; Henriquesand Sadorsky, 2008 [5e9]).
During the last few years, renewable energy policies in the EUand the corresponding academic discussion on their effectivenesshave come to the forefront of European policy debate. In regard tothe electricity sector, the first directive on the promotion of elec-tricity from renewable energy sources in the internal electricitymarket (EU Directive 2001/77/EC) was the primary step towardspromoting a common EU strategy to support renewable electricity.To this aim, Article 3 of this Directive established a target goal of22% of gross electricity produced from renewable energy sources inthe EU-15 (and 21% in the EU-25) by 2010 (European Commission,2001 [10]). National target goals were also imposed, although it wasleft to individual Member States to choose the most convenientnational support scheme. However, despite strong policy efforts onthis issue and a dynamic market development, most of the currentEU countries are very far from the ambitious targets set forth forthem by the European Commission (Huber et al., 2006 [11]).
Themotivation of the current paper differs from that of previouspapers on RES-E, which have been devoted to analyzing the
4 According to the projections on energy and transport for the EU-25 (EuropeanCommission, 2004 [4]), energy import dependency is expected to reach 67.5% in theyear 2030, up from 49.7% in the year 2005, whereas energy demand is expected tobe 22% higher in 2030 than in 2005.
A. Maza et al. / Renewable Energy 35 (2010) 2094e2101 2095
effectiveness of supporting policies in the EU (Harmelink et al.,2004; Del Río, 2005; Palmer and Burtraw, 2005; Held et al., 2006;Verhaegen et al., 2007 [12e16]). Development of renewableelectricity seems to be a primary option for meeting the EU'sinterest in mitigating climate change. However, the role ofrenewable power generation differs substantially across EUcountries. As a result environmental benefits may not be whollyreaped by countries with large RES-E shares because of the negativeenvironmental spillovers produced by countries with low RES-Eshares. An increase in RES-E shares of all EU countries, especiallythose with lower values could reduce these spillovers and improveenvironmental conditions across Europe. The aim of this paper is toasses whether European policies and the various national efforts inpromoting RES-E have led to a reduction in the large gaps acrossEuropean countries for RES-E shares, that is, whether there existsa pattern of convergence.
This article also was intended to fill a gap in the RES-E literature.To the best of our knowledge, this is the first time a study that, byusing various methodological approaches taken from the literatureon economic growth, has dealt with the evolution of cross-countrydisparities in RES-E shares. To accomplish this, we make use ofEUROSTAT data for the 27 EU countries between 1996 and 2005. Thedata, which include domestic electricity production as well aselectricity imports minus electricity exports, consist on carefullyconstructed and fully comparable series of electricity fromrenewable energy sources - hydro plants (excluding pumping),wind, solar, geothermal and biomass/wastes - as a percentage ofgross electricity consumption.5
Methodologically, we begin by applying the classical concepts ofs and b convergence. This analysis, however, presents somedrawbacks since it does not examine the entire distribution butonly its first moments (see, e.g., Quah, 1996 [18]). For this reason,following the approach employed in Maza and Villaverde (2008)[19], we explore the dynamics of the RES-E distribution by usinga novel visualisation technique; namely, box plots based on highestdensity regions (Hyndman et al., 1996 [20]). However, unlike Mazaand Villaverde (2008) [19] and due to the small number of obser-vations in our sample, we employ an adaptive kernel estimatorwith flexible bandwidths.
The remainder of this paper is organised as follows. A classicalanalysis of RES-E share convergence is provided in Section 2. InSection 3, we go deeply into the study of national disparities by firstexamining the external shape of the distribution, and second themovements within the distribution. Finally, in Section 4 wesummarize our main results and offer several policy suggestions.
2. RES-E national shares in the EU: a classical analysis ofconvergence
This section is aimed at providing insight into the national RES-Eshare convergence in the EU for the 1996e2005 period. As ourstarting point, we consider the existing differences between EU
5 The nature and structure of the renewable energy market negatively affect datareliability when compared to those for the traditional fossil fuels. Regarding datacollection and methodological treatment, it is necessary to note that renewableenergy statistics are currently colleted on the base of annual joint questionnairesshared by EUROSTAT and the EIA (http://epp.eurostat.ec.europa.eu/cache/ITY_SDDS/Annexes/nrg_indic_sm1_an13.pdf), which provide data on the last reference yearand revisions for the year before. Data are then treated to find inconsistencies,eliminate duplicate entries, and confirm that RES-E figures are meaningful for theinstalled capacity of the installation. For reasons of homogeneity and to allow theaddition of different sources, data reported are converted to common units. In anycase, for an analysis about the problems involved in the collection of data and theproposal of a methodology for validating renewable energy data, see Doukas et al.(2007) [17].
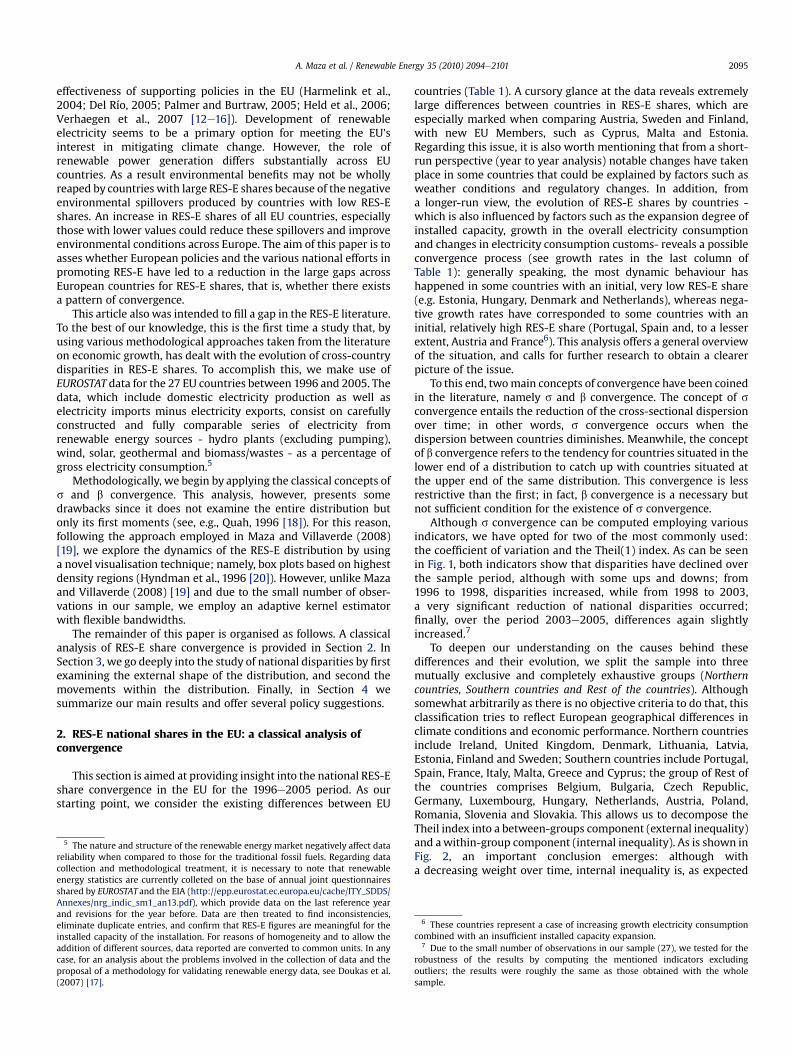
countries (Table 1). A cursory glance at the data reveals extremelylarge differences between countries in RES-E shares, which areespecially marked when comparing Austria, Sweden and Finland,with new EU Members, such as Cyprus, Malta and Estonia.Regarding this issue, it is also worth mentioning that from a short-run perspective (year to year analysis) notable changes have takenplace in some countries that could be explained by factors such asweather conditions and regulatory changes. In addition, froma longer-run view, the evolution of RES-E shares by countries -which is also influenced by factors such as the expansion degree ofinstalled capacity, growth in the overall electricity consumptionand changes in electricity consumption customs- reveals a possibleconvergence process (see growth rates in the last column ofTable 1): generally speaking, the most dynamic behaviour hashappened in some countries with an initial, very low RES-E share(e.g. Estonia, Hungary, Denmark and Netherlands), whereas nega-tive growth rates have corresponded to some countries with aninitial, relatively high RES-E share (Portugal, Spain and, to a lesserextent, Austria and France6). This analysis offers a general overviewof the situation, and calls for further research to obtain a clearerpicture of the issue.
To this end, twomain concepts of convergence have been coinedin the literature, namely s and b convergence. The concept of sconvergence entails the reduction of the cross-sectional dispersionover time; in other words, s convergence occurs when thedispersion between countries diminishes. Meanwhile, the conceptof b convergence refers to the tendency for countries situated in thelower end of a distribution to catch up with countries situated atthe upper end of the same distribution. This convergence is lessrestrictive than the first; in fact, b convergence is a necessary butnot sufficient condition for the existence of s convergence.
Although s convergence can be computed employing variousindicators, we have opted for two of the most commonly used:the coefficient of variation and the Theil(1) index. As can be seenin Fig. 1, both indicators show that disparities have declined overthe sample period, although with some ups and downs; from1996 to 1998, disparities increased, while from 1998 to 2003,a very significant reduction of national disparities occurred;finally, over the period 2003e2005, differences again slightlyincreased.7
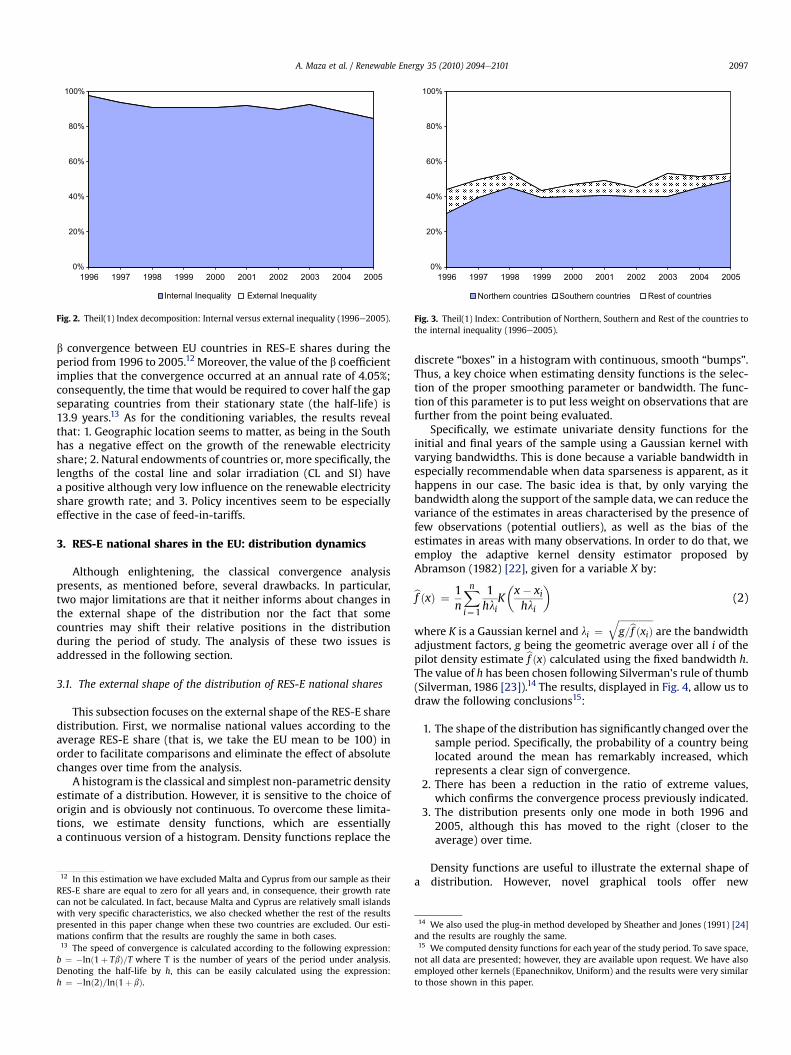
To deepen our understanding on the causes behind thesedifferences and their evolution, we split the sample into threemutually exclusive and completely exhaustive groups (Northerncountries, Southern countries and Rest of the countries). Althoughsomewhat arbitrarily as there is no objective criteria to do that, thisclassification tries to reflect European geographical differences inclimate conditions and economic performance. Northern countriesinclude Ireland, United Kingdom, Denmark, Lithuania, Latvia,Estonia, Finland and Sweden; Southern countries include Portugal,Spain, France, Italy, Malta, Greece and Cyprus; the group of Rest ofthe countries comprises Belgium, Bulgaria, Czech Republic,Germany, Luxembourg, Hungary, Netherlands, Austria, Poland,Romania, Slovenia and Slovakia. This allows us to decompose theTheil index into a between-groups component (external inequality)and awithin-group component (internal inequality). As is shown inFig. 2, an important conclusion emerges: although witha decreasing weight over time, internal inequality is, as expected
6 These countries represent a case of increasing growth electricity consumptioncombined with an insufficient installed capacity expansion.
7 Due to the small number of observations in our sample (27), we tested for therobustness of the results by computing the mentioned indicators excludingoutliers; the results were roughly the same as those obtained with the wholesample.
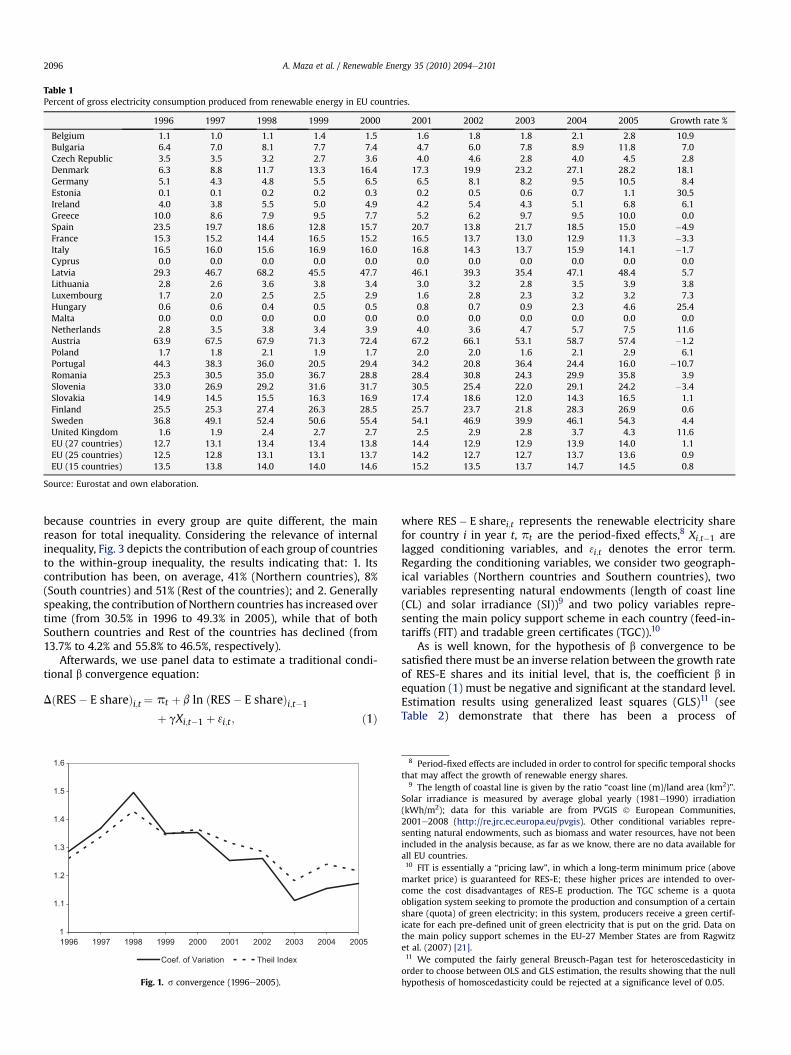
Table 1Percent of gross electricity consumption produced from renewable energy in EU countries.
1996 1997 1998 1999 2000 2001 2002 2003 2004 2005 Growth rate %
Belgium 1.1 1.0 1.1 1.4 1.5 1.6 1.8 1.8 2.1 2.8 10.9Bulgaria 6.4 7.0 8.1 7.7 7.4 4.7 6.0 7.8 8.9 11.8 7.0Czech Republic 3.5 3.5 3.2 2.7 3.6 4.0 4.6 2.8 4.0 4.5 2.8Denmark 6.3 8.8 11.7 13.3 16.4 17.3 19.9 23.2 27.1 28.2 18.1Germany 5.1 4.3 4.8 5.5 6.5 6.5 8.1 8.2 9.5 10.5 8.4Estonia 0.1 0.1 0.2 0.2 0.3 0.2 0.5 0.6 0.7 1.1 30.5Ireland 4.0 3.8 5.5 5.0 4.9 4.2 5.4 4.3 5.1 6.8 6.1Greece 10.0 8.6 7.9 9.5 7.7 5.2 6.2 9.7 9.5 10.0 0.0Spain 23.5 19.7 18.6 12.8 15.7 20.7 13.8 21.7 18.5 15.0 �4.9France 15.3 15.2 14.4 16.5 15.2 16.5 13.7 13.0 12.9 11.3 �3.3Italy 16.5 16.0 15.6 16.9 16.0 16.8 14.3 13.7 15.9 14.1 �1.7Cyprus 0.0 0.0 0.0 0.0 0.0 0.0 0.0 0.0 0.0 0.0 0.0Latvia 29.3 46.7 68.2 45.5 47.7 46.1 39.3 35.4 47.1 48.4 5.7Lithuania 2.8 2.6 3.6 3.8 3.4 3.0 3.2 2.8 3.5 3.9 3.8Luxembourg 1.7 2.0 2.5 2.5 2.9 1.6 2.8 2.3 3.2 3.2 7.3Hungary 0.6 0.6 0.4 0.5 0.5 0.8 0.7 0.9 2.3 4.6 25.4Malta 0.0 0.0 0.0 0.0 0.0 0.0 0.0 0.0 0.0 0.0 0.0Netherlands 2.8 3.5 3.8 3.4 3.9 4.0 3.6 4.7 5.7 7.5 11.6Austria 63.9 67.5 67.9 71.3 72.4 67.2 66.1 53.1 58.7 57.4 �1.2Poland 1.7 1.8 2.1 1.9 1.7 2.0 2.0 1.6 2.1 2.9 6.1Portugal 44.3 38.3 36.0 20.5 29.4 34.2 20.8 36.4 24.4 16.0 �10.7Romania 25.3 30.5 35.0 36.7 28.8 28.4 30.8 24.3 29.9 35.8 3.9Slovenia 33.0 26.9 29.2 31.6 31.7 30.5 25.4 22.0 29.1 24.2 �3.4Slovakia 14.9 14.5 15.5 16.3 16.9 17.4 18.6 12.0 14.3 16.5 1.1Finland 25.5 25.3 27.4 26.3 28.5 25.7 23.7 21.8 28.3 26.9 0.6Sweden 36.8 49.1 52.4 50.6 55.4 54.1 46.9 39.9 46.1 54.3 4.4United Kingdom 1.6 1.9 2.4 2.7 2.7 2.5 2.9 2.8 3.7 4.3 11.6EU (27 countries) 12.7 13.1 13.4 13.4 13.8 14.4 12.9 12.9 13.9 14.0 1.1EU (25 countries) 12.5 12.8 13.1 13.1 13.7 14.2 12.7 12.7 13.7 13.6 0.9EU (15 countries) 13.5 13.8 14.0 14.0 14.6 15.2 13.5 13.7 14.7 14.5 0.8
Source: Eurostat and own elaboration.
A. Maza et al. / Renewable Energy 35 (2010) 2094e21012096
because countries in every group are quite different, the mainreason for total inequality. Considering the relevance of internalinequality, Fig. 3 depicts the contribution of each group of countriesto the within-group inequality, the results indicating that: 1. Itscontribution has been, on average, 41% (Northern countries), 8%(South countries) and 51% (Rest of the countries); and 2. Generallyspeaking, the contribution of Northern countries has increased overtime (from 30.5% in 1996 to 49.3% in 2005), while that of bothSouthern countries and Rest of the countries has declined (from13.7% to 4.2% and 55.8% to 46.5%, respectively).
Afterwards, we use panel data to estimate a traditional condi-tional b convergence equation:
DðRES� E shareÞi;t ¼ pt þ b ln ðRES� E shareÞi;t�1
þ gXi;t�1 þ 3i;t ; ð1Þ
1
1.1
1.2
1.3
1.4
1.5
1.6
1996 1997 1998 1999 2000 2001 2002 2003 2004 2005
Coef. of Variation Theil Index
Fig. 1. s convergence (1996e2005).
where RES� E sharei;t represents the renewable electricity sharefor country i in year t, pt are the period-fixed effects,8 Xi;t�1 arelagged conditioning variables, and 3i;t denotes the error term.Regarding the conditioning variables, we consider two geograph-ical variables (Northern countries and Southern countries), twovariables representing natural endowments (length of coast line(CL) and solar irradiance (SI))9 and two policy variables repre-senting the main policy support scheme in each country (feed-in-tariffs (FIT) and tradable green certificates (TGC)).10
As is well known, for the hypothesis of b convergence to besatisfied there must be an inverse relation between the growth rateof RES-E shares and its initial level, that is, the coefficient b inequation (1) must be negative and significant at the standard level.Estimation results using generalized least squares (GLS)11 (seeTable 2) demonstrate that there has been a process of
8 Period-fixed effects are included in order to control for specific temporal shocksthat may affect the growth of renewable energy shares.
9 The length of coastal line is given by the ratio “coast line (m)/land area (km2)”.Solar irradiance is measured by average global yearly (1981e1990) irradiation(kWh/m2); data for this variable are from PVGIS � European Communities,2001e2008 (http://re.jrc.ec.europa.eu/pvgis). Other conditional variables repre-senting natural endowments, such as biomass and water resources, have not beenincluded in the analysis because, as far as we know, there are no data available forall EU countries.10 FIT is essentially a “pricing law”, in which a long-term minimum price (abovemarket price) is guaranteed for RES-E; these higher prices are intended to over-come the cost disadvantages of RES-E production. The TGC scheme is a quotaobligation system seeking to promote the production and consumption of a certainshare (quota) of green electricity; in this system, producers receive a green certif-icate for each pre-defined unit of green electricity that is put on the grid. Data onthe main policy support schemes in the EU-27 Member States are from Ragwitzet al. (2007) [21].11 We computed the fairly general Breusch-Pagan test for heteroscedasticity inorder to choose between OLS and GLS estimation, the results showing that the nullhypothesis of homoscedasticity could be rejected at a significance level of 0.05.
0%
20%
40%
60%
80%
100%
1996 1997 1998 1999 2000 2001 2002 2003 2004 2005
Northern countries Southern countries Rest of countries
Fig. 3. Theil(1) Index: Contribution of Northern, Southern and Rest of the countries tothe internal inequality (1996e2005).
0%
20%
40%
60%
80%
100%
1996 1997 1998 1999 2000 2001 2002 2003 2004 2005
Internal Inequality External Inequality
Fig. 2. Theil(1) Index decomposition: Internal versus external inequality (1996e2005).
A. Maza et al. / Renewable Energy 35 (2010) 2094e2101 2097
b convergence between EU countries in RES-E shares during theperiod from 1996 to 2005.12 Moreover, the value of the b coefficientimplies that the convergence occurred at an annual rate of 4.05%;consequently, the time that would be required to cover half the gapseparating countries from their stationary state (the half-life) is13.9 years.13 As for the conditioning variables, the results revealthat: 1. Geographic location seems to matter, as being in the Southhas a negative effect on the growth of the renewable electricityshare; 2. Natural endowments of countries or, more specifically, thelengths of the costal line and solar irradiation (CL and SI) havea positive although very low influence on the renewable electricityshare growth rate; and 3. Policy incentives seem to be especiallyeffective in the case of feed-in-tariffs.
3. RES-E national shares in the EU: distribution dynamics
Although enlightening, the classical convergence analysispresents, as mentioned before, several drawbacks. In particular,two major limitations are that it neither informs about changes inthe external shape of the distribution nor the fact that somecountries may shift their relative positions in the distributionduring the period of study. The analysis of these two issues isaddressed in the following section.
3.1. The external shape of the distribution of RES-E national shares
This subsection focuses on the external shape of the RES-E sharedistribution. First, we normalise national values according to theaverage RES-E share (that is, we take the EU mean to be 100) inorder to facilitate comparisons and eliminate the effect of absolutechanges over time from the analysis.
A histogram is the classical and simplest non-parametric densityestimate of a distribution. However, it is sensitive to the choice oforigin and is obviously not continuous. To overcome these limita-tions, we estimate density functions, which are essentiallya continuous version of a histogram. Density functions replace the
12 In this estimation we have excluded Malta and Cyprus from our sample as theirRES-E share are equal to zero for all years and, in consequence, their growth ratecan not be calculated. In fact, because Malta and Cyprus are relatively small islandswith very specific characteristics, we also checked whether the rest of the resultspresented in this paper change when these two countries are excluded. Our esti-mations confirm that the results are roughly the same in both cases.13 The speed of convergence is calculated according to the following expression:b ¼ �lnð1þ TbÞ=T where T is the number of years of the period under analysis.Denoting the half-life by h, this can be easily calculated using the expression:h ¼ �lnð2Þ=lnð1þ bÞ.
discrete “boxes” in a histogram with continuous, smooth “bumps”.Thus, a key choice when estimating density functions is the selec-tion of the proper smoothing parameter or bandwidth. The func-tion of this parameter is to put less weight on observations that arefurther from the point being evaluated.
Specifically, we estimate univariate density functions for theinitial and final years of the sample using a Gaussian kernel withvarying bandwidths. This is done because a variable bandwidth inespecially recommendable when data sparseness is apparent, as ithappens in our case. The basic idea is that, by only varying thebandwidth along the support of the sample data, we can reduce thevariance of the estimates in areas characterised by the presence offew observations (potential outliers), as well as the bias of theestimates in areas with many observations. In order to do that, weemploy the adaptive kernel density estimator proposed byAbramson (1982) [22], given for a variable X by:
bf ðxÞ ¼ 1n
Xni¼1
1hli
K�x� xihli
�(2)
where K is a Gaussian kernel and li ¼ffiffiffiffiffiffiffiffiffiffiffiffiffiffiffig=bf ðxiÞq
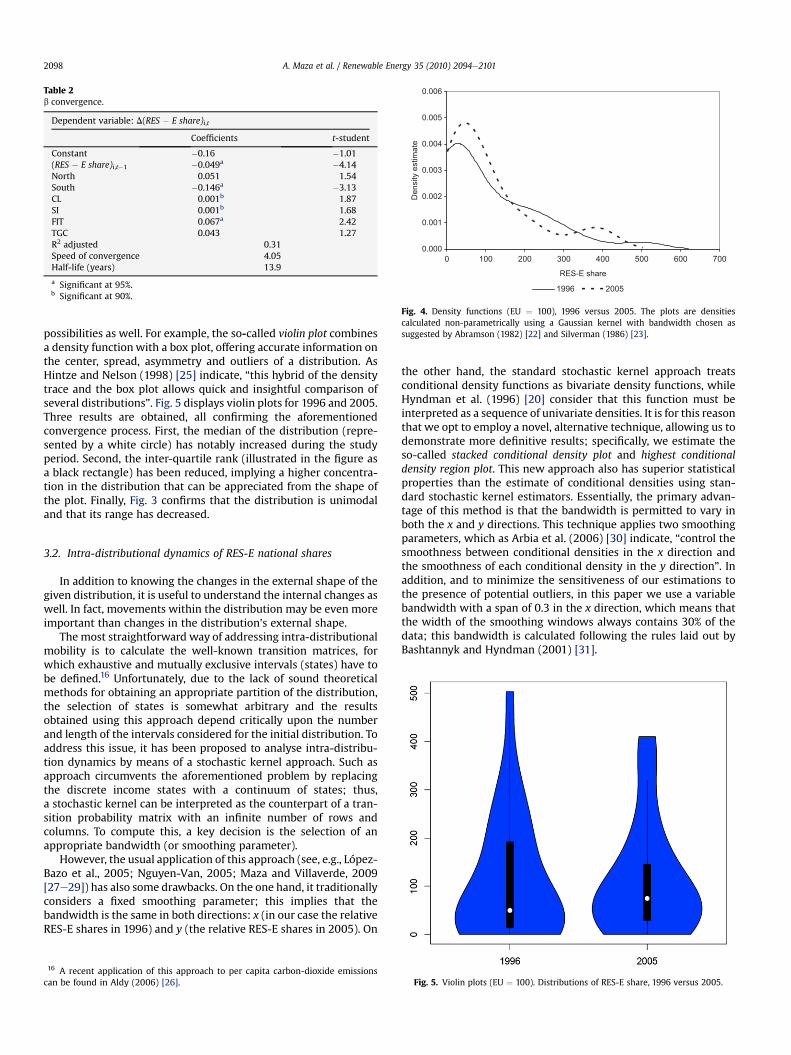
are the bandwidthadjustment factors, g being the geometric average over all i of thepilot density estimate bf ðxÞ calculated using the fixed bandwidth h.The value of h has been chosen following Silverman's rule of thumb(Silverman, 1986 [23]).14 The results, displayed in Fig. 4, allow us todraw the following conclusions15:
1. The shape of the distribution has significantly changed over thesample period. Specifically, the probability of a country beinglocated around the mean has remarkably increased, whichrepresents a clear sign of convergence.
2. There has been a reduction in the ratio of extreme values,which confirms the convergence process previously indicated.
3. The distribution presents only one mode in both 1996 and2005, although this has moved to the right (closer to theaverage) over time.
Density functions are useful to illustrate the external shape ofa distribution. However, novel graphical tools offer new
14 We also used the plug-in method developed by Sheather and Jones (1991) [24]and the results are roughly the same.15 We computed density functions for each year of the study period. To save space,not all data are presented; however, they are available upon request. We have alsoemployed other kernels (Epanechnikov, Uniform) and the results were very similarto those shown in this paper.
0.000
0.001
0.002
0.003
0.004
0.005
0.006
0 100 200 300 400 500 600 700
RES-E share
Den
sity
est
imat
e
1996 2005
Fig. 4. Density functions (EU ¼ 100), 1996 versus 2005. The plots are densitiescalculated non-parametrically using a Gaussian kernel with bandwidth chosen assuggested by Abramson (1982) [22] and Silverman (1986) [23].
Table 2b convergence.
Dependent variable: D(RES � E share)i,t
Coefficients t-student
Constant �0.16 �1.01(RES � E share)i,t�1 �0.049a �4.14North 0.051 1.54South �0.146a �3.13CL 0.001b 1.87SI 0.001b 1.68FIT 0.067a 2.42TGC 0.043 1.27R2 adjusted 0.31Speed of convergence 4.05Half-life (years) 13.9
a Significant at 95%.b Significant at 90%.
A. Maza et al. / Renewable Energy 35 (2010) 2094e21012098
possibilities as well. For example, the so-called violin plot combinesa density functionwith a box plot, offering accurate information onthe center, spread, asymmetry and outliers of a distribution. AsHintze and Nelson (1998) [25] indicate, “this hybrid of the densitytrace and the box plot allows quick and insightful comparison ofseveral distributions”. Fig. 5 displays violin plots for 1996 and 2005.Three results are obtained, all confirming the aforementionedconvergence process. First, the median of the distribution (repre-sented by a white circle) has notably increased during the studyperiod. Second, the inter-quartile rank (illustrated in the figure asa black rectangle) has been reduced, implying a higher concentra-tion in the distribution that can be appreciated from the shape ofthe plot. Finally, Fig. 3 confirms that the distribution is unimodaland that its range has decreased.
3.2. Intra-distributional dynamics of RES-E national shares
In addition to knowing the changes in the external shape of thegiven distribution, it is useful to understand the internal changes aswell. In fact, movements within the distribution may be even moreimportant than changes in the distribution's external shape.
The most straightforward way of addressing intra-distributionalmobility is to calculate the well-known transition matrices, forwhich exhaustive and mutually exclusive intervals (states) have tobe defined.16 Unfortunately, due to the lack of sound theoreticalmethods for obtaining an appropriate partition of the distribution,the selection of states is somewhat arbitrary and the resultsobtained using this approach depend critically upon the numberand length of the intervals considered for the initial distribution. Toaddress this issue, it has been proposed to analyse intra-distribu-tion dynamics by means of a stochastic kernel approach. Such asapproach circumvents the aforementioned problem by replacingthe discrete income states with a continuum of states; thus,a stochastic kernel can be interpreted as the counterpart of a tran-sition probability matrix with an infinite number of rows andcolumns. To compute this, a key decision is the selection of anappropriate bandwidth (or smoothing parameter).
However, the usual application of this approach (see, e.g., López-Bazo et al., 2005; Nguyen-Van, 2005; Maza and Villaverde, 2009[27e29]) has also some drawbacks. On the one hand, it traditionallyconsiders a fixed smoothing parameter; this implies that thebandwidth is the same in both directions: x (in our case the relativeRES-E shares in 1996) and y (the relative RES-E shares in 2005). On
16 A recent application of this approach to per capita carbon-dioxide emissionscan be found in Aldy (2006) [26].
the other hand, the standard stochastic kernel approach treatsconditional density functions as bivariate density functions, whileHyndman et al. (1996) [20] consider that this function must beinterpreted as a sequence of univariate densities. It is for this reasonthat we opt to employ a novel, alternative technique, allowing us todemonstrate more definitive results; specifically, we estimate theso-called stacked conditional density plot and highest conditionaldensity region plot. This new approach also has superior statisticalproperties than the estimate of conditional densities using stan-dard stochastic kernel estimators. Essentially, the primary advan-tage of this method is that the bandwidth is permitted to vary inboth the x and y directions. This technique applies two smoothingparameters, which as Arbia et al. (2006) [30] indicate, “control thesmoothness between conditional densities in the x direction andthe smoothness of each conditional density in the y direction”. Inaddition, and to minimize the sensitiveness of our estimations tothe presence of potential outliers, in this paper we use a variablebandwidth with a span of 0.3 in the x direction, which means thatthe width of the smoothing windows always contains 30% of thedata; this bandwidth is calculated following the rules laid out byBashtannyk and Hyndman (2001) [31].
Fig. 5. Violin plots (EU ¼ 100). Distributions of RES-E share, 1996 versus 2005.
0.000
0.002
0.004
0.006
0.008
0.010
0.012
0 100 200 300 400 500 600RES-E share
Den
sity
est
imat
e
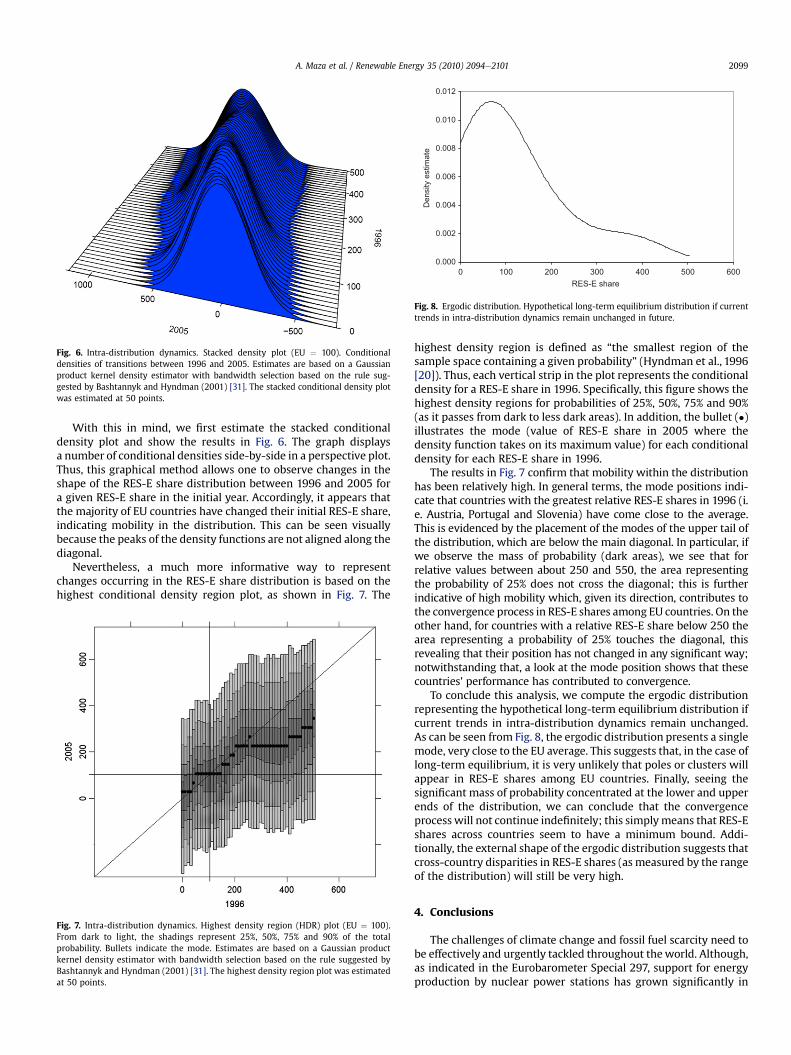
Fig. 8. Ergodic distribution. Hypothetical long-term equilibrium distribution if currenttrends in intra-distribution dynamics remain unchanged in future.
Fig. 6. Intra-distribution dynamics. Stacked density plot (EU ¼ 100). Conditionaldensities of transitions between 1996 and 2005. Estimates are based on a Gaussianproduct kernel density estimator with bandwidth selection based on the rule sug-gested by Bashtannyk and Hyndman (2001) [31]. The stacked conditional density plotwas estimated at 50 points.
A. Maza et al. / Renewable Energy 35 (2010) 2094e2101 2099
With this in mind, we first estimate the stacked conditionaldensity plot and show the results in Fig. 6. The graph displaysa number of conditional densities side-by-side in a perspective plot.Thus, this graphical method allows one to observe changes in theshape of the RES-E share distribution between 1996 and 2005 fora given RES-E share in the initial year. Accordingly, it appears thatthe majority of EU countries have changed their initial RES-E share,indicating mobility in the distribution. This can be seen visuallybecause the peaks of the density functions are not aligned along thediagonal.
Nevertheless, a much more informative way to representchanges occurring in the RES-E share distribution is based on thehighest conditional density region plot, as shown in Fig. 7. The
Fig. 7. Intra-distribution dynamics. Highest density region (HDR) plot (EU ¼ 100).From dark to light, the shadings represent 25%, 50%, 75% and 90% of the totalprobability. Bullets indicate the mode. Estimates are based on a Gaussian productkernel density estimator with bandwidth selection based on the rule suggested byBashtannyk and Hyndman (2001) [31]. The highest density region plot was estimatedat 50 points.
highest density region is defined as “the smallest region of thesample space containing a given probability” (Hyndman et al., 1996[20]). Thus, each vertical strip in the plot represents the conditionaldensity for a RES-E share in 1996. Specifically, this figure shows thehighest density regions for probabilities of 25%, 50%, 75% and 90%(as it passes from dark to less dark areas). In addition, the bullet (�)illustrates the mode (value of RES-E share in 2005 where thedensity function takes on its maximum value) for each conditionaldensity for each RES-E share in 1996.
The results in Fig. 7 confirm that mobility within the distributionhas been relatively high. In general terms, the mode positions indi-cate that countries with the greatest relative RES-E shares in 1996 (i.e. Austria, Portugal and Slovenia) have come close to the average.This is evidenced by the placement of the modes of the upper tail ofthe distribution, which are below the main diagonal. In particular, ifwe observe the mass of probability (dark areas), we see that forrelative values between about 250 and 550, the area representingthe probability of 25% does not cross the diagonal; this is furtherindicative of high mobility which, given its direction, contributes tothe convergence process in RES-E shares among EU countries. On theother hand, for countries with a relative RES-E share below 250 thearea representing a probability of 25% touches the diagonal, thisrevealing that their position has not changed in any significant way;notwithstanding that, a look at the mode position shows that thesecountries' performance has contributed to convergence.
To conclude this analysis, we compute the ergodic distributionrepresenting the hypothetical long-term equilibrium distribution ifcurrent trends in intra-distribution dynamics remain unchanged.As can be seen from Fig. 8, the ergodic distribution presents a singlemode, very close to the EU average. This suggests that, in the case oflong-term equilibrium, it is very unlikely that poles or clusters willappear in RES-E shares among EU countries. Finally, seeing thesignificant mass of probability concentrated at the lower and upperends of the distribution, we can conclude that the convergenceprocess will not continue indefinitely; this simplymeans that RES-Eshares across countries seem to have a minimum bound. Addi-tionally, the external shape of the ergodic distribution suggests thatcross-country disparities in RES-E shares (as measured by the rangeof the distribution) will still be very high.
4. Conclusions
The challenges of climate change and fossil fuel scarcity need tobe effectively and urgently tackled throughout theworld. Although,as indicated in the Eurobarometer Special 297, support for energyproduction by nuclear power stations has grown significantly in
A. Maza et al. / Renewable Energy 35 (2010) 2094e21012100
some EU countries in the last few years, an increase in the gener-ation capacity of renewable energy is arguably the best method toaddress these challenges. Indeed, this has been a priority of EUenergy policy since the approval of the directive on the promotionof RES-E, as published by the European Commission in 2001. Fromthen on, all EU countries have intensified their efforts to meet bothEuropean and national targets of RES-E consumption through theimplementation of RES-E support policies.
Although the effectiveness and actual implementation of thisenergy policy is a topic worthy of attention in and of itself, thispaper has addressed the issue of the dynamics of EU cross-countrydisparities in RES-E shares over the period 1996e2005. To this end,our approach has focused on using novel non-parametric tech-niques in contrast to the traditional, parametric techniquesemployed in the past. The relevant conclusions derived from thisanalysis are as follows:
First, the results obtained from the traditional analysis ofconvergence reveal a cross-country convergence process. The paperdistinctly shows that RES-E shares dispersion has declined overtime (s convergence); furthermore, it reveals that, having split thesample in three groups of countries (Northern, Southern and Rest),internal (within-group) inequality accounts on average for 91% oftotal inequality, being the differences within the group of Southerncountries much smaller than in the other two groups. With respectto (conditional) b convergence, its presence could be explained bythe negative performance exhibited by some European countrieswith a relatively high RES-E share (i.e. Portugal, Spain, Slovenia,France), and the dynamic behaviour observed in some countrieswith a very low RES-E share (i.e. Estonia, Hungary, Belgium,Luxembourg, United Kingdom, Netherlands). As for the condi-tioning variables, the results show that some of the naturalendowments (in particular, length of coast line and solar irradi-ance) do not seem to have had a big impact on the RES-E growthrate. On the other hand, it is important to note that the deploymentof feed-in-tariffs as a supporting mechanism has had a noticeablypositive effect on the RES-E rate of growth. However, from a polit-ical perspective we should be cautious with this finding because,although this support mechanism is very effective in the first stagesof renewable energy deployment (Held et al., 2006 [15]), it maycause a lot of pressure on the public budget in the long term (whenthe government takes responsibility for paying all or a great part ofthe guaranteed price)17 and incentives to reduce costs and pricesare low (Madlener and Stagl, 2005 [32]); considering this and theshort experience of tradable green certificates, we tend to endorsethe idea that there is no natural superiority of any instrument(Reiche and Bechberger, 2004 [33]).
Second, the external shape of the RES-E share distribution haschanged significantly over time, withmore countries being situatedaround the mean in 2005 than in 1996. Moreover, the analysis ofthe intra-distributional mobility using the highest density regionsapproach reveals that, in general terms, countries with high RES-Eshares in 1996 have tended tomove towards the average during thesample period. Specifically, those countries that have undergonethe largest positional changes in the distribution were those withan initial relative value higher than 250. This suggests that energypolicies committed to a more intense use of renewable electricityhave been, as a general rule, less strictly enforced by Europeancountries with very high RES-shares.18 As argued by different
17 As noted by a referee, this depends on the design of the feed-in-tariff mecha-nism. For instance, in countries such as Germany and France, feed-in-tariffsdecrease with the level of production.18 There could be, obviously, other reasons, such as the fact that the best RES siteswere already occupied.
authors (see, for instance, Haas et al., 2004; Held and Ragwitz,2006; Agnolucci, 2007 [34e36]), the major problems of some ofthese countries have been a considerable growth in electricityconsumption and an insufficient or null investment in newcapacity, as well as an additional component of uncertaintyregarding financial incentives following some countries' decision ofchanging to another support system.
Finally, the ergodic distribution shows that, in spite of ongoingconvergence, large cross-country differences will persist for RES-Eshares in a hypothetical long-run equilibrium. If the persistence ofthesedifferences isnot considered tobe correct, this shouldbekept inmind by governments and international agencies when it comes tothe definition, implementation and enforcement of renewableenergy policies. To this end, it should be noted that several factors arebehind these large disparities, such as national circumstances(insufficient grid capacity, conditions and costs for grid connection,complex administrative procedures, lack of funds for investment,insufficient public awareness regarding the negative impact oftraditional power (Coenraads and Voogt, 2006; Patlitzianas et al.,2007; Swider et al., 2008 [6,37,38])) and differences in the costs ofadopting and developing new technologies (Isoard and Soria, 2001;Voogt and Uyterlinde, 2006 [39,40]).19 Therefore, assuming thatfurther disparity reduction is important, there is a strong basis,particularly in those countries with lower RES-E shares, for elimi-nating economic20 and non-economic barriers to RES-E imple-mentation as well as enhancing financial support for RES-E researchon the development of more efficient technologies (Geller, 2003;Ragwitz and Miola, 2005 [42,43]). Additionally, further Europeancooperation can also play a key role in reducing RES-E share differ-ences; as argued by Held and Ragwitz (2006) [35], exchange ofexperience and technology transfer to countries where progress inrenewable energy deployment has beenpoormay induce an increasein their RES-E shares as well as a less costly transition to renewables.
References
[1] Verbruggen A. Renewable and nuclear power: a common future? EnergyPolicy 2008;36(11):4036e47.
[2] Scott MJ, Roop JM, Schultz RW, Anderson DM, Cort KA. The impact of DOEbuilding technology energy efficiency programs on U.S. employment, income,and investment. Energy Economics 2008;30(5):2283e301.
[3] Glachant JM, Lévêque F, editors. Electricity reform in Europe: towards a singleenergy market. Edward Elgar Publishing; 2008.
[4] European Commission. European energy and transport trends to 2030; 2004.[5] Meyer NI. European schemes for promoting renewables in liberalised markets.
Energy Policy 2003;31(7):665e76.[6] Coenraads RJAC, Voogt MH. Promotion of renewable electricity in the Euro-
pean Union. Energy & Environment 2006;17(6):835e48.[7] Hillebrand B, Buttermann HG, Behringer JM, Bleuel M. The expansion of
renewable energies and employment effects in Germany. Energy Policy2006;34(18):3484e94.
[8] Ragwitz M, Huber C. Editorial-status quo and the future of renewable energiesin Europe. Energy & Environment 2006;17(6):veviii.
[9] Henriques I, Sadorsky P. Oil prices and the stock prices of alternative energycompanies. Energy Economics 2008;30(3):998e1010.
[10] European Commission. Directive 2001/77/EC of the European Parliament andof the Council on the promotion of electricity from renewable sources in theinternal electricity market. Official Journal of the European Communities2001;L283:33e40.
[11] Huber C, Faber T, Resch G. Prospects of renewable energy development in theEuropean electricity sector: results of the simulation tool Green-X. Energy &Environment 2006;17(6):929e50.
[12] Harmelink M, Voogt M, Cremer C. Analysing the effectiveness of renewableenergy supporting policies in the European Union. Energy Policy 2004;34(3):343e51.
19 Regarding this issue, the impact of technical change on the diffusion of variousemerging renewable energy technologies is examined by Kumbaro�glu et al. (2008)[41].20 For instance, Swider et al. (2008) [38] propose that grid connection costs shouldbe covered by grid operators and then be recouped by lifting consumer tariffs.
A. Maza et al. / Renewable Energy 35 (2010) 2094e2101 2101
[13] Del Río PA. European-wide harmonised tradable green certificate scheme forrenewable electricity: is it really so beneficial? Energy Policy 2005;33(10):1239e50.
[14] Palmer K, Burtraw D. Cost-effectiveness of renewable electricity policies.Energy Economics 2005;27(6):873e94.
[15] Held A, Ragwitz M, Haas R. On the success of policy strategies for thepromotion of electricity from renewable energy sources in the EU. Energy &Environment 2006;17(6):849e68.
[16] Verhaegen K, Meeus L, Delvaux B, Belmans R. Electricity produced fromrenewable energy sources. What target are we aimed for? Energy Policy2007;35(11):5576e84.
[17] Doukas H, Mannsbart W, Patlitianas KD, Psarras J, Ragwitz M, Schlomann B. Amethodology for validating the renewable energy data in EU. RenewableEnergy 2007;32:1981e98.
[18] Quah D. Regional convergence clusters in Europe. European Economic Review1996;40(3e5):951e8.
[19] Maza A, Villaverde J. The world per capita electricity consumption distribu-tion: signs of convergence? Energy Policy 2008;36(11):4255e61.
[20] Hyndman RJ, Bashtannyk DM, Grunwald GK. Estimating and visualizingconditional densities. Journal of Computational and Graphical Statistics1996;5(4):315e36.
[21] Ragwitz M, Hed A, Resch G, Haas R, Faber T, Huber C, et al. Assessment andoptimisation of renewable energy support schemes in the European electricitymarket. Stuttgart: Fraunhofer IRB Verlag; 2007.
[22] Abramson IS. On bandwidth variation in kernel estimates: a square root law.Annals of Statistics 1982;10(4):1217e23.
[23] Silverman BW. Density estimation for statistics and data analysis. London:Chapman and Hall; 1986.
[24] Sheather SJ, Jones MC. A reliable data-based bandwidth selection method forkernel density estimation. Journal of the Royal Statistical Society Series B1991;53:683e90.
[25] Hintze JL, Nelson RD. Violin plots: a box plot-density trace synergism. TheAmerican Statistician 1998;52(2):181e4.
[26] Aldy JE. Per capita cabon dioxide emissions: convergence or divergence?Environmental and Resource Economics 2006;33(4):533e55.
[27] López-Bazo E, Del Barrio T, Artis M. The geographical distribution of unem-ployment in Spain. Regional Studies 2005;39:305e18.
[28] Nguyen-Van P. Distribution dynamics of CO2 emissions. Environmental andResource Economics 2005;32(4):495e508.
[29] Maza A, Villaverde J. Provincial wages in Spain: convergence and flexibility.Urban Studies 2009;46(9):1969e93.
[30] Arbia G, Basile R, Piras G. Analyzing intra-distribution dynamics: a reappraisal.ERSA Conference Papers; 2006.
[31] Bashtannyk DM, Hyndman RJ. Bandwidth selection for kernel conditionaldensity estimation. Computational Statistics & Data Analysis 2001;36:279e98.
[32] Madlener R, Stagl S. Sustainability-guided promotion of renewable electricitygeneration. Ecological Economics 2005;53(2):147e67.
[33] Reiche D, Bechberger M. Policy differences in the promotion of renewableenergies in the EU member states. Energy Policy 2004;32:843e9.
[34] Haas R, Eichhammer W, Huber C, Langniss O, Lorenzoni A, Madlener R, et al.How to promote renewable energy systems successfully and effectively.Energy Policy 2004;32:833e9.
[35] Held A, Ragwitz M. RE policy in Europe. The international feed-in cooperation-optimization and better coordination of national policy instruments. Refocus2006;7(6):44e7.
[36] Agnolucci P. Renewable policies in Netherlands. Renewable Energy2007;32:868e83.
[37] Patlitzianas K, Ntotas K, Doukas H, Psarras J. Assessing the renewable energyproducers' environment in EU accession member states. Energy Conversionand Management 2007;48(3):890e7.
[38] Swider DJ, Beurskens L, Davidson S, Twidell J, Pyrko J, Prüggler W, et al.Conditions and costs for renewables electricity grid connection: examples inEurope. Renewable Energy 2008;33:1832e42.
[39] Isoard S, Soria A. Technical change dynamics: evidence from the emergingrenewable energy technologies. Energy Economics 2001;23(6):619e36.
[40] Voogt MH, Uyterlinde MA. Cost effects of international trade in meeting EUrenewable electricity targets. Energy Policy 2006;34(3):352e64.
[41] Kumbaro�glu G, Madlener R, Demirel M. A real options evaluation model forthe diffusion prospects of new renewable power generation technologies.Energy Economics 2008;30(4):1882e908.
[42] Geller H. Energy revolution: policies for a sustainable future. Washington:Inland Press; 2003.
[43] Ragwitz M, Miola A. Evidence from RD&D spending dor renewable energysources in the EU. Renewable Energy 2005;30:1635e47.