Embed Size (px)
Citation preview
Introduction Theoretical motivation The Brexit referendum Empirical model Data Results Conclusion
Renegotiation of Trade Agreements and FirmExporting Decisions: Evidence from the Impact
of Brexit on UK Exports
Meredith A. CrowleyOliver Exton
Lu Han
University of Cambridge
July 2018
Introduction Theoretical motivation The Brexit referendum Empirical model Data Results Conclusion
Disclaimer
This work contains statistical data from HMRC which is CrownCopyright. The research datasets used may not exactly reproduceHMRC aggregates. The use of HMRC statistical data in this workdoes not imply the endorsement of HMRC in relation to theinterpretation or analysis of the information.
Introduction Theoretical motivation The Brexit referendum Empirical model Data Results Conclusion
Renegotiation of trade agreements
Countries regularly negotiate new, more liberal trade agreements:
• Canada-EU, CP-TPP, KORUS
Recently, several trade agreements have announced renegotiation:
• UK in EU, US in NAFTA, KORUS
with threats that collapse of negotiations will lead to tariffincreases.
Research question:What is the impact of the renegotiation of a trading relationship(and its implied uncertainty about future trade policy) on firmentry into and exit from exporting?
Introduction Theoretical motivation The Brexit referendum Empirical model Data Results Conclusion
Summary of results
UK firm entry into the EU fell dramatically for products that wouldface increases in tariffs if negotiations breakdown.• A 10 percentage point increase in the threat point tariff
decreases the entry rate by 10.1 ppt and increases exit rate by4.9 ppt.• Products facing extreme threat point tariffs experience a 25.3
ppt decline in relative entry rate.• Products facing high threat point tariffs experience a 12.3 ppt
decline in relative entry rate.
• Partial equilibrium aggregation: entry into (exit from) the EUby UK firms would have been 5.1% higher (4.3% lower) in2016 if there had been a guarantee that EU import tariffs onUK exports would remain at zero post-Brexit.
Introduction Theoretical motivation The Brexit referendum Empirical model Data Results Conclusion
Theory and empirics on trade policy uncertainty
• Trade policy uncertainty• Handley (2014), Handley and Limao (2015), Pierce and Schott
(2016), Handley and Limao (2017), Crowley, Meng and Song(2018).
• Trade agreement design and renegotiation• Bagwell and Staiger (1999), Maggi and Rodgriguez-Clare
(2007), Horn, Maggi and Staiger (2010), Maggi and Staiger(2011), Maggi and Staiger (2015), Limao and Maggi (2015).
Introduction Theoretical motivation The Brexit referendum Empirical model Data Results Conclusion
Outline
Introduction
Theoretical motivation
The Brexit referendum
Empirical model
Data
Results
Conclusion
Introduction Theoretical motivation The Brexit referendum Empirical model Data Results Conclusion
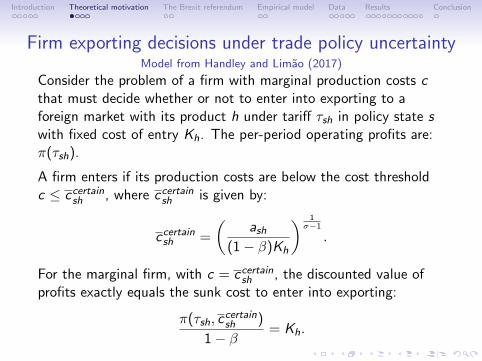
Firm exporting decisions under trade policy uncertaintyModel from Handley and Limao (2017)
Consider the problem of a firm with marginal production costs cthat must decide whether or not to enter into exporting to aforeign market with its product h under tariff τsh in policy state swith fixed cost of entry Kh. The per-period operating profits are:π(τsh).
A firm enters if its production costs are below the cost thresholdc ≤ ccertainsh , where ccertainsh is given by:
ccertainsh =
(ash
(1− β)Kh
) 1σ−1
.
For the marginal firm, with c = ccertainsh , the discounted value ofprofits exactly equals the sunk cost to enter into exporting:
π(τsh, ccertainsh )
1− β= Kh.
Introduction Theoretical motivation The Brexit referendum Empirical model Data Results Conclusion
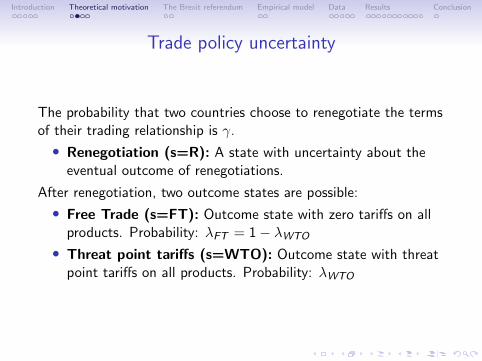
Trade policy uncertainty
The probability that two countries choose to renegotiate the termsof their trading relationship is γ.
• Renegotiation (s=R): A state with uncertainty about theeventual outcome of renegotiations.
After renegotiation, two outcome states are possible:
• Free Trade (s=FT): Outcome state with zero tariffs on allproducts. Probability: λFT = 1− λWTO
• Threat point tariffs (s=WTO): Outcome state with threatpoint tariffs on all products. Probability: λWTO
Introduction Theoretical motivation The Brexit referendum Empirical model Data Results Conclusion
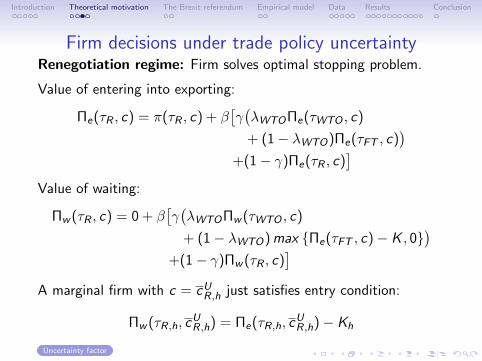
Firm decisions under trade policy uncertaintyRenegotiation regime: Firm solves optimal stopping problem.
Value of entering into exporting:
Πe(τR , c) = π(τR , c) + β[γ(λWTOΠe(τWTO , c)
+ (1− λWTO)Πe(τFT , c))
+(1− γ)Πe(τR , c)]
Value of waiting:
Πw (τR , c) = 0 + β[γ(λWTOΠw (τWTO , c)
+ (1− λWTO)max {Πe(τFT , c)− K , 0})
+(1− γ)Πw (τR , c)]
A marginal firm with c = cUR,h just satisfies entry condition:
Πw (τR,h, cUR,h) = Πe(τR,h, c
UR,h)− Kh
Uncertainty factor
Introduction Theoretical motivation The Brexit referendum Empirical model Data Results Conclusion
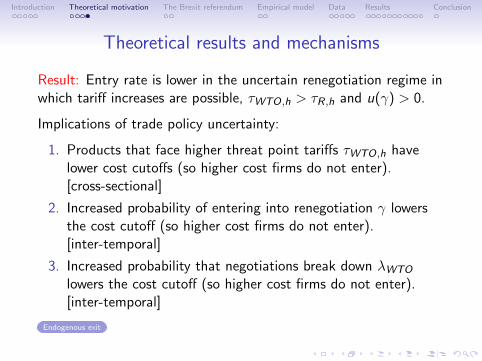
Theoretical results and mechanisms
Result: Entry rate is lower in the uncertain renegotiation regime inwhich tariff increases are possible, τWTO,h > τR,h and u(γ) > 0.
Implications of trade policy uncertainty:
1. Products that face higher threat point tariffs τWTO,h havelower cost cutoffs (so higher cost firms do not enter).[cross-sectional]
2. Increased probability of entering into renegotiation γ lowersthe cost cutoff (so higher cost firms do not enter).[inter-temporal]
3. Increased probability that negotiations break down λWTO
lowers the cost cutoff (so higher cost firms do not enter).[inter-temporal]
Endogenous exit
Introduction Theoretical motivation The Brexit referendum Empirical model Data Results Conclusion
BrexitA switch to a less certain trade policy environment
On 23rd June 2016 the British electorate voted to ‘Leave’ theEuropean Union:
• Government announced that UK would leave Customs Union.
• UK began negotiations with the EU with aims to ensurecontinued tariff free access to EU markets.
• Outside option or threat point (if no deal is reached) is forUK-EU bilateral trade to be conducted under WTO rules.
• Under WTO rules, UK exports to EU would be charged EU’sexternal tariff rates (defined by EU’s WTO tariff schedule).
Brexit can be interpreted as an unexpected increase to theprobability of a new set of tariffs (γ = 0.3→ γ = 1).
Introduction Theoretical motivation The Brexit referendum Empirical model Data Results Conclusion
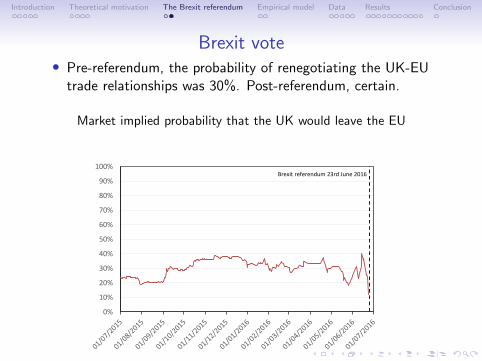
Brexit vote• Pre-referendum, the probability of renegotiating the UK-EU
trade relationships was 30%. Post-referendum, certain.
Market implied probability that the UK would leave the EU
0%
10%
20%
30%
40%
50%
60%
70%
80%
90%
100%Brexit referendum 23rd June 2016
Introduction Theoretical motivation The Brexit referendum Empirical model Data Results Conclusion
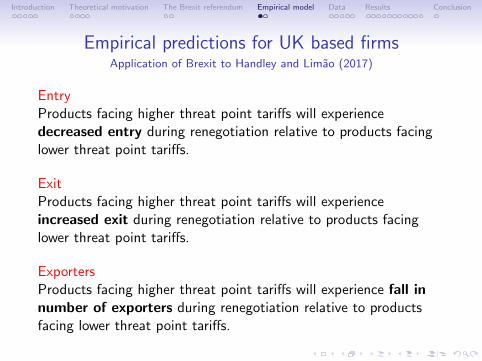
Empirical predictions for UK based firmsApplication of Brexit to Handley and Limao (2017)
EntryProducts facing higher threat point tariffs will experiencedecreased entry during renegotiation relative to products facinglower threat point tariffs.
ExitProducts facing higher threat point tariffs will experienceincreased exit during renegotiation relative to products facinglower threat point tariffs.
ExportersProducts facing higher threat point tariffs will experience fall innumber of exporters during renegotiation relative to productsfacing lower threat point tariffs.
Introduction Theoretical motivation The Brexit referendum Empirical model Data Results Conclusion
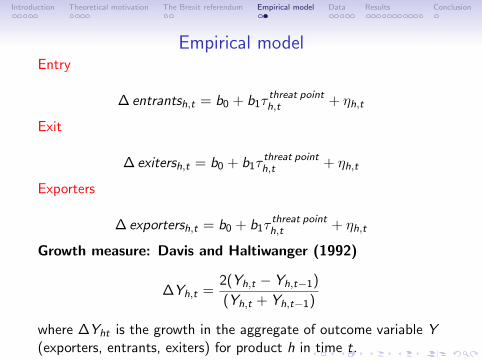
Empirical modelEntry
∆ entrantsh,t = b0 + b1τthreat pointh,t + ηh,t
Exit
∆ exitersh,t = b0 + b1τthreat pointh,t + ηh,t
Exporters
∆ exportersh,t = b0 + b1τthreat pointh,t + ηh,t
Growth measure: Davis and Haltiwanger (1992)
∆Yh,t =2(Yh,t − Yh,t−1)
(Yh,t + Yh,t−1)
where ∆Yht is the growth in the aggregate of outcome variable Y(exporters, entrants, exiters) for product h in time t.
Introduction Theoretical motivation The Brexit referendum Empirical model Data Results Conclusion
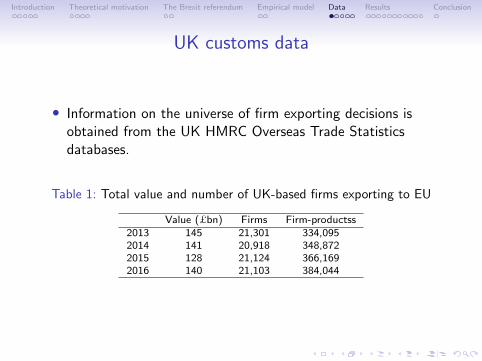
UK customs data
• Information on the universe of firm exporting decisions isobtained from the UK HMRC Overseas Trade Statisticsdatabases.
Table 1: Total value and number of UK-based firms exporting to EU
Value (£bn) Firms Firm-productss2013 145 21,301 334,0952014 141 20,918 348,8722015 128 21,124 366,1692016 140 21,103 384,044
Introduction Theoretical motivation The Brexit referendum Empirical model Data Results Conclusion
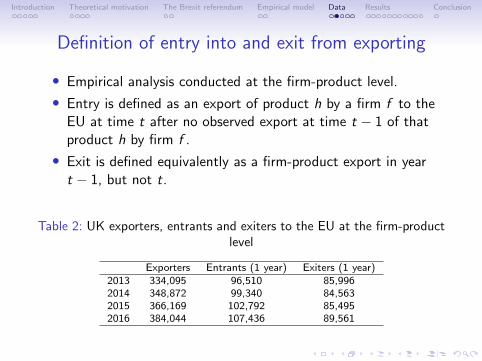
Definition of entry into and exit from exporting
• Empirical analysis conducted at the firm-product level.
• Entry is defined as an export of product h by a firm f to theEU at time t after no observed export at time t − 1 of thatproduct h by firm f .
• Exit is defined equivalently as a firm-product export in yeart − 1, but not t.
Table 2: UK exporters, entrants and exiters to the EU at the firm-productlevel
Exporters Entrants (1 year) Exiters (1 year)2013 334,095 96,510 85,9962014 348,872 99,340 84,5632015 366,169 102,792 85,4952016 384,044 107,436 89,561
Introduction Theoretical motivation The Brexit referendum Empirical model Data Results Conclusion
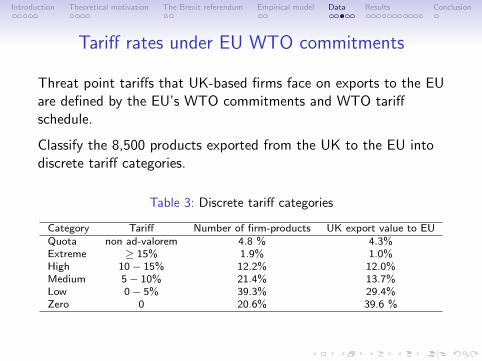
Tariff rates under EU WTO commitments
Threat point tariffs that UK-based firms face on exports to the EUare defined by the EU’s WTO commitments and WTO tariffschedule.
Classify the 8,500 products exported from the UK to the EU intodiscrete tariff categories.
Table 3: Discrete tariff categories
Category Tariff Number of firm-products UK export value to EUQuota non ad-valorem 4.8 % 4.3%Extreme ≥ 15% 1.9% 1.0%High 10− 15% 12.2% 12.0%Medium 5− 10% 21.4% 13.7%Low 0− 5% 39.3% 29.4%Zero 0 20.6% 39.6 %
Introduction Theoretical motivation The Brexit referendum Empirical model Data Results Conclusion
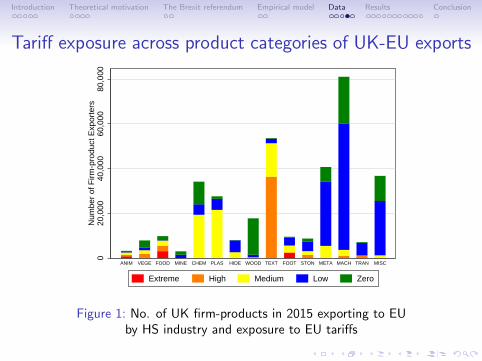
Tariff exposure across product categories of UK-EU exports
020
,000
40,0
0060
,000
80,0
00N
umbe
r of
Firm
-pro
duct
Exp
orte
rs
ANIM VEGE FOOD MINE CHEM PLAS HIDE WOOD TEXT FOOT STON META MACH TRAN MISC
Extreme High Medium Low Zero
Figure 1: No. of UK firm-products in 2015 exporting to EUby HS industry and exposure to EU tariffs
Introduction Theoretical motivation The Brexit referendum Empirical model Data Results Conclusion
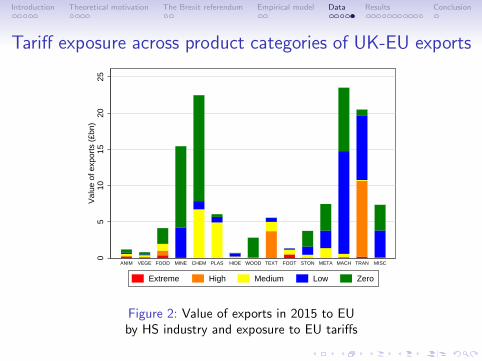
Tariff exposure across product categories of UK-EU exports
05
1015
2025
Val
ue o
f exp
orts
(£b
n)
ANIM VEGE FOOD MINE CHEM PLAS HIDE WOOD TEXT FOOT STON META MACH TRAN MISC
Extreme High Medium Low Zero
Figure 2: Value of exports in 2015 to EUby HS industry and exposure to EU tariffs
Introduction Theoretical motivation The Brexit referendum Empirical model Data Results Conclusion
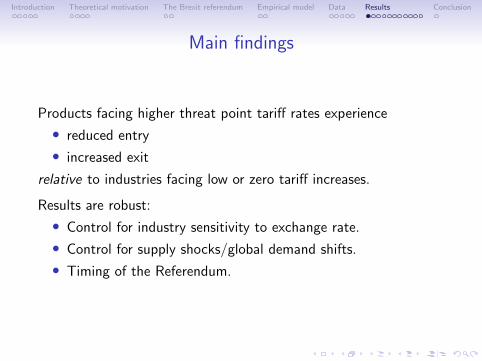
Main findings
Products facing higher threat point tariff rates experience
• reduced entry
• increased exit
relative to industries facing low or zero tariff increases.
Results are robust:
• Control for industry sensitivity to exchange rate.
• Control for supply shocks/global demand shifts.
• Timing of the Referendum.
Introduction Theoretical motivation The Brexit referendum Empirical model Data Results Conclusion
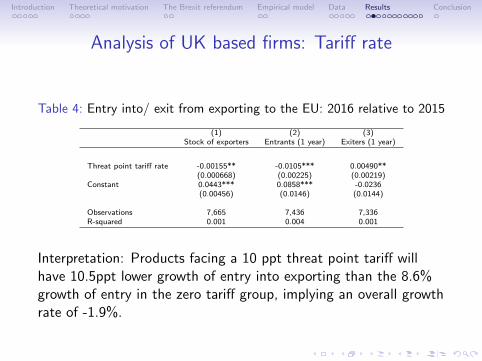
Analysis of UK based firms: Tariff rate
Table 4: Entry into/ exit from exporting to the EU: 2016 relative to 2015
(1) (2) (3)Stock of exporters Entrants (1 year) Exiters (1 year)
Threat point tariff rate -0.00155** -0.0105*** 0.00490**(0.000668) (0.00225) (0.00219)
Constant 0.0443*** 0.0858*** -0.0236(0.00456) (0.0146) (0.0144)
Observations 7,665 7,436 7,336R-squared 0.001 0.004 0.001
Interpretation: Products facing a 10 ppt threat point tariff willhave 10.5ppt lower growth of entry into exporting than the 8.6%growth of entry in the zero tariff group, implying an overall growthrate of -1.9%.
Introduction Theoretical motivation The Brexit referendum Empirical model Data Results Conclusion
Analysis of UK based firms: Discrete tariff categoriesIncluding quotas
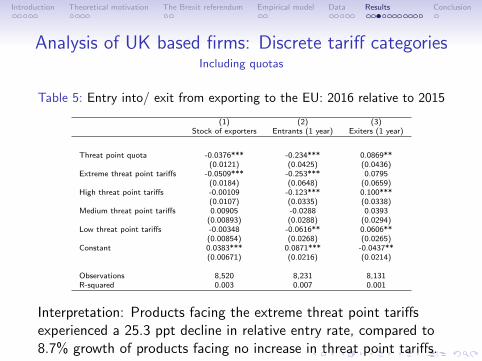
Table 5: Entry into/ exit from exporting to the EU: 2016 relative to 2015
(1) (2) (3)Stock of exporters Entrants (1 year) Exiters (1 year)
Threat point quota -0.0376*** -0.234*** 0.0869**(0.0121) (0.0425) (0.0436)
Extreme threat point tariffs -0.0509*** -0.253*** 0.0795(0.0184) (0.0648) (0.0659)
High threat point tariffs -0.00109 -0.123*** 0.100***(0.0107) (0.0335) (0.0338)
Medium threat point tariffs 0.00905 -0.0288 0.0393(0.00893) (0.0288) (0.0294)
Low threat point tariffs -0.00348 -0.0616** 0.0606**(0.00854) (0.0268) (0.0265)
Constant 0.0383*** 0.0871*** -0.0437**(0.00671) (0.0216) (0.0214)
Observations 8,520 8,231 8,131R-squared 0.003 0.007 0.001
Interpretation: Products facing the extreme threat point tariffsexperienced a 25.3 ppt decline in relative entry rate, compared to8.7% growth of products facing no increase in threat point tariffs.
Introduction Theoretical motivation The Brexit referendum Empirical model Data Results Conclusion
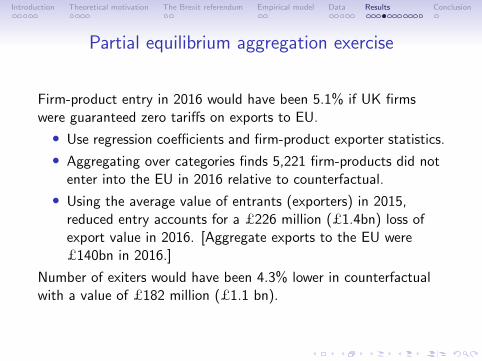
Partial equilibrium aggregation exercise
Firm-product entry in 2016 would have been 5.1% if UK firmswere guaranteed zero tariffs on exports to EU.
• Use regression coefficients and firm-product exporter statistics.
• Aggregating over categories finds 5,221 firm-products did notenter into the EU in 2016 relative to counterfactual.
• Using the average value of entrants (exporters) in 2015,reduced entry accounts for a £226 million (£1.4bn) loss ofexport value in 2016. [Aggregate exports to the EU were£140bn in 2016.]
Number of exiters would have been 4.3% lower in counterfactualwith a value of £182 million (£1.1 bn).
Introduction Theoretical motivation The Brexit referendum Empirical model Data Results Conclusion
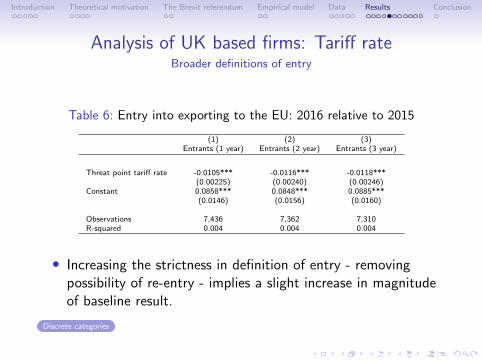
Analysis of UK based firms: Tariff rateBroader definitions of entry
Table 6: Entry into exporting to the EU: 2016 relative to 2015
(1) (2) (3)Entrants (1 year) Entrants (2 year) Entrants (3 year)
Threat point tariff rate -0.0105*** -0.0116*** -0.0118***(0.00225) (0.00240) (0.00246)
Constant 0.0858*** 0.0848*** 0.0885***(0.0146) (0.0156) (0.0160)
Observations 7,436 7,362 7,310R-squared 0.004 0.004 0.004
• Increasing the strictness in definition of entry - removingpossibility of re-entry - implies a slight increase in magnitudeof baseline result.
Discrete categories
Introduction Theoretical motivation The Brexit referendum Empirical model Data Results Conclusion
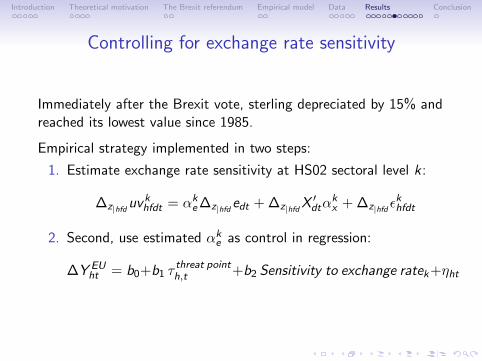
Controlling for exchange rate sensitivity
Immediately after the Brexit vote, sterling depreciated by 15% andreached its lowest value since 1985.
Empirical strategy implemented in two steps:
1. Estimate exchange rate sensitivity at HS02 sectoral level k :
∆z|hfduvkhfdt = αk
e∆z|hfd edt + ∆z|hfdX′dtα
kx + ∆z|hfd ε
khfdt
2. Second, use estimated αke as control in regression:
∆Y EUht = b0+b1 τ
threat pointh,t +b2 Sensitivity to exchange ratek+ηht
Introduction Theoretical motivation The Brexit referendum Empirical model Data Results Conclusion
Analysis of UK based firms: Tariff rateControl for industry exchange rate sensitivity
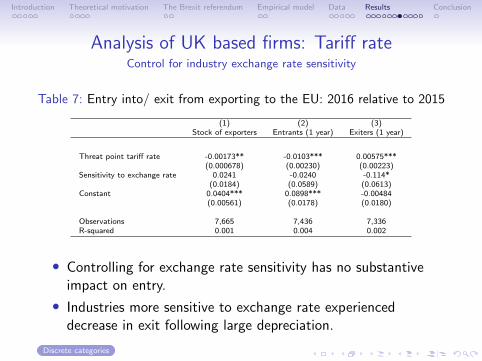
Table 7: Entry into/ exit from exporting to the EU: 2016 relative to 2015
(1) (2) (3)Stock of exporters Entrants (1 year) Exiters (1 year)
Threat point tariff rate -0.00173** -0.0103*** 0.00575***(0.000678) (0.00230) (0.00223)
Sensitivity to exchange rate 0.0241 -0.0240 -0.114*(0.0184) (0.0589) (0.0613)
Constant 0.0404*** 0.0898*** -0.00484(0.00561) (0.0178) (0.0180)
Observations 7,665 7,436 7,336R-squared 0.001 0.004 0.002
• Controlling for exchange rate sensitivity has no substantiveimpact on entry.
• Industries more sensitive to exchange rate experienceddecrease in exit following large depreciation.
Discrete categories
Introduction Theoretical motivation The Brexit referendum Empirical model Data Results Conclusion
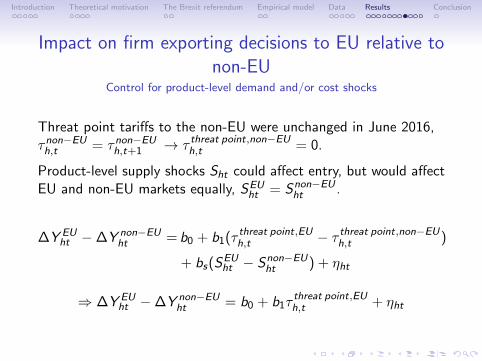
Impact on firm exporting decisions to EU relative tonon-EU
Control for product-level demand and/or cost shocks
Threat point tariffs to the non-EU were unchanged in June 2016,τnon−EUh,t = τnon−EUh,t+1 → τ threat point,non−EUh,t = 0.
Product-level supply shocks Sht could affect entry, but would affectEU and non-EU markets equally, SEU
ht = Snon−EUht .
∆Y EUht −∆Y non−EU
ht = b0 + b1(τ threat point,EUh,t − τ threat point,non−EUh,t )
+ bs(SEUht − Snon−EU
ht ) + ηht
⇒ ∆Y EUht −∆Y non−EU
ht = b0 + b1τthreat point,EUh,t + ηht
Introduction Theoretical motivation The Brexit referendum Empirical model Data Results Conclusion
Analysis of UK based firms: Triple differenceControl for product-level demand and/or cost shocks
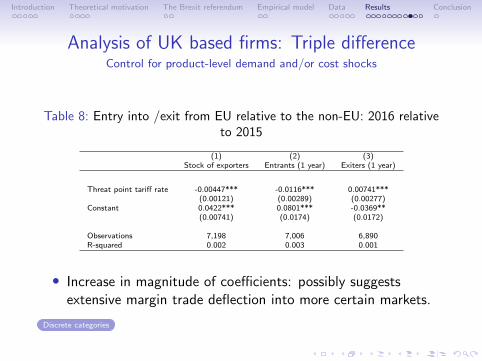
Table 8: Entry into /exit from EU relative to the non-EU: 2016 relativeto 2015
(1) (2) (3)Stock of exporters Entrants (1 year) Exiters (1 year)
Threat point tariff rate -0.00447*** -0.0116*** 0.00741***(0.00121) (0.00289) (0.00277)
Constant 0.0422*** 0.0801*** -0.0369**(0.00741) (0.0174) (0.0172)
Observations 7,198 7,006 6,890R-squared 0.002 0.003 0.001
• Increase in magnitude of coefficients: possibly suggestsextensive margin trade deflection into more certain markets.
Discrete categories
Introduction Theoretical motivation The Brexit referendum Empirical model Data Results Conclusion
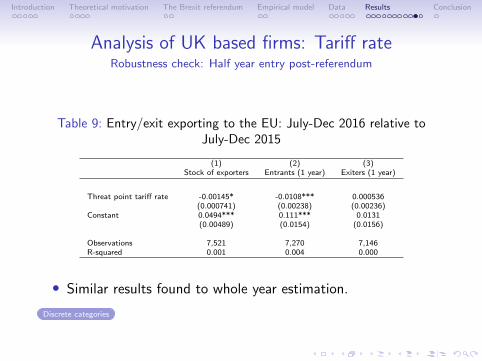
Analysis of UK based firms: Tariff rateRobustness check: Half year entry post-referendum
Table 9: Entry/exit exporting to the EU: July-Dec 2016 relative toJuly-Dec 2015
(1) (2) (3)Stock of exporters Entrants (1 year) Exiters (1 year)
Threat point tariff rate -0.00145* -0.0108*** 0.000536(0.000741) (0.00238) (0.00236)
Constant 0.0494*** 0.111*** 0.0131(0.00489) (0.0154) (0.0156)
Observations 7,521 7,270 7,146R-squared 0.001 0.004 0.000
• Similar results found to whole year estimation.
Discrete categories
Introduction Theoretical motivation The Brexit referendum Empirical model Data Results Conclusion
Analysis of UK based firms: Tariff ratePlacebo test: half year entry pre-referendum
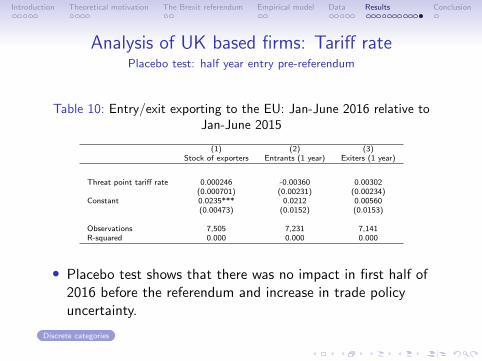
Table 10: Entry/exit exporting to the EU: Jan-June 2016 relative toJan-June 2015
(1) (2) (3)Stock of exporters Entrants (1 year) Exiters (1 year)
Threat point tariff rate 0.000246 -0.00360 0.00302(0.000701) (0.00231) (0.00234)
Constant 0.0235*** 0.0212 0.00560(0.00473) (0.0152) (0.0153)
Observations 7,505 7,231 7,141R-squared 0.000 0.000 0.000
• Placebo test shows that there was no impact in first half of2016 before the referendum and increase in trade policyuncertainty.
Discrete categories
Introduction Theoretical motivation The Brexit referendum Empirical model Data Results Conclusion
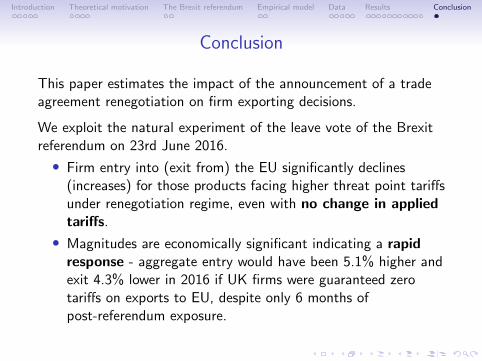
Conclusion
This paper estimates the impact of the announcement of a tradeagreement renegotiation on firm exporting decisions.
We exploit the natural experiment of the leave vote of the Brexitreferendum on 23rd June 2016.
• Firm entry into (exit from) the EU significantly declines(increases) for those products facing higher threat point tariffsunder renegotiation regime, even with no change in appliedtariffs.
• Magnitudes are economically significant indicating a rapidresponse - aggregate entry would have been 5.1% higher andexit 4.3% lower in 2016 if UK firms were guaranteed zerotariffs on exports to EU, despite only 6 months ofpost-referendum exposure.

Appendix
Model assumptions
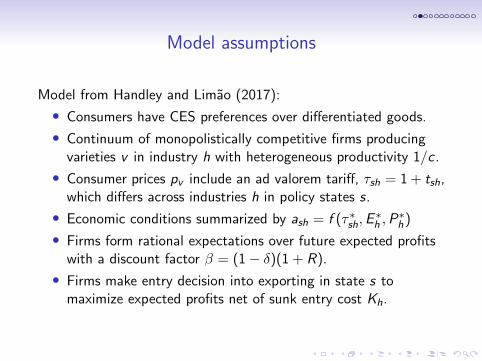
Model from Handley and Limao (2017):
• Consumers have CES preferences over differentiated goods.
• Continuum of monopolistically competitive firms producingvarieties v in industry h with heterogeneous productivity 1/c .
• Consumer prices pv include an ad valorem tariff, τsh = 1 + tsh,which differs across industries h in policy states s.
• Economic conditions summarized by ash = f (τ∗sh,E∗h ,P
∗h)
• Firms form rational expectations over future expected profitswith a discount factor β = (1− δ)(1 + R).
• Firms make entry decision into exporting in state s tomaximize expected profits net of sunk entry cost Kh.
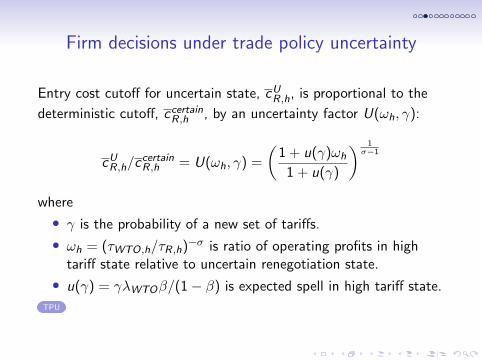
Firm decisions under trade policy uncertainty
Entry cost cutoff for uncertain state, cUR,h, is proportional to the
deterministic cutoff, ccertainR,h , by an uncertainty factor U(ωh, γ):
cUR,h/ccertainR,h = U(ωh, γ) =
(1 + u(γ)ωh
1 + u(γ)
) 1σ−1
where
• γ is the probability of a new set of tariffs.
• ωh = (τWTO,h/τR,h)−σ is ratio of operating profits in hightariff state relative to uncertain renegotiation state.
• u(γ) = γλWTOβ/(1− β) is expected spell in high tariff state.
TPU
Endogenous exit
• Endogenous exit is not explicitly modelled as no per periodfixed cost to export, only sunk entry cost Kh.
• Firms that exogenously exit due to death shock haveopportunity to re-enter and not appear as Exiters.
• Following a trade policy regime shift that increasesuncertainty, the entry cutoff falls ∂cU1h/∂γ < 0. Thereforefirms with cUt,1h < c ≤ cUt+1,1h will enter before the tradepolicy regime switch and not re-enter if hit by exogenousdeath shock after the trade policy regime switch.
Analysis of UK based firms: Discrete tariff categories
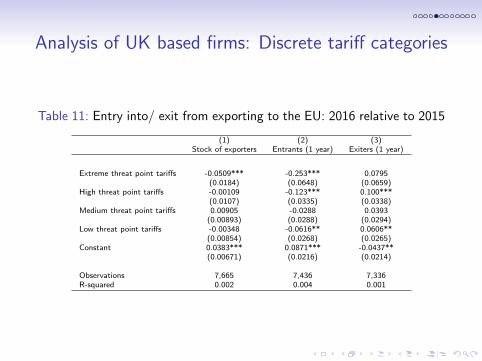
Table 11: Entry into/ exit from exporting to the EU: 2016 relative to 2015
(1) (2) (3)Stock of exporters Entrants (1 year) Exiters (1 year)
Extreme threat point tariffs -0.0509*** -0.253*** 0.0795(0.0184) (0.0648) (0.0659)
High threat point tariffs -0.00109 -0.123*** 0.100***(0.0107) (0.0335) (0.0338)
Medium threat point tariffs 0.00905 -0.0288 0.0393(0.00893) (0.0288) (0.0294)
Low threat point tariffs -0.00348 -0.0616** 0.0606**(0.00854) (0.0268) (0.0265)
Constant 0.0383*** 0.0871*** -0.0437**(0.00671) (0.0216) (0.0214)
Observations 7,665 7,436 7,336R-squared 0.002 0.004 0.001
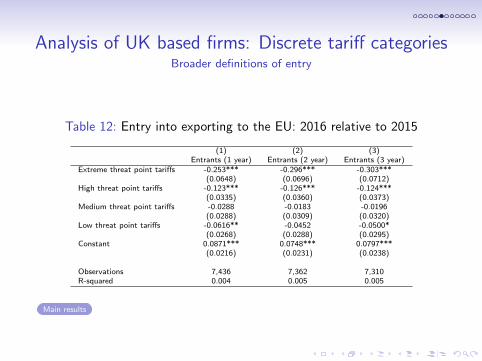
Analysis of UK based firms: Discrete tariff categoriesBroader definitions of entry
Table 12: Entry into exporting to the EU: 2016 relative to 2015
(1) (2) (3)Entrants (1 year) Entrants (2 year) Entrants (3 year)
Extreme threat point tariffs -0.253*** -0.296*** -0.303***(0.0648) (0.0696) (0.0712)
High threat point tariffs -0.123*** -0.126*** -0.124***(0.0335) (0.0360) (0.0373)
Medium threat point tariffs -0.0288 -0.0183 -0.0196(0.0288) (0.0309) (0.0320)
Low threat point tariffs -0.0616** -0.0452 -0.0500*(0.0268) (0.0288) (0.0295)
Constant 0.0871*** 0.0748*** 0.0797***(0.0216) (0.0231) (0.0238)
Observations 7,436 7,362 7,310R-squared 0.004 0.005 0.005
Main results
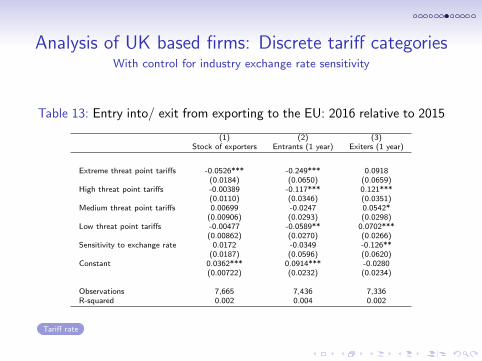
Analysis of UK based firms: Discrete tariff categoriesWith control for industry exchange rate sensitivity
Table 13: Entry into/ exit from exporting to the EU: 2016 relative to 2015
(1) (2) (3)Stock of exporters Entrants (1 year) Exiters (1 year)
Extreme threat point tariffs -0.0526*** -0.249*** 0.0918(0.0184) (0.0650) (0.0659)
High threat point tariffs -0.00389 -0.117*** 0.121***(0.0110) (0.0346) (0.0351)
Medium threat point tariffs 0.00699 -0.0247 0.0542*(0.00906) (0.0293) (0.0298)
Low threat point tariffs -0.00477 -0.0589** 0.0702***(0.00862) (0.0270) (0.0266)
Sensitivity to exchange rate 0.0172 -0.0349 -0.126**(0.0187) (0.0596) (0.0620)
Constant 0.0362*** 0.0914*** -0.0280(0.00722) (0.0232) (0.0234)
Observations 7,665 7,436 7,336R-squared 0.002 0.004 0.002
Tariff rate
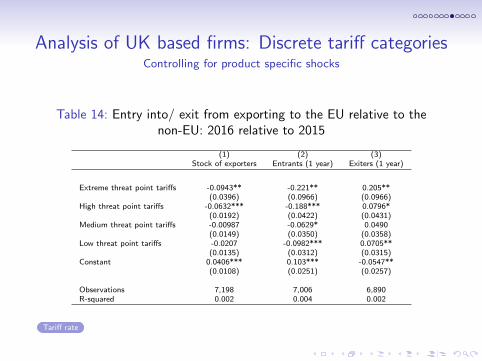
Analysis of UK based firms: Discrete tariff categoriesControlling for product specific shocks
Table 14: Entry into/ exit from exporting to the EU relative to thenon-EU: 2016 relative to 2015
(1) (2) (3)Stock of exporters Entrants (1 year) Exiters (1 year)
Extreme threat point tariffs -0.0943** -0.221** 0.205**(0.0396) (0.0966) (0.0966)
High threat point tariffs -0.0632*** -0.188*** 0.0796*(0.0192) (0.0422) (0.0431)
Medium threat point tariffs -0.00987 -0.0629* 0.0490(0.0149) (0.0350) (0.0358)
Low threat point tariffs -0.0207 -0.0982*** 0.0705**(0.0135) (0.0312) (0.0315)
Constant 0.0406*** 0.103*** -0.0547**(0.0108) (0.0251) (0.0257)
Observations 7,198 7,006 6,890R-squared 0.002 0.004 0.002
Tariff rate
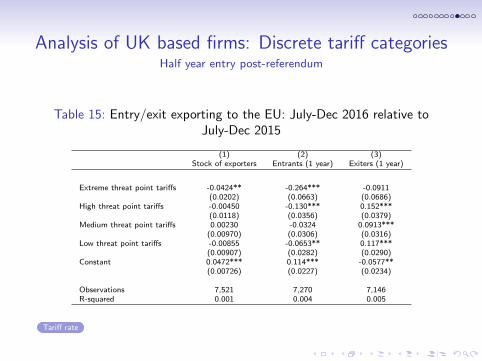
Analysis of UK based firms: Discrete tariff categoriesHalf year entry post-referendum
Table 15: Entry/exit exporting to the EU: July-Dec 2016 relative toJuly-Dec 2015
(1) (2) (3)Stock of exporters Entrants (1 year) Exiters (1 year)
Extreme threat point tariffs -0.0424** -0.264*** -0.0911(0.0202) (0.0663) (0.0686)
High threat point tariffs -0.00450 -0.130*** 0.152***(0.0118) (0.0356) (0.0379)
Medium threat point tariffs 0.00230 -0.0324 0.0913***(0.00970) (0.0306) (0.0316)
Low threat point tariffs -0.00855 -0.0653** 0.117***(0.00907) (0.0282) (0.0290)
Constant 0.0472*** 0.114*** -0.0577**(0.00726) (0.0227) (0.0234)
Observations 7,521 7,270 7,146R-squared 0.001 0.004 0.005
Tariff rate
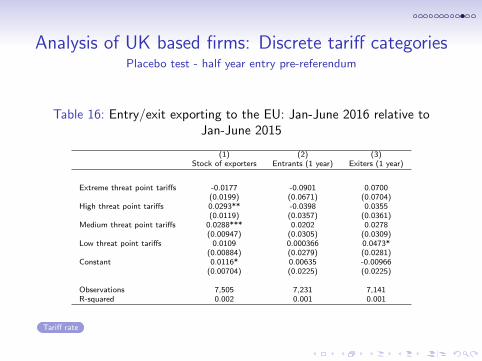
Analysis of UK based firms: Discrete tariff categoriesPlacebo test - half year entry pre-referendum
Table 16: Entry/exit exporting to the EU: Jan-June 2016 relative toJan-June 2015
(1) (2) (3)Stock of exporters Entrants (1 year) Exiters (1 year)
Extreme threat point tariffs -0.0177 -0.0901 0.0700(0.0199) (0.0671) (0.0704)
High threat point tariffs 0.0293** -0.0398 0.0355(0.0119) (0.0357) (0.0361)
Medium threat point tariffs 0.0288*** 0.0202 0.0278(0.00947) (0.0305) (0.0309)
Low threat point tariffs 0.0109 0.000366 0.0473*(0.00884) (0.0279) (0.0281)
Constant 0.0116* 0.00635 -0.00966(0.00704) (0.0225) (0.0225)
Observations 7,505 7,231 7,141R-squared 0.002 0.001 0.001
Tariff rate
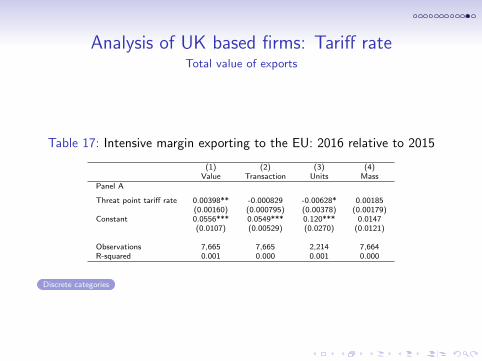
Analysis of UK based firms: Tariff rateTotal value of exports
Table 17: Intensive margin exporting to the EU: 2016 relative to 2015
(1) (2) (3) (4)Value Transaction Units Mass
Panel A
Threat point tariff rate 0.00398** -0.000829 -0.00628* 0.00185(0.00160) (0.000795) (0.00378) (0.00179)
Constant 0.0556*** 0.0549*** 0.120*** 0.0147(0.0107) (0.00529) (0.0270) (0.0121)
Observations 7,665 7,665 2,214 7,664R-squared 0.001 0.000 0.001 0.000
Discrete categories
Analysis of UK based firms: Discrete tariff categoriesTotal value of exports
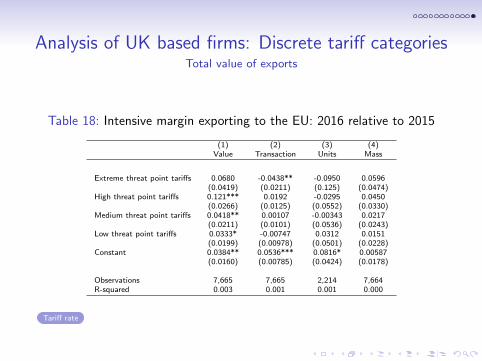
Table 18: Intensive margin exporting to the EU: 2016 relative to 2015
(1) (2) (3) (4)Value Transaction Units Mass
Extreme threat point tariffs 0.0680 -0.0438** -0.0950 0.0596(0.0419) (0.0211) (0.125) (0.0474)
High threat point tariffs 0.121*** 0.0192 -0.0295 0.0450(0.0266) (0.0125) (0.0552) (0.0330)
Medium threat point tariffs 0.0418** 0.00107 -0.00343 0.0217(0.0211) (0.0101) (0.0536) (0.0243)
Low threat point tariffs 0.0333* -0.00747 0.0312 0.0151(0.0199) (0.00978) (0.0501) (0.0228)
Constant 0.0384** 0.0536*** 0.0816* 0.00587(0.0160) (0.00785) (0.0424) (0.0178)
Observations 7,665 7,665 2,214 7,664R-squared 0.003 0.001 0.001 0.000
Tariff rate