Embed Size (px)
Citation preview
1
RENEGOTIATION OF INFRASTRUCTURE TRANSPORT CONCESSION
CONTRACTS IN PERU: AN EMPIRICAL ANALYSIS
(Draft versión 2.0, do not quote)
Julio C. Aguirre M.
Universidad de San Andrés∗
April, 2012
Abstract
The higher frequency of renegotiation of the transport infrastructure concession contracts motivates this
paper. Applying a survival and time series analysis for the Peruvian infrastructure transport concession
contracts, I found that the hazard of renegotiation increases due to some limitations at the designing and
bidding process of the concession contracts, in particular, due to the incomplete expropriation of land at
the beginning of the operation, the mechanism of regulation considered (price cap without RPI-X), the
economic importance of the operator (number of countries in which the firm operates) and the award
criteria (at the auction stage). Also, I found some correlation between electoral cycle and the incidence
and re-incidence of renegotiation. These results could suggest some problems in the designing of
contracts and a probable firm and/or government’s strategic behavior considering the opportunities of
future renegotiation of the contracts. As a consequence, a significant majority of the transport
infrastructure concession contracts remain unmodified no more than 1.25 years. Certainly, these
conclusions motivate further research on the contract theory in utilities for the Peruvian case, mainly its
impact on the society.
JEL Classification: C41, J01, J21, K41, L51, L91, L98
Key words: Survival analysis, Concessions, Renegotiations, Infrastructure, Transport
∗ PhD. Student of the Department of Economics –Universidad de San Andrés, [email protected]. I would like to thank to Martin Rossi for his valuable advice for comments on early draft versions of this paper; and to the Regulation and Legal Legal Areas of Ositran for their support with the data.

2
1.- Introduction
In February 2001, the Peru’s Jorge Chavez International Airport concession was granted and just
after almost two months the contract was modified; in the next three more months, it was modified
again. At 2011, this concession experienced five changes. One of the reasons of that was the incomplete
land expropriation process at the beginning of the bidding process.1 On the other hand, the interregional
highway concession in the Peruvian south (specifically, IIRSA-Sur), sections 2, 3 and 4, as part of the
Initiative for the Integration of Regional Infrastructure in South America (IIRSA), begun in August 2005
costing US$800 millions, however after five years, the concession contract was modified up to seven
times, being the actual cost of the project US$1800 millions, because an initial miscalculation in the
technical feasibility project.
Considering the actual 26 transport infrastructure concession contracts supervised by the Peru’s
regulator authority, Ositran, 20 contracts were modified (76%), meaning 68 addendums with an average
time from award to first renegotiation of 1.82 years.2 According to the World Bank, Peru has the highest
rate of renegotiation in the region.3
Certainly, no contract is perfect, but it is essential to be aware of its imperfect nature due the
presence of transaction costs (Coase, 1937; Williamson, 1995), and, it is not possible that contracting
parties may define ex ante or predict all the contingencies that occur after the signing of the contract.
Moreover, even if that is possible, it would be very expensive to explicit it into a contract and pretend
that courts or authority be able to check all actions under each contingency to enforce them (Tirole,
1999).4
1 An investment commitment by the operator was the construction of a second runway at the 14th year of the concession. Due to the incomplete process of land expropriation required to meet this commitment, the contract had to be modified. 2 According to Guasch (2004), renegotiation incidence and average time until renegotiation in Latin America and The Caribbean transport sector were 55% and 3.12 years, respectively. 3 Newspaper “El Comercio”, from Friday 3th, June 2011. Pp. B-13. 4 For a very concise review of the literature studying the different factors that contribute to the success or failure of a concession, influencing the incidence of renegotiation, see Guasch (2004).
3
Furthermore, although the renegotiation of contracts may arrive at a better contract that could
improve the social welfare, the concern focuses on the fact that the frequent changes could be due,
rather, a bad designing or awarding process of the concession contracts, or a strategic behavior by the
firm or the government, situation that will affect the society. This paper deals with that concern, trying to
identify the main determinants of the renegotiation of transport infrastructure concession contracts in
Peru.
There is a previous specific literature that studies the determinants of renegotiations of contracts
from a theoretical and/or empirical perspective such as, Guasch et al. (2003, 2005, 2006 and 2008) and
Guasch (2003 and 2004). In general, Guasch and his co-authors work over a theoretical model focusing
on an analysis of firm-led renegotiation, obtaining a equation for the probability of renegotiation that
allows them to derive theoretical prediction for some variables (mainly, infrastructure sector, activity,
year of award, award criteria, size and duration of the concession, the institutional and regulatory
context, the type of regulatory framework, the evolution of the main economic variables and the timing
of national and local elections) related to concession contracts in different countries of Latin America
and The Caribbean, covering the water and transport sectors for a period of 12 years and more than 300
concessions.
Applying a probit analysis, the authors find that conditions conducive to renegotiations are
combinations of contract characteristics, regulatory environment and economic shocks. Specifically, the
main pointed to renegotiations being more likely during recessions or after devaluations, after elections,
for concessions awarded before a proper regulatory agency was put in place, regulated by a price cap,
and when the contract included some type of minimum income guarantee. Also, the existence of
investment was shown to reduce the incidence of renegotiation, while a worse institutional environment
(captured by an index of bureaucratic quality) increases it. The table 1 shows the marginal effect of
significant variables on the probability of renegotiation.
[Insert Table 1]
4
In addition to this, Ositran has also showed concern on the renegotiations. Indeed, some
specialists developed technical reports analyzing the designing and awarding process of the concession
contracts delivered by Proinversion (a public entity in charge of the promotion of the private investments
in Peru). Fortunately, those reports were turned in academic working papers. Firstly, Fierro (2011)
focuses on the importance of completing the expropriation of land process prior the signing of a
concession contract; otherwise, the society’s deadweight loss can be important. Making an analysis over
a concession contract of a highway in the southern Peruvian coast, the author identifies some adverse
qualitative impacts to the facilities’ users, such as, delays by not having an adequate provision of
infrastructure, lower chances of receiving more and better services, negative perception by the
population because the increased of the fees for an unfinished road or delays in the execution of works
because the uncompleted land expropriation process.
Secondly, Montesinos and Saavedra (2011) make a revision of the concession contracts in the
Peruvian transport sector characterizing the key determinants of the renegotiations such as, redesign of
works (i.e. delays in the construction stage), problems with financial sustainability of the concession, the
subsidies transfer from the government to the firm and the extension of the term of the contract.
Basically, the authors verify the empirical evidence found by Guash (2004) (Table 1) in the Peruvian
case, making an analysis over the concession contracts supervised by Ositran in the ports, airports, roads
and railways sectors.
Perhaps, Guasch and his co-authors, and Montesinos and Saavedra are the only ones who have
estimated the probability of renegotiations in the transport sector at the Latin American and The
Caribbean region and Peru, respectively, using the same methodology: a probit analysis. On the
contrary, my paper distinguishes from the previous ones by applying a different methodology. Firstly, a
duration analysis, based on Lancaster (1990) and Jenkins (1995, 2005) literature, in order to estimate the
hazard of renegotiation of the Peru’s transport infrastructure concession contracts and how long time
they remain unmodified. An interpretation for a hazard function θ is that θ(t)dt is the probability of exit

5
from a state (leaving the “unmodified status”) in the short interval of length dt after t, conditional on the
state still being occupied at t. If T is length of a contract’s time unmodified, measured in months, then
θ(20) is (approximately) the probability of becoming a renegotiated contract between the months 20 and
21. The phrase “becoming a renegotiated” reflects the fact that the contract was unmodified up through
month 20. That is, θ(20) is roughly the probability of becoming a renegotiated contract between months
20 and 21 conditional on having been unmodified through month 20.
Secondly, I estimate a quarterly-time series analysis with the aim of identify any relationship
between electoral cycles and the incidence (and re-incidence) of renegotiation, trying to find any
observational consequence depending on who initiates the renegotiation: more electoral votes (or
populism), corruption or capture, or mutual interest, whether the renegotiation is initiated by the
government, the concessionaire or both, respectively.
In the duration analysis I found that the transport infrastructure concession contracts remain
unmodified few months, indeed no more than 1.25 years. I highlight that some critical variables
regarding the designing (incomplete land expropriation process and mechanism of regulation of tariffs)
and awarding (award criteria and economic importance of the operator) explain why the contracts in
Peru survive short periods of time without being renegotiated.
In the time series analysis I found a positive statistically significant effect of the electoral cycle
on the incidence (and re-incidence) of renegotiation whoever has initiated the renegotiation process
Up to my knowledge, there are not other papers using duration analysis on economics regulation.
However, it has been used most often in apply work, such as, labor economics (unemployed/employed;
employed/retired), marriage (married/separated), receipt of cash benefits (receiving benefit/receiving
neither), housing tenure (owned-outright/owned with mortgage), crime (release of prison/recidivism),
etc. (Lancaster, 1999; Jenkins, 2005 and Wooldridge, 2010).
On the other hand, the calculation of hazard rates of renegotiation is very important for the
Peruvian context, in which the incoming new concessions require learning from the past experience in
6
order to guarantee, as much as possible, more stable contracts, and a clear and confident rule of law.
Moreover, quantitative estimations of hazards rates of renegotiation lead to a better risk allocation when
selecting and contracting public investment projects (Hinojosa, 2011). As I said at the beginning, the
renegotiation of the IIRSA Sur concession contract in an interregional highway concession in the
Peruvian south led an increase in costs more than doubled. An interesting study in Chile, by Engel et al.
(2009), compares the renegotiated amounts with those invested and originally projected, finding that the
costs of the projects increase 33% over the original investment estimated by the technical bids. Thus, the
government and regulator can reduce transaction costs by identifying the main determinants of
renegotiation.
The rest of the paper is as follows. Section 2 describes the Peruvian concession process and gives
details about the database used. Section 3 presents the econometric models and the results. Section 4
concludes.
2.- The stages of concession process and data
I use a cross section data of 21 (of 265) concession contracts of transport facilities –2 airports, 3
ports, 14 roads and 2 railways- regulated and supervised by Ositran (Table 2) granted between 1999 and
2010. This data contains information of some characteristics about the designing and awarding process
and also some institutional features related to each concession contract.
[Insert Table 2]
Designing, awarding and supervising transport infrastructure concession contracts
The first stage of the concession process is the designing of the contract. Proinversion, a public
entity in charge of the promotion of private investment in infrastructure and other regional projects,
designs the concession contract. Achieving an appropriate balance between the different objectives of
stakeholders (private companies on the one hand and the Estate on the other) is ultimately the target
pursued by a designer of a concession contract (Kerf et al., 1995). This stage is very important because
5 The rest of the concession contracts were not consider given that (i) one of them was granted in 1994 (and was supervised by the Ministry of Transport and Communications until the creation of the regulation authority, Ositran, four years later); and, (ii) the other four were granted during 2011.
7
the incompleteness of contracts. The role of Proinversion consists on the designing of specific rules for
each part of the contract, choosing legal instruments, allocating responsibilities, designing pricing rules
and performance targets, determining bonuses and penalties, duration and termination, adaptation
mechanism to new or unforeseen circumstances and designing dispute settlement mechanisms. These
items should be considered in every contract. During this stage, Ositran has a relevant participation,
giving its opinion and recommendations about the draft version of the concession contract. Normally,
the regulator’s opinion is binding over contractual clauses related to tariff, quality of service, access
conditions; otherwise, about clauses other than those mentioned -the criteria of selection in the auction
process, for example- that opinion is not necessarily considered by Proinversion.
The awarding process of the contract constitutes the second stage. Proinversion is also
responsible of the auction process choosing the award method, making decisions about prequalification
and shortlisting, determining bid structure and evaluation method, determining bidding rules and
procedures, and proceeding with the bidding.
After a contract is signed by the government and the winner bidder, the latter begins with the
operation during the time agreed by contract (defined in the designing stage: more than 25 – 30 years,
frequently) and the former supervises and regulates the operator through Ositran.
Here begins the third stage during which regulatory institutionalism is an important feature in
order to guarantee contractual agreements: Ositran exercises its regulatory function as an autonomous
regulatory agency implementing regulatory rules (determining the tariffs for regulated services based on
efficiency, equity and affordability criteria for the sake of users, and seeking always the financial
sustainability of the facility), surpervising and monitoring (verifying the compliance of the committed
investments and the operation of the infrastructure according to service and quality standards agreed)
and enforcing rules (imposing penalties, for example). In addition, when a process of renegotiation of a
concession contract is initiated by the operator, government or both, Ositran must issue opinion on

8
whether the amendment is made at 100%, partially or not applicable. This opinion is complemented with
the Ministry of Transports and Communications’ one.
Data characteristics
The most interesting feature of the data is the frequency that concession contracts are modified or
renegotiated. There are concession contracts that have been modified more than once (up to six times,
inclusive) (Graph 1) and within short periods of time (three times within a year, for example) (Graph 2).
[Insert Graphs 1 and 2]
Thus, the incidence (and re-incidence6) of renegotiation is critical. Many renegotiations in short
periods of time could be suggesting: on the one hand, a bad designing and awarding process, besides
restrictions on the regulatory activity over them, and also no learning curve from the past experience;
and, on the other, perhaps a signal of strategic behavior by the operator, the government or both.
In order to assess if there are any relationship between the designing, awarding and monitoring
process, and the renegotiation of concession contracts, I considered some available variables according
to the stages of concession contract mentioned previously, i.e. (i) designing process; (ii) awarding
process; and (iii) exercise of regulatory function. Even these variables are similar to those used by
Montesinos and Saavedra (2011) and Guasch (2004) in their probit analysis, the methodology I apply, a
hazard and time series analysis, is different.
For the designing process, I use the following variables for each transport infrastructure
concession contract: typereg, a dummy variable taking values 1, when the mechanism of regulation is a
price-cap scheme without RPI-X, and zero if a price-cap scheme with RPI-X is considered; land, a
dummy variable been 1 if the 100% of lands was given to the operator before subscription of the
contract and zero otherwise; finance, a dummy variable taking values 1 in case of a private operation and
zero for a private-public partnership (PPP); and, duration which is the length (in years) of the contract.
6 That is, those modified contracts renegotiated again.
9
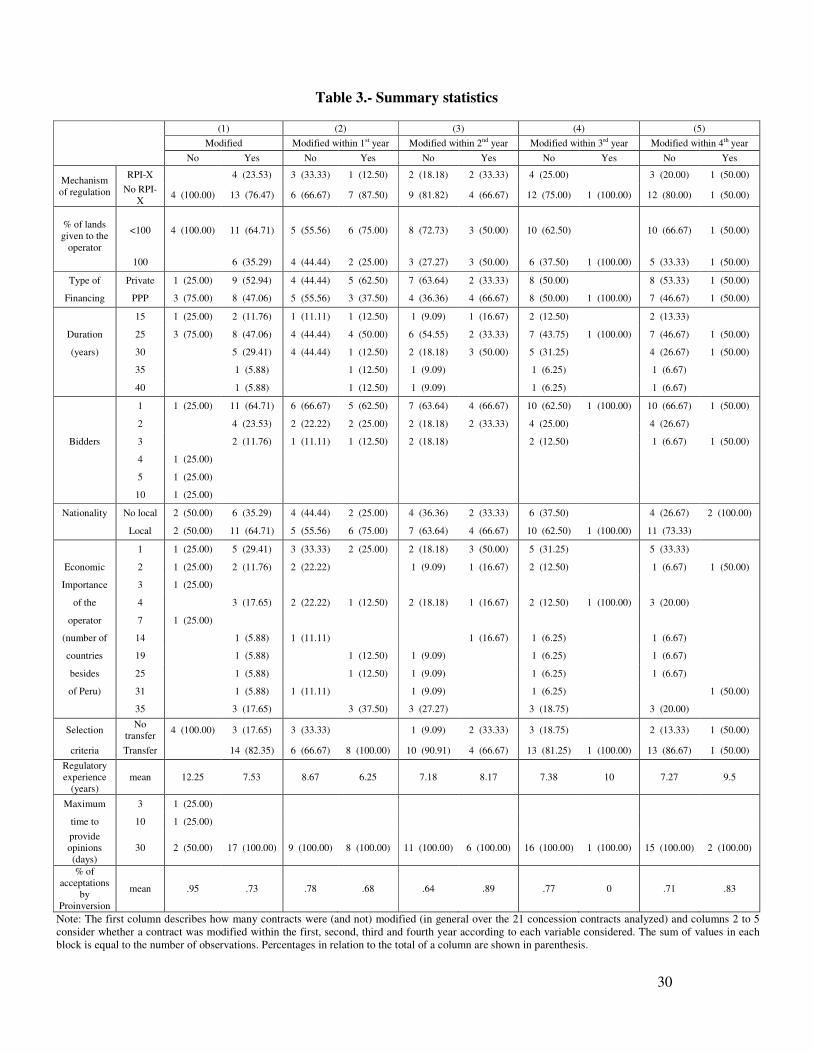
Summary statistics on these variables show that most frequent renegotiations (also within the
first and second year of life of the concession) have placed mainly in the case of contracts with price-
cap without RPI-X schemes, percentage of delivered lands to the operator below 100%, funded by a PPP
mechanism and exceeding 15 years of length.
[Insert Table 3]
Regarding the awarding process of the contract, I use the following variables: bidders, which is
the number of firms competing for a concession contract in the auction; foreign, a dummy variable
which takes 1 if the operator is a Peruvian firm and zero whether the firm is a foreigner or associated one
with a local firm; impope, as a proxy of the economic importance of the operator according to the
number of countries (besides of Peru) in which the firm operates; and, criteria, a dummy variable with 1
if the selection criteria implied an economic transfer from the firm to the government, and zero,
otherwise.
The descriptive data shows that most frequent renegotiations (even in the first and second year of
life of the concession) have placed mainly when the auction is not competitive (fewer bidders pursuing
the concession contract), the concessionaire is a national or local operator and use to operate in more
than one country (besides of Peru), and the criteria of selection in the auction implied a monetary
transfer (lowest subsidy and/or a canon as the highest periodical payment from the concessionaire to the
government).
On the other hand, for the exercise of the regulatory function (mainly, monitoring and
supervising roles by Ositran), I use the following variables: expreg, which is the experience of the
regulator measured in years; timeopi, is the maximum time (in days) (mandatory by law) the regulator
must issue any opinion about the project of new concession contracts; accepted is the percentage of
acceptations by Proinversion of the regulator´s opinions on draft versions of concession contracts
(designed by Proinversion). In addition, in order to control for the macroeconomic environment
10
(economic conjuncture), gdp, the yearly gross domestic production percentage change is considered to
account for a possible impact of economic cycle.
The data shows that most frequent renegotiations has occurred between the 6th and 10th year of
experience of the regulator, in cases where Ositran used the maximum time to provide opinions and
when the percentage of opinions accepted by the concession contract’s designer (Proinversion) is
between 70% and 90%.
Finally, to estimate the relationship between electoral cycles and renegotiation, I regressed the
incidence of renegotiation (i.e. modified concession contracts in a quarter-yearly / total number of
concession contracts in a quarter-yearly) and re-incidence of renegotiation (i.e. modified concession
contracts renegotiated more than once in a quarter-yearly / total number of modified contracts in a
quarter-yearly) initiated by the operator, the government or both of them on a dummy variable, electoral
cycle, which takes 1 if the quarter is an electoral period, and zero, otherwise. The quarterly gross
domestic production percentage change is also used as control.
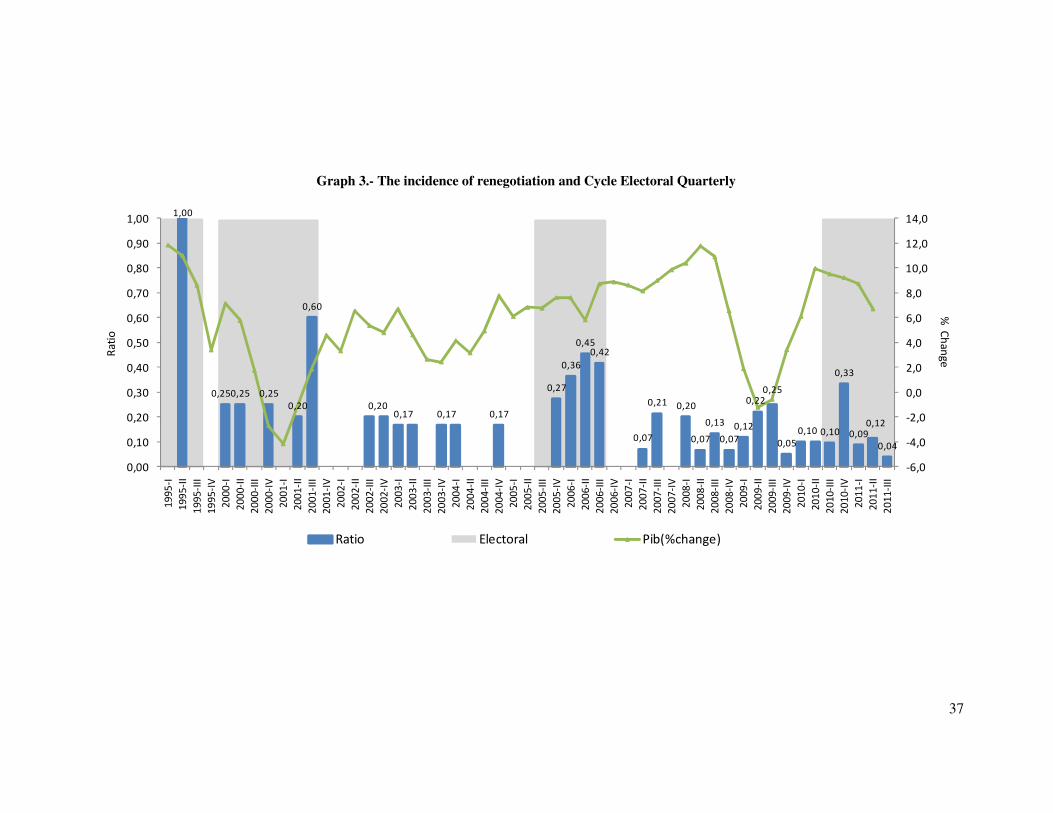
These time series exercises are basically motivated in Graphs 3 and 4, in which apparently it can
be observed how the number of modifications increases with the electoral turnover. There are three
observational consequences that can be inferred from this, depending on who initiates the renegotiation,
more electoral votes (or populism), corruption or capture, or mutual interest, if the renegotiation is
initiated by the government, the concessionaire or both, respectively.
[Insert Graphs 3 and 4]
3.- Econometric methodology and results
Two exercises are made. Firstly, given the small number of observations (21 concession
contracts, granted between 1999 and 2010), the exercise consists on looking at the transition from the
state ‘no renegotiated’ to the state ‘renegotiated’ of each concession contract, conditioned on time-
invariant (and some time-variant) covariates in time applying a survival and hazard (nonparametric and
parametric) analysis. Secondly, as it was explained before, a time series analysis is implemented in order

11
to test any observational consequence between the incidence (and re-incidence) of renegotiation and
electoral cycles.
3.1.- The survival and hazard analysis
Following to Lancaster (1990), I use a survival analysis to model the time taken between the
granting of a concession contract and its renegotiation. A nonnegative random variable T is defined here
as the duration (or spell) between the granting and the renegotiation. Let us define the probability that a
concession contract that has occupied a (unmodified) state for a time t leaves it in the short interval of
length dt after t. The probability that such a contract leaves the state within an interval dt at or after t is
)|( tTdttTtP ≥+<≤ , where the conditioning event that T≥t is just the event that the state is still
occupied at t, that has not left before then. Dividing this probability by dt, we get the average probability
of leaving per unit time period over a short time interval after t, and by considering this average over
shorter and shorter intervals, the hazard function is:
(1) ,)(
)(
)(1
)()|(lim)(
0 tS
tf
tF
tf
dt
tTdTtTtPt
dt=
−=
≥+<≤=
→θ
which is the instantaneous rate of leaving per unit time period at t.7
θ(t)dt can be interpreted as the probability of exit from the unmodified state in the short interval
of length dt after t, conditional on the state being occupied at t. It is also perfectly sensible to talk about
the probability of exit in the short interval of length dt after t without the condition T≥t, but this is a quite
different concept from the hazard function. The hazard function gives the probability that a contract will
be modified at its twentieth month of operation whereas the unconditional concept gives the probability
that a concession contract will be modified at the twentieth month of operation. In terms of relative
frequencies θ(20)dt gives the proportion of twenty-months-operating contract which is modified within
7 Equation (1) can be understood as: )(
)()(
SurvivalP
FailurePRiskt ==θ , where Failure is the unconditional probability that an
event will occur, Survival is the probability that “up until now” the event has not yet occurred, and Risk is the conditional failure rate –given the event has not yet occurred, what are the chances that it will occur? [Available at: https://files.nyu.edu/mrg217/public/essex.htm , visited on Febrary 2nd, 2012 ]
12
dt at its twentieth month of operation. The unconditional concept gives the proportion of contracts which
is modified within dt at the twentieth month of operation.
Let the duration distribution function be 0),()( ≥=< ttFtTP , at the point t, and the associated
probability density function be dttdFtf /)()( = . f(t)is sometimes known as the unconditional failure
rate. Survival analysis makes use of the complement to the cumulative distribution function and is
written as ).()(1)( tTPtFtS ≥=−= That is, the survival function gives the contract’s probability of
survival remains unmodified to t, and also can be expressed as8:
(2) { }∫−=t
dssTS0
)(exp)( θ .
and, from (1) and (2):
(3) { }∫−=t
dssttf0
)(exp)()( θθ
For a parametric estimation, I am also introducing regressors (time-invariant and time-variant
covariates), relevant characteristics (vector X) from the concession contracts data (section 2), into the
hazard function. Thus, at t this is defined as being conditional on the value of X:
(4) { },);(exp);(
);(),|(lim);(
00 ∫−==≥+<≤
=→
t
dtdsxs
xtS
xtf
dt
xtTdTtTtPxt θθ
with time-invariant-covariates, and,
(5) { },)(;(exp))(,|(
lim))(;(00 ∫−=
+≥+<≤=
→
t
dtdssXs
dt
dttXtTdTtTtPtXt θθ
with time-variant covariates.
Nonparametric estimation
Recall that the hazard, θ(tj), is the rate at which spells are completed at duration tj, conditional
upon the spell having a duration of at least tj. So, a natural estimator for θ(tj) is: jjj ndt /)( =∧
θ , i.e., the
number of “failures” at duration tj, divided by the number of spells “at risk” at duration tj. The
8 For the detailed mathematical derivation of the hazard and survival functions in nonparametric and parametric estimations see Lancaster (1990:6-8) and Jenkins (2005: 55-58).
13
corresponding estimator for the survival function is: ∏=
−=j
i j
j
jn
dtS
1
)1()( , which indicates the probability
of surviving past time t, and is the so-called Kaplan-Meier (product-limit) estimator. From this can be
estimated the Nelson-Aalen estimator cumulative hazard: ∑<
∧
=
ttj j
j
j
jn
dtH
|
)( , which measures the total
amount of risk accumulated up to time t, that is, the expected number of failures at each observed time is
just the number of failures at each time period divided by the number at risk, i.e. dj/nj. The cumulative
hazard rate is just the sum of these over time.
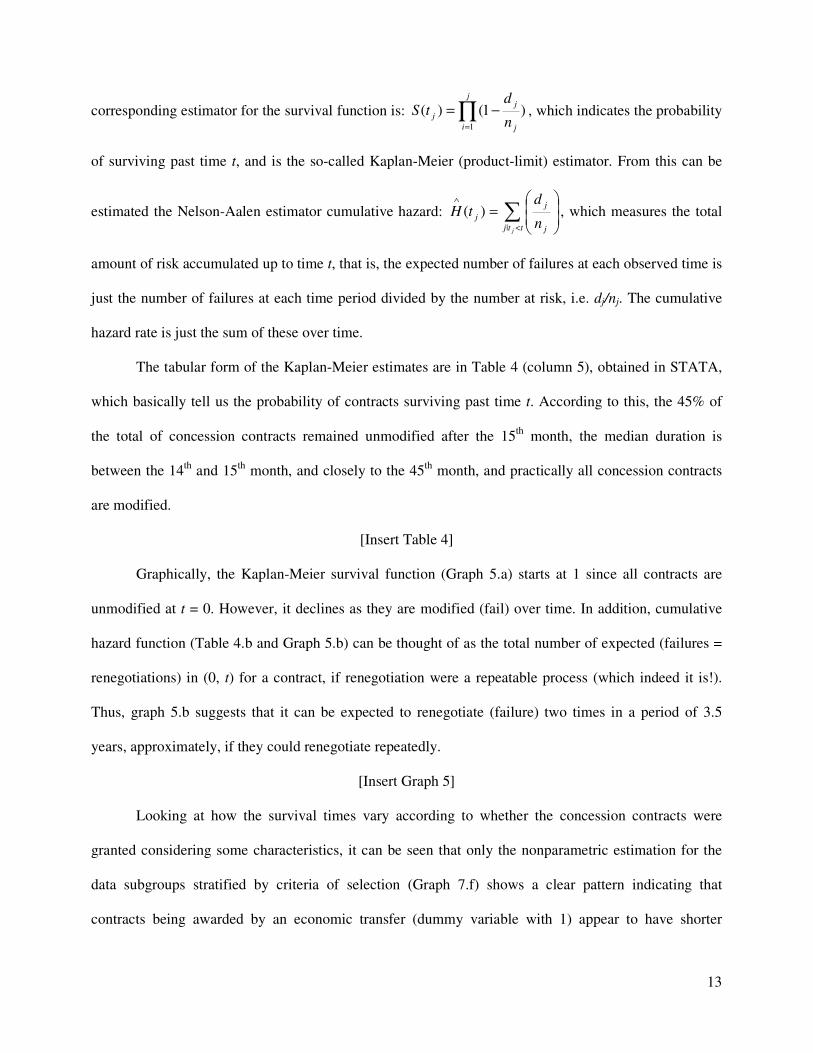
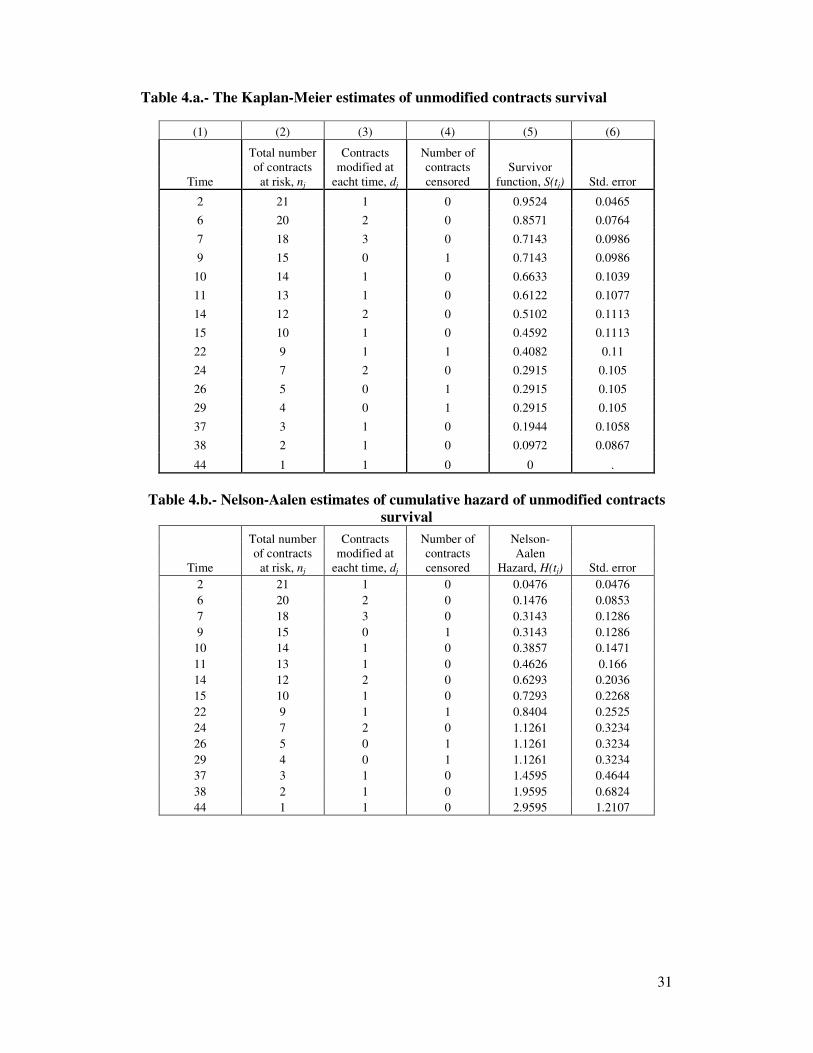
The tabular form of the Kaplan-Meier estimates are in Table 4 (column 5), obtained in STATA,
which basically tell us the probability of contracts surviving past time t. According to this, the 45% of
the total of concession contracts remained unmodified after the 15th month, the median duration is
between the 14th and 15th month, and closely to the 45th month, and practically all concession contracts
are modified.
[Insert Table 4]
Graphically, the Kaplan-Meier survival function (Graph 5.a) starts at 1 since all contracts are
unmodified at t = 0. However, it declines as they are modified (fail) over time. In addition, cumulative
hazard function (Table 4.b and Graph 5.b) can be thought of as the total number of expected (failures =
renegotiations) in (0, t) for a contract, if renegotiation were a repeatable process (which indeed it is!).
Thus, graph 5.b suggests that it can be expected to renegotiate (failure) two times in a period of 3.5
years, approximately, if they could renegotiate repeatedly.
[Insert Graph 5]
Looking at how the survival times vary according to whether the concession contracts were
granted considering some characteristics, it can be seen that only the nonparametric estimation for the
data subgroups stratified by criteria of selection (Graph 7.f) shows a clear pattern indicating that
contracts being awarded by an economic transfer (dummy variable with 1) appear to have shorter

14
survival times9. This observed difference in the survivor functions is statistically significant10. However,
for the other variables, during the time analysis, even the survival function decreases, it is not clear the
pattern of each subgroup, even the economical importance of the operator, in which the observed
difference in the survivor functions is not statistically significant (Graphs 7.a – 7.e). This makes more
appropriate to explore the parametric estimation.
Parametric estimation
Even if an underlying duration is properly viewed as being continuous, measurements are
necessarily discrete. When the measurements are fairly precise, it is sensible to treat the durations as
continuous random variables. But when the measurement are coarse –such as monthly, or perhaps even
weekly- it can be important to account for the discreteness in the estimation (Wooldridge, 2010).
For the parametric estimation, I estimate a discrete time model based on Jenkins (1995 and
2005)’s “easy estimation” methods, applying a standard binary dependent variable model, in which for
each concession contract there are as many data row as there are time intervals at risk of the event
occurring for each contract. If concession contract i’s survival time is censored, the binary dependent
variable is equal to 0 for all i’s spell months; if contract i’s survival time is not censored, the binary
dependent variable is equal to 0 for all but the last of i’s spell months (month 1, …, Ti-1) and equal to 1
for the last month (month Ti). Thus, I have a panel data set where each cross section observation is a
vector of binary responses with covariates. Because of the sequential nature of the data, time-varying
covariates are easily introduced (Wooldridge, 2010).
The discrete time models are estimated by maximum likelihood11 and, in particular for this paper,
I use a discrete time proportional hazard model named the “complementary log-log” and the non-
proportional hazard specification named the “logistic”. The hazard model with time-invariant can be
9 This result will be analyzed deeply later. 10 Two standard test used were the Log-rank and the Wilcoxon tests. If the chi-squared value associated with the test of sufficiently large (associated p-value sufficiently small), then the null hypothesis of no subgroup differences in survivor functions is rejected. In this case, the probability that the observed differences occur by chance is 0.0129 and 0.0209 by Log-rank and Wilcoxon tests, respectively. Thus, the null hypothesis is rejected. 11 See Jenkins (1995: 131-135) and Wooldridge (2010: 1010-1015) for the construction of the likelihood function..

15
written as )()();( 0 txkxt λθ = where 0)( >⋅k is a positive function of x and 0)(0 >tλ is called the
baseline hazard. This is common to all the concession contracts. Individual hazard functions differ
proportionately based on the function k(x) of observed covariates (explanatory variables described
before). )(⋅k can be parameterized as )exp()( βxxk = , where β is the vector of parameters I am
interested on. Thus, )(log)();(log 0 txtzxt λβθ +== and βj measures the semielasticity of the hazard
with respect to xj.12 I use the Complementary log-log (“cloglog”) discrete time hazard function, p(t),
where
))],(exp(exp[1)()())](1log(log[ tztptztp −−=⇒=−−
and a discrete time proportional hazard model named the Logistic discrete time hazard function
(“logistic”), p(t), where
1))](exp(1[)()())](1/()(log[ −−+=⇒=− tztptztptp
The cloglog has the property that the resulting model is the discrete-time counterpart of an
underlying continuous-time proportional hazards model (Prentices and Gloecker, 197813). On the other
hand, the logistic has exactly the same form as that for a standard binary logit regression model (applied
to the reorganized data set). The logistic model turns out to be very similar to the complementary log-log
one in most empirical applications. The reason is that the logistic model converges to a proportional
hazard model as the hazard rates become increasingly small, and the rate is indeed sufficiently small in
most applications. (Jenkins, 1995)
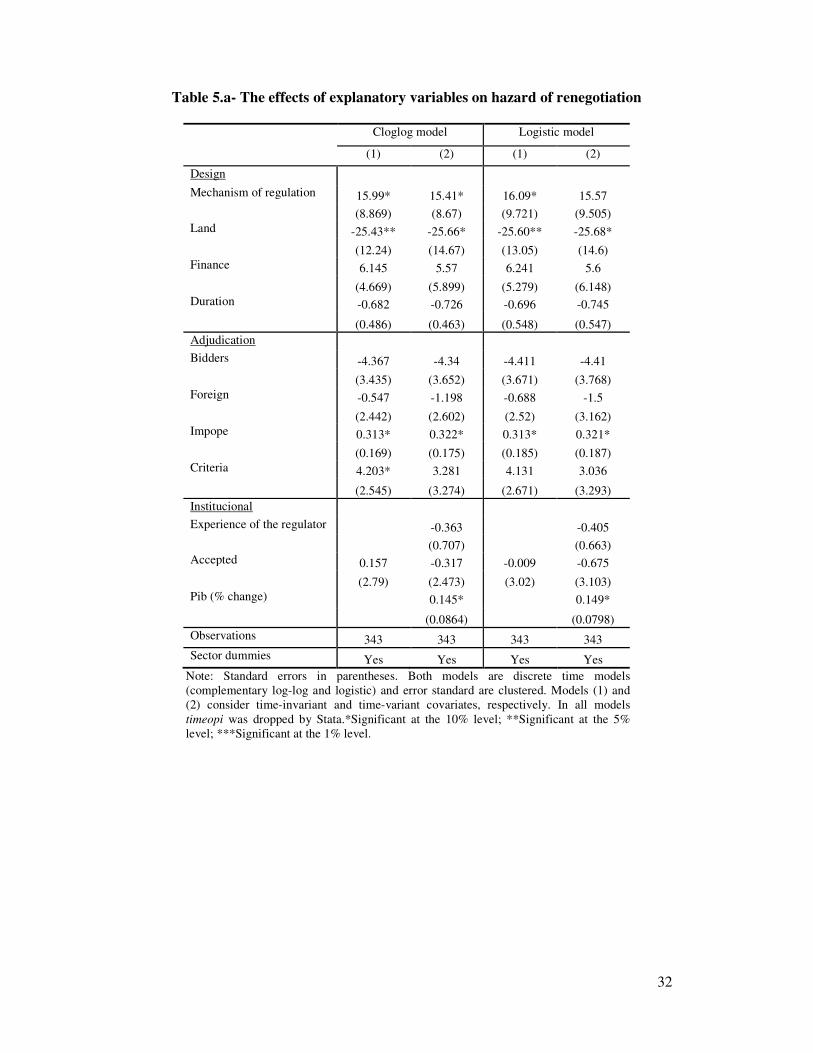
The hazard estimations are reported in Table 5.a. The mechanism of regulation and the
percentage of land delivered to the operator at the beginning of the concession are the only significant
designing process’ explanatory variables. According to the parametric estimation, the sign of the
coefficients of these variables suggests that a price-cap without RPI-X regime and contracts granted with
a full land expropriation completed process increases and decreases the hazard of renegotiation,
12 If xj is the log of an underlying variable, say xj=log(zj), βj is the elasticity of the hazard with respect to zj. 13 Cited by Jenkins (1995).
16
respectively. In addition, the hazard of renegotiation of concession contracts considering a price-cap
without RPI-X mechanism of regulation is 5.07 (by cloglog and 5.74 by logistic estimation) percentage
points higher than those regulated by price-cap with RPI-X. Moreover, the hazard of renegotiation when
the concession contracts are granted with land completely expropriated is 98.65 (by cloglog and 83.86
by logistic estimation) percentage points lower than those granted with an incomplete land expropriation
process.
In addition, the predictions (within and out of – sample) performed with the hazard estimations
show that for any duration of the contracts (15, 25 and 30 years) the hazard rates of renegotiation
increase quickly for those with a price-cap without RPI-X mechanism of regulation (graphs 7.a, 8.a, 9.a,
10.a) or has a short period survival (as an unmodified contract) (graph 10.b). Regarding, the percentage
of land delivered to the operator, the predictions exercises report that the contracts remain more time
without being modified when that percentage is 100% (graphs 7.b, 8.b, 9.b and 10.c).
[Insert Graphs 7, 8, 9 and 10]
On the contrary, the variables foreign and duration of the contract are not significant. This
suggests that neither the type of financial structure of the concession (PPP or private operation) nor the
length of the concession influence on the hazard of renegotiation.
[Insert Tables 5a and 5b]
Regarding the adjudication group of variables, the economic importance of the operator and the
award criteria are the only significant invariant covariates and have a positive effect on the hazard of
renegotiation; however, their marginal impact is scarce: the operation of the firm in another country in
addition to those already involved increases the hazard of renegotiation in just 0.35 percentage points;
and, the hazard of renegotiation of concession contracts granted under a criteria of selection considering
a economic transfer is 4.67 (by cloglog and 5.17 by logistic estimations) percentage points higher than
those granted under a non-economic transfer as a criteria of selection.
17
Furthermore, the predictions (within and out of – sample) performed with the hazard estimations
show that for any duration of the contracts (15, 25 and 30 years) the hazard rates of renegotiation
increase quickly for those with an economic transfer as an award criteria (graphs 7.f, 8.f and 9.f) or has a
short period survival (as an unmodified contract) (graph 10.g). Regarding, the economical importance of
the operator, the predictions exercises report that the contracts remain more time without being modified
with operator less important (graphs 7.e, 8.e, 9.e and 10.f).
Perhaps, the negative sign of the variable bidders could highlight how a competitive process
(more than one bidder at the adjudication process) reduces the hazard of renegotiation, but it is not
significant. In addition, the nationality of the operator has not influence on the hazard of renegotiation.
Regarding the institutional variables, only the macroeconomic environment is significant,
accounting for a possible impact of economic cycle on the hazard of renegotiation. In the case of the
other two variables, experience of the regulator and the percentage of acceptations by Proinversion of
the Ositran’s opinions on draft versions of concession contracts (designed by Proinversion), the negative
sign of the former, which suggests that more Ositran’s expertise reduces the hazard of renegotiation, it is
not significant; and the latter, apparently would not have any impact on the hazard of renegotiation.
3.2- Quarterly-times series analysis
I implement a quarterly-time series for the incidence of renegotiation (modified concession
contracts in a quarter / total number of concession contracts) initiated by the operator, the government or
both on an electoral cycle dummy variable, taking the value 1 if the quarter is a electoral period, and
zero, otherwise. Also, I evaluate if the re-incidence of renegotiation (i.e. modified concession contracts
renegotiated more than once / total number of modified contracts) is influenced by the cycle electoral
too.
These exercises are basically motivated in Graphs 3 and 4, in which apparently it can be
observed how the number of modifications increases with the electoral turnover. There are three
observational consequences that can be inferred from this, depending on who initiates the renegotiation,
18
(i) more electoral votes (or populism), (ii) corruption or capture, or (iii) mutual interests, depending on
whether the renegotiation is initiated by the government, the concessionaire or both, respectively.
I want to test if there is any relationship between electoral cycles (measured in quarterly-years)
and the incidence of renegotiation in order to find observational consequences as partial evidence of
strategic behavior by the operator, the government or both.
The models to be estimated are:
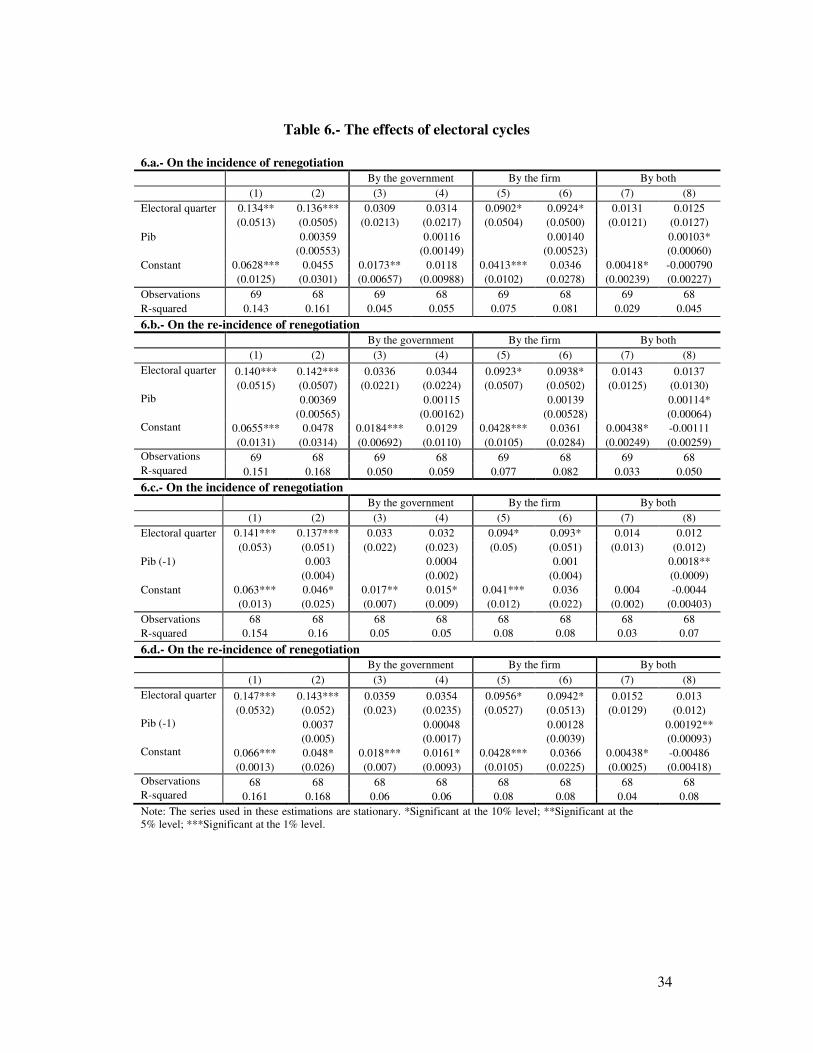
)1(ttttt GDPCycleElectoralionrenegotiatofIncidence εβγα +++=
)2(1 ttttt GDPCycleElectoralionrenegotiatofIncidence εβγα +++= +
)3(1 ttttt GDPCycleElectoralionrenegotiatofIncidence εβγα +++= −
where γ is the parameter of interest for the dummy Electoral Cyclet taking the value 1 if the quarter-
yearly is an electoral period (or in the next quarter) and zero otherwise; GDPt and GDPt-1 is the current
and lagged yearly gross domestic product (percentage change), respectively, and ε is the error term. The
dependent variable Incidence of renegotiationt (and Re-incidence of renegotiation) is measured as the
ratio “number of modified concession contracts in the quarter-yearly t to stock of concession contracts
modified and unmodified in the quarter-yearly t” (and “number of more than once modified concession
contracts in the quarter-yearly t to stock of concession contracts already modified in the quarter-yearly
t”) . The results of regressions are displayed in Tables 6.
[Insert Table 6]
In general, results show a positive statistically significant effect of the electoral cycle on the
incidence (and re-incidence) of renegotiation whoever has initiated the renegotiation process (columns 1
and 2 in each table). Moreover, when the dependent variable is the incidence (and re-incidence) of
renegotiation initiated by the firm (columns 5 and 6 in each table), the electoral cycle has a positive
statistically significant effect either with the current quarterly percent change of the PIB or with a lagged
one period quarterly percent change of the PIB (tables 6.a. to 6.d). But, when the cycle electoral is
19
forwarded one quarter, this variable has a positive statistically significant effect on the re-incidence of
renegotiations initiated by the government (tables 6.e and 6.f).
4.- Concluding remarks
The estimations suggest that the transport infrastructure concession contracts remain unmodified
few months, indeed no more than 1.25 years. Certainly, it is a very short duration compared to the 3.12
years, in average, calculated by Guasch (2004) for the Latin American region. However, it is important
have on consideration that per se a renegotiation is not bad unless the new conditions of the modified
contract do not improve the welfare of the parts (operator and government). Certainly this paper does not
analyze the impact of the renegotiation but is concerned on why the contracts do not survive more time
without being modified. As I mentioned in the introductory section, applying a survival analysis, I
highlight that some critical variables regarding the designing and awarding process of a concession
contract could be explaining why the contracts in Peru survive short periods of time without being
renegotiated.
According to the Ositran’s Legal Advisory Area, the main reasons which have determined
amendments to the infrastructure concession contracts are related to: (i) “works”, which represents 47%
of the cases of the renegotiations, meaning procedures for recognition of work in progress, details of
some technical aspects, and additional investments necessary to modify the construction of the
infrastructure; (ii) “funding” and “assets of the concession”, each one with 10%. The former means
some limitations accessing to financial support by banks, which will make easy the execution of the
works or the operation of the concession; the latter refers to features about the concessions’ assets in
terms of ownership and management; (iii) "budget difficulties", which represents 8% of the
renegotiations (and only related to Public-Private Partnership highway concessions), caused by
necessary upgrade of the initial budget (which was elaborated based on preliminary studies before the
concession) necessary for additional works and new traffic flows conditions roads; (iv) “payments to the
operator", "extension of duration of the contract" represent 6% each one. While the former refers to the
20
recognition of additional activities defined at first place by contract, the latter deals with the term of the
contract; (v) “land expropriation” and “completion of the contract” controversies have 5% each one; (vi)
arbitrage controversies with 4%; (vii) “tariffs settings” and “retribution to the state” with 3% each one;
and, (viii) “others" categories such as modifications to the first technical design, salaries, insurance and
guarantees. In some way, the variables I used in the survival analysis are in relation with the previous
issues, such as, land expropriation, mechanism of regulation (tariffs), award criteria, finance of the
concession (PPP or private), and duration of the contract.
The incomplete process of expropriation of land adjacent to areas of scope of concessions is the
first critical variable, which has a strong statistical effect on the instability of the contracts. Looking at
the sample, 64.7% (11 contracts) of the 17 renegotiated contracts were granted with an incomplete land
expropriation process (Table 3). The problem is compounded because many contracts have an explicit
clause of granting revocation for failure in delivering of land. Fierro (2011) explains in a deeply way the
consequences of this issue. The Ministry of Transport and Communications, entity in charge of the
mechanism of land expropriation, is constrained with some difficulties to complete the process.
Problems such as failing to reach an agreement in prices with the landowners, finding them in their
locations (because many do not live in the city or in the country), or some legal problems associated
with the property (licenses, taxes, etc.) take place.
Thus, an adequate study of the land conditions has to be performed before any concession
process. Otherwise, problems will arise given the delays in the construction phases of the concession,
which will lead to make amendments to the contracts. Moreover, it could create a not convenient
precedent that may be rather used for strategic purposes by new operators, knowing that it is possible to
modify the contract in the future concession contracts grants. In terms of social welfare, users and
government are losers, the former because they cannot have an on time access to the facilities (paid with
taxes, in essence) and the latter have to change conditions (in the contract) as a consequence of the
renegotiation, besides the deterioration of its reputation from an institutional perspective.
21
On the other hand, trying to understand why the mechanism of regulation determines a lower
survival rate of the concession contracts is not simple. According to my estimations, the hazard of
renegotiation considering a price-cap without RPI-X mechanism is between 5 and 6 percentage points
higher than those contracts regulated by a price-cap with RPI-X mechanism. Contrary to the Guasch and
others’ studies, in which the contracts analyzed are regulated through a price-cap, rate-of-return or
hybrid regimes, in the Peruvian case, price-cap (with or without RPI-X) has been the regime most
widely used. When the RPI-X is not considered, the tariffs were contractually stipulated (price-cap) and
updated by a polynomial formula (considering the inflation rates, mainly).
Looking at the sample, 76.5% (13 contracts) of the 17 renegotiated contracts were granted with
price-cap without RPI-X (Table 3), in roads and railways, particularly. Looking at the addendums in
more detail, one can see that the reasons why an operator renegotiates a contract depend of many factors
which are tied. For example, Proinversion arrives to the final design of the concession contract after a
referential or a pre-feasibility study of the project, instead of feasibility one. So it is possible that this
fact makes that the operator demands a change in the tariffs set by contract because the projected
demand in the referential study was wrong. However, even the RPI-X mechanism had been
considered14, this do not necessary decrease the intention to renegotiate, because all the risk of demand
(and input costs) is transferred to the operator, motivating instead a renegotiation for change the minimal
conditions of standards quality of some inputs (Guasch, 2004).
The award criteria is the third critical variable, which increases around 5 percentage points the
hazard of renegotiation when they were granted under a economic transfer, such as the highest transfer
fee, used in the first concession contracts at the end and beginning of 2000, in the case of the
International Airport Jorge Chavez, the Matarani Port, and the Central, South and South-West Railways.
14 For roads, railways and for the first and second group of regional airports the tariffs were stipulated in the contract. However, for the ports and the International Airport, tariffs were fixed during a first period of time, and from then the contract orders the application of the RPI-X, every five years. According to the theory of regulation, one advantage of the RPI-X regulation mechanism is the incentive it places on firms to improve efficiency (Viscusi, et al., 2005).
22
Looking at the sample, 82.4% (14 contracts) of the 17 renegotiated contracts were granted considering
an economic transfer as award criteria (Table 3).
The theory of auctions explains that through an auction wins the highest efficient firm, however,
it is important considering the award criteria given the risk that a firm bids a to high offer (“the winner’s
curse”) that rather, in the future, cannot fulfill with the clauses of the contract, for example, the
committed investments (Demsetz, 1968). An example of this, was the International Airport Jorge
Chavez concession that was granted to a consortium (led by Frankfurt Airport operator, Bechtel, and a
local partner), which submitted the highest bid, given that the criteria of selection was the percentage of
the gross revenue that the operator would commit to turn over to the state.15 Shortly after the award, the
concession contract was renegotiated at the end of 2003, because the operator has been delaying agree-
upon investments. Hinojosa (2008) recalls the importance of mitigate a potential renegotiation due to
problems of “lowballing”, which refers to the case in which a bidder could make a risky bid (a
high payment) in order to make a subsequent contract renegotiation, which would be
facilitated by contractual gaps and a high capacity of lobby.
The economic importance of the operator is the fourth variable that has an effect on the duration
of contracts being modified in shorter periods. Approximated by the number of countries besides of
Peru, in which the operator runs other utilities, it implies higher possibility of getting experience
(“learning by doing”) at the auction stages of the contract with strategic purposes. As Guash (2004)
explains, once players anticipate renegotiation, the game changes strategically. The objective is to secure
the concession and renegotiate for better terms. That might induce risky offers and lead to the selection
not of the most efficient operator but one most skilled in renegotiation.
In Peru there is a particular situation with a Brazilian firm, which has an important participation
in the construction of the highways of IIRSA-Sur (and also in another infrastructure sectors -e.g.
15 The winning bid offered the state 47% of gross revenue in addition to a commitment to invest more than US$ 1 billion and construct a second landing strip by the 11th year of the 30-year concession. As Guash (2004) says, it means that from the residual 53% of gross revenue, the operator will be able to cover operating costs, amortize investments, and earn a fair rate of return on investments.
23
hydroelectric- in Peru and in other countries). Its reputation in the media is that it has a strong lobby
influence on the government. An anecdotic situation results the construction of a monument for a former
president as a “donation”.16
Finally, regarding the impact of economic cycle on the hazard of renegotiation, it can be
conjectured that Peru has been experimenting interesting growing rates in the last 10 years, influencing
the incidence of renegotiation. However, this fact is more interesting if is seen jointly with the electoral
cycles.
Applying a quarterly-time series analysis, I find a positive correlation between electoral cycles
and the incidence (and re-incidence) of renegotiation. Thinking on corruption and mutual interests
suppose that operators see the government as an entity subject to influence, increasing their possibilities
of renegotiation, and capture additional rents (Guash, 2004). Regarding populism, an interesting paper
by Mejía et al. (2008) analyzed the factors that explain budgetary allocations for road infrastructure
during the first Uribe administration, in Colombia. Concretely, the analysis contrasts the importance of
technical and political criteria in budgetary decisions. Their evidence suggests that some political criteria
have predominance and that technical criteria have no incidence in the definition of investment on road
infrastructure. Their data shows a positive relationship between spending on roads and holding Consejos
Comunales, supporting the hypothesis that spending on road infrastructure is a populist.
The results I obtained in time series analysis let me make some conjectures related to the Guash
(2004) and Mejia et al. (2008) findings. First, the electoral cycles influence the incidence and re-
incidence of renegotiation. During the 1990s and the first half of the 2000s the political speech was that
Peru had to be open to the foreign investment for the operation of public firms under efficiency criteria.
Privatization was the first option and the government initiated an aggressive way of privatizations and
concessions. However, during the second half of the 2000s and beginnings of 2010 - 2012 period, the
political speech changed to “social inclusion” is necessary. Precisely, during the Alan Garcia’s
16 See: http://www.larepublica.pe/13-06-2011/odebrecht-es-el-aportante-del-cristo-de-alan-garcia
24
government have the highest rates of incidence of renegotiation suggesting a conflict between technical
and political criteria. The designer of the concession contracts gave signals that the goal was “sell” as
soon as they can because it is important for the Peruvian economic development.
The result is a suboptimal concession contract. For instance, the interregional highway
concession in the south of Peru (IIRSA-Sur), sections, 2, 3 and 4, which were granted with the low
subsidy as an (economic transfer) award criteria. In this particular case, as I mentioned above, the design
of the contract depends on the preliminary technical studies conducted by Proinversion, determining a
total cost of the project in US$ 0.8 billion, however the concession contract was modified given that the
true cost of the project was US$ 1.8 billion, because an initial miscalculation in the technical feasibility
project.
I have to recognize some limitations of my estimations. Firstly, a weakness of the econometric
estimates is that, one could argue contract clauses are endogenous (Guasch, Laffont, and Straub, 2003),
because two dimensions: (i) an ex ante self-selection problem, because the contracting parties would
select specific clauses, type of regulation, and financing according to their (sometimes unobservable)
characteristics or to the characteristics of the project. This can be the case of the conflict between
technical and political criteria in the Peruvian policy of concessions, and (ii) an ex post moral hazard
problem. Once the contract has been signed, the firm and the government would act strategically given
the nature of this contract.
Secondly, the presence of unobserved heterogeneity (“frailty) given omitted variables
(unobservable variables in the available data) or measurement errors in observed survival time or
regresors (Lancaster, 1990; Jenkins 2005). If this is ignored, the duration literature suggests several
disadvantages: (i) the “no-frailty- model will over-estimate the degree of negative duration dependence
in the hazard (i.e. underestimated the degree of positive duration dependence), (ii) the proportionate
response of a given regressor on the hazard rate is no longer constant and independent of survival time,
and (iii) the presence of unobserved heterogeneity attenuates the proportionate response of the hazard to
25
variation in each regressor at any survival time. In short the estimate of a positive (negative) βk derived
from the (wrong) no-frailty model will underestimate (overestimate) the “true” estimate.
I do not deal with the first problem considering instrumental variables, but for the second I
estimate the frailty models in STATA, and the frailty problem is not important suggesting that my initial
results are correct.17
Finally, it is important to have on consideration that the sample is small (21 observations),
another handicap, so it will be interesting to develop a survival analysis with a sample more extended
and establish some comparisons between the Latin American countries. And, this paper is concerned on
highlight why the transport infrastructure concession contracts remain unchanged for short periods of
time looking at variables which can explain a quickly decreasing rate of survival. From an efficiency
perspective, if a concession contract is modified, it is because it improves the Peruvian society welfare.
Like in Chile (Engel et al., 2009), research on this topic is an interest issue for future studies.
References
Coase, R. (1937). The Nature of the Firm. Economica, n.s.4.
Demsetz, H. (1968). Why regulate utilities? Journal of Law and Economics 11.
Engel, E., R. Fisher, A. Galetovic and M. Hermosilla (2009). Renegociación de Concesiones en
Chile. Estudios Públicos 113, Verano.
Estache, A. and Quesada, L. (2001). Concession Contracts Renegotiation: The Efficiency and
Equity Dilemma. Policy Research Working Paper No 2705. The World Bank, Washington, D.C.
Fierro, C. (2011). Concesiones y terrenos no saneados: cuando una obligación pierde su
naturaleza. Revista de Regulación en Infraestructura de Transporte No 6, Ositran.
Guasch, J.L. (2003). Infrastructure Concessions in Latin America and the Caribbean: The
Renegotiation Issue and Its Determinants. Infrastructure and Financial Markets Review 9(2): 1-6.
17 The frailty estimations are available by request.

26
Guasch, J.L. (2004). Granting and Renegotiating Infrastructure Concessions. Doing it Right. WBI
Development Studies. The World Bank, Washington, D.C.
Guasch, J.L., J-J. Laffont and S. Straub (2003). Renegotiation of Concession Contracts in Latin
America. Policy Research Working Paper No 3011. The World Bank, Washington, D.C.
Guasch, J.L., J-J. Laffont and S. Straub (2005). Concessions of Infrastructure in Latin America:
Government-Led Renegotiation. ESE Discussion Papers 132. University of Edingurgh.
Guasch, J.L., J-J. Laffont and S. Straub (2006). Renegotiation of Concession Contracts: A
Theoretical Approach. Review of Industrial Organization, 29: 55-73.
Guasch, J.L., J-J. Laffont and S. Straub (2008). Renegotiation of Concession Contracts in Latin
America: Evidence from the water and transport sectors. International Journal of Industrial Organization
2:421-442.
Mejía, L.B., F. Botero and J.C. Rodríguez (2008). Paving roads with votes? Budgetary allocations
for road infrastructure projects in Colombia, 2002 – 2006. Colombia Internacional 68, jul-dic, pp. 14-42.
Hart, O. and Moore, J. (1988). Incomplete Contracts and Renegotiation. Econometrica 56: 755-85.
Jenkins, S. (1995). Easy Estimation Methods for Discrete-Time Duration Models. Oxford Bulletin
of Economics and Statistics, 57,1.
Hinojosa, S. (2008). Ofertas Temerarias y Opciones Reales de Renegociación de Contratos.
IKONS ATN, Mimeo
Jenkins, S. (2005). Survival Analysis with Stata: Module EC968, University of Essex Summer
School. Available in: http://www.iser.essex.ac.uk/resources/survival-analysis-with-stata-module-ec968
Jeon, D.S., and Laffont, J-J. (1999). Renegotiation of Concession Contracts: A Theoretical
Framework. The World Bank, Washington, D.C.
Kerf, M., R.D. Gray, T. Irwin, C. Levesque and R. Taylor (1995). Concessions. A Guide to the
Design and Implementation of Concession Arrangements for Infrastructure Services, The World Bank,
Washington, D.C.

27
Lancaster, T. (1990). The Econometric Analysis of Transition Data, Cambridge University Press.
Montesinos, J. and Saavedra, E. (2011). Renegociación de Concesiones: Evidencia Empírica para
la Infraestructura de Transporte Público en el Perú", mimeo.
Tirole, J. (1999). Incomplete Contracts: Where Do We Stand? Econometrica 67:741 -81.
Viscusi, W.K. , J.E. Harrington and J.M. Vernon (2005). Economics of Regulation and Antitrust,
Fourth Edition, The MIT Press.
Williamson, O. (1995). The Economic Institutions of Capitalism. New York: Free Press.
Wooldridge, J.M. (2010). Econometric Analysis of Cross Section and Panel Data, Second Edition,
The MIT Press.

28
Table 1.- Marginal effects of significant variables on the probability of
renegotiation Variable Marginal effect (%)
Existence of regulatory body Award criteria Type of regulation Autonomy of regulatory body Investment obligations Nationality of concessionaire Extent of competition in award process Macroeconomic shocks (devaluations) Electoral cycles Award process
20 – 40 20 – 30 20 – 30 10 – 30 10 – 20 10 – 20 10 – 20 10 – 15
3 – 5 10 - 20
Source: Guasch (2004)

29
Table 2.- Concessions of transport infrastructure supervised by Ositran
Infrastructure
Year of
subscription Airports 1.- Aeropuerto Internacional Jorge Chávez* 2.- Primer grupo de aeropuertos regionales* (Iquitos, Pucallpa, Trujillo, Tarapoto, Cajamarca, Tumbes, Anta, Chachapoyas, Talara, Piura, Chiclayo y Pisco) 3.-Segundo grupo de aeropuertos regionales (Andahuaylas, Ayacucho, Juliaca, Arequipa, Puerto Maldonado y Tacna)
2001 2006
2011
Roads 4.-IIRSA-Norte (Eje Multimodal Amazonas Norte: Paita – Yurimaguas)* 5.- Red Vial 5 (Ancón – Huacho – Pativilca)* 6.- Red Vial 6 (Puente Pucusana-Cerro Azul-Ica)* 7.- Autopista del Sol Trujillo – Sullana* 8.- IIRSA Sur T5 (Azángaro – Juliaca; Puerto de Matarani e Ilo)* 9.- IIRSA Sur T4 (Azángaro – Inambari)* 10.- IIRSA Sur T3 (Inambari – Iñapari)* 11.- IIRSA Sur T2 (Urcos – Inambari)* 12.- IIRSA Sur T1 (Marcona – Urcos)* 13.- Buenos Aires – Canchaque* 14.- Tramo Vial Nuevo Mocupe – Cayaltí – Oyotún)* 15.- Red Vial 4 (Pativilca – Santa – Trujillo y Puerto Salaverry – Empalme R01N)* 16.- Tramo Vial Óvalo Chancay/Desvío Variante Pasamayo – Huaral – Acos)* 17.- IIRSA Centro Tramo 2*
2005 2003 2005 2009 2007 2005 2005 2005 2007 2007 2009 2009 2009 2010
Railways 18.- Ferrocarril del Centro* 19.- Ferrocarril del Sur y Sur Oriente* 20.- Tren Eléctrico-Línea 1 (Villa El Salvador – Av. Grau – San Juan de Lurigancho)
1999 1999 2011
Ports 21.- Terminal Portuario de Matarani* 22.- Nuevo Terminal de Contenedores del Muelle Sur* 23.- Terminal Portuario de Paita* 24.-Terminal de Embarque de Concentrado de Minerales 25.- Terminal Norte Multipropósito en el Terminal Portuario del Callao 26.- Nuevo Terminal Portuario de Yurimaguas - Nueva Reforma
1999 2006 2009 2011 2011 2011
Source: Online portal of Ositran. *Concession contracts considered in the econometric analysis.
30
Table 3.- Summary statistics
(1) (2) (3) (4) (5)
Modified Modified within 1st year Modified within 2nd year Modified within 3rd year Modified within 4th year
No Yes No Yes No Yes No Yes No Yes
Mechanism of regulation
RPI-X 4 (23.53) 3 (33.33) 1 (12.50) 2 (18.18) 2 (33.33) 4 (25.00)
3 (20.00) 1 (50.00)
No RPI-X
4 (100.00) 13 (76.47) 6 (66.67) 7 (87.50) 9 (81.82) 4 (66.67) 12 (75.00) 1 (100.00) 12 (80.00) 1 (50.00)
% of lands given to the
operator
<100 4 (100.00) 11 (64.71) 5 (55.56) 6 (75.00) 8 (72.73) 3 (50.00) 10 (62.50)
10 (66.67) 1 (50.00)
100 6 (35.29) 4 (44.44) 2 (25.00) 3 (27.27) 3 (50.00) 6 (37.50) 1 (100.00) 5 (33.33) 1 (50.00)
Type of Private 1 (25.00) 9 (52.94) 4 (44.44) 5 (62.50) 7 (63.64) 2 (33.33) 8 (50.00)
8 (53.33) 1 (50.00)
Financing PPP 3 (75.00) 8 (47.06) 5 (55.56) 3 (37.50) 4 (36.36) 4 (66.67) 8 (50.00) 1 (100.00) 7 (46.67) 1 (50.00)
15 1 (25.00) 2 (11.76) 1 (11.11) 1 (12.50) 1 (9.09) 1 (16.67) 2 (12.50)
2 (13.33)
Duration 25 3 (75.00) 8 (47.06) 4 (44.44) 4 (50.00) 6 (54.55) 2 (33.33) 7 (43.75) 1 (100.00) 7 (46.67) 1 (50.00)
(years) 30 5 (29.41) 4 (44.44) 1 (12.50) 2 (18.18) 3 (50.00) 5 (31.25)
4 (26.67) 1 (50.00)
35 1 (5.88)
1 (12.50) 1 (9.09)
1 (6.25)
1 (6.67)
40 1 (5.88)
1 (12.50) 1 (9.09)
1 (6.25)
1 (6.67)
1 1 (25.00) 11 (64.71) 6 (66.67) 5 (62.50) 7 (63.64) 4 (66.67) 10 (62.50) 1 (100.00) 10 (66.67) 1 (50.00)
2 4 (23.53) 2 (22.22) 2 (25.00) 2 (18.18) 2 (33.33) 4 (25.00)
4 (26.67)
Bidders 3 2 (11.76) 1 (11.11) 1 (12.50) 2 (18.18)
2 (12.50)
1 (6.67) 1 (50.00)
4 1 (25.00)
5 1 (25.00)
10 1 (25.00)
Nationality No local 2 (50.00) 6 (35.29) 4 (44.44) 2 (25.00) 4 (36.36) 2 (33.33) 6 (37.50)
4 (26.67) 2 (100.00)
Local 2 (50.00) 11 (64.71) 5 (55.56) 6 (75.00) 7 (63.64) 4 (66.67) 10 (62.50) 1 (100.00) 11 (73.33)
1 1 (25.00) 5 (29.41) 3 (33.33) 2 (25.00) 2 (18.18) 3 (50.00) 5 (31.25)
5 (33.33)
Economic 2 1 (25.00) 2 (11.76) 2 (22.22)
1 (9.09) 1 (16.67) 2 (12.50)
1 (6.67) 1 (50.00)
Importance 3 1 (25.00)
of the 4 3 (17.65) 2 (22.22) 1 (12.50) 2 (18.18) 1 (16.67) 2 (12.50) 1 (100.00) 3 (20.00)
operator 7 1 (25.00)
(number of 14 1 (5.88) 1 (11.11)
1 (16.67) 1 (6.25)
1 (6.67)
countries 19 1 (5.88)
1 (12.50) 1 (9.09)
1 (6.25)
1 (6.67)
besides 25 1 (5.88)
1 (12.50) 1 (9.09)
1 (6.25)
1 (6.67)
of Peru) 31 1 (5.88) 1 (11.11)
1 (9.09)
1 (6.25)
1 (50.00)
35 3 (17.65)
3 (37.50) 3 (27.27)
3 (18.75)
3 (20.00)
Selection No
transfer 4 (100.00) 3 (17.65) 3 (33.33)
1 (9.09) 2 (33.33) 3 (18.75)
2 (13.33) 1 (50.00)
criteria Transfer 14 (82.35) 6 (66.67) 8 (100.00) 10 (90.91) 4 (66.67) 13 (81.25) 1 (100.00) 13 (86.67) 1 (50.00)
Regulatory experience
(years) mean 12.25 7.53 8.67 6.25 7.18 8.17 7.38 10 7.27 9.5
Maximum 3 1 (25.00)
time to 10 1 (25.00)
provide opinions (days)
30 2 (50.00) 17 (100.00) 9 (100.00) 8 (100.00) 11 (100.00) 6 (100.00) 16 (100.00) 1 (100.00) 15 (100.00) 2 (100.00)
% of acceptations
by Proinversion
mean .95 .73 .78 .68 .64 .89 .77 0 .71 .83
Note: The first column describes how many contracts were (and not) modified (in general over the 21 concession contracts analyzed) and columns 2 to 5 consider whether a contract was modified within the first, second, third and fourth year according to each variable considered. The sum of values in each block is equal to the number of observations. Percentages in relation to the total of a column are shown in parenthesis.
31
Table 4.a.- The Kaplan-Meier estimates of unmodified contracts survival
(1) (2) (3) (4) (5) (6)
Time
Total number of contracts
at risk, nj
Contracts modified at
eacht time, dj
Number of contracts censored
Survivor function, S(tj) Std. error
2 21 1 0 0.9524 0.0465
6 20 2 0 0.8571 0.0764
7 18 3 0 0.7143 0.0986
9 15 0 1 0.7143 0.0986
10 14 1 0 0.6633 0.1039
11 13 1 0 0.6122 0.1077
14 12 2 0 0.5102 0.1113
15 10 1 0 0.4592 0.1113
22 9 1 1 0.4082 0.11
24 7 2 0 0.2915 0.105
26 5 0 1 0.2915 0.105
29 4 0 1 0.2915 0.105
37 3 1 0 0.1944 0.1058
38 2 1 0 0.0972 0.0867
44 1 1 0 0 .
Table 4.b.- Nelson-Aalen estimates of cumulative hazard of unmodified contracts
survival
Time
Total number of contracts
at risk, nj
Contracts modified at
eacht time, dj
Number of contracts censored
Nelson-Aalen
Hazard, H(tj) Std. error 2 21 1 0 0.0476 0.0476 6 20 2 0 0.1476 0.0853 7 18 3 0 0.3143 0.1286 9 15 0 1 0.3143 0.1286
10 14 1 0 0.3857 0.1471 11 13 1 0 0.4626 0.166 14 12 2 0 0.6293 0.2036 15 10 1 0 0.7293 0.2268 22 9 1 1 0.8404 0.2525 24 7 2 0 1.1261 0.3234 26 5 0 1 1.1261 0.3234 29 4 0 1 1.1261 0.3234 37 3 1 0 1.4595 0.4644 38 2 1 0 1.9595 0.6824 44 1 1 0 2.9595 1.2107
32
Table 5.a- The effects of explanatory variables on hazard of renegotiation
Cloglog model Logistic model
(1) (2) (1) (2)
Design
Mechanism of regulation 15.99* 15.41* 16.09* 15.57
(8.869) (8.67) (9.721) (9.505) Land -25.43** -25.66* -25.60** -25.68* (12.24) (14.67) (13.05) (14.6) Finance 6.145 5.57 6.241 5.6 (4.669) (5.899) (5.279) (6.148) Duration -0.682 -0.726 -0.696 -0.745 (0.486) (0.463) (0.548) (0.547) Adjudication
Bidders -4.367 -4.34 -4.411 -4.41 (3.435) (3.652) (3.671) (3.768) Foreign -0.547 -1.198 -0.688 -1.5 (2.442) (2.602) (2.52) (3.162) Impope 0.313* 0.322* 0.313* 0.321* (0.169) (0.175) (0.185) (0.187) Criteria 4.203* 3.281 4.131 3.036 (2.545) (3.274) (2.671) (3.293) Institucional
Experience of the regulator -0.363 -0.405
(0.707)
(0.663)
Accepted 0.157 -0.317 -0.009 -0.675 (2.79) (2.473) (3.02) (3.103) Pib (% change) 0.145* 0.149*
(0.0864) (0.0798) Observations 343 343 343 343 Sector dummies Yes Yes Yes Yes
Note: Standard errors in parentheses. Both models are discrete time models (complementary log-log and logistic) and error standard are clustered. Models (1) and (2) consider time-invariant and time-variant covariates, respectively. In all models timeopi was dropped by Stata.*Significant at the 10% level; **Significant at the 5% level; ***Significant at the 1% level.

33
Table 5.b.- Impact (marginal) effects on hazard of renegotiation
Cloglog model Logistic model
(1) (2) (1) (2) Desing Mechanism of regulation 0.0507 0.03057 0.0575 0.03508
(0.0461) (0.03308) (0.0459) (0.03383)
Land -0.9866** -0.95902** -0.83866** -0.78363** (0.06996) (0.31345) (0.18612) (0.38551) Adjudication Impope 0.00031 0.00022 0.000353 0.00025
(0.00075) (0.00053) (0.00087) (0.00061)
Criteria 0.00468 0.00223 0.005176 0.00226
(0.01004) (0.00447) (0.01131) (0.00479)
Institutional PIB (% change) 0.00009 0.000115 (0.00026) (0.00032) Marginal effects of dependent variable 0.00099 0.000682 0.00113 0.000767
Note: dy/dx is for discrete change of dummy variable from 0 to 1. Standard errors in parentheses. Both models are discrete time models (complementary log-log and logistic) and error standard are clustered. Models (1) and (2) consider time-invariant and time-variant covariates, respectively. *Significant at the 10% level; **Significant at the 5% level; ***Significant at the 1% level.
34
Table 6.- The effects of electoral cycles
6.a.- On the incidence of renegotiation
By the government By the firm By both (1) (2) (3) (4) (5) (6) (7) (8) Electoral quarter 0.134** 0.136*** 0.0309 0.0314 0.0902* 0.0924* 0.0131 0.0125
(0.0513) (0.0505) (0.0213) (0.0217) (0.0504) (0.0500) (0.0121) (0.0127) Pib 0.00359 0.00116 0.00140 0.00103*
(0.00553) (0.00149) (0.00523) (0.00060) Constant 0.0628*** 0.0455 0.0173** 0.0118 0.0413*** 0.0346 0.00418* -0.000790
(0.0125) (0.0301) (0.00657) (0.00988) (0.0102) (0.0278) (0.00239) (0.00227) Observations 69 68 69 68 69 68 69 68 R-squared 0.143 0.161 0.045 0.055 0.075 0.081 0.029 0.045
6.b.- On the re-incidence of renegotiation
By the government By the firm By both (1) (2) (3) (4) (5) (6) (7) (8) Electoral quarter 0.140*** 0.142*** 0.0336 0.0344 0.0923* 0.0938* 0.0143 0.0137
(0.0515) (0.0507) (0.0221) (0.0224) (0.0507) (0.0502) (0.0125) (0.0130) Pib 0.00369 0.00115 0.00139 0.00114*
(0.00565) (0.00162) (0.00528) (0.00064) Constant 0.0655*** 0.0478 0.0184*** 0.0129 0.0428*** 0.0361 0.00438* -0.00111
(0.0131) (0.0314) (0.00692) (0.0110) (0.0105) (0.0284) (0.00249) (0.00259) Observations 69 68 69 68 69 68 69 68 R-squared 0.151 0.168 0.050 0.059 0.077 0.082 0.033 0.050
6.c.- On the incidence of renegotiation
By the government By the firm By both (1) (2) (3) (4) (5) (6) (7) (8) Electoral quarter 0.141*** 0.137*** 0.033 0.032 0.094* 0.093* 0.014 0.012
(0.053) (0.051) (0.022) (0.023) (0.05) (0.051) (0.013) (0.012) Pib (-1) 0.003 0.0004 0.001 0.0018**
(0.004) (0.002) (0.004) (0.0009) Constant 0.063*** 0.046* 0.017** 0.015* 0.041*** 0.036 0.004 -0.0044
(0.013) (0.025) (0.007) (0.009) (0.012) (0.022) (0.002) (0.00403) Observations 68 68 68 68 68 68 68 68 R-squared 0.154 0.16 0.05 0.05 0.08 0.08 0.03 0.07
6.d.- On the re-incidence of renegotiation
By the government By the firm By both (1) (2) (3) (4) (5) (6) (7) (8) Electoral quarter 0.147*** 0.143*** 0.0359 0.0354 0.0956* 0.0942* 0.0152 0.013
(0.0532) (0.052) (0.023) (0.0235) (0.0527) (0.0513) (0.0129) (0.012) Pib (-1) 0.0037 0.00048 0.00128 0.00192**
(0.005) (0.0017) (0.0039) (0.00093) Constant 0.066*** 0.048* 0.018*** 0.0161* 0.0428*** 0.0366 0.00438* -0.00486
(0.0013) (0.026) (0.007) (0.0093) (0.0105) (0.0225) (0.0025) (0.00418) Observations 68 68 68 68 68 68 68 68 R-squared 0.161 0.168 0.06 0.06 0.08 0.08 0.04 0.08 Note: The series used in these estimations are stationary. *Significant at the 10% level; **Significant at the 5% level; ***Significant at the 1% level.

35
Table 6.- (continue…) The effects of electoral cycles
6.e.- On the incidence of renegotiation
By the government By the firm By both (1) (2) (3) (4) (5) (6) (7) (8) Electoral quarter (+1) 0.081 0.075 0.036 0.035 0.031 0.028 0.014 0.013
(0.051) (0.048) (0.022) (0.022) (0.049) (0.048) (0.013) (0.013) Pib 0.005 0.001 0.003 0.001*
(0.005) (0.002) (0.005) (0.0006) Constant 0.083* 0.060* 0.016** 0.011 0.063*** 0.050 0.004* -0.0009
(0.019) (0.034) (0.007) (0.01) (0.02) (0.03) (0.002) (0.002) Observations 68 68 68 68 68 68 68 68 R-squared 0.05 0.06 0.06 0.07 0.01 0.01 0.03 0.05
6.f.- On the re-incidence of renegotiation
By the government By the firm By both (1) (2) (3) (4) (5) (6) (7) (8) Electoral quarter (+1) 0.088* 0.082* 0.039* 0.038* 0.033 0.029 0.015 0.014
(0.052) (0.048) (0.023) (0.022) (0.049) (0.045) (0.013) (0.013) Pib 0.005 0.001 0.003 0.0012*
(0.006) (0.002) (0.005) (0.0007) Constant 0.085*** 0.062* 0.017** 0.012 0.064*** 0.052 0.004* -0.001
(0.019) (0.036) (0.007) (0.011) (0.018) (0.034) (0.002) (0.003) Observations 68 68 68 68 68 68 68 68 R-squared 0.057 0.07 0.07 0.07 0.001 0.01 0.04 0.05
Note: The series used in these estimations are stationary. *Significant at the 10% level; **Significant at the 5% level; ***Significant at the 1% level.

36
Graph 1.- Number of amendments of transport infrastructure concession contracts
18
13
11
9
6
3
0
4
8
12
16
20
at least once more than
once
more than
twice
more than
thrice
more than
four times
more than six
times
Nu
mb
er
of
Co
ntr
ac
ts
Source: Legal Advisory Area - Ositran. Own elaboration
Graph 2.- Frequency of modification of transport infrastructure concession
contracts
0,5
0,8
1,3
3,6
1,9
1,2
0,1
1,2
3,1
3,0
0,9
0,6
0,6
0,6
0,5
1,9
1,8
2,8
2,5
5,0
0,1
0,3
1,6
0,2
0,3
0,3
0,2
1,6
1,0
0,8
1,4
0,5
1,2
0,2
0,1
0,1
0,4
0,9
2,6
7,1
1,6
0,2
0,7
2,6
1,0
1,0
2,8
2,8
1,1
0,2
2,0
1,6
0,8
1,0
0,2
0,9
0,4
0,3
0,4
0,9
0,9
0,5
0 1 2 3 4 5 6 7 8 9 10 11 12 13
Ferrocarril del Sur y Sur Oriente
Ferrocarril del Centro
Terminal Portuario de Paita
Terminal Contenedores Muelle Sur Callao
Terminal Portuario de Matarani
Primer Grupo de Aeropuertos Regionales
Aeropuerto Jorge Chávez
IIRSA Centro, Tramo 2
Autopista del Sol Trujillo - Sullana
Tramo Vial - Mocupe - Cayaltí - Oyotún
Tramo Vial - Ovalo Chancay - Huaral - Acos
Red Vial Nº 4
IIRSA Sur, Tramo 5
IIRSA Sur, Tramo 1
Buenos Aires-Canchaque
IIRSA Sur, Tramo 4
IIRSA Sur, Tramo 3
IIRSA Sur, Tramo 2
IIRSA Norte
Red Vial Nº 6
Red Vial Nº 5
years
1st Renegotiation 2nd Renegotiation
3rd Renegotiation 4th Renegotiation
5th Renegotiation 6th Renegotiation
7th Renegotiation 8th Renegotiation
roa
ds
rail
s
po
rts
air
po
rts
Source: Legal Advisory Area - Ositran. Own elaboration
37
Graph 3.- The incidence of renegotiation and Cycle Electoral Quarterly
1,00
0,250,25 0,25
0,20
0,60
0,200,17 0,17 0,17
0,27
0,36
0,450,42
0,07
0,21 0,20
0,07
0,13
0,07
0,12
0,220,25
0,05
0,10 0,10
0,33
0,090,12
0,04
-6,0
-4,0
-2,0
0,0
2,0
4,0
6,0
8,0
10,0
12,0
14,0
0,00
0,10
0,20
0,30
0,40
0,50
0,60
0,70
0,80
0,90
1,00
19
95
-I
19
95
-II
19
95
-III
19
95
-IV
20
00
-I
20
00
-II
20
00
-III
20
00
-IV
20
01
-I
20
01
-II
20
01
-III
20
01
-IV
20
02
-I
20
02
-II
20
02
-III
20
02
-IV
20
03
-I
20
03
-II
20
03
-III
20
03
-IV
20
04
-I
20
04
-II
20
04
-III
20
04
-IV
20
05
-I
20
05
-II
20
05
-III
20
05
-IV
20
06
-I
20
06
-II
20
06
-III
20
06
-IV
20
07
-I
20
07
-II
20
07
-III
20
07
-IV
20
08
-I
20
08
-II
20
08
-III
20
08
-IV
20
09
-I
20
09
-II
20
09
-III
20
09
-IV
20
10
-I
20
10
-II
20
10
-III
20
10
-IV
20
11
-I
20
11
-II
20
11
-III
% C
ha
ng
eRa
tio
Ratio Electoral Pib(%change)

38
Graph 4.- The re-incidence of renegotiation and Cycle Electoral Quarterly
1,00
0,50
0,33 0,33
0,25
0,60
0,20 0,20 0,200,17
0,430,40
0,50
0,10
0,270,25
0,08
0,17
0,08
0,17
0,33
0,42
0,08
0,15 0,14
0,41
0,12
0,18
0,06
-6,0
-4,0
-2,0
0,0
2,0
4,0
6,0
8,0
10,0
12,0
14,0
0,00
0,10
0,20
0,30
0,40
0,50
0,60
0,70
0,80
0,90
1,00
19
95
-I
19
95
-II
19
95
-III
19
95
-IV
20
00
-I
20
00
-II
20
00
-III
20
00
-IV
20
01
-I
20
01
-II
20
01
-III
20
01
-IV
20
02
-I
20
02
-II
20
02
-III
20
02
-IV
20
03
-I
20
03
-II
20
03
-III
20
03
-IV
20
04
-I
20
04
-II
20
04
-III
20
04
-IV
20
05
-I
20
05
-II
20
05
-III
20
05
-IV
20
06
-I
20
06
-II
20
06
-III
20
06
-IV
20
07
-I
20
07
-II
20
07
-III
20
07
-IV
20
08
-I
20
08
-II
20
08
-III
20
08
-IV
20
09
-I
20
09
-II
20
09
-III
20
09
-IV
20
10
-I
20
10
-II
20
10
-III
20
10
-IV
20
11
-I
20
11
-II
20
11
-III
% C
ha
ng
eRa
tio
Ratio Electoral Pib(%change)

39
Graph 5.- Survival and hazard functions a.- Kaplan-Meier survival function b.- Nelson-Aalen Cumulative hazard function
0.00
0.25
0.75
1.00
0.50
S(t
)
0 10 20 30 40Time (months)
0.00
1.00
2.00
3.00
Cum
ulat
ive
haza
rd
0 10 20 30 40Time (months)
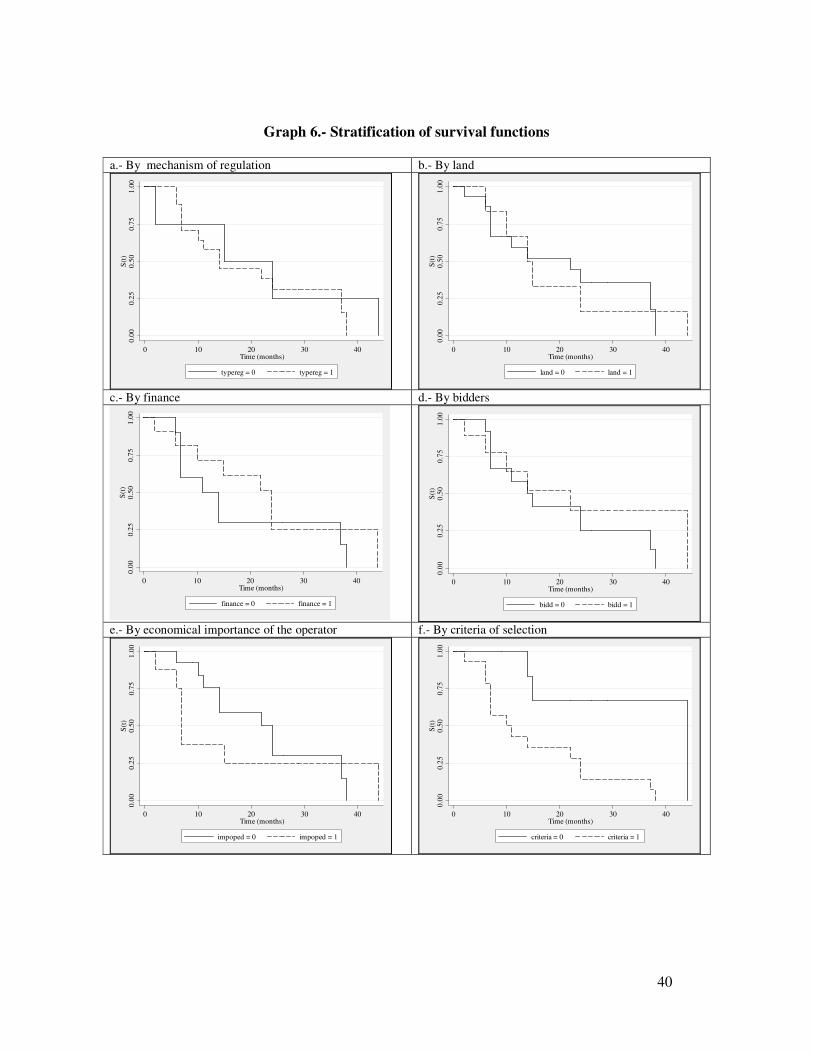
40
Graph 6.- Stratification of survival functions
a.- By mechanism of regulation b.- By land
0.00
0.25
0.50
0.75
1.00
S(t
)
0 10 20 30 40Time (months)
typereg = 0 typereg = 1
0.00
0.25
0.50
0.75
1.00
S(t
)
0 10 20 30 40Time (months)
land = 0 land = 1
c.- By finance d.- By bidders
0.00
0.25
0.50
0.75
1.00
S(t
)
0 10 20 30 40Time (months)
finance = 0 finance = 1
0.00
0.25
0.50
0.75
1.00
S(t
)
0 10 20 30 40Time (months)
bidd = 0 bidd = 1
e.- By economical importance of the operator f.- By criteria of selection
0.00
0.25
0.50
0.75
1.00
S(t
)
0 10 20 30 40Time (months)
impoped = 0 impoped = 1
0.00
0.25
0.50
0.75
1.00
S(t
)
0 10 20 30 40Time (months)
criteria = 0 criteria = 1

41
Graph 7.- Within-sample hazard rates prediction for a 15-years concession contracts
duration
a.- Mechanism of regulation b.- Land
0.1
.2.3
.4.5
0 10 20 30 40spell month identifier, by contract
Price cap with RPI-X Price cap without RPI-X
0.1
.2.3
.4.5
0 10 20 30 40spell month identifier, by contract
<100% 100%
c.- Finance d.- Bidders
0.1
.2.3
.4.5
0 10 20 30 40spell month identifier, by contract
Private-Public Partnership Private
0.1
.2.3
.4.5
0 10 20 30 40spell month identifier, by contract
bidder = 1 bidder > 1
e.- Economical importance of the operator f.- Criteria of selection
0.1
.2.3
.4.5
0 10 20 30 40spell month identifier, by contract
Lower economical importance Higher economical importance
0.1
.2.3
.4.5
0 10 20 30 40spell month identifier, by contract
No economic transfer Economic transfer
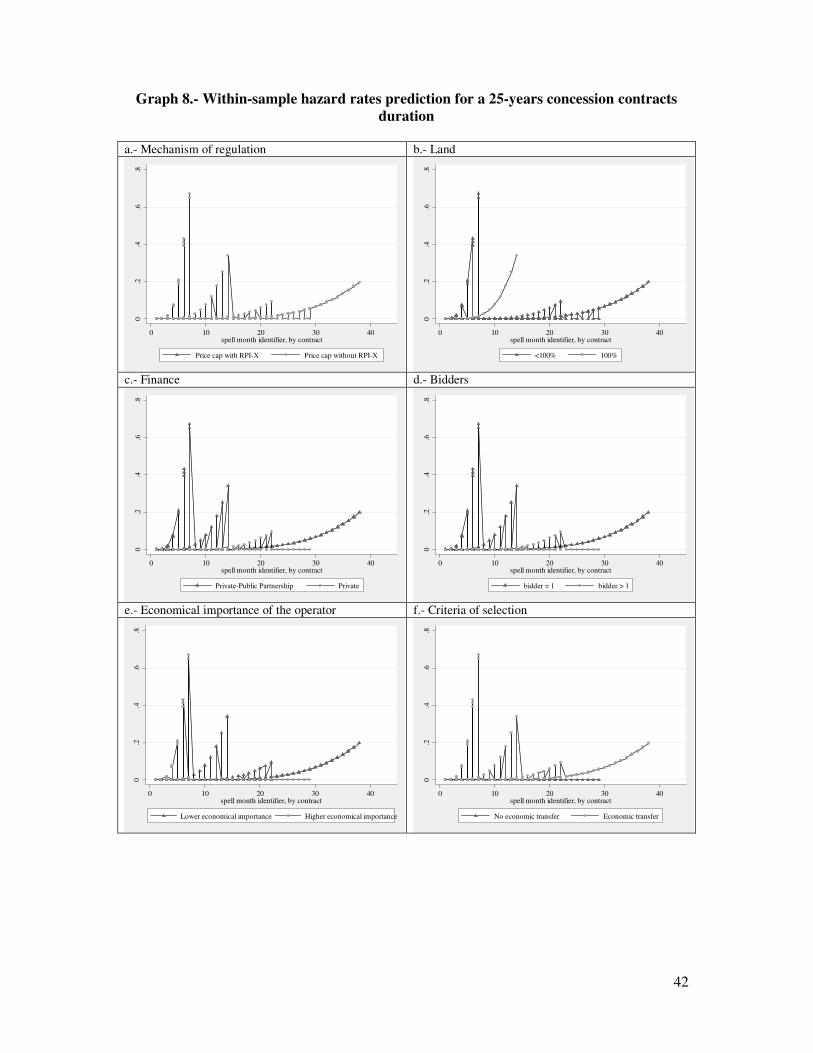
42
Graph 8.- Within-sample hazard rates prediction for a 25-years concession contracts
duration
a.- Mechanism of regulation b.- Land
0.2
.4.6
.8
0 10 20 30 40spell month identifier, by contract
Price cap with RPI-X Price cap without RPI-X
0.2
.4.6
.8
0 10 20 30 40spell month identifier, by contract
<100% 100%
c.- Finance d.- Bidders
0.2
.4.6
.8
0 10 20 30 40spell month identifier, by contract
Private-Public Partnership Private
0.2
.4.6
.8
0 10 20 30 40spell month identifier, by contract
bidder = 1 bidder > 1
e.- Economical importance of the operator f.- Criteria of selection
0.2
.4.6
.8
0 10 20 30 40spell month identifier, by contract
Lower economical importance Higher economical importance
0.2
.4.6
.8
0 10 20 30 40spell month identifier, by contract
No economic transfer Economic transfer
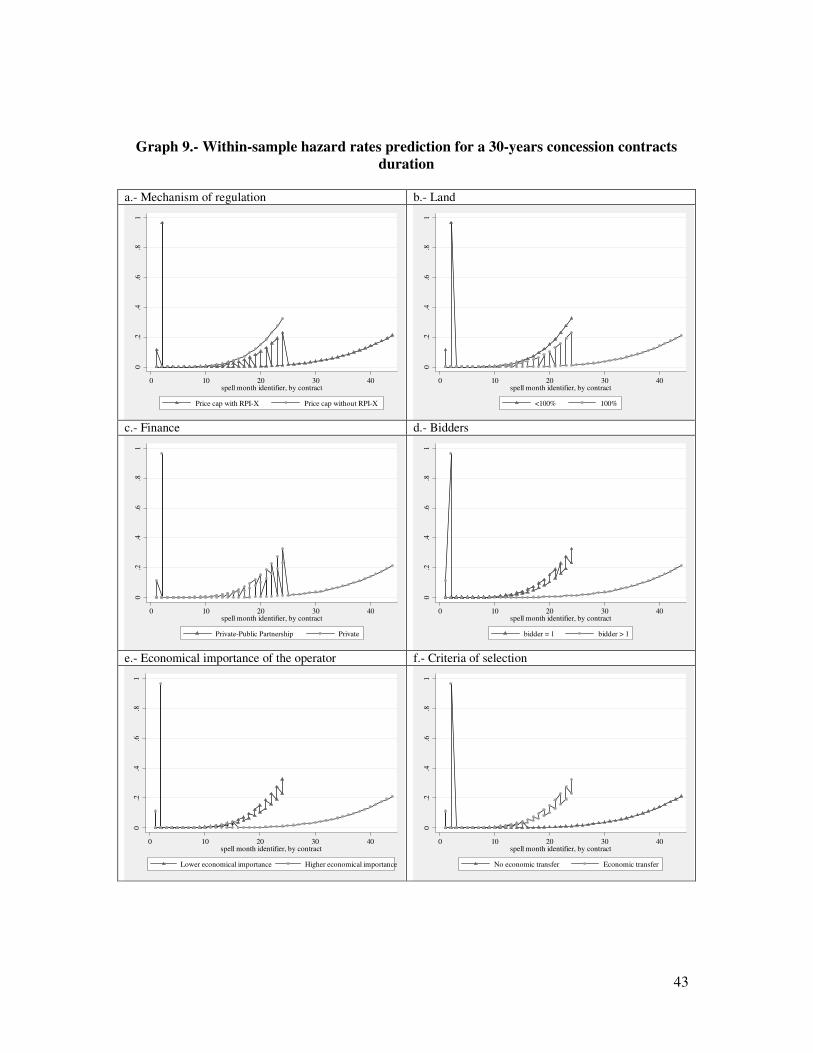
43
Graph 9.- Within-sample hazard rates prediction for a 30-years concession contracts
duration
a.- Mechanism of regulation b.- Land
0.2
.4.6
.81
0 10 20 30 40spell month identifier, by contract
Price cap with RPI-X Price cap without RPI-X
0
.2.4
.6.8
1
0 10 20 30 40spell month identifier, by contract
<100% 100%
c.- Finance d.- Bidders
0.2
.4.6
.81
0 10 20 30 40spell month identifier, by contract
Private-Public Partnership Private
0.2
.4.6
.81
0 10 20 30 40spell month identifier, by contract
bidder = 1 bidder > 1
e.- Economical importance of the operator f.- Criteria of selection
0.2
.4.6
.81
0 10 20 30 40spell month identifier, by contract
Lower economical importance Higher economical importance
0.2
.4.6
.81
0 10 20 30 40spell month identifier, by contract
No economic transfer Economic transfer

44
Graph 10.- Out-of-sample prediction hazard rates
a.- Mechanism of regulation
0.2
.4.6
.81
0 10 20 30 40 50spell month identifier, by contract
typereg: RPI-X typereg: Others
Hazard
0.2
.4.6
.81
0 10 20 30 40 50spell month identifier, by contract
typereg: RPI-X typereg: Others
Survival
b.- Land
0.2
.4.6
.81
0 10 20 30 40 50spell month identifier, by contract
land < 100% land = 100%
Hazard
0.2
.4.6
.81
0 10 20 30 40 50spell month identifier, by contract
land < 100% land = 100%
Survival
c.- Finance
0.2
.4.6
.81
0 10 20 30 40 50spell month identifier, by contract
finance: PPP finance: Private
Hazard
0.2
.4.6
.81
0 10 20 30 40 50spell month identifier, by contract
finance: PPP finance: Private
Survival

45
Graph 10.- (…continue) Out-of-sample prediction hazard rates
d.- Duration 0
.2.4
.6.8
1
0 10 20 30 40 50spell month identifier, by contract
duration: 15 years duration: 30 years
Hazard
0.2
.4.6
.81
0 10 20 30 40 50spell month identifier, by contract
duration: 15 years duration: 30 years
Survival
e.- Bidders
0.2
.4.6
.81
0 10 20 30 40 50spell month identifier, by contract
bidders = 1 bidders = 2
Hazard
0.2
.4.6
.81
0 10 20 30 40 50spell month identifier, by contract
bidders = 1 bidders = 2
Survival
0.2
.4.6
.81
0 10 20 30 40 50spell month identifier, by contract
bidders = 1 bidders = 3
Hazard
0.2
.4.6
.81
0 10 20 30 40 50spell month identifier, by contract
bidders = 1 bidders = 3
Survival

46
Graph 10.- (…continue) Out-of-sample prediction hazard rates
f.- Economical importance of operator 0
.05
.1.1
5.2
0 10 20 30 40 50spell month identifier, by contract
impope = 1 impope = 2
Hazard
.2.4
.6.8
1
0 10 20 30 40 50spell month identifier, by contract
impope = 1 impope = 2
Survival
0.1
.2.3
0 10 20 30 40 50spell month identifier, by contract
impope = 1 impope = 4
Hazard
0.2
.4.6
.81
0 10 20 30 40 50spell month identifier, by contract
impope = 1 impope = 4
Survival
g.- Criteria of selection
0.2
.4.6
.81
0 10 20 30 40 50spell month identifier, by contract
criteria: NO monetary transfer criteria: Monetary transfer
Hazard
0.2
.4.6
.81
0 10 20 30 40 50spell month identifier, by contract
criteria: NO monetary transfer criteria: Monetary transfer
Survival