Embed Size (px)
Citation preview
J A C C : C A R D I O V A S C U L A R I M A G I N G V O L . 3 , N O . 7 , 2 0 1 0
© 2 0 1 0 B Y T H E A M E R I C A N C O L L E G E O F C A R D I O L O G Y F O U N D A T I O N I S S N 1 9 3 6 - 8 7 8 X / $ 3 6 . 0 0
P U B L I S H E D B Y E L S E V I E R I N C . D O I : 1 0 . 1 0 1 6 / j . j c m g . 2 0 1 0 . 0 6 . 0 0 1
Renal Function and Risk Stratification ofDiabetic and Nondiabetic Patients UndergoingEvaluation for CoronaryArtery Disease
Abdul Hakeem, MD,* Sabha Bhatti, MD,* Kunal N. Karmali, MD,†Kathryn S. Dillie, MD, PHD,‡ Jeffrey R. Cook, MD,† Jiaqiong Xu, PHD,§Zainab Samad, MD, MHS,� Su Min Chang, MD¶
Cincinnati, Ohio; Madison and Milwaukee, Wisconsin; Houston, Texas; and Durham,North Carolina
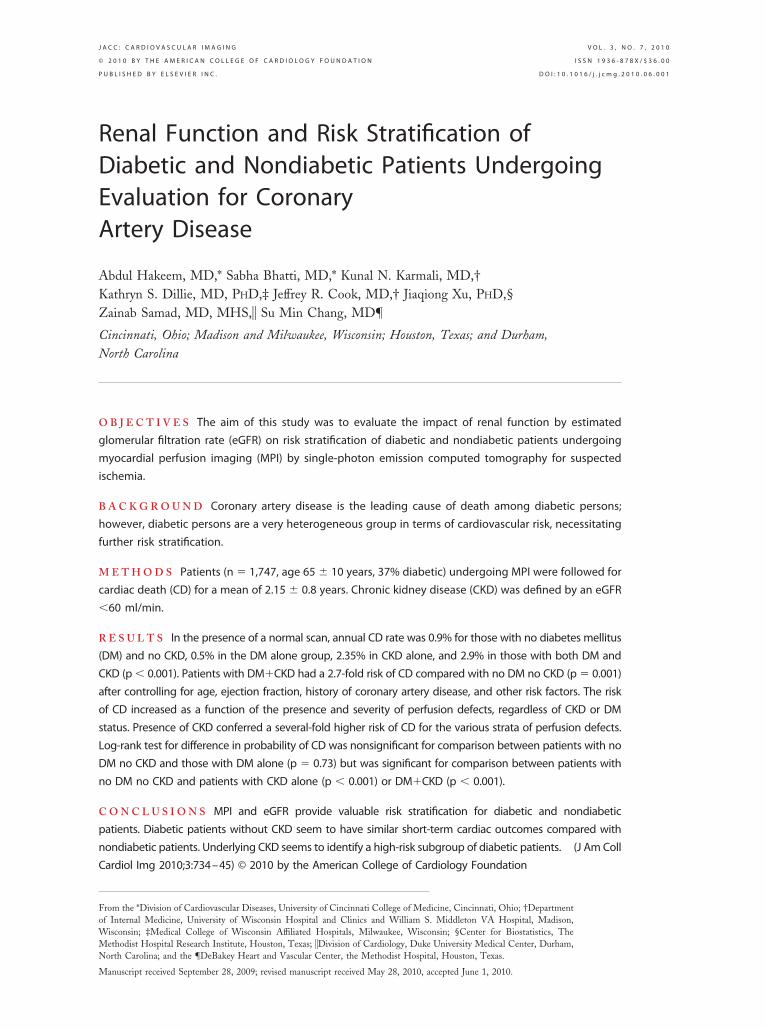
O B J E C T I V E S The aim of this study was to evaluate the impact of renal function by estimated
glomerular filtration rate (eGFR) on risk stratification of diabetic and nondiabetic patients undergoing
myocardial perfusion imaging (MPI) by single-photon emission computed tomography for suspected
ischemia.
B A C K G R O U N D Coronary artery disease is the leading cause of death among diabetic persons;
however, diabetic persons are a very heterogeneous group in terms of cardiovascular risk, necessitating
further risk stratification.
M E T H O D S Patients (n � 1,747, age 65 � 10 years, 37% diabetic) undergoing MPI were followed for
cardiac death (CD) for a mean of 2.15 � 0.8 years. Chronic kidney disease (CKD) was defined by an eGFR
�60 ml/min.
R E S U L T S In the presence of a normal scan, annual CD rate was 0.9% for those with no diabetes mellitus
(DM) and no CKD, 0.5% in the DM alone group, 2.35% in CKD alone, and 2.9% in those with both DM and
CKD (p � 0.001). Patients with DM�CKD had a 2.7-fold risk of CD compared with no DM no CKD (p � 0.001)
after controlling for age, ejection fraction, history of coronary artery disease, and other risk factors. The risk
of CD increased as a function of the presence and severity of perfusion defects, regardless of CKD or DM
status. Presence of CKD conferred a several-fold higher risk of CD for the various strata of perfusion defects.
Log-rank test for difference in probability of CD was nonsignificant for comparison between patients with no
DM no CKD and those with DM alone (p � 0.73) but was significant for comparison between patients with
no DM no CKD and patients with CKD alone (p � 0.001) or DM�CKD (p � 0.001).
C O N C L U S I O N S MPI and eGFR provide valuable risk stratification for diabetic and nondiabetic
patients. Diabetic patients without CKD seem to have similar short-term cardiac outcomes compared with
nondiabetic patients. Underlying CKD seems to identify a high-risk subgroup of diabetic patients. (J Am Coll
Cardiol Img 2010;3:734–45) © 2010 by the American College of Cardiology Foundation
From the *Division of Cardiovascular Diseases, University of Cincinnati College of Medicine, Cincinnati, Ohio; †Departmentof Internal Medicine, University of Wisconsin Hospital and Clinics and William S. Middleton VA Hospital, Madison,Wisconsin; ‡Medical College of Wisconsin Affiliated Hospitals, Milwaukee, Wisconsin; §Center for Biostatistics, TheMethodist Hospital Research Institute, Houston, Texas; �Division of Cardiology, Duke University Medical Center, Durham,North Carolina; and the ¶DeBakey Heart and Vascular Center, the Methodist Hospital, Houston, Texas.
Manuscript received September 28, 2009; revised manuscript received May 28, 2010, accepted June 1, 2010.
Ttdv6
bdlthpscrs
cbpdvHir
cisdadrtts(mtrciigdMd
M
PcsJtWiSIdelusPwrgrtHratmCbrp
tgs(TbstpuipesdladfI
summed stress score
J A C C : C A R D I O V A S C U L A R I M A G I N G , V O L . 3 , N O . 7 , 2 0 1 0
J U L Y 2 0 1 0 : 7 3 4 – 4 5
Hakeem et al.
Renal Function, SPECT, and Outcomes in Diabetic Patients
735
he prevalence of diabetes mellitus (DM) con-tinues to grow at an alarming rate. Recentfigures estimate that 17.5 million people in theU.S. have diabetes, and with an aging popula-
ion and an obesity epidemic, these figures are pre-icted to rise (1). The complications from diabetes arearied and involve multiple organ systems. However,5% to 70% of diabetic mortality is principally caused
See page 746
y cardiovascular disease (2). Given this high bur-en of cardiovascular mortality, the National Cho-
esterol Education Program elevated type 2 diabeteso the highest risk category by making it a coronaryeart disease risk-equivalent (3). However, diabeticersons are a heterogeneous group, and there areubgroups of diabetic persons at lower risk forardiovascular complications and subgroups at highisk, in need of intensive risk factor modification,creening, treatment, and close clinical follow-up.
The impact of chronic kidney disease (CKD) onardiovascular and all-cause mortality (ACM) haseen well-established (4–9). In the most recentractice guidelines from the National Kidney Foun-ation and the Joint National Committee on Pre-ention, Detection, Evaluation, and Treatment ofigh Blood Pressure; it was recommended that
ndividuals with CKD be considered in the highestisk group for cardiovascular disease (10,11).
With the strong links among CKD, diabetes, andardiovascular mortality and the prevalence reach-ng epidemic proportions, the need for effective risktratification of diabetic persons assumes unprece-ented significance. Multiple studies have tried toddress the issue of cardiac risk stratification ofiabetic patients by noninvasive testing. In theecently published outcomes of the DIAD (Detec-ion of Ischemia in Asymptomatic Diabetics) study,he event rate overall at 5 years was very low, andcreening with myocardial perfusion imagingMPI) by single-photon emission computed to-ography did not seem to affect the risk profile. On
he basis of these results, the authors concluded thatoutine screening in asymptomatic diabetic patientsannot be justified (12). To further investigate thessue of effective risk stratification, we examined thempact of renal function as measured by estimatedlomerular filtration rate (eGFR) on risk stratifyingiabetic and nondiabetic patients undergoing stressPI for evaluation of suspected coronary artery
isease (CAD). i
E T H O D S
opulation. This was an observational retrospectiveohort of 1,747 consecutive patients with known oruspected CAD undergoing stress MPI betweenune 2002 and July 2005 at the William S. Middle-on Memorial Veterans Hospital (VA), Madison,
isconsin. The study was approved by the VAnstitutional review board.ources of data. With the VISTA (Veterans Affairsnformation System Technology and Architecture)atabase, we reviewed inpatient and outpatientlectronic records for patients. The VA, America’sargest integrated health care system, has aniform, fully electronic national recordystem called the CPRS (Computerizedatient Record System). It provides net-orked, robust, and timely retrieval of
emote-site patient data. All clinic, emer-ency department visits, and hospital stayecords including outpatient phone con-acts are electronically stored in CPRS.
ospital stays outside the VA are eitherecorded in VA physician notes or scannednd stored electronically in the VA sys-em. Manual extraction of patient infor-ation and records from the VISTA/PRS interface program was performedy 3 investigators who were blinded to theenal and single-photon emission com-uted tomography (SPECT) data.The initial patient visit (closest to the
ime of MPI) was used to determine demo-raphic data, height, weight, cardiovascularymptoms, baseline electrocardiogramECG), and baseline cardiac risk factors.he presence of risk factors was determinedy diagnosis documented by a physician,upportive laboratory data, or medicationshat would support these diagnoses. Theresence of diabetes required physician doc-mentation or the presence of diabetic medicationsncluding insulin and oral hypoglycemic agents. Theresence of CAD required either a previous coronaryvent or a documented CAD diagnosis via cardiactress testing or coronary angiography. Additionalata including medications at the time of MPI and
aboratory findings, specifically hemoglobin and cre-tinine levels, were obtained from CPRS. Laboratoryata was obtained within a mean of 49 � 20 daysrom the time of MPI evaluation.maging and stress protocol. Rest-stress MPI imag-
A B B
A N D
ACM �
CAD �
CD �
CI � c
CKD �
DM �
ECG �
EF � e
eGFR
filtrati
HR �
LVEF
fractio
MI �
MPI �
imagi
NFMI
infarc
SDS �
SPECT
comp
SRS �
SSS �
ng with technetium-99 Sestamibi or tetrof
R E V I A T I O N S
A C R O N YM S
all-cause mortality
coronary artery disease
cardiac death
onfidence interval
chronic kidney disease
diabetes mellitus
electrocardiogram
jection fraction
� estimated glomerular
on rate
hazard ratio
� left ventricular ejection
n
myocardial infarction
myocardial perfusion
ng
� nonfatal myocardial
tion
summed difference score
� single-photon emission
uted tomography
summed rest score
osmin
wcse(d(eatccp
u8pagoPcodctSttaacmdSwetiplSfmISfmmAasE
sr(sddPtemainesM(dspQbbnCumG(AN�petf�omPlTmtfcctsAma
J A C C : C A R D I O V A S C U L A R I M A G I N G , V O L . 3 , N O . 7 , 2 0 1 0
J U L Y 2 0 1 0 : 7 3 4 – 4 5
Hakeem et al.
Renal Function, SPECT, and Outcomes in Diabetic Patients
736
as performed. A symptom-limited treadmill exer-ise test was initiated in 32% of patients withtandard protocols with a 12-lead ECG recordingach minute of exercise. At near-maximal exercise�85% age predicted heart rate), a 20- to 30-mCiose of technetium-99 or tetrofosmin was injectedactual patient dose varied with patient weight), andxercise continued for 1 min after injection. Imagecquisition was initiated 15 min after isotope injec-ion. Whenever possible, beta-blockers, calciumhannel blockers, and caffeine products were dis-ontinued 24 h before testing, and nitrate com-ounds were discontinued 6 h before testing.If the patient was predetermined to be unable to
ndergo a treadmill protocol or unable to achieve5% of maximal predicted heart rate, the test waserformed pharmacologically with use of a 4-mindenosine infusion protocol (68% of the studyroup). Institutional protocol allowed for use ofnly adenosine for pharmacological MPI studies.atients who were unable to exercise and hadontraindications to adenosine (e.g., severe chronicbstructive pulmonary disease) generally underwentobutamine stress echocardiography or cardiacatheterization. Technetium-99m was injected athe end of the third minute of infusion, andPECT was initiated approximately 60 min afterhe end of the adenosine infusion (12). During bothypes of stress tests, blood pressure was measurednd recorded at rest, at the end of each stress stage,nd at peak stress. Maximal degree of ST-segmenthange at 80 ms after the J point of the ECG waseasured and assessed as horizontal, up-sloping, or
own-sloping.PECT acquisition protocol. The SPECT studiesere performed with dual head cardio epic cam-
ra with a circular 180° acquisition for 64 projec-ions at 20 to 25 s/projection (13). Duringmaging, a 10% window centered on the 140-keVeak was used for technetium-99m tracers. The
ow-pass Butterworth filter was used for allPECT studies. Gated scan could not be per-ormed in 5% of the patients because of arrhyth-ias, primarily atrial fibrillation.
maging interpretation and scintigraphic indexes.emiquantitative visual interpretation was per-ormed with short-axis and vertical long-axis, andyocardial tomograms were divided into 20 seg-ents for each study, as previously described (14).
summed stress score (SSS) was obtained bydding the scores of the 20 segments of the stressestamibi images with the QP/QS software (15,16).
ach segment was scored with a 5-point scoring zystem (0: normal, 1: mildly reduced, 2: moderatelyeduced, 3: severely reduced, 4: absent uptake)14,16). The sum of segment scores at stress (SSS),cores at rest (summed rest score [SRS]), andifferences between stress and rest score (summedifference score [SDS]) were calculated (14–18).atients were divided into groups on the basis of
heir SSS. Summed stress scores �4 were consid-red normal, 4 to 8 were considered mildly abnor-al, and �8 were considered moderately to severely
bnormal (15,16,18). Patients were also dividednto groups on the basis of their SDS and SRS intoormal (�2), mildly abnormal (2 to 6), and mod-rate to severely abnormal (�6) (17). High-riskcan was defined as moderate to severely abnormal
PI and/or left ventricular ejection fractionLVEF) �40%. Presence of ischemia and scar wasetermined by the severity of SDS and SRS, re-pectively. Post-stress LVEF obtained in 95% ofatients by gated SPECT was also assessed withP/QS software. The studies were interpreted by 3
oard certified nuclear cardiologists who werelinded to the demographic and laboratory data butot to sex.lassification of renal dysfunction. Estimated glomer-lar filtration rate was calculated with the 4-variableodified diet in renal disease “MDRD” equation:FR (ml/min/1.73 m2) � 175 � (Scr)
�1.154 �Age)�0.203 � 0.742 (if female) � 1.210 (if Africanmerican) (19,20). The CKD was defined with theational Kidney foundation definition of an eGFR60 ml/min/1.73 m2 (21) and was present in 632
atients (36%). Serum creatinine used to calculateGFR was obtained within 49 � 20 days from theime of MPI. Thirty-two patients in acute renalailure (defined by an increase in serum creatinine of
0.5 mg/dl in �2 weeks or an increase of �20%ver baseline if baseline serum creatinine was �2.5g/dl) were excluded.atient follow-up and end points. Patients were fol-owed for a mean duration of 2.15 � 0.8 years.he minimum duration of follow-up was 6onths (for those who had no events, shorter for
hose who died) with only 44 patients that hadollow-up of �1 year. The primary end point wasardiac death (CD) defined as death from anyardiac cause including fatal myocardial infarc-ion, sudden arrhythmic death, and decompen-ated heart failure; secondary end points wereCM and a composite of CD and nonfatalyocardial infarction (NFMI) (defined by the
ppropriate combination of elevated cardiac en-
ymes, electrocardiographic changes, and isch-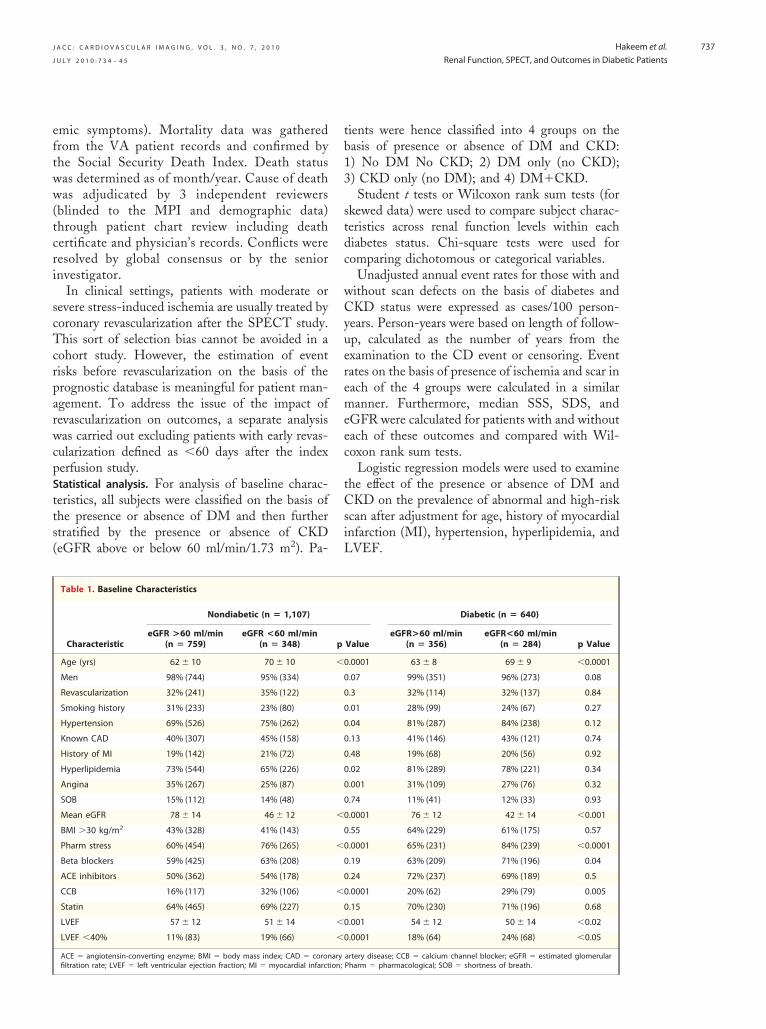
eftww(tcri
scTcrparwcpStts(
tb13
stdc
wCyueremeec
tCsiL
J A C C : C A R D I O V A S C U L A R I M A G I N G , V O L . 3 , N O . 7 , 2 0 1 0
J U L Y 2 0 1 0 : 7 3 4 – 4 5
Hakeem et al.
Renal Function, SPECT, and Outcomes in Diabetic Patients
737
mic symptoms). Mortality data was gatheredrom the VA patient records and confirmed byhe Social Security Death Index. Death statusas determined as of month/year. Cause of deathas adjudicated by 3 independent reviewers
blinded to the MPI and demographic data)hrough patient chart review including deathertificate and physician’s records. Conflicts wereesolved by global consensus or by the seniornvestigator.
In clinical settings, patients with moderate orevere stress-induced ischemia are usually treated byoronary revascularization after the SPECT study.his sort of selection bias cannot be avoided in a
ohort study. However, the estimation of eventisks before revascularization on the basis of therognostic database is meaningful for patient man-gement. To address the issue of the impact ofevascularization on outcomes, a separate analysisas carried out excluding patients with early revas-
ularization defined as �60 days after the indexerfusion study.tatistical analysis. For analysis of baseline charac-eristics, all subjects were classified on the basis ofhe presence or absence of DM and then furthertratified by the presence or absence of CKDeGFR above or below 60 ml/min/1.73 m2). Pa-
Table 1. Baseline Characteristics
Characteristic
Nondiabetic (n � 1,107)
eGFR >60 ml/min(n � 759)
eGFR <60 ml/min(n � 348)
Age (yrs) 62 � 10 70 � 10
Men 98% (744) 95% (334)
Revascularization 32% (241) 35% (122)
Smoking history 31% (233) 23% (80)
Hypertension 69% (526) 75% (262)
Known CAD 40% (307) 45% (158)
History of MI 19% (142) 21% (72)
Hyperlipidemia 73% (544) 65% (226)
Angina 35% (267) 25% (87)
SOB 15% (112) 14% (48)
Mean eGFR 78 � 14 46 � 12
BMI �30 kg/m2 43% (328) 41% (143)
Pharm stress 60% (454) 76% (265)
Beta blockers 59% (425) 63% (208)
ACE inhibitors 50% (362) 54% (178)
CCB 16% (117) 32% (106)
Statin 64% (465) 69% (227)
LVEF 57 � 12 51 � 14
LVEF �40% 11% (83) 19% (66)
ACE � angiotensin-converting enzyme; BMI � body mass index; CAD � coron
filtration rate; LVEF � left ventricular ejection fraction; MI � myocardial infarction;ients were hence classified into 4 groups on theasis of presence or absence of DM and CKD:) No DM No CKD; 2) DM only (no CKD);) CKD only (no DM); and 4) DM�CKD.Student t tests or Wilcoxon rank sum tests (for
kewed data) were used to compare subject charac-eristics across renal function levels within eachiabetes status. Chi-square tests were used foromparing dichotomous or categorical variables.
Unadjusted annual event rates for those with andithout scan defects on the basis of diabetes andKD status were expressed as cases/100 person-
ears. Person-years were based on length of follow-p, calculated as the number of years from thexamination to the CD event or censoring. Eventates on the basis of presence of ischemia and scar inach of the 4 groups were calculated in a similaranner. Furthermore, median SSS, SDS, and
GFR were calculated for patients with and withoutach of these outcomes and compared with Wil-oxon rank sum tests.
Logistic regression models were used to examinehe effect of the presence or absence of DM andKD on the prevalence of abnormal and high-risk
can after adjustment for age, history of myocardialnfarction (MI), hypertension, hyperlipidemia, andVEF.
Diabetic (n � 640)
ValueeGFR>60 ml/min
(n � 356)eGFR<60 ml/min
(n � 284) p Value
.0001 63 � 8 69 � 9 �0.0001
.07 99% (351) 96% (273) 0.08
.3 32% (114) 32% (137) 0.84
.01 28% (99) 24% (67) 0.27
.04 81% (287) 84% (238) 0.12
.13 41% (146) 43% (121) 0.74
.48 19% (68) 20% (56) 0.92
.02 81% (289) 78% (221) 0.34
.001 31% (109) 27% (76) 0.32
.74 11% (41) 12% (33) 0.93
.0001 76 � 12 42 � 14 �0.001
.55 64% (229) 61% (175) 0.57
.0001 65% (231) 84% (239) �0.0001
.19 63% (209) 71% (196) 0.04
.24 72% (237) 69% (189) 0.5
.0001 20% (62) 29% (79) 0.005
.15 70% (230) 71% (196) 0.68
.001 54 � 12 50 � 14 �0.02
.0001 18% (64) 24% (68) �0.05
artery disease; CCB � calcium channel blocker; eGFR � estimated glomerular
p
�0
0
0
0
0
0
0
0
0
0
�0
0
�0
0
0
�0
0
�0
�0
ary
Pharm � pharmacological; SOB � shortness of breath.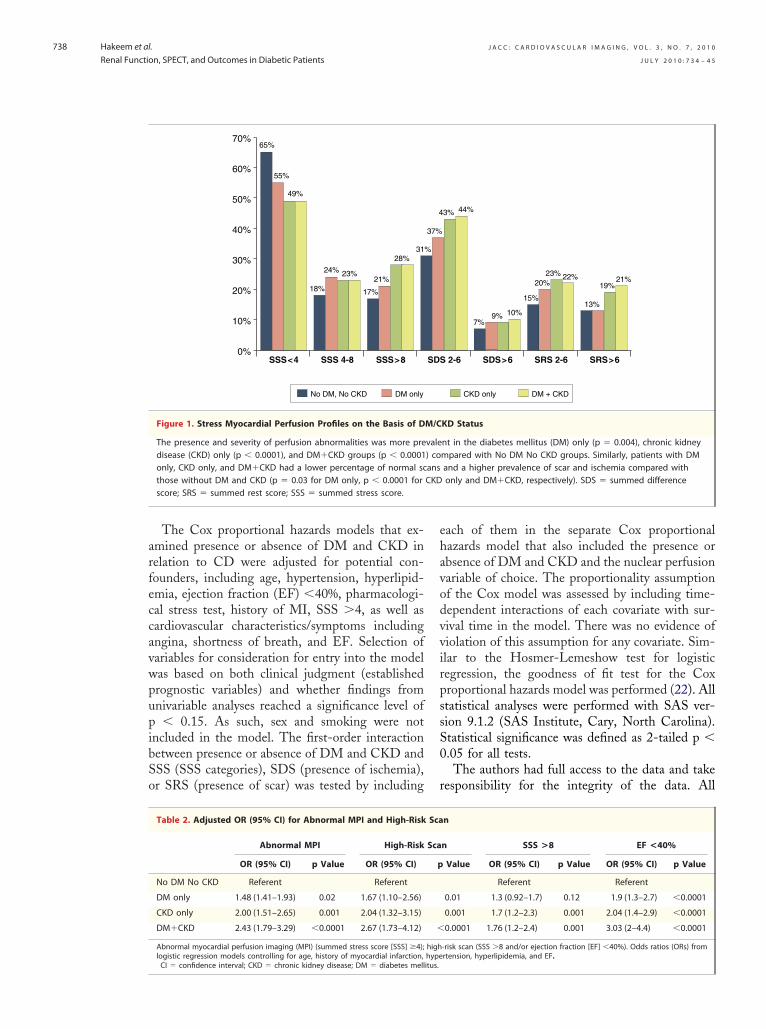
arfeccavwpupibSo
ehavodvvirpssS0
r
J A C C : C A R D I O V A S C U L A R I M A G I N G , V O L . 3 , N O . 7 , 2 0 1 0
J U L Y 2 0 1 0 : 7 3 4 – 4 5
Hakeem et al.
Renal Function, SPECT, and Outcomes in Diabetic Patients
738
The Cox proportional hazards models that ex-mined presence or absence of DM and CKD inelation to CD were adjusted for potential con-ounders, including age, hypertension, hyperlipid-mia, ejection fraction (EF) �40%, pharmacologi-al stress test, history of MI, SSS �4, as well asardiovascular characteristics/symptoms includingngina, shortness of breath, and EF. Selection ofariables for consideration for entry into the modelas based on both clinical judgment (establishedrognostic variables) and whether findings fromnivariable analyses reached a significance level of� 0.15. As such, sex and smoking were not
ncluded in the model. The first-order interactionetween presence or absence of DM and CKD andSS (SSS categories), SDS (presence of ischemia),r SRS (presence of scar) was tested by including
0%SSS<4 SSS 4-8 SSS>8
10%
20%
30%
50%
40%
60%
70%65%
55%
49%
23%24%
18% 17%
21%
28%31
No DM, No CKD DM only
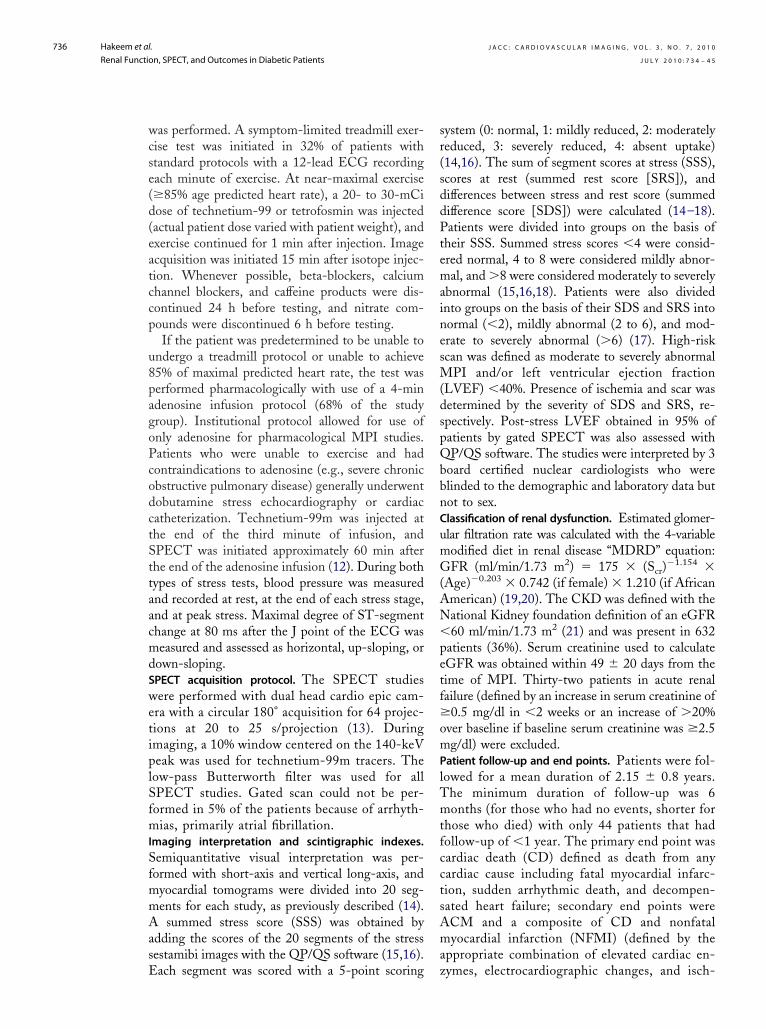
Figure 1. Stress Myocardial Perfusion Profiles on the Basis of D
The presence and severity of perfusion abnormalities was more predisease (CKD) only (p � 0.0001), and DM�CKD groups (p � 0.0001only, CKD only, and DM�CKD had a lower percentage of normal scthose without DM and CKD (p � 0.03 for DM only, p � 0.0001 forscore; SRS � summed rest score; SSS � summed stress score.
Table 2. Adjusted OR (95% CI) for Abnormal MPI and High-Risk
Abnormal MPI High-Risk
OR (95% CI) p Value OR (95% CI)
No DM No CKD Referent Referent
DM only 1.48 (1.41–1.93) 0.02 1.67 (1.10–2.56)
CKD only 2.00 (1.51–2.65) 0.001 2.04 (1.32–3.15)
DM�CKD 2.43 (1.79–3.29) �0.0001 2.67 (1.73–4.12)
Abnormal myocardial perfusion imaging (MPI) (summed stress score [SSS] �4);logistic regression models controlling for age, history of myocardial infarction,
CI � confidence interval; CKD � chronic kidney disease; DM � diabetes mellitus.ach of them in the separate Cox proportionalazards model that also included the presence orbsence of DM and CKD and the nuclear perfusionariable of choice. The proportionality assumptionf the Cox model was assessed by including time-ependent interactions of each covariate with sur-ival time in the model. There was no evidence ofiolation of this assumption for any covariate. Sim-lar to the Hosmer-Lemeshow test for logisticegression, the goodness of fit test for the Coxroportional hazards model was performed (22). Alltatistical analyses were performed with SAS ver-ion 9.1.2 (SAS Institute, Cary, North Carolina).tatistical significance was defined as 2-tailed p �.05 for all tests.The authors had full access to the data and take
esponsibility for the integrity of the data. All
2-6 SDS>6 SRS 2-6 SRS>6
7%9% 10%
15%
20%23% 22%
13%
19%21%
3% 44%
CKD only DM + CKD
KD Status
nt in the diabetes mellitus (DM) only (p � 0.004), chronic kidneympared with No DM No CKD groups. Similarly, patients with DMand a higher prevalence of scar and ischemia compared withonly and DM�CKD, respectively). SDS � summed difference
n
n SSS >8 EF <40%
Value OR (95% CI) p Value OR (95% CI) p Value
Referent Referent
0.01 1.3 (0.92–1.7) 0.12 1.9 (1.3–2.7) �0.0001
0.001 1.7 (1.2–2.3) 0.001 2.04 (1.4–2.9) �0.0001
0.0001 1.76 (1.2–2.4) 0.001 3.03 (2–4.4) �0.0001
-risk scan (SSS �8 and/or ejection fraction [EF] �40%). Odds ratios (ORs) fromrtension, hyperlipidemia, and EF.
SDS
%
37%
4
M/C
vale) coansCKD
Sca
Sca
p
�
highhype
aw
R
BtbPbpclvpClamamwratMfsoap(clDapfD
liohhnEaeCt3t
aTowaco
(
Figure 1.
J A C C : C A R D I O V A S C U L A R I M A G I N G , V O L . 3 , N O . 7 , 2 0 1 0
J U L Y 2 0 1 0 : 7 3 4 – 4 5
Hakeem et al.
Renal Function, SPECT, and Outcomes in Diabetic Patients
739
uthors have read and agree to the manuscript asritten.
E S U L T S
aseline characteristics. Baseline characteristics ofhe 1,747 patients included in the analyses stratifiedy DM/CKD status are summarized in Table 1.atients with CKD in both diabetic and nondia-etic groups were older, more likely to undergoharmacological stress, and tended to take calciumhannel blockers more frequently. They also had aower mean EF and a higher prevalence of leftentricular systolic dysfunction (EF �40%) com-ared with those without CKD. Patients withKD were more likely to be hypertensive and had
ower prevalence of smoking, hyperlipidemia, andngina. Overall, diabetic patients were significantlyore overweight and obese compared with nondi-
betic persons. Diabetic patients with CKD wereore likely to use beta blockers. By contrast, thereas no difference in terms of history of CAD, MI,
evascularization, or use of other drugs includingngiotensin-converting enzyme inhibitors, angio-ensin receptor blockers, statins, and nitrates.yocardial perfusion defects and left ventricular dys-
unction on the basis of DM and CKD status. Figure 1hows the distribution of perfusion abnormalitiesn the basis of DM and CKD status. The presencend severity of perfusion abnormalities was morerevalent in the DM only (p � 0.004), CKD onlyp � 0.0001), and DM�CKD groups (p � 0.0001)ompared with the no DM no CKD group. Simi-arly, patients with DM only, CKD only, and
M�CKD had a lower percentage of normal scansnd a higher prevalence of scar and ischemia com-ared with those without DM and CKD (p � 0.03or DM only, p � 0.0001 for CKD only andM�CKD, respectively).On the basis of logistic regression model control-
ing for age, history of MI, hypertension, hyperlip-demia, and EF, patients with DM only, CKDnly, or DM�CKD had statistically significantigher odds of having an abnormal scan or aigh-risk scan compared with those with no DMo CKD (Table 2).vent rate on the basis of DM and CKD status. Duringmean follow-up period of 2.15 � 0.8 years, total
vents included 225 deaths from all causes, 119Ds, and 185 composite (CD/NFMI) events. Pa-
ients with CKD only and DM�CKD had a 2- and-fold higher CD and all-mortality rate, respec-
ively, compared with those in no DM No CKDnd DM only groups (all log-rank p � 0.0001).here was no statistical difference in the event ratef CD, ACM, and CD/NFMI between patientsith DM only and no DM no CKD groups. Even
fter excluding patients who underwent early revas-ularization (�60 days), a similar trend persisted forutcomes.Patients who experienced any of the outcomes
CD, ACM, and CD/NFMI) during the course of
Time
Su
rviv
al P
rob
abili
ty (
%)
50
55
60
65
70
75
80
85
90
95
100
0 250 500 750 1000
Number at RiskGroup: CKD alone 348 321 265 156 69
Group: DM alone 356 336 288 182 94
Group: DM + CKD 284 259 223 123 69
Group: No DM, No CKD 759 721 610 363 158
No DM, No CKD
CKD aloneDM, CKD Status:
DM + CKD
DM alone
Figure 2. Kaplan Meier Survival Analysis for Freedom From Car
Log-rank p value �0.0001 for comparisons between No DM No CKDsus CKD alone and DM�CKD. The log-rank p test for No DM No CKgroups was not significant (log-rank p � 0.73). Abbreviations as in
Time
Su
rviv
al P
rob
abili
ty (
%)
50
55
60
65
70
75
80
85
90
95
100
0 250 500 750 1000
Number at RiskGroup: CKD alone 348 321 265 156 69
Group: DM alone 356 336 288 182 94
Group: DM + CKD 284 259 223 123 69
Group: No DM, No CKD 759 721 610 363 158
No DM, No CKD
CKD aloneDM, CKD Status:
DM + CKD
DM alone
Figure 3. Kaplan Meier Survival Analysis for Freedom From All-
Log-rank p value �0.0001 for comparisons between No DM No CKDsus CKD alone and DM�CKD. The log-rank p test for No DM No CK
1250 1500
11 0
20 1
16 0
48 1
diac Death
and DM alone ver-D and DM only
1250 1500
11 0
20 1
16 0
48 1
Cause Mortality
and DM alone ver-D and DM only
groups was not significant (log-rank p � 0.86). Abbreviations as in Figure 1.
tfgbwt0C
tKfpDwln(DtCeSCPipD(8�deCDCsDyf(Te
thisTwTe0b(PsmTsr
myocardial infarction;
abnormality; other abb
J A C C : C A R D I O V A S C U L A R I M A G I N G , V O L . 3 , N O . 7 , 2 0 1 0
J U L Y 2 0 1 0 : 7 3 4 – 4 5
Hakeem et al.
Renal Function, SPECT, and Outcomes in Diabetic Patients
740
he study had statistically significant lower renalunction (demonstrated by median eGFR) orreater number of perfusion defects (demonstratedy SSS and SDS values). The median SSS and SDSere higher in patients with CD compared with
hose without this end point (SSS 9.0 vs. 2.0, p �.0001; SDS 3.0 vs. 1.0, p � 0.0001). Patients withD also had a lower median eGFR compared with
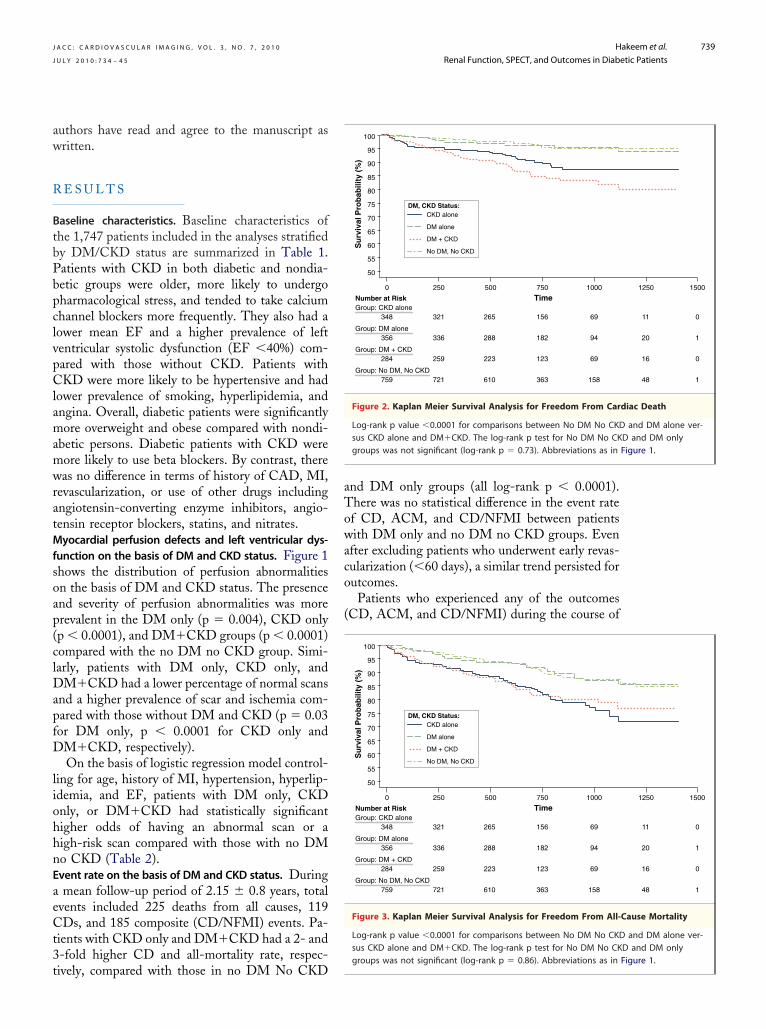
Time (Days)0 500 750 1000 1250 1500
7 259 150 65 10 0
3 276 170 88 19 1
7 217 119 65 16 0
5 601 357 151 45 1
M, No CKD
alonetatus:
CKD
lone
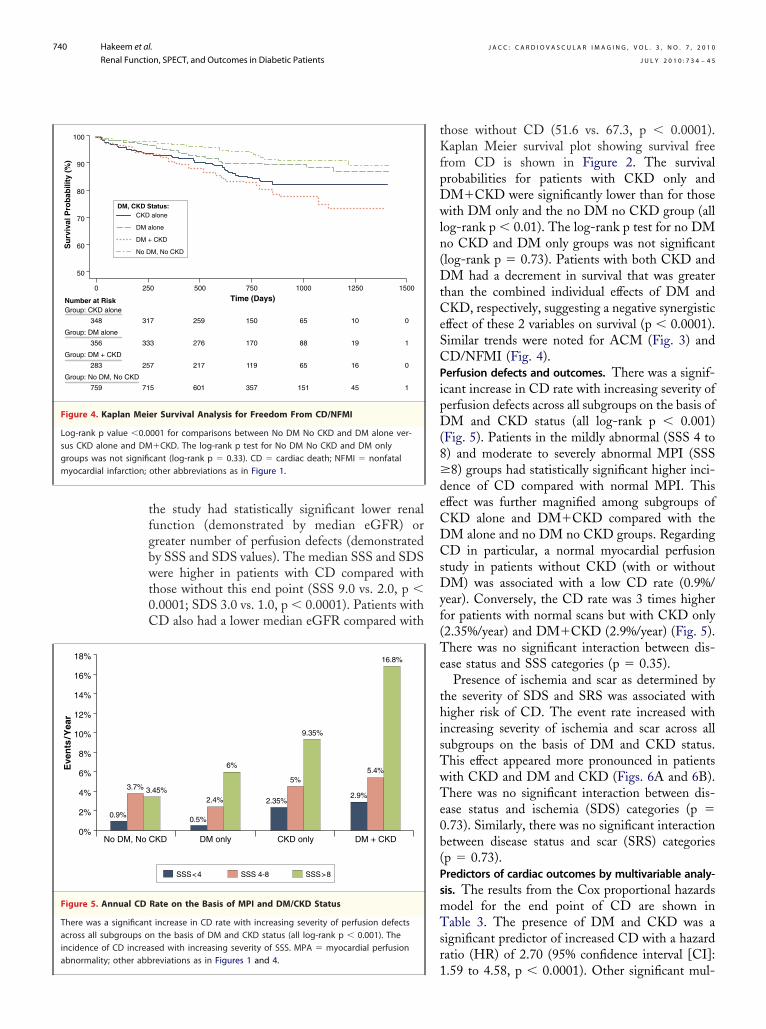
r Survival Analysis for Freedom From CD/NFMI
001 for comparisons between No DM No CKD and DM alone ver-�CKD. The log-rank p test for No DM No CKD and DM onlycant (log-rank p � 0.33). CD � cardiac death; NFMI � nonfatalother abbreviations as in Figure 1.
SSS<4 SSS 4-8 SSS>8
KD
.45%
DM only
0.5%
2.4%
6%
CKD only
2.35%
5%
9.35%
DM + CKD
2.9%
5.4%
16.8%
Rate on the Basis of MPI and DM/CKD Status
increase in CD rate with increasing severity of perfusion defectsn the basis of DM and CKD status (all log-rank p � 0.001). Thesed with increasing severity of SSS. MPA � myocardial perfusion
1reviations as in Figures 1 and 4.
hose without CD (51.6 vs. 67.3, p � 0.0001).aplan Meier survival plot showing survival free
rom CD is shown in Figure 2. The survivalrobabilities for patients with CKD only andM�CKD were significantly lower than for thoseith DM only and the no DM no CKD group (all
og-rank p � 0.01). The log-rank p test for no DMo CKD and DM only groups was not significantlog-rank p � 0.73). Patients with both CKD andM had a decrement in survival that was greater
han the combined individual effects of DM andKD, respectively, suggesting a negative synergistic
ffect of these 2 variables on survival (p � 0.0001).imilar trends were noted for ACM (Fig. 3) andD/NFMI (Fig. 4).erfusion defects and outcomes. There was a signif-cant increase in CD rate with increasing severity oferfusion defects across all subgroups on the basis ofM and CKD status (all log-rank p � 0.001)
Fig. 5). Patients in the mildly abnormal (SSS 4 to) and moderate to severely abnormal MPI (SSS8) groups had statistically significant higher inci-
ence of CD compared with normal MPI. Thisffect was further magnified among subgroups ofKD alone and DM�CKD compared with theM alone and no DM no CKD groups. RegardingD in particular, a normal myocardial perfusion
tudy in patients without CKD (with or withoutM) was associated with a low CD rate (0.9%/
ear). Conversely, the CD rate was 3 times higheror patients with normal scans but with CKD only2.35%/year) and DM�CKD (2.9%/year) (Fig. 5).here was no significant interaction between dis-
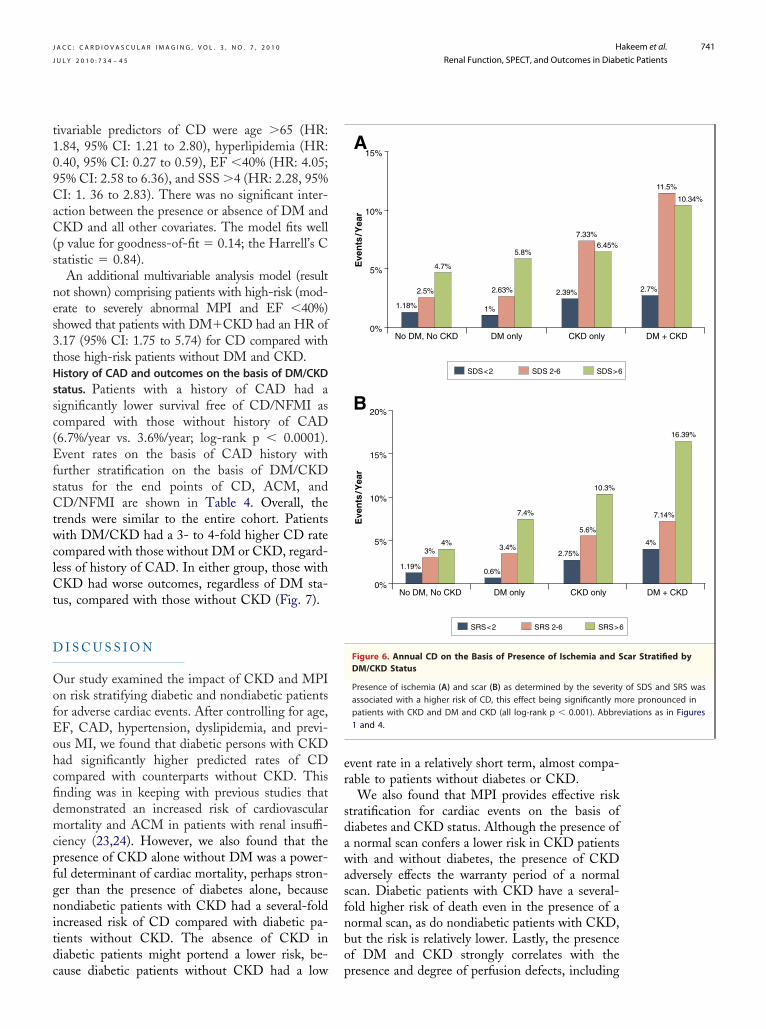
ase status and SSS categories (p � 0.35).Presence of ischemia and scar as determined by
he severity of SDS and SRS was associated withigher risk of CD. The event rate increased with
ncreasing severity of ischemia and scar across allubgroups on the basis of DM and CKD status.his effect appeared more pronounced in patientsith CKD and DM and CKD (Figs. 6A and 6B).here was no significant interaction between dis-
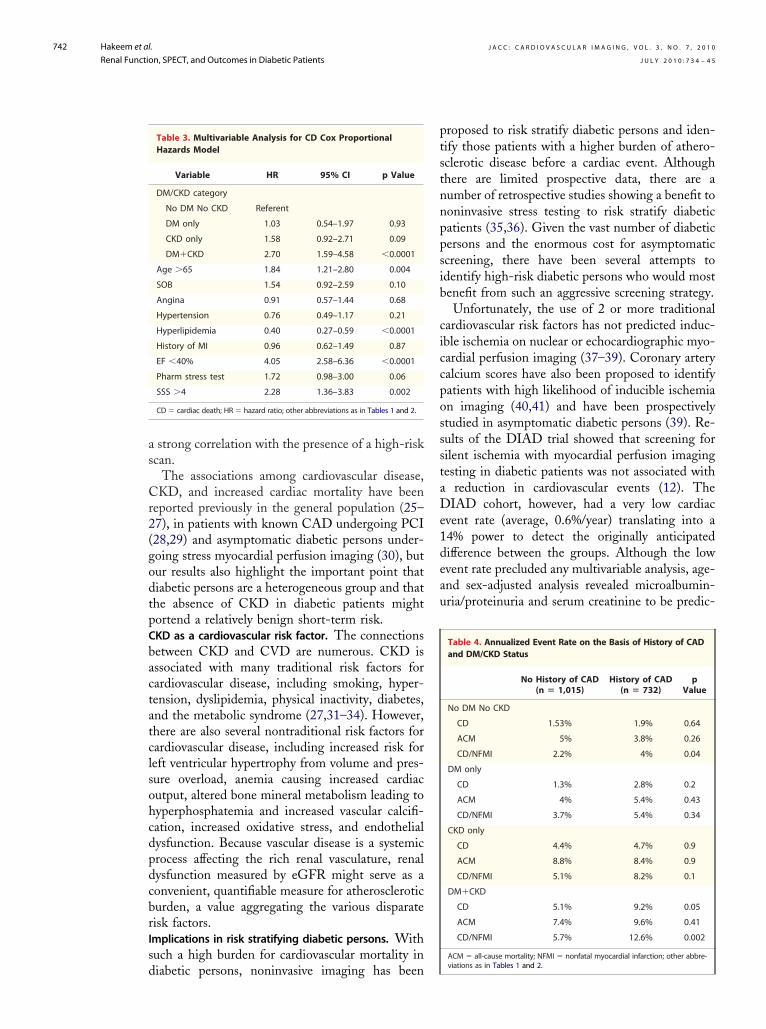
ase status and ischemia (SDS) categories (p �.73). Similarly, there was no significant interactionetween disease status and scar (SRS) categoriesp � 0.73).redictors of cardiac outcomes by multivariable analy-is. The results from the Cox proportional hazardsodel for the end point of CD are shown inable 3. The presence of DM and CKD was a
ignificant predictor of increased CD with a hazardatio (HR) of 2.70 (95% confidence interval [CI]:
Su
rviv
al P
rob
abili
ty (
%)
50
60
70
80
90
100
0 25
Number at RiskGroup: CKD alone
348 31
Group: DM alone
356 33
Group: DM + CKD
283 25
Group: No DM, No CKD
759 71
No D
CKDDM, CKD S
DM +
DM a
Figure 4. Kaplan Meie
Log-rank p value �0.0sus CKD alone and DMgroups was not signifi
0%No DM, No C
Eve
nts
/Yea
r
2%
4%
6%
16%
10%
12%
18%
8%
14%
0.9%
3.7% 3
Figure 5. Annual CD
There was a significantacross all subgroups oincidence of CD increa
.59 to 4.58, p � 0.0001). Other significant mul-
t109CaC(s
nes3tHssc(EfsCtwclCt
D
OofEohcfidmcpfgnitdc
er
sdawasfnbo
J A C C : C A R D I O V A S C U L A R I M A G I N G , V O L . 3 , N O . 7 , 2 0 1 0
J U L Y 2 0 1 0 : 7 3 4 – 4 5
Hakeem et al.
Renal Function, SPECT, and Outcomes in Diabetic Patients
741
ivariable predictors of CD were age �65 (HR:.84, 95% CI: 1.21 to 2.80), hyperlipidemia (HR:.40, 95% CI: 0.27 to 0.59), EF �40% (HR: 4.05;5% CI: 2.58 to 6.36), and SSS �4 (HR: 2.28, 95%I: 1. 36 to 2.83). There was no significant inter-
ction between the presence or absence of DM andKD and all other covariates. The model fits well
p value for goodness-of-fit � 0.14; the Harrell’s Ctatistic � 0.84).
An additional multivariable analysis model (resultot shown) comprising patients with high-risk (mod-rate to severely abnormal MPI and EF �40%)howed that patients with DM�CKD had an HR of.17 (95% CI: 1.75 to 5.74) for CD compared withhose high-risk patients without DM and CKD.istory of CAD and outcomes on the basis of DM/CKDtatus. Patients with a history of CAD had aignificantly lower survival free of CD/NFMI asompared with those without history of CAD6.7%/year vs. 3.6%/year; log-rank p � 0.0001).vent rates on the basis of CAD history with
urther stratification on the basis of DM/CKDtatus for the end points of CD, ACM, andD/NFMI are shown in Table 4. Overall, the
rends were similar to the entire cohort. Patientsith DM/CKD had a 3- to 4-fold higher CD rate
ompared with those without DM or CKD, regard-ess of history of CAD. In either group, those withKD had worse outcomes, regardless of DM sta-
us, compared with those without CKD (Fig. 7).
I S C U S S I O N
ur study examined the impact of CKD and MPIn risk stratifying diabetic and nondiabetic patientsor adverse cardiac events. After controlling for age,F, CAD, hypertension, dyslipidemia, and previ-us MI, we found that diabetic persons with CKDad significantly higher predicted rates of CDompared with counterparts without CKD. Thisnding was in keeping with previous studies thatemonstrated an increased risk of cardiovascularortality and ACM in patients with renal insuffi-
iency (23,24). However, we also found that theresence of CKD alone without DM was a power-ul determinant of cardiac mortality, perhaps stron-er than the presence of diabetes alone, becauseondiabetic patients with CKD had a several-fold
ncreased risk of CD compared with diabetic pa-ients without CKD. The absence of CKD iniabetic patients might portend a lower risk, be-
ause diabetic patients without CKD had a low pvent rate in a relatively short term, almost compa-able to patients without diabetes or CKD.
We also found that MPI provides effective risktratification for cardiac events on the basis ofiabetes and CKD status. Although the presence ofnormal scan confers a lower risk in CKD patientsith and without diabetes, the presence of CKD
dversely effects the warranty period of a normalcan. Diabetic patients with CKD have a several-old higher risk of death even in the presence of aormal scan, as do nondiabetic patients with CKD,ut the risk is relatively lower. Lastly, the presencef DM and CKD strongly correlates with the
SDS<2 SDS 2-6 SDS>6
0%No DM, No CKD
Eve
nts
/Yea
r
5%
10%
15%
1.18%
2.5%
4.7%
DM only
1%
2.63%
5.8%
CKD only
2.39%
7.33%6.45%
SRS<2 SRS 2-6 SRS>6
0%No DM, No CKD
Eve
nts
/Yea
r
5%
10%
20%
15%
1.19%
3%4%
DM only
0.6%
3.4%
7.4%
CKD only
2.75%
5.6%
10.3%
B
A
Figure 6. Annual CD on the Basis of Presence of Ischemia and SDM/CKD Status
Presence of ischemia (A) and scar (B) as determined by the severityassociated with a higher risk of CD, this effect being significantly mpatients with CKD and DM and CKD (all log-rank p � 0.001). Abbre1 and 4.
DM + CKD
2.7%
11.5%
10.34%
DM + CKD
4%
7.14%
16.39%
car Stratified by
of SDS and SRS wasore pronounced inviations as in Figures
resence and degree of perfusion defects, including
as
Cr2(godtpCbactatclsohcdpdcbrIsd
ptstnnppsib
ciccpossstaDe1deau
J A C C : C A R D I O V A S C U L A R I M A G I N G , V O L . 3 , N O . 7 , 2 0 1 0
J U L Y 2 0 1 0 : 7 3 4 – 4 5
Hakeem et al.
Renal Function, SPECT, and Outcomes in Diabetic Patients
742
strong correlation with the presence of a high-riskcan.
The associations among cardiovascular disease,KD, and increased cardiac mortality have been
eported previously in the general population (25–7), in patients with known CAD undergoing PCI28,29) and asymptomatic diabetic persons under-oing stress myocardial perfusion imaging (30), butur results also highlight the important point thatiabetic persons are a heterogeneous group and thathe absence of CKD in diabetic patients mightortend a relatively benign short-term risk.KD as a cardiovascular risk factor. The connectionsetween CKD and CVD are numerous. CKD isssociated with many traditional risk factors forardiovascular disease, including smoking, hyper-ension, dyslipidemia, physical inactivity, diabetes,nd the metabolic syndrome (27,31–34). However,here are also several nontraditional risk factors forardiovascular disease, including increased risk foreft ventricular hypertrophy from volume and pres-ure overload, anemia causing increased cardiacutput, altered bone mineral metabolism leading toyperphosphatemia and increased vascular calcifi-ation, increased oxidative stress, and endothelialysfunction. Because vascular disease is a systemicrocess affecting the rich renal vasculature, renalysfunction measured by eGFR might serve as aonvenient, quantifiable measure for atheroscleroticurden, a value aggregating the various disparateisk factors.mplications in risk stratifying diabetic persons. Withuch a high burden for cardiovascular mortality in
Table 3. Multivariable Analysis for CD Cox ProportionalHazards Model
Variable HR 95% CI p Value
DM/CKD category
No DM No CKD Referent
DM only 1.03 0.54–1.97 0.93
CKD only 1.58 0.92–2.71 0.09
DM�CKD 2.70 1.59–4.58 �0.0001
Age �65 1.84 1.21–2.80 0.004
SOB 1.54 0.92–2.59 0.10
Angina 0.91 0.57–1.44 0.68
Hypertension 0.76 0.49–1.17 0.21
Hyperlipidemia 0.40 0.27–0.59 �0.0001
History of MI 0.96 0.62–1.49 0.87
EF �40% 4.05 2.58–6.36 �0.0001
Pharm stress test 1.72 0.98–3.00 0.06
SSS �4 2.28 1.36–3.83 0.002
CD � cardiac death; HR � hazard ratio; other abbreviations as in Tables 1 and 2.
iabetic persons, noninvasive imaging has been
roposed to risk stratify diabetic persons and iden-ify those patients with a higher burden of athero-clerotic disease before a cardiac event. Althoughhere are limited prospective data, there are aumber of retrospective studies showing a benefit tooninvasive stress testing to risk stratify diabeticatients (35,36). Given the vast number of diabeticersons and the enormous cost for asymptomaticcreening, there have been several attempts todentify high-risk diabetic persons who would mostenefit from such an aggressive screening strategy.Unfortunately, the use of 2 or more traditional
ardiovascular risk factors has not predicted induc-ble ischemia on nuclear or echocardiographic myo-ardial perfusion imaging (37–39). Coronary arteryalcium scores have also been proposed to identifyatients with high likelihood of inducible ischemian imaging (40,41) and have been prospectivelytudied in asymptomatic diabetic persons (39). Re-ults of the DIAD trial showed that screening forilent ischemia with myocardial perfusion imagingesting in diabetic patients was not associated with
reduction in cardiovascular events (12). TheIAD cohort, however, had a very low cardiac
vent rate (average, 0.6%/year) translating into a4% power to detect the originally anticipatedifference between the groups. Although the lowvent rate precluded any multivariable analysis, age-nd sex-adjusted analysis revealed microalbumin-ria/proteinuria and serum creatinine to be predic-
Table 4. Annualized Event Rate on the Basis of History of CADand DM/CKD Status
No History of CAD(n � 1,015)
History of CAD(n � 732)
pValue
No DM No CKD
CD 1.53% 1.9% 0.64
ACM 5% 3.8% 0.26
CD/NFMI 2.2% 4% 0.04
DM only
CD 1.3% 2.8% 0.2
ACM 4% 5.4% 0.43
CD/NFMI 3.7% 5.4% 0.34
CKD only
CD 4.4% 4.7% 0.9
ACM 8.8% 8.4% 0.9
CD/NFMI 5.1% 8.2% 0.1
DM�CKD
CD 5.1% 9.2% 0.05
ACM 7.4% 9.6% 0.41
CD/NFMI 5.7% 12.6% 0.002
ACM � all-cause mortality; NFMI � nonfatal myocardial infarction; other abbre-
viations as in Tables 1 and 2.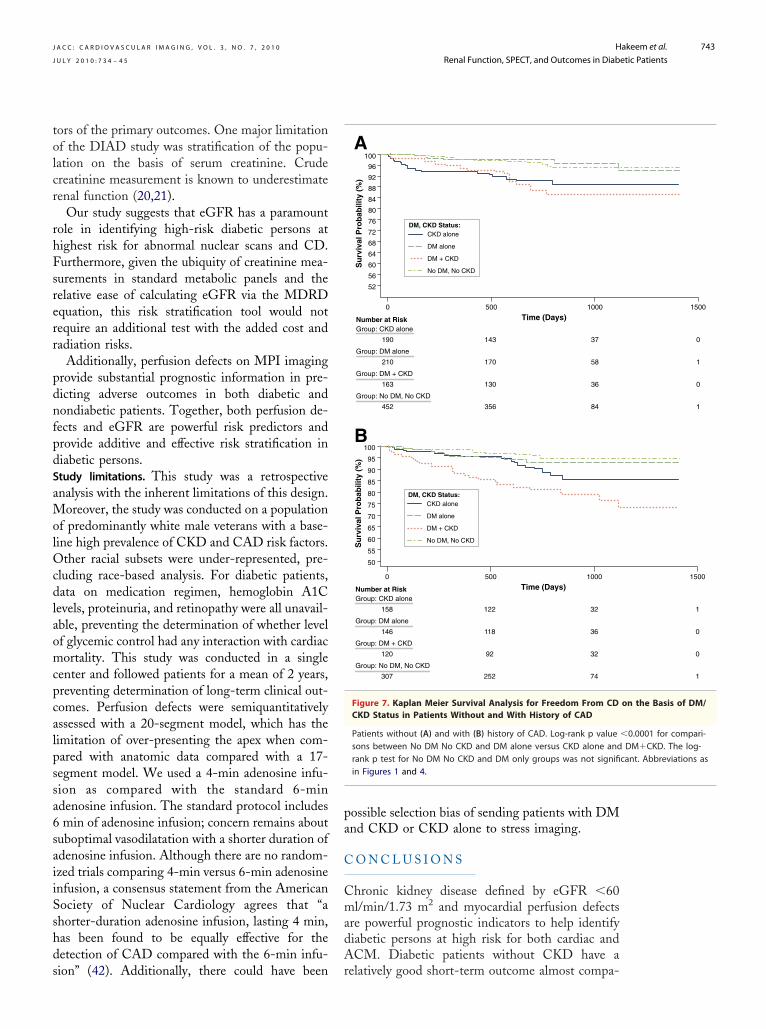
tolcr
rhFsrerr
pdnfpdSaMolOcdlaomcpcalpssa6saiiSshds
pa
C
CmadA
J A C C : C A R D I O V A S C U L A R I M A G I N G , V O L . 3 , N O . 7 , 2 0 1 0
J U L Y 2 0 1 0 : 7 3 4 – 4 5
Hakeem et al.
Renal Function, SPECT, and Outcomes in Diabetic Patients
743
ors of the primary outcomes. One major limitationf the DIAD study was stratification of the popu-ation on the basis of serum creatinine. Crudereatinine measurement is known to underestimateenal function (20,21).
Our study suggests that eGFR has a paramountole in identifying high-risk diabetic persons atighest risk for abnormal nuclear scans and CD.urthermore, given the ubiquity of creatinine mea-urements in standard metabolic panels and theelative ease of calculating eGFR via the MDRDquation, this risk stratification tool would notequire an additional test with the added cost andadiation risks.
Additionally, perfusion defects on MPI imagingrovide substantial prognostic information in pre-icting adverse outcomes in both diabetic andondiabetic patients. Together, both perfusion de-ects and eGFR are powerful risk predictors androvide additive and effective risk stratification iniabetic persons.tudy limitations. This study was a retrospectivenalysis with the inherent limitations of this design.
oreover, the study was conducted on a populationf predominantly white male veterans with a base-ine high prevalence of CKD and CAD risk factors.
ther racial subsets were under-represented, pre-luding race-based analysis. For diabetic patients,ata on medication regimen, hemoglobin A1C
evels, proteinuria, and retinopathy were all unavail-ble, preventing the determination of whether levelf glycemic control had any interaction with cardiacortality. This study was conducted in a single
enter and followed patients for a mean of 2 years,reventing determination of long-term clinical out-omes. Perfusion defects were semiquantitativelyssessed with a 20-segment model, which has theimitation of over-presenting the apex when com-ared with anatomic data compared with a 17-egment model. We used a 4-min adenosine infu-ion as compared with the standard 6-mindenosine infusion. The standard protocol includesmin of adenosine infusion; concern remains about
uboptimal vasodilatation with a shorter duration ofdenosine infusion. Although there are no random-zed trials comparing 4-min versus 6-min adenosinenfusion, a consensus statement from the Americanociety of Nuclear Cardiology agrees that “ahorter-duration adenosine infusion, lasting 4 min,as been found to be equally effective for theetection of CAD compared with the 6-min infu-
ion” (42). Additionally, there could have been rossible selection bias of sending patients with DMnd CKD or CKD alone to stress imaging.
O N C L U S I O N S
hronic kidney disease defined by eGFR �60l/min/1.73 m2 and myocardial perfusion defects
re powerful prognostic indicators to help identifyiabetic persons at high risk for both cardiac andCM. Diabetic patients without CKD have a
Time (Days)
Su
rviv
al P
rob
abili
ty (
%)
60
64
68
72
76
80
84
88
92
96
100
56
52
0 500 1000
Number at RiskGroup: CKD alone
190 143 37
Group: DM alone
210 170 58
Group: DM + CKD
163 130 36
Group: No DM, No CKD
452 356 84
No DM, No CKD
CKD aloneDM, CKD Status:
DM + CKD
DM alone
Time (Days)
Su
rviv
al P
rob
abili
ty (
%)
60
65
75
70
80
85
90
95
100
55
50
0 500 1000
Number at RiskGroup: CKD alone
158 122 32
Group: DM alone
146 118 36
Group: DM + CKD
120 92 32
Group: No DM, No CKD
307 252 74
No DM, No CKD
CKD aloneDM, CKD Status:
DM + CKD
DM alone
A
B
Figure 7. Kaplan Meier Survival Analysis for Freedom From CDCKD Status in Patients Without and With History of CAD
Patients without (A) and with (B) history of CAD. Log-rank p valuesons between No DM No CKD and DM alone versus CKD alone andrank p test for No DM No CKD and DM only groups was not signifiin Figures 1 and 4.
1500
0
1
0
1
1500
1
0
0
1
on the Basis of DM/
�0.0001 for compari-DM�CKD. The log-
cant. Abbreviations as
elatively good short-term outcome almost compa-
rclTrwaw
sdm
R
UW
R
J A C C : C A R D I O V A S C U L A R I M A G I N G , V O L . 3 , N O . 7 , 2 0 1 0
J U L Y 2 0 1 0 : 7 3 4 – 4 5
Hakeem et al.
Renal Function, SPECT, and Outcomes in Diabetic Patients
744
able to nondiabetic patients. Hence the increasedardiovascular morbidity in diabetic persons mightargely be due to underlying renal dysfunction.hus, the use of eGFR might play an important
ole in identifying high-risk diabetic persons whoould benefit most from myocardial perfusion im-
ging. Presence of a normal scan in diabetic personsith CKD or those with CKD alone is associated
after myocardial infarction. N Engl JMed 2004;351:1285–95.
technetium-99m seperfusion single-
tudies are warranted to evaluate the impact ofifferent cardiovascular prevention and manage-ent strategies in diabetic persons with CKD.
eprint requests and correspondence: Dr. Abdul Hakeem,niversity of Cincinnati Hospital, 231 Albert Sabinay, Academic Health Center, PO Box 670542, Cin-
with a less benign prognosis. Further prospective cinnati, Ohio 45257-0542. E-mail: [email protected].
1
1
1
1
2
2
2
E F E R E N C E S
1. American Diabetes Association. Eco-nomic costs of diabetes in the U.S. in2007. Diabetes Care 2008;31:596–615.
2. Gu K, Cowie CC, Harris MI. Mor-tality in adults with and without dia-betes in a national cohort of the U.S.population, 1971–1993. DiabetesCare 1998;21:1138–45.
3. National Cholesterol Education Pro-gram (NCEP) Expert Panel on De-tection, Evaluation, and Treatment ofHigh Blood Cholesterol in Adults(Adult Treatment Panel III). Thirdreport of the national cholesterol ed-ucation program (NCEP) expert panelon detection, evaluation, and treat-ment of high blood cholesterol inadults (adult treatment panel III) finalreport. Circulation 2002;106:3143–421.
4. Meisinger C, Doring A, Lowel H,KORA Study Group. Chronic kidneydisease and risk of incident myocardialinfarction and all-cause and cardiovas-cular disease mortality in middle-agedmen and women from the generalpopulation. Eur Heart J 2006;27:1245–50.
5. Go AS, Chertow GM, Fan D, Mc-Culloch CE, Hsu CY. Chronic kid-ney disease and the risks of death,cardiovascular events, and hospitaliza-tion. N Engl J Med 2004;351:1296–305.
6. Manjunath G, Tighiouart H, IbrahimH, et al. Level of kidney function as arisk factor for atherosclerotic cardio-vascular outcomes in the community.J Am Coll Cardiol 2003;41:47–55.
7. Weiner DE, Tighiouart H, AminMG, et al. Chronic kidney disease as arisk factor for cardiovascular diseaseand all-cause mortality: a pooled anal-ysis of community-based studies.J Am Soc Nephrol 2004;15:1307–15.
8. Anavekar NS, McMurray JJ, VelazquezEJ, et al. Relation between renal dys-function and cardiovascular outcomes
9. Muntner P, He J, Hamm L, Loria C,Whelton PK. Renal insufficiency andsubsequent death resulting from car-diovascular disease in the UnitedStates. J Am Soc Nephrol 2002;13:745–53.
10. Levey AS, Coresh J, Balk E, et al.,National Kidney Foundation. Na-tional kidney foundation practiceguidelines for chronic kidney disease:evaluation, classification, and stratifi-cation. Ann Intern Med 2003;139:137–47.
11. Chobanian AV, Bakris GL, BlackHR, et al., National Heart, Lung, andBlood Institute Joint National Com-mittee on Prevention, Detection,Evaluation, and Treatment of HighBlood Pressure; National High BloodPressure Education Program Coordi-nating Committee. The seventh re-port of the joint national committeeon prevention, detection, evaluation,and treatment of high blood pressure:the JNC 7 report. JAMA 2003;289:2560–72.
12. Young LH, Wackers FJ, Chyun DA,et al., DIAD Investigators. Cardiacoutcomes after screening for asymp-tomatic coronary artery disease in pa-tients with type 2 diabetes: the DIADstudy: a randomized controlled trial.JAMA 2009;301:1547–55.
13. Treuth MG, Reyes GA, He ZX,Cwajg E, Mahmarian JJ, Verani MS.Tolerance and diagnostic accuracy ofan abbreviated adenosine infusion formyocardial scintigraphy: A random-ized, prospective study. J Nucl Cardiol2001;8:548–54.
14. Berman DS, Kiat HS, Van Train KF,Germano G, Maddahi J, FriedmanJD. Myocardial perfusion imagingwith technetium-99m-sestamibi:comparative analysis of available im-aging protocols. J Nucl Med 1994;35:681–8.
15. Berman DS, Hachamovitch R, KiatH, et al. Incremental value of prog-nostic testing in patients with knownor suspected ischemic heart disease: abasis for optimal utilization of exercise
stamibi myocardialphoton emission
computed tomography. J Am CollCardiol 1995;26:639–47.
6. Hachamovitch R, Berman DS, KiatH, et al. Exercise myocardial perfu-sion SPECT in patients withoutknown coronary artery disease: incre-mental prognostic value and use inrisk stratification. Circulation 1996;93:905–14.
7. Zellweger MJ, Dubois EA, Lai S, etal. Risk stratification in patients withremote prior myocardial infarction us-ing rest-stress myocardial perfusionSPECT: prognostic value and impacton referral to early catheterization.J Nucl Cardiol 2002;9:23–32.
8. Hachamovitch R, Berman DS, ShawLJ, et al. Incremental prognostic valueof myocardial perfusion single photonemission computed tomography forthe prediction of cardiac death: differ-ential stratification for risk of cardiacdeath and myocardial infarction. Cir-culation 1998;97:535–43.
9. Poggio ED, Wang X, Greene T, VanLente F, Hall PM. Performance ofthe modification of diet in renal dis-ease and cockcroft-gault equations inthe estimation of GFR in health andin chronic kidney disease. J Am SocNephrol 2005;16:459–66.
0. Levey AS, Coresh J, Greene T, et al.,Chronic Kidney Disease Epidemiol-ogy Collaboration. Using standard-ized serum creatinine values in themodification of diet in renal diseasestudy equation for estimating glomer-ular filtration rate. Ann Intern Med2006;145:247–54.
1. National Kidney Foundation. K/DOQIclinical practice guidelines for chronickidney disease: Evaluation, classifica-tion, and stratification. Am J KidneyDis 2002;39:S1–266.
2. May S, Hosmer DW. Hosmer andLemeshow type goodness-of-fit statis-tics for the Cox proportional hazardsmodel. In: Balakrishnan N, Rao CR,editors. Advances in Survival Analysis:Handbook of Statistics,Vol. 23. Am-sterdam, the Netherlands: Elsevier,
North-Holland, 2004, 383–94.
2
2
2
2
2
2
3
3
3
4
4
4
K
J A C C : C A R D I O V A S C U L A R I M A G I N G , V O L . 3 , N O . 7 , 2 0 1 0
J U L Y 2 0 1 0 : 7 3 4 – 4 5
Hakeem et al.
Renal Function, SPECT, and Outcomes in Diabetic Patients
745
3. Patel UD, Young EW, Ojo AO, Hay-ward RA. CKD progression and mor-tality among older patients with dia-betes. Am J Kidney Dis 2005;46:406–14.
4. Nag S, Bilous R, Kelly W, Jones S,Roper N, Connolly V. All-cause andcardiovascular mortality in diabeticsubjects increases significantly with re-duced estimated glomerular filtrationrate (eGFR): 10 years’ data from thesouth tees diabetes mortality study.Diabet Med 2007;24:10–7.
5. Henry RM, Kostense PJ, Bos G, et al.Mild renal insufficiency is associatedwith increased cardiovascular mortal-ity: the Hoorn study. Kidney Int 2002;62:1402–7.
6. Rahman M, Brown CD, Coresh J, etal., Antihypertensive and Lipid-Lowering Treatment to Prevent HeartAttack Trial Collaborative ResearchGroup. The prevalence of reducedglomerular filtration rate in older hy-pertensive patients and its associationwith cardiovascular disease: a reportfrom the antihypertensive and lipid-lowering treatment to prevent heartattack trial. Arch Intern Med 2004;164:969–76.
7. Sarnak MJ, Levey AS, SchoolwerthAC, et al., American Heart Associa-tion Councils on Kidney in Cardio-vascular Disease, High Blood PressureResearch, Clinical Cardiology, andEpidemiology and Prevention. Kidneydisease as a risk factor for develop-ment of cardiovascular disease: a state-ment from the American Heart Asso-ciation Councils on kidney incardiovascular disease, high bloodpressure research, clinical cardiology,and epidemiology and prevention.Circulation 2003;108:2154–69.
8. Sadeghi HM, Stone GW, Grines CL,et al. Impact of renal insufficiency in
patients undergoing primary angio-plasty for acute myocardial infarction.Circulation 2003;108:2769–75.
29. Best PJ, Lennon R, Ting HH, et al.The impact of renal insufficiency onclinical outcomes in patients undergo-ing percutaneous coronary interven-tions. J Am Coll Cardiol 2002;39:1113–9.
30. Knobler H, Zornitzki T, Vered S, etal. Reduced glomerular filtration ratein asymptomatic diabetic patients:predictor of increased risk for cardiacevents independent of albuminuria.J Am Coll Cardiol 2004;44:2142–8.
31. Muntner P, He J, Astor BC, FolsomAR, Coresh J. Traditional and non-traditional risk factors predict coro-nary heart disease in chronic kidneydisease: results from the atherosclero-sis risk in communities study. J AmSoc Nephrol 2005;16:529–38.
32. Foley RN, Wang C, Collins AJ. Car-diovascular risk factor profiles andkidney function stage in the US gen-eral population: the NHANES IIIstudy. Mayo Clin Proc 2005;80:1270–7.
33. Chen J, Muntner P, Hamm LL, et al.The metabolic syndrome and chronickidney disease in U.S. adults. AnnIntern Med 2004;140:167–74.
34. Uhlig K, Levey AS, Sarnak MJ. Tra-ditional cardiac risk factors in individ-uals with chronic kidney disease. Se-min Dial 2003;16:118–27.
35. Faglia E, Manuela M, Antonella Q, etal. Risk reduction of cardiac events byscreening of unknown asymptomaticcoronary artery disease in subjectswith type 2 diabetes mellitus at highcardiovascular risk: an open-label ran-domized pilot study. Am Heart J2005;149:e1–6.
36. Sorajja P, Chareonthaitawee P, Ra-jagopalan N, et al. Improved survival
in asymptomatic diabetic patients fwith high-risk SPECT imagingtreated with coronary artery bypassgrafting. Circulation 2005;112:I311–6.
7. Scognamiglio R, Negut C, RamondoA, Tiengo A, Avogaro A. Detectionof coronary artery disease in asymp-tomatic patients with type 2 diabetesmellitus. J Am Coll Cardiol 2006;47:65–71.
8. Wackers FJ, Young LH, Inzucchi SE,et al.; Detection of Ischemia inAsymptomatic Diabetics Investiga-tors. Detection of silent myocardialischemia in asymptomatic diabeticsubjects: the DIAD study. DiabetesCare 2004;27:1954–61.
9. Anand DV, Lim E, Hopkins D, et al.Risk stratification in uncomplicatedtype 2 diabetes: prospective evaluationof the combined use of coronary arterycalcium imaging and selective myocar-dial perfusion scintigraphy. EurHeart J 2006;27:713–21.
0. Berman DS, Wong ND, Gransar H,et al. Relationship between stress-induced myocardial ischemia and ath-erosclerosis measured by coronary cal-cium tomography. J Am Coll Cardiol2004;44:923–30.
1. He ZX, Hedrick TD, Pratt CM, Ve-rani MS, Aquino V, Roberts R, Mah-marian JJ. Severity of coronary arterycalcification by electron beam com-puted tomography predicts silentmyocardial ischemia. Circulation2000;101:244–51.
2. Bokhari S, Ficaro EP, McCallisterBD Jr. Adenosine stress protocols formyocardial perfusion imaging. J NuclCardiol 2007;14:415–6.
ey Words: diabetic y renal
unction y risk stratification.