Embed Size (px)
Citation preview

Removing Ammonium From Contaminated WaterUsing Purolite C100E: Batch, Column, andHousehold Filter StudiesDai Quyet Truong
University of Technology SydneyParipurnanda Loganathan
University of Technology SydneyLe Minh Tran
Hanoi University of Science and Technology (HUST)Duc Loi Vu
Vietnam Academy of Science and TechnologyTien Vinh Nguyen ( [email protected] )
University of Technology Sydney https://orcid.org/0000-0003-3893-1217Saravanamuthu Vigneswaran
University of Technology SydneyGayathri Naidu
University of Technology Sydney
Research Article
Keywords: Ammonium removal, Contaminated water, Ion exchange, Household water �lter, Purolite C100-E resin
Posted Date: August 24th, 2021
DOI: https://doi.org/10.21203/rs.3.rs-804875/v1
License: This work is licensed under a Creative Commons Attribution 4.0 International License. Read Full License
Version of Record: A version of this preprint was published at Environmental Science and PollutionResearch on October 16th, 2021. See the published version at https://doi.org/10.1007/s11356-021-16945-1.

1
Removing ammonium from contaminated water using Purolite C100E: Batch, column, and 1
household filter studies 2
3
Dai Quyet Truong1,2, Paripurnanda Loganathan1, Le Minh Tran2, Duc Loi Vu3, Tien Vinh Nguyen1*, 4
Saravanamuthu Vigneswaran1, Gayathri Naidu1 5
1 Faculty of Engineering and IT, University of Technology Sydney (UTS), Sydney, Australia 6
2 School of Environmental Science and Technology, Hanoi University of Science and Technology 7
(HUST), Hanoi, Vietnam 8
3 Institute of Chemistry, Vietnam Academy of Science and Technology (VAST), Hanoi, Vietnam 9
* Corresponding author: Tien Vinh Nguyen, Email: [email protected]; Tel: 61-2-95142620; Fax: 10
61-2-95147803 11
12
ABSTRACT 13
Ammonium removal from drinking water to protect human and environmental health is one of the 14
major global concerns. This study evaluates the performance of Purolite C100E, a commercial cation 15
exchange resin, on eliminating ammonium in synthetic and real contaminated groundwater. The results 16
demonstrate that the pH operation range of the resin for better ammonium removal is 3 to 8, while the 17
optimum contact time was about 30 min. The kinetics of the ammonium removal process followed both 18
the Pseudo-first order and Pseudo-second order models. Equilibrium data of ammonium removal fitted 19
both the Langmuir and Freundlich isotherm models with the maximum Langmuir ion exchange capacities 20
for initial ammonium concentrations of 10-200 mg/L and 50-2000 mg/L reaching 18.37 mg/g and 40.16 21
mg/g, respectively. The presence of co-ions in the water reduced the ammonium removal efficiencies in 22
the order Mg2+> Ca2+> K+. The maximum exchange capacity in the fluidised bed studies of the original 23
Purolite C100E (bed height 27 cm, resin weight 75 g, initial ammonium concentration 17.4 mg/L, 24
filtration velocity 0.5 m/h) was 10.48 mg/g. It progressively reduced slightly after three regeneration 25
cycles to 8.79 mg/g. The column breakthrough data satisfactorily fitted the Thomas model. A household 26

2
filter cartridge packed with 4 kg Purolite C100E (80 cm height) and operated at a filtration velocity of 1.9 27
m/h in Vietnam successfully reduced the initial 6 mg NH4+/L in groundwater (after sand filter pre-28
treatment) to well below the Vietnam drinking water standard (3 mg/L) continuously for one week. 29
30
Keywords: Ammonium removal; Contaminated water; Ion exchange; Household water filter; Purolite 31
C100-E resin 32
33
1. Introduction 34
One of the most serious global problems currently facing humanity is the inability to provide clean 35
water for drinking and other purposes. The lack of clean water is threatening the lives of billions of 36
people in many countries around the world, especially in developing countries (Aliewi and Al-Khatib, 37
2015; Tanabe et al., 2001; Sica et al., 2014). Vietnam, a country in Southeast Asia, is no exception. 38
In Vietnam, clean water for drinking and living needs is provided from surface water (rivers, lakes, 39
and streams), rainwater and groundwater. In many rural areas, groundwater is the main water source for 40
human sustenance and daily activities. Groundwater is often exploited through dug wells or drilled wells, 41
pre-treated by filtering through sand filter tanks prior to use in households (Terin and Sabogal-Paz, 2019). 42
The quality of groundwater in each locality fluctuates very widely and is unstable, depending on many 43
factors including groundwater circuits, geological conditions and human activities. The groundwater 44
treated by a conventional sand filter normally still contains many pollutants such as arsenic, iron, 45
manganese, and ammonium, exceeding the permitted standard concentration limits. Among these 46
pollutants, ammonium is considered as one of the most common and difficult pollutants to eliminate (Vu 47
et al., 2017; Alshameri et al., 2014). In Hanoi (Vietnam), groundwater with high ammonium 48
concentrations of 55-70 mg/L were reported in some villages (Vietnam Environment Agency, 2016). In 49
another study conducted in three villages in Ha Nam Province of Vietnam, average groundwater 50
ammonium concentrations of 22-95 mg/L were detected in 2006 with some samples having values greater 51
than 150 mg/L (Nguyen et al., 2009). These values were 7 to 32 times higher than the Vietnam drinking 52

3
water standard (3 mg/L, Vietnamese Department of Preventive Medicine & Environment, 2009). Not only 53
Vietnam, but there are many other countries that have similar excessive levels of ammonium pollution in 54
their groundwater sources. Examples here include Dongting Plain, central China (Huang et al., 2021), 55
Bangladesh (Tanabe et al., 2001), Palestine (Aliewi and Al-Khatib, 2015), and Montana in the USA 56
(Shaw et al., 2013). Due to its toxicity to human health, ammonium in groundwater should be removed 57
and this is one of the major challenges the water treatment industry is currently facing. 58
There are several technologies that can remove ammonium from water such as biological 59
nitrification/denitrification, air stripping, chlorination, adsorption, ion exchange, and membrane processes 60
(Sica et al., 2014; Ding and Sartaj, 2016; Aral et al., 1999). Of these, ion exchange is known to be one of 61
the most widely applied technologies in removing ammonium (Tchobanoglous et al., 2014). In this 62
process, specific ions in solution displace ions of similar charge from an exchange material. The main 63
principle of this approach can be summarised for ammonium exchange on ion exchange resin employing 64
the following equation: 65
R-X + NH4+ ↔ R-NH4 + X+ 66
where R- is the anionic group of an ion exchange resin and X is the exchangeable cation neutralising 67
the anionic charge. 68
Ion exchangers can be classified as natural materials (natural zeolite) and synthetic organic resins 69
(Ding and Sartaj, 2016). Compared with natural zeolite, synthetic resins have many advantages, such as: 70
longer life cycle, faster exchange rate, better durability and higher exchange capacity (Ding and Sartaj, 71
2016; Aral et al., 1999). In groundwater, there are many coexisting ions such as calcium and magnesium 72
present along with ammonium and these ions can compete with ammonium for ion exchange. Such 73
competition will reduce efficiency in removing ammonium via an ion exchanger. Only a few studies 74
reported in the literature have evaluated the treatment efficiency of ammonium ions in not only water 75
sources generally, but also real groundwater in particular by ion exchange resins. Jorgensen and 76
Weatherley (2003) reported that Dowex 50W-X8 and Purolite MN500 ion exchange resins had the 77
maximum exchange capacity of approximately 35 and 29 mg/g, respectively, at the initial concentration 78

4
of 200 mg NH4+/L synthetic solution. Ding and Sartaj (2016) reported that Amberlite IR120 H resin had a 79
Langmuir maximum exchange capacity of 29.76 mg/L at an initial concentration of 300-3000 mg NH4+/L 80
synthetic solution. 81
One of the most popular ion exchange resins used for water treatment in Vietnam is Purolite C100-E 82
resin (Purolite Co., UK). This resin is already in use not only in Vietnam but also in many other countries 83
for reducing the hardness of domestic water sources. To the best of the authors’ knowledge, no study has 84
yet evaluated this resin for the treatment of ammonium in water. Therefore, this study was undertaken to 85
evaluate the additional advantage of Purolite C100-E ion exchange resin for ammonium removal from 86
groundwater. If the resin is found to be effective in removing ammonium, it can then serve two purposes, 87
namely, removing ammonium as well as water hardness, an advantage for the water treatment plants. 88
Another aspect of the study was the evaluation of continuous ammonium removal by the resin in a 89
dynamic column set-up, which can be applied to design practical groundwater treatment systems in rural 90
areas. The regeneration efficiency of the resin was also studied to obtain information on the reusability of 91
the resin which would reduce the treatment cost. Finally, the study was conducted in the field with real 92
contaminated groundwater containing competing cations at Ha Noi, Vietnam, in an effort to fully evaluate 93
the practical performance of Purolite C100E. The studies in dynamic columns with mathematical 94
modelling of ammonium breakthrough, and field testing of the resin performance in household conditions 95
are innovations researched in this paper. 96
97
2. Materials and methods 98
2.1. Ion exchange resin 99
The ion exchange resin used in this study was Purolite C100-E (obtained from Purolite Co.). Purolite 100
C100-E is a strong acid cation resin and structure-wise, it consists of gel polystyrene cross-linked with 101
divinylbenzene. The functional group of this resin is sulfonic acid (–SO3H), which contains the 102
exchangeable ion Na+. Purolite C100-E has a total exchange capacity of 1.90 eq/L (Na+ form), moisture 103
retention of 46-50%, particle size from 300 to 1200 µm and density of 800 – 840 g/L. The resin was 104

5
initially washed with distilled water to remove any dirt present in it. It was then dried at room temperature 105
(30 ± 1oC) for 24 h to remove adsorbed moisture. 106
107
2.2. Synthetic ammonium solution 108
Ammonium stock solution of 2000 mg NH4+/L was prepared by dissolving 11.888 g analytical-grade 109
NH4Cl (Merk Chemical Co.) in 2000 mL distilled water. Then, the stock solution was diluted with 110
distilled water to achieve the desired ammonium concentrations (20 to 2000 mg/L) for use in batch and 111
column experiments. 112
113
2.3. Analytical methods 114
The concentration of ammonium in the liquid phase was determined using a manual spectrometric 115
method (ISO 7150/1-1984). Here, the blue compound formed by reaction of ammonium in solution with 116
salicylate and hypochlorite ions in the presence of sodium nitrosopentacyanoferrate (lll) was measured by 117
an UV-VIS spectrophotometer (Model 8453, Agilent Technologies, Inc., California, United States) at a 118
wavelength of 655 nm. 119
Scanning electron microscopy (SEM, Model JSM-7500F, JEOL Ltd., Japan) served to investigate the 120
surface morphology of the Purolite C100E resin particles before and after the ion exchange process. 121
Meanwhile, the surface chemical elemental composition before and after the ion exchange process was 122
determined by Energy Dispersion Spectrometry analysis (EDS, Model X-max 50 mm2, Oxford 123
Instruments Analytical Ltd., England). 124
125
2.4. Batch studies 126
Several batch ion exchange experiments were conducted at room temperature of 30 ± 1oC to evaluate 127
the performance of Purolite C100E for removing ammonium. 128
129
130

6
2.4.1. Effect of pH 131
The effect of pH on ammonium removal by Purolite C-100E was studied at a range of pH values from 132
approximately 1 to 11. Here the pH of synthetic ammonium solution of 50 mg/L was adjusted using HCl 133
and NaOH standard solutions to achieve the desired pH values. As the pH changed from 1 to 11, the ionic 134
strength also changed. To keep the ionic strength constant as much as possible for the pH levels, this 135
experiment was repeated by adding NaCl to maintain the solutions at two ionic strength: 0.001M and 136
0.01M NaCl. NaCl is an indifferent electrolyte, one that plays the role of a supporting medium to keep 137
ionic strength constant throughout all pH level values (Hedström and Amofah, 2008). The experiments 138
were conducted by adding 1.0 g resin to 100 mL synthetic ammonium solution containing 50 mg NH4+/L 139
at different levels of pH in several 250 mL Erlenmeyer flasks. These flasks were agitated at 130 rpm for 140
24 h. The suspensions were filtered through 0.45 µm filter papers and the concentrations of ammonium in 141
the filtrates were measured as explained before. 142
143
2.4.2. Kinetics experiment 144
1.0 g resin was added to 100 mL synthetic ammonium solution containing 50 mg NH4+/L in several 145
250 mL Erlenmeyer flasks. These flasks were agitated at 130 rpm and samples were collected after 0, 5, 146
10, 15, 30, 45, 60, 90, 120, 180 and 240 min from each flask. The samples were filtered through 0.45 µm 147
filter papers and the concentrations of ammonium in the filtered samples were measured. 148
149
2.4.3. Equilibrium isotherm experiment 150
Effect of resin dose 151
Synthetic water containing 50 mg NH4+/L at pH 6.5 was used in this study. Different amounts of 152
Purolite C100-E were added to 100 mL of the synthetic ammonium solution in a set of 250 mL 153
Erlenmeyer flasks to produce concentrations from 0.5 to 20 g resin/L. The flasks were agitated in a shaker 154
at 130 rpm for 24 h. The supernatants from the suspensions in these flasks were filtered through 0.45 µm 155
filter papers and the concentrations of ammonium in the filtrates were measured. 156

7
Isotherm experiment 157
2.0 g resin was added to 100 mL synthetic ammonium solution to the different initial ammonium 158
concentrations, ranging from 10 to 200 mg/L, in a set of 250 mL Erlenmeyer flasks. The flasks were 159
agitated in a shaker at 130 rpm for 24 h. The supernatants from the suspensions in these flasks were then 160
filtered through 0.45 µm filter papers and the concentrations of ammonium in the filtrates were measured. 161
Another experiment was conducted using the same procedure, but the initial ammonium concentration 162
ranged from 50 to 2000 mg/L, to determine whether the maximum exchange capacity of the resin 163
calculated using standard adsorption models depends on the initial ammonium concentration range used. 164
The amount of ammonium in the solid phase was calculated using the mass balance Equation 1 165
(Wassie and Srivastava, 2016): 166
Qe = (𝐶𝑜−𝐶𝑒)𝑉𝑚 (1) 167
where, Qe is the mass of ammonium exchanged per unit mass of resin (mg/g); Co and Ce are 168
specifically the initial and equilibrium concentrations of ammonium in the liquid phase (mg/L), 169
respectively; V is the volume of solution (L) and m is the mass of Purolite C100-E resin (g). 170
The removal efficiency (RE, %) of ammonium was calculated using Equation 2: 171
RE (%) = (𝐶𝑜−𝐶𝑒)𝐶𝑜 ⋅ 100 (%) (2) 172
173
2.4.4. Effect of co-existing cations on ammonium removal 174
Based on the Vietnamese National Environmental Report (2016) which covers the period 2011-2015, 175
the groundwater in the northern delta region of Vietnam contains Ca and Mg ions content ranging from 176
56.23-57.62 mg Ca2+/L and 34.71-36.98 mg Mg2+/L, respectively. An experiment was conducted by 177
adding specifically potassium, calcium, and magnesium ions to the synthetic ammonium solution to 178
determine the effects of these ions on ammonium removal by the resin. A fixed concentration of each 179
cation (50 mg/L) was added to water containing five ammonium concentrations, ranging from 10 to 50 180
mg/L. The experimental procedure is similar to the equilibrium isotherm experiment. 181
8
2.5. Fluidised bed experiment 182
A fluidised bed experiment was conducted using a glass column of 22 mm internal diameter and 300 183
mm height. The column was packed with 75 g Purolite C100E, to have a height of 270 mm. Synthetic 184
ammonium solution (Co ≈ 17 mg NH4+/L) prepared from tap water was pumped upwards through the 185
column by dosing pumps with a constant flow rate of 200 mL/h (corresponding to the filtration velocity 186
of 0.5 m/h). The effluent samples were collected every 15 min for 238 h by an automatic sampling device 187
and the solutions were analysed for ammonium (UV-VIS spectrophotometer, Model 8453, Agilent 188
Technologies, Inc., California, USA) and other cations using an ICP-MS instrument (Model ELAN 9000, 189
PerkinElmer, Inc., Shelton, USA). 190
The maximum amount of ammonium (mg) exchanged (removal) by the resin in the column was 191
calculated using Equation 3 (Kalaruban et al., 2016): 192
𝑞𝑡𝑜𝑡𝑎𝑙 = 𝑄. ∫ 𝐶𝑖𝑒 ⋅ ⅆ𝑡𝑡−𝑡𝑜𝑡𝑎𝑙𝑡=0 (3)
where, qtotal is the maximum amount of ammonium exchanged by the resin (mg), Q is the flow rate of 193
water (L/h), t is the operation time (h) and Cie is the exchanged ammonium concentration (Cie = Co – Ct) 194
(mg/L). 195
The maximum ion exchange capacity of the resin (qm, mg/g) was calculated from Equation 4: 196
𝑞𝑚 = 𝑞𝑡𝑜𝑡𝑎𝑙𝑀 (4) 197
where M is the mass of resin used (g). 198
2.6. Fluidised bed column results modelling 199
The Thomas model (Thomas, 1944) was used to predict the breakthrough curve and the maximum ion 200
exchange capacity of the material for ammonium in the fluidised bed column (Aksu and Gönen, 2004). 201
This model assumes plug flow behaviour in the bed, uses the Langmuir isotherm for equilibrium and 202
second order reversible reaction for kinetics (Nur et al., 2014). The linearised form of the Thomas model 203
can be expressed as follows (Thomas, 1944): 204

9
𝑙𝑛 (𝐶𝑜𝐶𝑡 − 1) = 𝑘𝑇ℎ𝑞𝑜𝑀𝑄 − 𝑘𝑇ℎ𝐶𝑜𝑡 (5) 205
where, kTh is the Thomas rate constant (mL/min mg); qo is the equilibrium ammonium uptake per g of 206
resin (mg NH4+/g); Co is the inlet ammonium concentration (mg/L); Ct is the outlet ammonium 207
concentration at time t (mg/L); M is the mass of resin (g); and Q is the filtration rate (mL/min) and t 208
stands for filtration time (min). 209
The Thomas rate constant kTh and the ammonium exchange capacity of the bed qo can be determined 210
from a plot of ln[(Co/C)-1] against time (t). 211
212
2.7. Regeneration of the resin used in the fluidised bed experiment 213
Regeneration of the exhausted Purolite C100E after fluidised bed experiment was done by desorbing 214
the adsorbed ammonium using 10% sodium chloride solution. Based on the Purolite Engineering Bulletin 215
document (2013), this process was operated in counter-flow mode (up-flow mode), and it comprised 3 216
steps as follows. Firstly, the regenerant brine was prepared by dissolving 100 g Indian industrial sodium 217
chloride salt in 1L of distilled water to create a solution of 10% NaCl. This brine was pumped up-flow 218
through the column at a rate of 2 BV/h (200 mL/h) for one hour. In the second step, a slow rinsing 219
process was carried out using distilled water at the same flow rate as the first step for one hour. This 220
removed the excess solution phase sodium (unadsorbed) inside the resin. In the third step, a final rinse 221
with distilled water was carried out at the experimental flow rate to achieve the same initial condition 222
prior to the fluidised bed experiments. This process was conducted for about 20 minutes. 223
224
2.8. Field trial at Hanoi, Vietnam 225
A full-scale household filter cartridge was designed and used in an experiment with real contaminated 226
groundwater at Hoang Mai district, Ha Noi, Vietnam for the removal of ammonium. Before using the 227
household filter cartridge, the real groundwater was pretreated by a traditional sand filter tank to partly 228
eliminate arsenic, iron and ammonium. The effectiveness of sand filtration in the pre-treatment of 229

10
contaminants in raw groundwater has been confirmed by various studies (Sabogal-Paz et al., 2020; 230
Nitzsche et al., 2015). The concentrations of contaminants in groundwater before and after the 231
pretreatment with the sand filter are shown in Table 1. Although the sand filter removed a high percentage 232
of all the contaminants, the ammonium concentration in the treated water was still above the maximum 233
permitted concentration limit of Vietnam (3 mg/L). Therefore, the pretreated water required further 234
treatment and the resin was used to investigate this. 235
236
Table 1 - Contaminants in raw groundwater and after sand filtration 237
Contaminant Raw groundwater After sand filter
As (µg/L) 78.8 1.4
Fe (mg/L) 23 <0.05
NH4+ (mg/L) 25.73 5.92
Permanganate (mg/L) 1.72 1.29
238
The household filter cartridge used in this trial was fabricated from a PAC water pipe. It had an 239
internal diameter of 10 cm containing 4 kg of Purolite C100E resin (corresponding to a bed height of 240
about 80 cm). The pretreated groundwater was pumped downward through the cartridge at a constant 241
flow rate of 15 L/h (corresponding to a filtration velocity of 1.9 m/h). Water samples were collected after 242
every 12 h for one week and analysed for ammonium, zinc, manganese, iron, calcium, magnesium, and 243
sodium using an ICP-MS instrument (Model ELAN 9000, PerkinElmer, Inc., Shelton, USA). 244
245
246

11
3. Results and discussion 247
3.1. Batch studies 248
3.1.1. Effect of pH 249
(a) (b)
Fig. 1 - Effect of pH on (a) ammonium removal efficiency and (b) amount of ammonium removed (mg) 250
per g resin (Qe) at three ionic strengths (Experimental conditions: resin dose = 10 g/L; initial NH4+ 251
concentration = 50 mg/L) 252
253
The data on the effect of pH on ammonium removal illustrated that the maximum removal efficiency 254
occurred between pH 3 and 8 for all three ionic strength solutions (Fig. 1). When the pH was less than 3, 255
the adsorption capacity was lower (< 4 mg/g), which is explained by the competition between H+ in the 256
highly acidic condition of the solution with NH4+ ions for exchange (Vu et al., 2017). 257
The decline in ammonium removal efficiency was also observed when the pH was higher than 8. This 258
is because at higher levels of pH, NH4+ ions are converted to an un-ionised form (NH3) from having a 259
reaction with the large amounts of OH- ions generated (Aral et al., 1999). The higher levels of pH 260
produced in this experiment were due to additions of NaOH for increasing the pH of the solution. The Na 261
added here would have competed with ammonium for cation exchange on the resin during these higher 262

12
levels of pH resulting in reduced ammonium removal. However, the reduction in ammonium removal 263
occurred even in solutions having 0.01 M NaCl where the Na concentration was nearly the same for any 264
level of pH. This shows that Na competition with ammonium for exchange on the resin is not the major 265
cause for the decline in ammonium removal at higher levels of pH, but ammonium conversion to ammonia 266
is the main reason for this. Based on these results, the initial pH value of the subsequent experiments was 267
maintained at 6.5 to obtain larger amounts of ammonium being removed. 268
Compared with the distilled water solution containing NH4+ (no addition of NaCl), the ammonium 269
removal efficiency and the equilibrium exchange capacity (Qe) in the solution with 0.01M NaCl 270
diminished considerably (Fig. 1). This is due to Na+ ions in the latter solution competing with NH4+ ions 271
for ion exchange in the resin (Aral et al., 1999). This competition is much less marked in the 0.001 M 272
NaCl solution due to the smaller concentration of Na+ in this solution. 273
274
3.1.2. Effect of contact time and kinetics of exchange 275
276
Fig. 2 - Pseudo-first order and Pseudo-second order model prediction of the kinetics of ammonium 277
removal by the resin (Experimental conditions: resin dose = 10 g/L; NH4+ initial concentration = 50 mg/L) 278

13
Fig. 2 shows that the rate of increase of Qt with time in the first 20 min was very high and subsequently 279
it reduced, and the exchange process reached equilibrium after 45 min. Sica et al. (2014) also reported a 280
short time for the exchange of ammonium on Purolite C150H resin to reach equilibrium (40 min). Three 281
common kinetic models were applied to describe the kinetics of ammonium removal by Purolite C100-E 282
resin from the solution, namely, Elovich (Li et al., 2009), Pseudo-first order (Tseng et al., 2009), and 283
Pseudo-second order (Kumar and Sivanesan, 2006). To determine the model that best fitted the data, non-284
linear regression analysis was applied. Table 2 presents the non-linearised equations of the three kinetic 285
models, their parameters and coefficient of determinations (R2) for the data best fitting to the models. 286
Table 2 - Kinetic models applied and parameters and coefficient of determinations (R2) obtained from the 287
model fits to the data 288
Model Non-linearised equation
R2 Parameters Equation description
Pseudo-first order
𝑞𝑡 = 𝑞𝑒 ⋅ (1 − ⅇ−𝑘1𝑡) 0.9983 qe = 4.08 k1 = 0.1299
t is the contact time (min); qt is the amount of ammonia ion removed per g of resin at time t (mg/g); qe is the qt value at equilibrium (mg/g); k1 is the rate constant of pseudo-first order expression (min-1)
Pseudo-second order
𝑞𝑡 = 𝑘2𝑞𝑒2𝑡1 + 𝑘2𝑞𝑒𝑡
0.9866 qe = 4.33 k2 = 0.04907
k2 is the rate constant of pseudo-second order expression (g/mg min)
Elovich 𝑞𝑡 = 1𝛽 𝑙𝑛(1 + 𝛼𝛽𝑡) 0.9249 α = 24.01
β = 2.08 α is the initial adsorption rate (mg/g min); β is the desorption constant (g/mg)
289
As can be seen from Table 2, both Pseudo-first order and Pseudo-second order models had higher R2 290
values (0.9983 and 0.9866, respectively) compared to the Elovich model (R2 = 0.9249). It means that these 291
models can describe the kinetics of ammonium exchange. The comparison between experimental data and 292

14
the data predicted from the two models is presented in Fig. 2. Khalil et al. (2018) have reported that both 293
models can be applied to describe ammonium exchange in Dowex HCR-S resin. 294
295
3.1.3. Effect of resin dose and equilibrium exchange isotherms 296
297
Fig. 3 - Effect of resin dose on the removal efficiency of ammonium and amount exchanged (Qe) 298
(Experimental conditions: resin doses: 02 - 20 g/L; NH4+ initial concentration: 50 mg/L; 24 h shaking) 299
300
As can be seen from Fig. 3, the removal efficiency of ammonium increased drastically when the resin 301
dose rose, and beyond the resin dose of 10 g/L, the removal efficiency became almost constant at about 302
90%. The reason for the removal efficiency reaching a maximum of 90% and remaining almost constant is 303
that nearly all ammonium in solution was removed by the resin. Based on this result a dose of 10 mg/L 304
was chosen as the optimum resin dose for the subsequent experiments. 305
Two common isotherm models (Langmuir and Freundlich) were implemented to evaluate the 306
equilibrium ammonium adsorption properties of the resin. The mathematical equation of Langmuir 307
isotherm (Langmuir, 1918) is given below (Equation 6): 308 𝑄𝑒 = 𝐾𝑏𝐶𝑒1+𝐾𝐶𝑒 (6) 309

15
where Qe is the mass of ammonium exchanged onto solid phase per unit mass of resin at equilibrium 310
(mg/g); K (L/mg) and b (mg/g) are Langmuir constants; and Ce is equilibrium concentration of ammonium 311
in solution (mg/L). 312
The Freundlich isotherm equation (Freundlich, 1906) is presented below (Equation 7): 313
Qe = KfCe1/n (7) 314
where Qe is the mass of ammonium exchanged onto solid phase per unit mass of resin at equilibrium 315
(mg/g); Ce is the equilibrium concentration of ammonium in solution (mg/L); Kf is Freundlich capacity 316
factor ((mg/g) (L/mg)1/n); and 1/n is Freundlich intensity parameter. 317
Fig. 4 shows the prediction curves for the adsorption when Langmuir and Freundlich isotherm models 318
were fitted to data compared to actual experimental data. As can be seen from Table 3, both models fitted 319
to the data very well with Freundlich isotherm model providing a slightly better fit (R2 = 0.9936) 320
compared to Langmuir isotherm model (R2 = 0.9752). The maximum adsorption capacity (Qmax) of the 321
resin calculated from the coefficient b in Langmuir equation is 18.37 mg/g. This value is lower than the 322
values reported by others for Amberlite IR120 H resin (29.76 mg/g) (Ding and Sartaj, 2016) and for 323
Purolite MN500 (approximately 26 mg/g) and Dowex 50w-x8 (approximately 35 mg/g) (Jorgensen and 324
Weatherley, 2003). This outcome is also slightly lower than those reported for few other materials (Table 325
4). The higher values obtained by others emerge mostly because they used much higher solution 326
concentrations of ammonium in their experiments (up to 3000 mg NH4+/L) which are not relevant to field 327
conditions (Table 4) compared to the concentrations used in the current experiment on Purolite C100E (10 328
to 200 mg NH4+/L). In addition, the equilibrium time of Purolite MN500 and Dowex 50w-x8 (Jorgensen 329
and Weatherley, 2003) was much higher (4 days) compared to the Purolite C100E resin in the current 330
experiments (only 45 min). Using higher solution concentrations would give higher Langmuir maximum 331
exchange capacity. This has been proved in the second adsorption experiment conducted where the initial 332
ammonium concentrations were increased to a range of 50 to 2000 mg/L and this increased the Langmuir 333
maximum exchange capacity of Purolite C100E to 40.16 mg/g. This value is higher than that of Amberlite 334

16
IR120 H resin (29.76 mg/g) (Ding and Sartaj, 2016) and Dowex 50w-x8 (35 mg/g) (Jorgensen and 335
Weatherley, 2003) under the same test conditions (at high initial ammonium concentrations). 336
The favourable nature of ammonium adsorption on Purolite C100E was investigated from the K value 337
of the Langmuir isotherm model (Table 3) using a dimensionless constant RL according to the following 338
equation: 339 𝑅𝐿 = 11+(1+𝐾.𝐶𝑜) (8) 340
where Co is the maximum initial ammonium concentration. The calculated RL value of 0.05 lies 341
between 0 and 1, indicating that the adsorption process is favourable (unfavourable (RL > 1), favourable (0 342
< RL < 1) or irreversible (RL = 0) (Demir et al., 2008; Rusmin et al., 2015). The value of the Freundlich 343
intensity parameter 1/n (0.4433, Table 3) also lies between 0 and 1, indicating again a favourable 344
adsorption process (Nguyen et al., 2020). It is consistent with the conclusion derived from the Langmuir 345
model. 346
347
Fig. 4 - Equilibrium data for ammonium removal using the resin fitted to the Langmuir and Freundlich 348
isotherms 349
350

17
Table 3 - Parameters of Langmuir and Freundlich isotherms and coefficient of determination (R2) for 351
model fits 352
Parameter values R2
Langmuir parameters
K (L/mg) 0.0883 0.9752
b (mg/g) 18.37
Freundlich parameters
K ( (mg/g) (L/mg)1/n) 2.8567 0.9936
1/n 0.4433
353
Table 4 - Comparison of ammonium adsorption capacities of some natural and synthetic materials (Co is 354
initial ammonium concentration; Qmax is Langmuir maximum adsorption capacity) 355
Material Solution
pH
Co
(mg/L)
Qmax
(mg/g)
Contact
time
Reference
Purolite C100E 6.5 10 – 200 18.37 45 min This study
Purolite C100E 6.5 50 - 2000 40.16 45 min This study
Amberlite IR120 H 6.0 300 - 3000 29.76 30 min Ding and Sartaj (2016)
Purolite MN500 - 0 - 1000 ≈ 35 4 days Jorgensen and Weatherley (2003)
Dowex 50w-x8 - 0 - 1000 ≈ 26 4 days Jorgensen and Weatherley (2003)
Clinoptilolite - 0 - 1000 ≈ 19 4 days Jorgensen and Weatherley (2003)
Modified activated
carbon with HNO3
8.0 – 9.0 685 - 735 19.34 20 min Halim et al. (2013)
Modified zeolite 6.0 – 7.0 50 - 250 22.64 5 hours Wang et al. (2007)
356

18
3.1.4. Effect of co-existing ions 357
358
(a) (b) 359
360
(c) (d) 361
362
(e) 363
Fig. 5 - Ammonium removal efficiency in the presence of potassium, calcium and magnesium ions at 364
initial NH4+ concentrations of (a) 10, (b) 20, (c) 30, (d) 40, and (e) 50 mg/L (resin dose = 10 g/L) 365
366
Fig. 5 shows that the presence of co-existing cations (potassium, calcium and magnesium ions) reduced 367
the percentage of ammonium being removed. The decrease followed the order, K+< Ca2+< Mg2+, which is 368

19
the same order of equivalent concentrations of these cations (4.15 meq Mg/L, 2.5 meq Ca/L and 1.3 meq 369
K/L, respectively), although the same weight concentrations were used (50 mg/L). It is well known that in 370
the ion exchange process the affinity order of exchange between ions depends on their respective ion 371
concentrations expressed as number of equivalents of ions per unit volume of solution and charge on the 372
ion. Higher the charge on the ion the greater the affinity of the resin to the ion. Therefore, another reason 373
for the lowest degree of competition by K+ is the monovalent nature of this cation compared to the other 374
two cations which are divalent. However, ammonium being a monovalent ion, was still significantly 375
adsorbed on the resin in the presence of divalent cations, calcium and magnesium. The likely reason for 376
this is that ammonium has a smaller hydrated ionic radius (0.331 nm) compared to calcium (0.412 nm) 377
and magnesium (0.428 nm) ions (Volkov et al., 1997), which helped ammonium ions to make closer and 378
better contact with the charged sites of the resin. 379
In addition to this, there would have been hydrogen bonding between the hydrogen atoms in 380
ammonium and oxygen atoms in the resin helping this stronger adsorption. It can be seen that at low 381
concentrations of ammonium, the influence of each competing ion on ammonium removal is minimal 382
because the ion exchange capacity of the material (approximately 20 meq/L solution based on the 383
manufacturer’s value of 1.9 eq/L resin and 10 g resin/L solution used in the experiment) was not fully 384
utilised by the cations (not all Na+ in the resin was exchanged). This means that the material can 385
simultaneously exchange/remove both ammonium and co-ions without much competition between them. 386
As the concentration of ammonium in the solution increased, the presence of competing ions reduced 387
ammonium removal by a slightly higher percentage, due to greater competition for the limited exchange 388
sites. 389
390

20
3.2. Fluidised bed studies 391
3.2.1. Fluidised bed breakthrough curve 392
393
Fig. 6 - Breakthrough curve for ammonium removal by Purolite C100-E resin in the fluidised bed study 394
(Experimental conditions: resin weight: 75 g; influent ammonium concentration: 17.4 mg/L; filtration 395
velocity: 0.5 m/h; horizontal dotted line represents Vietnam’s ammonium concentration permissible limit 396
for drinking water of 3 mg/L) 397
398
Table 5 - Influent and effluent concentrations of other ions in solution 399
Metal ions Zn (mg/L) Mn (mg/L) Fe (mg/L) Ca (mg/L) Mg (mg/L) Na (mg/L)
Influent 0.07 0.022 0.25 20.2 10.8 0.216
Effluent 0.01 0.001 0.08 0.08 0.04 1.23
400
Fig. 6 depicts the breakthrough curve for ammonium removal by Purolite C100-E resin in the fluidised 401
bed study. For the influent ammonium concentration of 17.4 mg/L, the total ammonium exchange during 402
the operation time of 238 h (476 BV) was 786.35 mg which gives a maximum ion exchange capacity 403

21
(Qmax) of 10.48 mg/g. This value is much higher than the column adsorption capacity of 3.3 mg/g reported 404
for a zeolite (clinoptilolite) packed in column with a height 20 cm for the removal of ammonium from a 405
wastewater containing an ammonium concentration of 20 mg/L at a similar flow velocity (0.69 L/h) 406
(Hedström and Amofah, 2008). 407
The maximum ammonium exchange capacity value in the fluidised bed study is lower than the batch 408
Langmuir maximum capacity value for ammonium (Qmax = 18.37 mg/g). One reason for this is that the 409
synthetic solution used in the experiment was prepared from tap water, which contained many other metal 410
ions competing with ammonium for exchange on the resin. Table 5 shows the initial and effluent 411
concentrations of some of the co-ions in the synthetic solution. As can be seen from this table, Ca2+ and 412
Mg2+ concentrations decreased significantly after the solution passed through the column containing the 413
resin indicating that they have occupied the exchange sites in place of ammonium. The increase in Na+ in 414
the effluent is due to Na+ ions in the resin exchanging with ammonium and other cations in the solution 415
and entering the solution. 416
Another reason for the poorer ammonium exchange capacity obtained in the fluidised bed study 417
compared to the batch Langmuir maximum capacity value is because: firstly, in the batch experiment, the 418
exchange process reached equilibrium; and secondly, the Langmuir model predicted the maximum 419
exchange capacity at a higher ammonium concentration in solution. These conditions were different in the 420
fluidised bed experiment, where the exchange capacity was measured at lower ammonium concentration, 421
and the exchange process did not reach equilibrium. 422
The fluidised bed ammonium ion exchange data fitted very satisfactorily to the Thomas model (R2 = 423
0.9858). The kTh value obtained from the model fit was 0.1120 (ml/min mg) and the ammonium uptake per 424
g of resin (qo) was 11.71 mg/g. This qo value is approximately the same as that calculated manually from 425
the experimental data (Qmax = 10.48 mg/g). 426
427
428

22
3.2.3. Regeneration of Purolite C100E resin 429
430
Fig. 7 - Breakthrough curves for ammonium regeneration by 10% NaCl solution in the fluidised bed study 431
(bed height = 27 cm, resin weight = 75 g, initial ammonium concentration = 17.4 mg/L, filtration velocity 432
= 0.5 m/h) for three ion exchange – regeneration cycles of Purolite C100E 433
434
Table 6 - Comparison of the performance of original and regenerated Purolite C100E (volume of water 435
treated was calculated as the volume of effluent passed through the column before reaching the Vietnam’s 436
ammonium concentration permissible limit for drinking water, resin weight = 75 g) 437
Total ammonium
exchange (mg)
Exchange capacity Qe
(mg/g)
Volume
treated (L)
Volume treated per kg
material (L/kg)
Original resin 786.35 10.48 47.6 634. 7
After 1st cycle 711.75 9.49 45.4 605.3
After 2nd cycle 684.44 9.12 43.0 573.3
After 3rd cycle 659.90 8.79 41.0 546.7

23
The regenerated resin was tested for three adsorption-regeneration cycles. Results from Table 6 display 438
that the ammonium adsorbed on the resin after each cycle decreased as shown by the shift in the 439
breakthrough curves to lower bed volumes (to the left-hand side) in Fig. 7. Therefore, the maximum 440
exchange capacity for ammonium (Qm) of the resin in the column dropped progressively after each cycle. 441
In the first cycle, the Qm value decreased by 9.4% (from 10.48 to 9.49 mg/g). Nevertheless, the exchange 442
capacity is still higher than many other materials (Hedström and Amofah, 2008), indicating that Purolite 443
C100E resin can potentially eliminate ammonium in solutions having co-ions and is reusable for at least 444
three times, thus reducing the cost of treatment. 445
446
3.3. Field trial with real contaminated water 447
448
Fig. 8 - Breakthrough curve for ammonium removal by Purolite C100-E resin in the household filter 449
(Experimental conditions: resin weight = 4000 g; bed height = 80 cm, filtration velocity = 1.9 m/h) 450
451
Based on the encouraging results of laboratory batch and fluidised bed experiments, a field trial was 452
conducted in a household at Hoang Mai, Ha Noi to treat ammonium in groundwater after the traditional 453

24
sand filter pretreatment (total resin weight of 4,000 g and flow rate of 15 L/h (corresponding to a filtration 454
velocity of 1.9 m/h)). For the initial ammonium concentration of about 6 mg/L resulting from the sand 455
filtration, the total ammonium exchange in the resin was 14,068 mg and the amount exchanged per unit 456
weight of resin (Qmax value) was 3.52 mg/g for 164 h (492 BV) of filter operation (Fig. 8). 457
Compared to the laboratory fluidised bed experiment, the maximum ion exchange capacity value in the 458
household filter operation is about 2.5 times lower (3.52 mg/g compared to 10.48 mg/g). There are two 459
main reasons for this lower value. Firstly, the presence of many other metal ions at higher concentrations 460
in the real groundwater than in the tap water used in the laboratory competed more with ammonium for 461
ion exchange on the resin. Secondly, the field trial set-up was suspected of having a channeling effect 462
which could not be avoided because the inlet water entered the column near the edge of one side at the top 463
of the column, and passed through the resin layer to the bottom before exiting the column. This led to 464
uneven distribution of the solution within the column, so not all solutions contacted the resin for ion 465
exchange to remove ammonium. 466
The household filter treated 492 BV of water (equivalent to 2460 litres of water) before it reached the 467
Vietnamese ammonium concentration limit of 3 mg/L. Assuming that each household needs to use 15 L of 468
treated water on an average per day (based on results of the pre-survey on water use demand of 469
households in Ha Nam province), based on the results obtained, it can be estimated that each operating 470
cycle can provide treated water (from groundwater with medium ammonium contamination of about 6 471
mg/L) for 164 days (2460/15) or more than 5 months. 472
According to a Purolite Engineering Bulletin document (2013), Purolite C100E resin can be 473
regenerated and reused for at least 5 years. With the initial cost for purchasing resin of 10.0 US$ (4 kg 474
(resin weight in household filter) x 2.5 US$/kg) and industrial salt cost for regeneration process of 8.4 475
US$ (12 cycles/5years (5 months use before 1 regeneration) x 2 kg /cycle x 0.35 US$/kg salt), the total 476
cost of operating the household filter cartridge to treat ammonium in groundwater for 5 years is about 18.4 477
US$ (10 + 8.4). During this time, approximately 2460 L of contaminated groundwater which has the 478
initial ammonium concentration of 6 mg/L can be treated before regenerating the material. It means that 479

25
29.5 m3 (2460 L x 12 regenerating cycles x 1 m3/1000 L) of groundwater can be treated to meet the 480
Vietnamese official standard of drinking water quality, and the cost for each treated cubic meter of 481
groundwater is as low as 0.62 US$ (18.4/29.5). 482
483
3.4. Surface analysis 484
485
Fig. 9 - Unreacted Purolite C100E resin particle (Scale; left-hand side figure: x100; Right-hand side 486
figure: x100,000) 487
488
489
Fig. 10 - Reacted Purolite C100E resin particle (Scale; left-hand side figure: x100.000; Right-hand side 490
figure: x150,000) 491
492
26
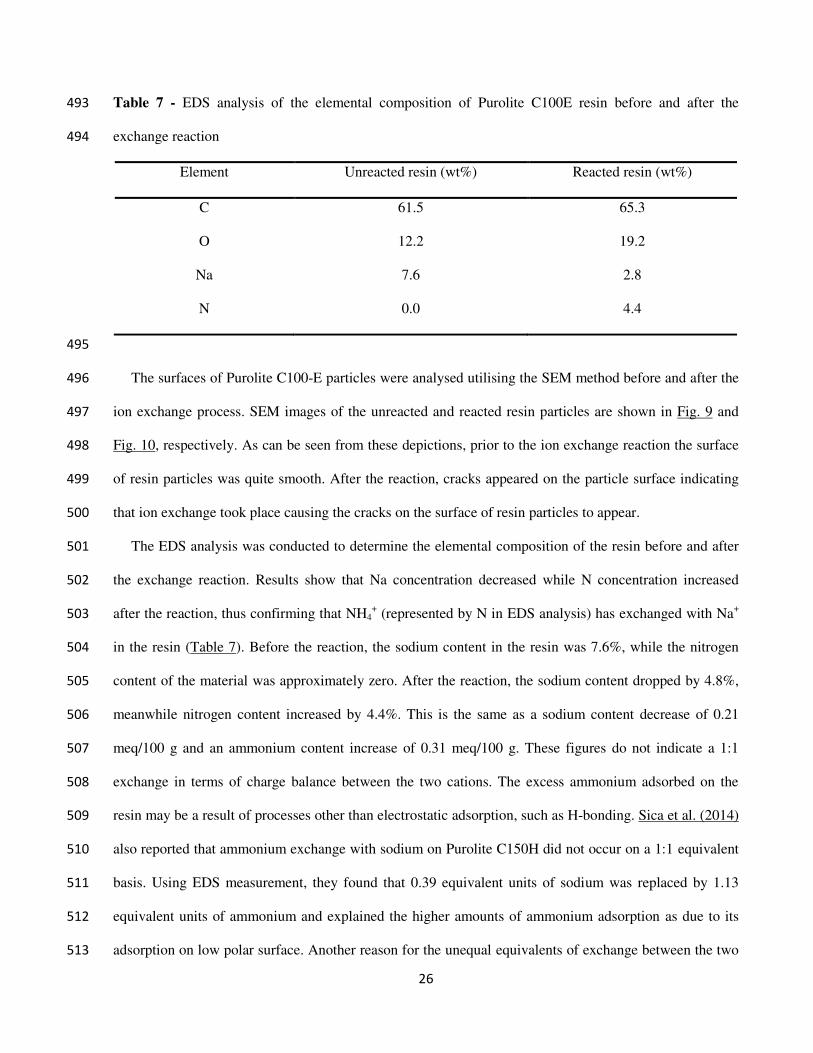
Table 7 - EDS analysis of the elemental composition of Purolite C100E resin before and after the 493
exchange reaction 494
Element Unreacted resin (wt%) Reacted resin (wt%)
C 61.5 65.3
O 12.2 19.2
Na 7.6 2.8
N 0.0 4.4
495
The surfaces of Purolite C100-E particles were analysed utilising the SEM method before and after the 496
ion exchange process. SEM images of the unreacted and reacted resin particles are shown in Fig. 9 and 497
Fig. 10, respectively. As can be seen from these depictions, prior to the ion exchange reaction the surface 498
of resin particles was quite smooth. After the reaction, cracks appeared on the particle surface indicating 499
that ion exchange took place causing the cracks on the surface of resin particles to appear. 500
The EDS analysis was conducted to determine the elemental composition of the resin before and after 501
the exchange reaction. Results show that Na concentration decreased while N concentration increased 502
after the reaction, thus confirming that NH4+ (represented by N in EDS analysis) has exchanged with Na+ 503
in the resin (Table 7). Before the reaction, the sodium content in the resin was 7.6%, while the nitrogen 504
content of the material was approximately zero. After the reaction, the sodium content dropped by 4.8%, 505
meanwhile nitrogen content increased by 4.4%. This is the same as a sodium content decrease of 0.21 506
meq/100 g and an ammonium content increase of 0.31 meq/100 g. These figures do not indicate a 1:1 507
exchange in terms of charge balance between the two cations. The excess ammonium adsorbed on the 508
resin may be a result of processes other than electrostatic adsorption, such as H-bonding. Sica et al. (2014) 509
also reported that ammonium exchange with sodium on Purolite C150H did not occur on a 1:1 equivalent 510
basis. Using EDS measurement, they found that 0.39 equivalent units of sodium was replaced by 1.13 511
equivalent units of ammonium and explained the higher amounts of ammonium adsorption as due to its 512
adsorption on low polar surface. Another reason for the unequal equivalents of exchange between the two 513

27
cations could be because EDS - which measures the concentrations only on surface layers of a few 514
micrometers of adsorbent - is not entirely reliable in providing accurate concentrations of the adsorbed 515
ammonium and sodium (Kalaruban et al., 2016). 516
517
4. Conclusions 518
This study shows that the cation exchange resin Purolite C100E can remove ammonium from 519
contaminated water effectively applying a wide pH range from 3 to 8. Most of the ammonium exchanged 520
rapidly on the resin within a contact time of 10 min, and the exchange process reached equilibrium at 521
around 45 min. Both Pseudo-first order and Pseudo-second order model can be applied to describe the 522
kinetics of the exchange process. Equilibrium exchange data fitted to both Langmuir and Freundlich 523
isotherm models. The Langmuir maximum exchange capacity calculated based on data from an 524
experiment using low ammonium concentrations in solution (typical of most contaminated groundwaters) 525
was 18.37 mg/L. However, when high initial concentrations were used this capacity increased to 40.16 526
mg/L which is higher than most of the values reported in literature for many synthetic and natural resins. 527
On a weight basis, magnesium ion in the solution reduced ammonium exchange the most among the co-528
ions tested, followed by calcium and potassium. 529
The results from fluidised bed studies using synthetic water reveal that Purolite C100E resin has good 530
potential to treat several bed volumes of contaminated water by maintaining the effluent ammonium 531
concentration below the Vietnam drinking water standard. The breakthrough data was satisfactorily 532
described by the Thomas model. The used fluidised bed can be regenerated using NaCl leaching at least 533
three times and reused without losing much of the exchange capacity for ammonium, thus the operating 534
cost can be reduced significantly. In a household field trial test lasting one week, the resin could reduce 535
the ammonium concentration in groundwater after sand filtration pretreatment continuously to below the 536
Vietnam permissible concentration. A cost analysis on the use of Purolite C100E resin for the treatment of 537
a typical contaminated groundwater (6 mg/L of ammonium) demonstrated that the cost for treating each 538
cubic meter of groundwater can be as low as 0.62 US$. 539

28
Acknowledgment 540
This study was financially supported by the Aus4Innovation program – a development cooperation 541
initiative funded by the Australian Department of Foreign Affairs and Trade and InnovationXchange. It is 542
managed by the Commonwealth Scientific and Industrial Research Organization, in partnership with the 543
Ministry of Science and Technology of Vietnam. 544
545
References 546
Aksu, Z., Gönen, F., 2004. Biosorption of phenol by immobilized activated sludge in a continuous packed 547
bed: Prediction of breakthrough curves. Process Biochem. 39, 599–613. 548
Aliewi, A., Al-Khatib, I.A., 2015. Hazard and risk assessment of pollution on the groundwater resources 549
and residents’ health of Salfit District, Palestine. J. Hydrol. Reg. Stud. 4, 472–486. 550
Alshameri, A., Ibrahim, A., Assabri, A.M., Lei, X., Wang, H., Yan, C., 2014. The investigation into the 551
ammonium removal performance of Yemeni natural zeolite: Modification, ion exchange mechanism, 552
and thermodynamics. Powder Technol. 258, 20–31. 553
Aral, N., Günay, A., Sevimoǧlu, O., Çali, M., Debik, E., 1999. Ammonia removal from aqueous solution 554
by ion exchange using natural zeolite. Fresenius Environ. Bull. 8, 344–349. 555
Demir, S., Top, H., Balkose, A., Ülkü, D., 2008. Dye adsorption behavior of Luffa cylindrica fibers. J. 556
Hazard. Mater. 153, 389–394. 557
Ding, Y., Sartaj, M., 2016. Optimization of ammonia removal by ion-exchange resin using response 558
surface methodology. Int. J. Environ. Sci. Technol. 13, 985–994. 559
Freundlich, H.M., 1906. Over the Adsorption in Solution. J. Phy. Chem. 57, 385–470. 560
Halim, A.A., Latif, M.T., Ithnin, A., 2013. Ammonia removal from aqueous solution using organic acid 561
modified activated carbon. World Appl. Sci. J. 24, 1–6. 562
Hedström, A., Amofah, L.R., 2008. Adsorption and desorption of ammonium by clinoptilolite adsorbent 563
in municipal wastewater treatment systems. J. Environ. Eng. Sci. 7, 53–61. 564

29
Huang, Y., Du, Y., Ma, T., Deng, Y., Tao, Y., Xu, Y., Leng, Z., 2021. Dissolved organic matter 565
characterization in high and low ammonium groundwater of Dongting Plain, central China. Ecotoxicol. 566
Environ. Saf. 208, 111779. 567
Jorgensen, T.C., Weatherley, L.R., 2003. Ammonia removal from wastewater by ion exchange in the 568
presence of organic contaminants. Water Res. 37, 1723–1728. 569
Kalaruban, M., Loganathan, P., Shim, W.G., Kandasamy, J., Naidu, G., Nguyen, T.V., Vigneswaran, S., 570
2016. Removing nitrate from water using iron-modified Dowex 21K XLT ion exchange resin: Batch 571
and fluidised-bed adsorption studies. Sep. Purif. Technol. 158, 62–70. 572
Khalil, A., Sergeevich, N., Borisova, V., 2018. Removal of ammonium from fish farms by biochar 573
obtained from rice straw: Isotherm and kinetic studies for ammonium adsorption. Adsorpt. Sci. 574
Technol. 36, 1294–1309. 575
Kumar, K.V., Sivanesan, S., 2006. Selection of optimum sorption kinetics: Comparison of linear and non-576
linear method. J. Hazard. Mater. 134, 277–279. 577
Langmuir, I., 1918. The adsorption of gases on plane surfaces of glass, mica and platinum. J. Am. Chem. 578
Soc. 40, 1361-1403. 579
Li, K., Zheng, Z., Huang, X., Zhao, G., Feng, J., Zhang, J., 2009. Equilibrium, kinetic and thermodynamic 580
studies on the adsorption of 2-nitroaniline onto activated carbon prepared from cotton stalk fibre. J. 581
Hazard. Mater. 166, 213–220. 582
Nguyen, T.T.Q., Loganathan, P., Nguyen, T.V., Vigneswaran, S., Ngo, H.H., 2020. Iron and zirconium 583
modified luffa fibre as an effective bioadsorbent to remove arsenic from drinking water. Chemosphere. 584
258, 127370. 585
Nguyen, V.A., Bang, S., Viet, P.H., Kim, K.W., 2009. Contamination of groundwater and risk assessment 586
for arsenic exposure in Ha Nam province. Vietnam, Environ. Int. 35, 466–472. 587
Nitzsche, K.S., Lan, V.M., Trang, P.T.K., Viet, P.H., Berg, M., Voegelin, A., Friedrich, B.P., Zahoransky, 588
J., Muller, S.K., Byrne, J.M., Schroder, C., Behrens, S., Kappler, A., 2015. Arsenic removal from 589

30
drinking water by a household sand filter in Vietnam - Effect of filter usage practices on arsenic 590
removal efficiency and microbiological water quality. Sci. Total Environ. 502, 526–536. 591
Nur, T., Johir, M.A.H., Loganathan, P., Nguyen, T., Vigneswaran, S., Kandasamy, J., 2014. Phosphate 592
removal from water using an iron oxide impregnated strong base anion exchange resin. J. Ind. Eng. 593
Chem. 20, 1301–1307. 594
Purolite Co., 2013. Purolite Engineering Bulletin. (accessed in August 2021) 595
https://www.purolite.com/dam/jcr:c3ab3898-f067-474c-9e45-03c53324ec6d/C100 Sodium Cycle.pdf. 596
Rusmin, R., Sarkar, B., Liu, Y., Mcclure, S., Naidu, R., 2015. Applied Surface Science Structural 597
evolution of chitosan – palygorskite composites and removal of aqueous lead by composite beads. 598
Appl. Surf. Sci. 353, 363–375. 599
Sabogal-Paz, L.P., Campos, L.C., Bogush, A., Canales, M., 2020. Household slow sand filters in 600
intermittent and continuous flows to treat water containing low mineral ion concentrations and 601
Bisphenol A. Sci. Total Environ. 702, 135078. 602
Shaw, G.D., White, E.S., Gammons, C.H., 2013. Characterizing groundwater-lake interactions and its 603
impact on lake water quality. J. Hydrol. 492, 69–78. 604
Sica, M., Duta, A., Teodosiu, C., Draghici, C., 2014. Thermodynamic and kinetic study on ammonium 605
removal from a synthetic water solution using ion exchange resin. Clean Technol. Environ. Policy. 16, 606
351–359. 607
Tanabe, K., Yokota, H., Hironaka, H., Tsushima, S., Kubota, Y., 2001. Arsenic pollution of groundwater 608
in Bangladesh. Appl. Organomet. Chem. 15, 241–251. 609
Tchobanoglous, G., Stensel, H.D., Tsuchihashi, R., Burton, F., 2014. Metcalf and Eddy | AECOM-610
Wastewater Engineering Treatment and Resource Recovery, fifth ed. McGraw-Hill, New York. 611
Terin, U.C., Sabogal-Paz, L.P., 2019. Microcystis aeruginosa and microcystin-LR removal by household 612
slow sand filters operating in continuous and intermittent flows. Water Res. 150, 29–39. 613
Thomas, H.C., 1944. Heterogeneous ion exchange in a flowing system. J. Am. Chem. Soc. 66, 1664–614
1666. 615

31
Tseng, J.Y., Chang, C.Y., Chang, C.F., Chen, Y.H., Chang, C.C., Ji, D.R., Chiu, C.Y., Chiang, P. C., 616
2009. Kinetics and equilibrium of desorption removal of copper from magnetic polymer adsorbent. J. 617
Hazard. Mater. 171. 370–377. 618
Vietnam Environment Agency, 2016. Vietnam’s National Environment Report 2011 – 2015. Hanoi, 619
Vietnam. 620
Vietnamese Department of Preventive Medicine & Environment, 2009. QCVN 01:2009/BYT: National 621
technical regulation on drinking water quality. Hanoi, Vietnam. 622
Volkov, A.G., Paula, S., Deamer, D.W., 1997. Two mechanisms of permeation of small neutral molecules 623
and hydrated ions across phospholipid bilayers. Bioelectrochem. Bioenerg. 42, 153–160. 624
Vu, T.M., Trinh, V.T., Doan, D.P., Van, H.T., Nguyen, T.V., Vigneswaran, S., Ngo, H.H., 2017. 625
Removing ammonium from water using modified corncob-biochar. Sci. Total Environ. 579, 612–619. 626
Wang, Y.F., Lin, F., Pang, W.Q., 2007. Ammonium exchange in aqueous solution using Chinese natural 627
clinoptilolite and modified zeolite. J. Hazard. Mater. 142, 160–164. 628
Wassie, A.B., Srivastava, V.C., 2016. Teff straw characterization and utilization for chromium removal 629
from wastewater: Kinetics, isotherm and thermodynamic modelling. J. Environ. Chem. Eng. 4, 1117–630
1125. 631

32
Declarations 632
633
1. Ethics approval and consent to participate: 634
Not applicable 635
2. Consent for publication: 636
Not applicable 637
3. Availability of data and materials: 638
The datasets used and analysed during the current study are available from the corresponding author 639
on reasonable request. 640
4. Competing interests: 641
The authors declare that they have no competing interests 642
5. Funding: 643
This study was financially supported by the Aus4Innovation program – a development cooperation 644
initiative funded by the Australian Department of Foreign Affairs and Trade and InnovationXchange. 645
6. Authors' contributions: 646
i. Conceptualization: Tien Vinh Nguyen 647
ii. Methodology: Paripurnanda Loganathan, Le Minh Tran, Tien Vinh Nguyen 648
iii. Formal analysis and investigation: Dai Quyet Truong 649
iv. Writing - original draft preparation: Dai Quyet Truong 650
v. Writing - review and editing: Paripurnanda Loganathan, Le Minh Tran, Duc Loi Vu, Tien 651
Vinh Nguyen, Saravanamuthu Vigneswaran, Gayathri Naidu 652
vi. Funding acquisition: Tien Vinh Nguyen, Saravanamuthu Vigneswaran 653
vii. Resources: Le Minh Tran, Duc Loi Vu, Tien Vinh Nguyen, Saravanamuthu Vigneswaran 654
viii. Supervision: Le Minh Tran, Tien Vinh Nguyen 655
7. Acknowledgements: 656
This study was financially supported by the Aus4Innovation program – a development cooperation 657
initiative funded by the Australian Department of Foreign Affairs and Trade and InnovationXchange. 658
It is managed by the Commonwealth Scientific and Industrial Research Organization, in partnership 659
with the Ministry of Science and Technology of Vietnam. 660