Embed Size (px)
Citation preview

Removal of user fees at Primary Health Care facilities in Zambia: A study of the effects on utilisation and quality of care
Felix Masiye, Bona Mukosha Chitah, Pascalina Chanda and Felix Simeo
Department of Economics, University of Zambia
With Health Economics Unit, University of Cape Town In the Regional Network for Equity in Health in east and
southern Africa (EQUINET)
EQUINET DISCUSSION PAPER 57
March 2008
With support from IDRC Canada

1
Table of contents
Executive summary........................................................................................................... 2 1. Introduction ................................................................................................................... 4 2. Methodology.................................................................................................................. 6 3. Results .......................................................................................................................... 7
3.1 Changes in aggregate levels of utilisation of health facilities......................................... 7 3.2 Changes in utilisation and district deprivation indices.................................................... 9 3.3 Changes in the quality of health care........................................................................... 10 3.4 Changes in the workloads of health workers ............................................................... 12 3.5 Relationships between the DHMT, health centres and the community ....................... 13
4. Discussion................................................................................................................... 14 5. Conclusions and recommendations ............................................................................ 15 References...................................................................................................................... 17
Cite as: Masiye F, Chitah BM, Chanda P and Simeo F (2008) ‘Removal of user fees at Primary Health Care facilities in Zambia: A study of the effects on utilisation and quality of care,’ EQUINET Discussion Paper Series 57. EQUINET, UCT HEU: Harare.

2
Executive summary Policy makers in the health sector face a continuous search for optimal methods of financing and funding national health services. In public finance and health care in particular, optimal is often defined in terms of some idea of equity and efficiency. In resource-constrained settings such as Zambia, these challenges take priority status and so policy makers place greater emphasis on questions of how to mobilise additional resources for financing growing health care need. It is in this context that user fees or cost sharing in general has been used as part of revenue mobilisation strategies in Zambia since 1993. In health policy, explicit associations (even direct inferences) are often drawn between how much revenue is raised and how that revenue is raised, and population health outcomes. This is the reason for including explicit equity goals in financing policy. Alongside the revenue objectives, the Zambian financing policy of 1998 made sure that various sections of the population were to be protected from paying user fees through a range of exemptions. As part of the fair financing theme work of the Regional Network for Equity in Health in East and Southern Africa (EQUINET), in conjunction with the Health Economics Unit at the University of Cape Town, this study aimed to assess the impact of the removal of user fees at primary health care level in rural areas of Zambia. In 1993, Zambia introduced user fees for health care in public facilities at all levels. Coming together with the macroeconomic reforms of the 1990s (so-called 'structural adjustment programmes'), the common theme was the removal of public subsidies and withdrawal of direct government provision of many social services including health care. However, the rallying cry for user fees was the promotion of community participation, empowerment and responsibility. All this was to be accomplished under a decentralised health system in which a ‘paying community’ would exercise accountability for how health care was planned and delivered. Following fifteen years of implementing user fees, great concerns have been raised about the role of user fees in a health setting in which widespread poverty and dismal key health indicators are pervasive. Over time, several evaluations of user fees have reported both negative and positive effects. These gains and losses of policy are weighed differently by different stakeholder. However, the political and policy climate seems to favour a more direct policy to protect the rural poor at the very least. Against this background, user fees were abolished, effective from 1 April 2006. Abolishing user fees was a major policy issue in the health sector in which proponents for and against user fees had rallied in debate in the period leading up to the acceptance of the policy measure. What needed to be done was to begin to evaluate emerging evidence relating to the changes as a consequence of scrapping user fees. This had to be undertaken as debate still continued on whether the removal of user fees, which initially was restricted to only rural districts, should be extended to urban districts as well. This study is a first attempt at gathering evidence on the effects of effects of user fee removal on aspects of utilisation and quality of services. As the issue is still very topical in many African countries, the evidence and lessons emerging from the experiences of Zambia should help shape a workable and equitable future financing policy framework for other poor countries. The study was based on data collected from a sample of 23 districts in Zambia. Data collection was undertaken with the assistance of the data management officers in the District Health

3
Management Teams. Quarterly data was collected for the period 1 April 2006 to 30 March 2007. The data included total utilisation (including for specific diseases/conditions such as malaria), attendance levels at health centre outpatient and inpatient maternal and child health facilities, levels of respiratory infections (pneumonia and non-pneumonia), skin infections, diarrhoea and supervised deliveries, and the availability of drugs (based on percentage stock-outs of essential drugs on the essential drug list). Utilisation data is categorised by age (under-five years of age and over five years) and according to rural or urban districts. We found a substantial increase in total utilisation of public health services and an increase in drug consumption. Utilisation of public health facilities was estimated to have increased by about 50% among the rural population over five years old. Further, we show that districts with a greater proportion of poor people recorded greater increases in utilisation of their facilities. Drug consumption in rural districts was estimated to have increased by about 40%. Staff workloads (calculated as the staff-to-patient ratio per day) in rural districts also showed a slight increase after user fees were removed. Based on patients' perceptions, we report no evidence of deterioration in the quality of care since user fees were removed. However, inadequate numbers of skilled health workers presents a major human resources threat to improving access by all. It is not surprising therefore the staff have been rather pessimistic about the current status of the policy measure. We conclude that, with sustained budget support from government to the DHMTs, the health system can continue to achieve its desired outcomes without relying on user fees. A major limitation we experienced was a lack of data at household level that would allow an analysis of the socio-economic impact of the policy to abolish user fees. Research in this area still needs to be undertaken.

4
1. Introduction Striving for equity in health care financing is a policy goal that is explicitly enshrined in Zambia's health-care financing policy. The health financing reforms initiated in 1993 introduced out-pocket charges for users of health services at all public facilities (Ministry of Health, 1993). Previously, health services were free at the point of use. These charges, referred to as user fees, were advocated as an additional source of revenue for a health sector that was undergoing severe economic difficulties. Thus, patients were required to contribute directly to the cost of providing health care. However, the Zambian government later recognised the need to scrap user fees because they posed a financial burden to poor households and to help the country reach its overarching goal of providing “cost-effective health care as close to the family as possible” (Ministry of Health, 1998). The draft financing policy of 1998 and the National Strategic Plans of 1995-1999 and 2001-2005 recognised the widespread poverty and income differentials that exist within the Zambian society (Ministry of Health, 1998; Ministry of Health, 1995; Ministry of Health, 2001). In the National Strategic Plan of 2001-2005, the government articulated a national health care exemption policy to address equity and public health concerns related to access to health care. Local providers were also allowed to set user fees in line with locally defined affordability criteria. All fee structures were to be approved by the Minister of Health. However, ensuring equity in financing is more challenging in a resource-constrained health system like Zambia's, which relies heavily on private revenues such as user fees to finance services. For example, per capita total health spending in Zambia has averaged only US$26, while per capita public health care spending is about US$12 (Ministry of Health, 2005). Public spending on health care in Zambia accounts for only 33% of the total health sector resource envelope (Ministry of Health, 2005). With such low levels of expenditure in the face of escalating national health needs, local user fees have become an important source of financing, but achieving equity with regard to access to services remains a challenge (Gottret and Scieber, 2006; Bennett and Gilson, 2001; Hsia and Liu, 1999). Between 1993 and 2005, evidence shows that little success was achieved with regard to improving access to health services by all. Many studies show reluctance among providers (the District Health Management Teams) to sacrifice revenue generation for exemptions, while indicators of access were showing significant problems with access to health care. For example, evidence from the Zambia Demographic and Health Survey (DHS 2001/2002), gathered through a nationally representative household survey, indicated that 22% of urban and 30% of rural patients were turned away from health facilities because they could not pay for services upfront. Other studies based on household surveys (Diop et al, 1998; Hjortsberg, 2003) offer further evidence that a significant proportion of the poor population cannot seek care at public health facilities when they fall sick, partly on account of their inability to pay user fees. On January 15, 2006, the president of Zambia announced that user fees for primary health care were to be abolished in all rural areas, with effect from April 1, 2006. Fifty-six of the 72 districts in Zambia are classified as rural, although this official classification can sometimes become unclear as several districts do contain both urban and rural sections. Following this presidential announcement, the Ministry of Health worked out the revenue loss to be anticipated from this policy, for purposes of compensating each rural district for their loss. The United Kingdom Department for International Development provided the funding for this compensation. It was expected that this mechanism would not be necessary for future financial years, as annual planning budgets would take this into account.

5
As part of the fair financing theme work of the Regional Network for Equity in Health in East and Southern Africa (EQUINET), in conjunction with the Health Economics Unit at the University of Cape Town, this study aimed to assess the impact of the removal of user fees at primary health care level in rural areas of Zambia. In accordance with the stated goals of the user-fee abolition policy, these impacts are to be defined in terms of changes in patterns of utilisation, perceptions of quality, public perceptions of public health services, and local operations such as community structures and outreach programs for primary health care. In the Zambian context, removing user fees in rural areas was seen as a potentially effective and pragmatic tool for bridging the socio-economic divide across the country and improving health equity. This is mainly because rural dwellers bear a disproportionate share of poverty. It was also felt that this policy would in turn reduce the national health burden, which also falls more heavily on rural households. Sub-national health profiles show a clear link between poverty and health needs. For example, Western and Luapula provinces, which rank as the poorest, had under-five mortality rates of 201 and 248 respectively, compared with 137 and 134 for wealthier Lusaka and the Copperbelt respectively (CSO, 2002). A useful framework for evaluating the abolition of user fees is to examine existing literature on the subject that describes its impact on health equity: what changes have occurred in terms of levels of utilisation of health facilities, the quality of health care and levels of community participation? In terms of free market economics, removing a price barrier is normally expected to raise the demand for most types of health care. The rationale for abolishing user fees for everyone was that utilisation would increase, particularly among the poorest, who are more sensitive to price increases (Leighton, 1995). There was also a public health motive, which suggests that increasing access to primary health care would lead to appropriate health-care seeking behaviour and reduce the country’s health burden. However, it remains an empirical question as to exactly how the removal of user fees has impacted on utilisation of health services and health equity. Poor households face several other barriers to seeking health care, such as travelling long distance to facilities, poor transportation means, poor quality of care and a general lack of access to information. In order to ascertain the equity impact of user fee removal, it is crucial to establish exactly which sections of the socio-economic spectrum and which types of services show increased levels of utilisation after the scrapping of user fees. In addition, one measure of equity in financing is the prevalence of catastrophic health expenditure. In many cases, catastrophic health expenditure arises when poor patients fail to obtain access to primary health care and delay treatment until an illness deteriorates. A study of catastrophic health expenditure in Uganda found that, while there was no change in the utilisation levels and catastrophic expenditures of the non-poor, utilisation increased substantially for the poor, although catastrophic expenditure remained high (Xu et al, 2005). Finally, the literature suggests that user fee removal must be accompanied by supporting policies, especially on increased public funding and the efficient distribution of drugs and related supplies. These measures are necessary to ensure that quality of care does not suffer. Increased utilisation is of little purpose if the quality of care is very poor. Most health systems in low-income countries already operate on very tight budgets (Gilson and McIntyre, 2005; James et al, 2005; Van der Plaetse et al, 2005). Maintaining quality of care, especially availability of drugs, is central to achieving equity objectives. If quality falls, the poor often have to buy drugs or seek care at private facilities, thereby negating the effects of user fee abolition (Xu et al, 2005).

6
2. Methodology In this study, we examined changes in utilisation of services at public health centres in selected rural and urban districts, before and after the abolition of user fees. The first part of our study involved the collection and analysis of Health Management Information System (HMIS) data on utilisation of services before and after user fee abolition. Utilisation data was compiled for general curative care according to age (below five years and others). The HMIS is a national database that collects various health service data from all public facilities in Zambia. For primary health care facilities, the HMIS contains records on the number of patient visits, numbers of admission patients, number of deliveries and antenatal visits captured at all public facilities in each district. In addition, the HMIS also collects data on drugs and human resources available at each facility. The data used in this study was gathered from all 72 districts in Zambia, constituting 55 (76%) rural districts, while the rest were urban. Our HMIS data spans a period of four-and-a-half years, three years immediately prior to, and one-and-a-half years immediately following, the removal of user fees. We examined the data for trends in utilisation by age and by rural-urban categorisation. In the second part of the study methodology, we assessed the perceptions of the quality of care through a survey of patients. This survey was conducted in two rural districts, Kafue and Kalomo. Kalomo is a district of 190,000 people, which lies about 400 kilometres south of Lusaka, while Kafue has 160,000 people and is situated 60 kilometres to the south of Lusaka. The two districts were sampled on a convenience basis, influenced by cost considerations. Kalomo is a typical poor, remote district, while Kafue is slightly different in that it has a small industrial base and an urban community. Our study sites were all from the rural part of Kafue. Nonetheless, the two districts are not necessarily representative of all rural districts in Zambia. Within each district, we selected four health facilities, giving a total of eight sites. In Kalomo, we selected two health centres that were located at least 15 kilometres from the District Health Management Team (DHMT) office. Selection of facilities was based on simple random sampling using the health facility atlas available at the DHMT. Changes in the quality of health care were assessed between July and October 2007, about 15 months after user fees were abolished (April 2006). Two researchers, assisted by two research assistants, carried out the fieldwork. Based on a review of the literature, we identified and collected data on six key dimensions of health care quality: drug availability, staff attitudes, waiting time, cleanliness of facilities, overall responsiveness to meeting patient needs and the costs of seeking care. Such data provides an indirect way of measuring the quality of care and thereby the capacity of health facilities to treat common outpatient conditions. Most of these dimensions were assessed from the perspective of patient perceptions. Further, we also compare data on perceptions of drug availability with actual data on drug stocks at facilities and the proportion of patients that received their prescribed drugs at the facility. However, many patients in rural areas cannot reliably give an estimate of the time they spent waiting at a facility, so we estimated waiting time directly by tracking selected patients and observing the time it took from registration to exiting the facility. The three field researchers solicited patients from the moment they took their seats, waiting to see the clinician for consultation. Once consent to participate was obtained, the patient was handed a small slip of paper on which the researcher indicated the exact time the patient arrived at the consultation waiting queue. The researchers collected the slips at the dispensary or, if neither medication nor laboratory investigations were ordered, after the consultation. The researcher then recorded the time at the exit, and calculated how long the patient had to wait to receive services at the facility.
7
In the patient exit survey at the eight facilities, we completed a total of 189 interviews. The key interview question was framed in the following way: “Comparing your experience now to the last time you came here (during the time when you used to pay user fees), describe, in your opinion, any changes in terms of the following attributes of health care quality: [here we listed the key dimensions listed at the start of the paragraph above]”. Further, we asked what services they had received during their visit. Finally, at the local level, user fees provide a mechanism that sustains a three-way relationship between the community, health workers at the facility level and planners at the DHMT. We investigated what changes, if any, have happened since the removal of user fees. We also sought to elicit perceptions from health workers about operational aspects of local health services, as well as relationships between health centres, the DHMT and the community. Every health centre has a number of neighbourhood health committees attached to it. The neighbourhood health committees represent communities around the eight health centres visited. Representatives of all the neighbourhood health committees and health workers at facilities were invited to participate in a focus group discussion. In Kafue, we interviewed 14 neighbourhood health committee members and, in Kalomo, we interviewed 16. In this paper, we will explore changes in utilisation and service quality during the first twelve months following the abolition of user fees in Zambia. The specific objectives of the study are to determine how the removal of user fees has impacted on: • levels of utilisation of public health facilities; • utilisation patterns by age (under five and over five years old); • public perceptions of the quality of health services; and • specific functions of the health system, such as drug availability, preventive medicine and
clinical health interventions.
3. Results
3.1 Changes in aggregate levels of utilisation of health facilities According to HMIS data records, the levels of utilisation of rural health facilities are estimated to have increased by 55% over the twelve months following the removal of user fees in 2006 (this excludes children younger than five years old). Table 1 presents data on the changes in levels of utilisation according to age group. The period 2006q2-2007q1 (last row) is the year in which no fees were collected and it is contrasted with the previous two years. (Please note that we are using the abbreviation 'q' to represent a financial quarter.)
Table 1: Levels of utilisation by age group: Rural versus urban facilities, 2004-2007 Urban facilities:
under-5 Urban facilities:
5+ Rural facilities:
under-5 Rural facilities: 5+ Years Total
visits Change
(%) Total visits
Change (%)
Total visits
Change (%)
Total visits
Change (%)
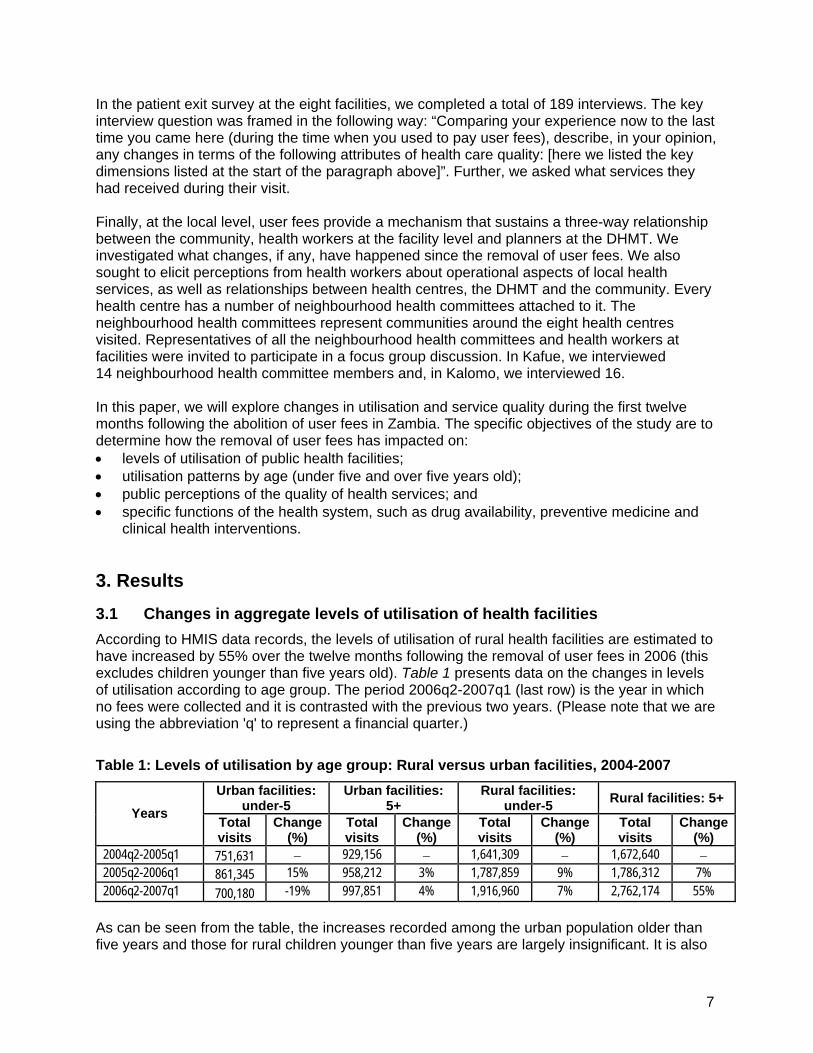
2004q2-2005q1 751,631 − 929,156 − 1,641,309 − 1,672,640 − 2005q2-2006q1 861,345 15% 958,212 3% 1,787,859 9% 1,786,312 7% 2006q2-2007q1 700,180 -19% 997,851 4% 1,916,960 7% 2,762,174 55%
As can be seen from the table, the increases recorded among the urban population older than five years and those for rural children younger than five years are largely insignificant. It is also

8
shown that rural health facilities have recorded an increase in utilisation since user fees were removed. We do not have any explanation why utilisation among children younger than five years old declined by nearly 10% in urban areas. Overall, it seems that the utilisation among patients aged at least five years have dominated the patterns of change in utilisation since user fees were removed. Interestingly, after user fees were removed, utilisation levels among the rural population aged at least five years increased and exceeded the rate for the same group in the urban population. This trend continued into 2007 and is clear evidence that more patients in rural areas are now reporting for treatment at public health facilities. In Figure 1, we show quarterly trends in the utilisation of services at public health facilities. Utilisation among the rural population aged at least five years increased sharply following the removal of user fees. By contrast, within the same rural communities there has been virtually no increase in utilisation among patients under the age of five years. Similarly, trends in utilisation among the urban population over time do not portray a pattern that can be linked with the abolition of user fees (mid-January 2006). Apart from the spike in utilisation between the fourth quarter and first quarter (coinciding with the malaria transmission season), which is also observed in urban areas and in preceding years, the increase in utilisation of services at public health centres among rural population older than five years seems to have remained largely unchanged.
Figure 1: Utilisation by age category and rural-urban location, 2004-2007
400000
600000
800000
1000000
1200000
1400000
1600000
Tota
l vis
its a
t hea
lth c
entre
s
2004
q1
2004
q2
2004
q3
2004
q4
2005
q1
2005
q2
2005
q3
2005
q4
2006
q1
2006
q2
2006
q3
2006
q4
2007
q1
2007
q2
2007
q3
Time (quarters)
Atleast 5 years Rural Atleast 5 years UrbanUnder 5 years Rural Under 5 years Urban
9
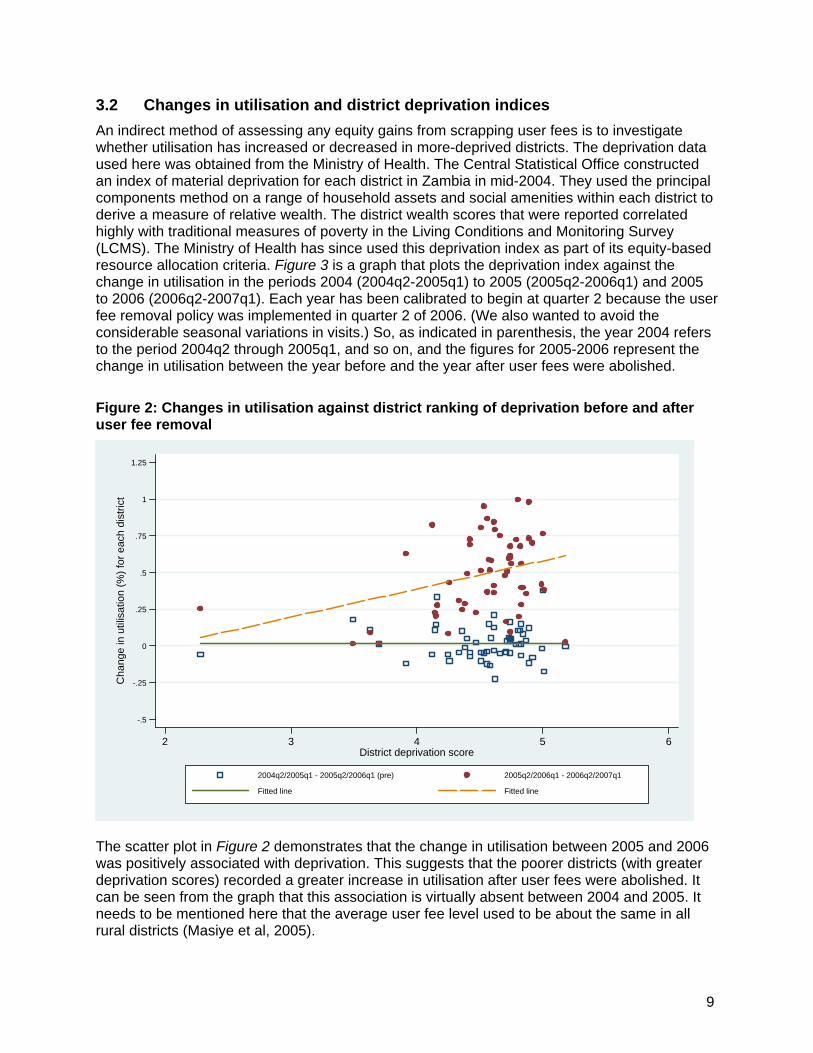
3.2 Changes in utilisation and district deprivation indices An indirect method of assessing any equity gains from scrapping user fees is to investigate whether utilisation has increased or decreased in more-deprived districts. The deprivation data used here was obtained from the Ministry of Health. The Central Statistical Office constructed an index of material deprivation for each district in Zambia in mid-2004. They used the principal components method on a range of household assets and social amenities within each district to derive a measure of relative wealth. The district wealth scores that were reported correlated highly with traditional measures of poverty in the Living Conditions and Monitoring Survey (LCMS). The Ministry of Health has since used this deprivation index as part of its equity-based resource allocation criteria. Figure 3 is a graph that plots the deprivation index against the change in utilisation in the periods 2004 (2004q2-2005q1) to 2005 (2005q2-2006q1) and 2005 to 2006 (2006q2-2007q1). Each year has been calibrated to begin at quarter 2 because the user fee removal policy was implemented in quarter 2 of 2006. (We also wanted to avoid the considerable seasonal variations in visits.) So, as indicated in parenthesis, the year 2004 refers to the period 2004q2 through 2005q1, and so on, and the figures for 2005-2006 represent the change in utilisation between the year before and the year after user fees were abolished.
Figure 2: Changes in utilisation against district ranking of deprivation before and after user fee removal
-.5
-.25
0
.25
.5
.75
1
1.25
Cha
nge
in u
tilis
atio
n (%
) for
eac
h di
stric
t
2 3 4 5 6District deprivation score
2004q2/2005q1 - 2005q2/2006q1 (pre) 2005q2/2006q1 - 2006q2/2007q1
Fitted line Fitted line
The scatter plot in Figure 2 demonstrates that the change in utilisation between 2005 and 2006 was positively associated with deprivation. This suggests that the poorer districts (with greater deprivation scores) recorded a greater increase in utilisation after user fees were abolished. It can be seen from the graph that this association is virtually absent between 2004 and 2005. It needs to be mentioned here that the average user fee level used to be about the same in all rural districts (Masiye et al, 2005).

10
3.3 Changes in the quality of health care 3.3.1 Patients' perceptions of the quality of health care In this section, we will present information that was gathered about the perceptions of patients regarding changes in quality of care. Opinions were elicited from patients who had direct contact with a public health centre prior to the removal of user fees as well as after, so they could describe the changes they had perceived over this period of time. Table 2 summarises the results of the survey with regard to patients' perceptions. Overall, most believed that quality had remained about the same since the policy was put in place. Nearly a third reported that the total cost of seeking care had dropped, with one tenth indicating that the removal of user fees had not reduced their cost of seeking care. None of the respondents reported that they had paid any money to anyone at the facility for any service. These services included registration, consultation, drugs and medical examination. There is little evidence to suggest that either staff courtesy or the quality of the consultation had deteriorated after the removal of fees. As far as waiting times are concerned, most patients in rural areas cannot give an accurate estimate of how much time they spent waiting at a facility, so waiting time was estimated directly by observing a sample of patients (for example, every fourth to sixth person coming in). The field researchers tagged selected patients from the moment they took their seats in the waiting room right up to the point when they got their medication at the dispensary or were referred home or to another facility. A stopwatch was used to estimate how long it took to receive service at the facility. The average time was 48 minutes, with a confidence interval of (35.9, 60.9). This is consistent with the waiting time reported recently of 54 minutes for rural health centres (MoH, 2007). A survey conducted from September to December in 2004 reported an average waiting time of 55 minutes (Masiye et al, 2005). Clearly, there has been no significant change in waiting time. Finally, data does not show any major differences in perceptions of quality between the two districts that were sampled.
Table 2: Patients' perceptions of changes in health care after removal of user fees
Changes in service
levels Reception
(%)
Waiting time at facility
(%)
Quality of consultation
(%)
Availability of
prescribed drugs (%)
Staff courtesy
(%)
Cleanliness of surroundings
(%)
Overall quality
(%)
Overall cost of seeking care (%)
Same 50.3 41.6 38.1 35.2 43.6 36.5 52.6 56.7 Improved significantly
6.0 12.7 9.7 3.6 6.7 4.2 4.6 3.8
Improved slightly
41.3 36.1 51.6 37.0 46.7 52.7 36.4 26.1
Worsened slightly
1.8 5.4 0.0 17.0 2.4 1.8 3.3 5.7
Worsened significantly
0.6
4.2
0.7
7.3
0.6
4.8
3.3
7.6
A worrying finding was that nearly 20% of patients stated that drug availability had worsened. Often, patients are simply given a prescription and told to fill in the prescription elsewhere because not all types of medication are available at the health centre. In Table 3, we show responses to the question, "If you have been prescribed medication, where are you or your patient going to obtain this medication?” About one tenth of patients could not obtain at least some of the prescribed medication at the facility. In comparison, the public expenditure tracking and service delivery survey which was carried out in July 2006 (three
11
months after fees were abolished) across the country also reported that 92% of rural health centre visitors received drugs at the facility (94%, at urban centres) and 88% were satisfied with the quality of care they had received (MoH, 2007). In the same survey, 81% reported that the attending clinician had ordered a medical examination of one form or another (e.g. laboratory text, x-ray etc) in order to diagnose their condition.
Table 3: Sources of prescribed drugs
Source of drugs % of patientsAt this facility 90.9 Buy at private source 7.9 Get for free at another public centre/home 1.2
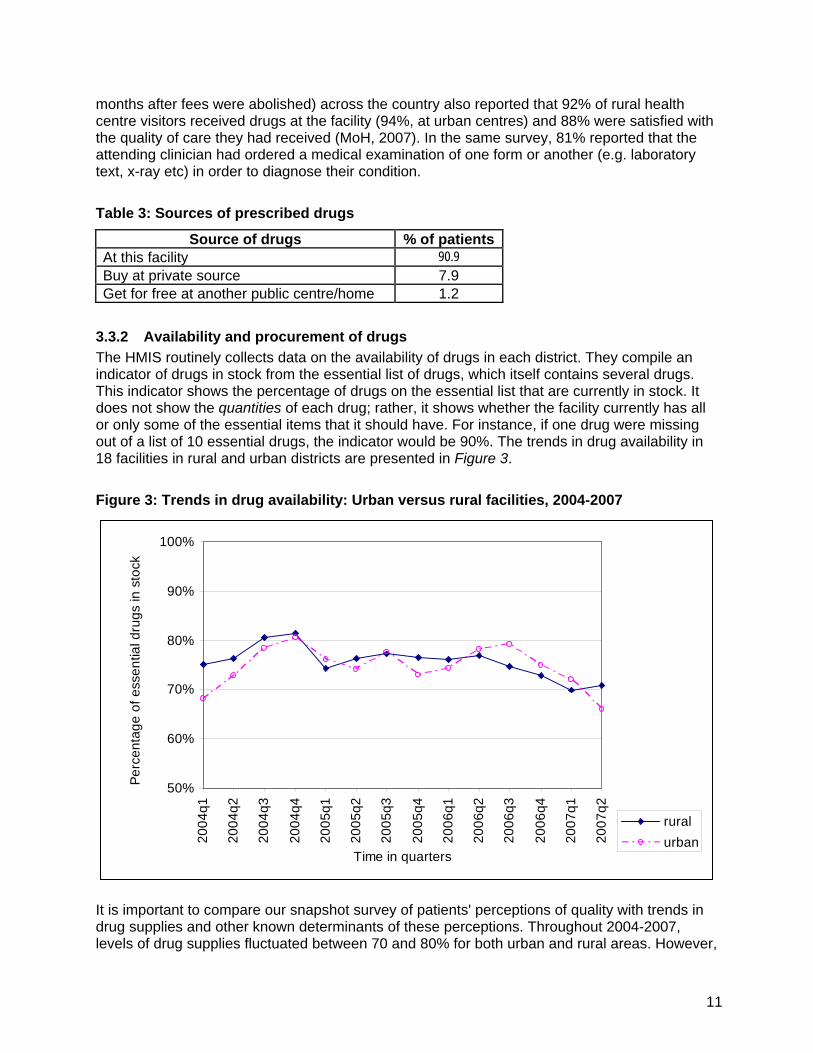
3.3.2 Availability and procurement of drugs The HMIS routinely collects data on the availability of drugs in each district. They compile an indicator of drugs in stock from the essential list of drugs, which itself contains several drugs. This indicator shows the percentage of drugs on the essential list that are currently in stock. It does not show the quantities of each drug; rather, it shows whether the facility currently has all or only some of the essential items that it should have. For instance, if one drug were missing out of a list of 10 essential drugs, the indicator would be 90%. The trends in drug availability in 18 facilities in rural and urban districts are presented in Figure 3.
Figure 3: Trends in drug availability: Urban versus rural facilities, 2004-2007
50%
60%
70%
80%
90%
100%
2004
q1
2004
q2
2004
q3
2004
q4
2005
q1
2005
q2
2005
q3
2005
q4
2006
q1
2006
q2
2006
q3
2006
q4
2007
q1
2007
q2
Time in quarters
Perc
enta
ge o
f ess
entia
l dru
gs in
sto
ck
ruralurban
It is important to compare our snapshot survey of patients' perceptions of quality with trends in drug supplies and other known determinants of these perceptions. Throughout 2004-2007, levels of drug supplies fluctuated between 70 and 80% for both urban and rural areas. However,

12
1520
2530
35
No.
of p
atie
nt c
onta
cts
per s
taff
per d
ay
2004
q1
2004
q2
2004
q3
2004
q4
2005
q1
2005
q2
2005
q3
2005
q4
2006
q1
2006
q2
2006
q3
2006
q4
2007
q1
2007
q2
Time in quarters
Urban health centres Rural health centres
a steady decline since quarter 2 of 2006 can be seen for rural districts, an effect of increased utilisation of drugs. In the months prior to the removal of user fees and in the period immediately following, the national drug inventory was running low, while procurement procedures were lagging behind schedule. This posed a risk of jeopardising the new policy. However, in quarter 4 of 2006 and quarter 2 of 2007, two bulk tenders for drug procurement were approved.
3.4 Changes in the workloads of health workers The HMIS also contains data on the number of visits per health worker at primary health care facilities in each district, which is reported as part of service delivery indicators. The staff workload indicator, defined as the total number of patient visits divided by the total number of staff per day, could be an important, albeit indirect, indicator of quality of care. Many factors could determine staff workload including movements in the numerator, i.e. changes in staffing levels. Nonetheless, the purpose here is to check whether there was any association between the timing of changes in staff workloads and the removal of user fees. When user fees were removed in rural areas, it was anticipated that there would be a dramatic and immediate increase in staff workloads, which might impact adversely on quality and community perceptions of public health facilities and, in turn, negatively affect utilisation. Figure 4 below shows how staff workloads for rural and urban districts in the study sample have changed over time. Staff workloads are significantly higher in rural areas, reflecting a concentration of health human resources in urban areas. As can be seen in Figure 4, there was a spike in the staff workload indicator in rural areas after the removal of user fees, i.e. from quarter 1 to quarter 2 of 2006. This new level was short-lived. Generally, there has been a slight increase in workload since the removal of user fees. In urban areas, the situation seems to have remained largely unchanged.
Figure 4: Changes in staff workload: Rural versus urban, 2004-2007

13
3.5 Relationships between the DHMT, health centres and the community Apart from raising revenue, user fees were intended to foster a partnership between providers and their communities in order to empower the communities and increase the responsiveness of the health system to local needs (MoH, 2001). In line with the policy to remove fees, a range of primary services have been organised around local structures. In rural areas, where modern tools of public communication are lacking, service delivery relies considerably on the labour and resources that community representatives provide. In this case, a three-way alliance exists between the DHMT, health centre managers and community representatives. As stated earlier, user fees kept this partnership working. With the removal of user fees this relationship may be in jeopardy. During the time when user fees were charged, community representatives used to be informed about the revenues collected from their respective health centres. Part of these user fee revenues was used to provide community representatives with a small financial inducement for their work in mobilising the community and disseminating health information, as well as for costs incurred in attending monthly meetings with the district health management team (DHMT). In these regular meetings, the DHMT shared planning and budgeting information with community representatives. Members of neighbourhood health committees (NHCs) in Kalomo and Kafue have noted a decline in the number of consultative meetings between DHMT and NHCs. All the community representatives interviewed claimed that, since user fees have been removed, they are no longer invited to attend meetings at the DHMT with the same frequency as before. If they do get invited, they do not receive the same treatment as before. One of the community representatives lamented that, at a recent meeting, they were kept at the health centre without food or drink because the health centre had no funds to buy refreshments. This situation has engendered a perception of lack of transparency in financial management and caused mistrust between the DHMT and NHCs. Further, although all the DHMTs were provided with additional budgets as compensation for loss of user fee revenue, the community has not been informed about how much funding is allocated to their health centres. Health workers at the facility level and NHCs worry that DHMTs are cutting back on health activities such as outreach and promotion, or refusing to pay allowances for participants in these activities on the grounds that there is no longer any funding. However, as can be seen in Table 4, most districts received more funding after user fees were scrapped than they would have originally got from the user fees. This was because the compensation took into account some increase in utilisation. However, it was also apparent that DHMTs were reluctant to spend these funds, partly because they did not believe that this new, higher level of funding could be sustained.

14
Table 4: Revenues from user fees vs. user fee replacement grants, 2005-2006
District User fee
revenue, 2005 (Kwacha '000)
User fee replacement grant, 2006
(Kwacha '000)
Increase as % of user fee
revenue, 2005
Chadiza 22,667 39,294 73% Chibombo 161,333 218,200 35% Chiengi 18,667 24,085 29% Chongwe 82,667 80,540 -3% Kafue 222,667 306,701 38% Kalomo 121,333 131,485 8% Kapiri Mposhi 124,000 161,638 30% Kasempa 8,267 49,070 494% Katete 73,333 81,533 11% Lufwanyama 13,733 37,830 175% Masaiti 27,200 68,698 153% Mkushi 65,333 119,392 83% Monze 93,333 55,939 -40% Mpika 81,333 62,816 -23% Mpongwe 8,800 26,301 199% Mumbwa 126,667 190,213 50% Mwinilunga 17,333 39,549 128% Nakonde 36,000 33,939 -6% Samfya 24,000 30,523 27% Senanga 62,667 112,017 79% Serenje 69,333 81,809 18% Shang’ombo 18,667 47,091 152% Median (%) 36%
Furthermore, NHCs feel less influential in decision-making as their community do not bring in any revenue. At one of the health centres in Kafue, one of the community representatives expressed an opinion we heard everywhere else: “It is difficult to know the grant to the clinic, unlike in the past when we used to demand that we know the amount collected by the clinic from user fees. User fees were our money.” Finally, like community representatives, health workers at the facilities were also very sceptical about whether the new financing arrangement (i.e. total reliance on public funding) could be sustained. They were concerned that public funding would start to fall short of their needs and quality might suffer. Health workers at the facility used to handle the fee collections from patients. Their main concern is financial because they are no longer responsible for calculating and managing the income of their facilities and their cash flow, and this makes other aspects of management much more difficult, especially planning for future needs.
4. Discussion Since the introduction of user fees in 1993 in Zambia, there has been an intense debate about the role that they have played in promoting health goals. On the one hand, some studies have
15
shown that user fees have proved a barrier to accessing health care among the poorest section of the population. On the other hand, other studies have shown that the revenue from user fees has been used to maintain good quality health care in cases where public financing has been erratic. Although various documents of the Ministry of Health expressed concern about protecting the poor from the negative consequences of user fees, little action was noticeable. When the government announced that user fees were to be abolished in rural areas from 1 April 2006, widespread scepticism was raised, particularly by health providers (DHMTs and health workers), about whether the government could really afford to provide ‘free’ health care to all citizens. In this study, we examined the national data on utilisation at primary health care facilities and patients' perceptions of quality through a survey at facilities in two rural districts. Overall, the study shows a 50% increase in utilisation among the rural population aged at least five years in the year following the removal of user fees in rural areas. This is significantly contrasted with trends in utilisation in urban districts, where virtually no change was observed during the same period. This means that removing user fees has had a beneficial effect of increasing utilisation among rural patients. We stress that this is an increase in public health facility utilisation as opposed to an increase in national health care utilisation or in access to health care. This magnitude of change in utilisation is comparable with estimates from Uganda (Burnham et al, 2004). Further, the most deprived districts recorded the greatest increases in total district-level utilisation. Unfortunately, our analysis could not determine if the target population (i.e. those who were deterred strictly by user fees) was responsible for this increase in utilisation. The observed increase in utilisation could be due to changes in use by the non-poor, such as switching from other providers, increased utilisation for frivolous reasons or the possibility that the non-poor who live far away are now attracted by the reduced overall costs of seeking health care. The relative success of the user fee removal policy, at least in these initial stages, can be attributed to the significant investment that the Zambian government put into the health sector to support the policy. These resources made it feasible to implement the plans, which included the following actions: • Using funds from DFID, the Canadian International Development Agency and the Ministry of
Finance and National Planning, procurement of additional drugs to meet the anticipated increase in utilisation was expedited. Emergency (stop-gap) procurement was facilitated to avoid any stock-outs while the routine drug procurement process was being maintained.
• The Ministry of Health provided compensation to each rural DHMT for the estimated revenue loss from abolishing fees. This compensation included an additional factor for increased utilisation of up to 40%, over and above the projected loss of existing user fee revenue, with a view to maintaining quality. More importantly, DHMTs were empowered to use these funds flexibly. New guidelines allowed DHMTs to devise incentives to attract, retain and motivate health personnel. They could also pay allowances for a range of activities.
• The Ministry of Health recruited about 1,300 new staff (mainly nurses), out of an estimated 1,600 additional staff required to cope with increased utilisation.
5. Conclusions and recommendations A limitation of this analysis arose from its inability to allow us to make any strong inferences about the extent to which increase in utilisation is especially represented by the poorest who previously could not afford user fees. Local health workers believe that a household-based

16
survey is probably the best method for determining this. This, and a host of related questions (e.g. changes in financial burden incidence or catastrophic health expenditure), may be addressed in future research, especially once the 2007 DHS data becomes available later in 2008. In addition, as time passes, future assessments will be able to analyse changes with more confidence as more data becomes available. A larger sample size, which should possibly include urban areas as control sites, would add an important dimension to the quality of any future analysis. We recommend that future studies should employ a larger set of districts and sites. The first twelve months of exclusive public financing of primary health care shows that it can be done. However, it appears that the situation in the first year was characterised by adequate compensation grants disbursed directly to districts. Although human resources are generally in short supply, other inputs for producing health services were available. Our analysis highlights the importance of guaranteed, adequate funding. Accordingly, we make the following recommendations: • To keep up with new levels of utilisation, the Ministry will need to increase its service
delivery capacity. • Systems and procedures for the distribution and procurement of drugs need to be made
more efficient to ensure that they get to health facilities on time. • Staff retention schemes and the re-distribution of human resources could be accelerated to
ensure that the district staff shortages do not deteriorate any further. Equity considerations can be served by the availability and appropriate placement of staff. It is important that staff workloads are maintained at a reasonable level to avoid staff ‘burn out’.
• User fees need to be scrapped in urban areas too, as urban poverty has recently increased significantly in Zambia. However, we recommend proceeding with caution because fee revenues make up a much greater share of total revenue in urban health centres and their DHMTs differ markedly from their rural counterparts. The dynamics might not be congruent.
• Existing monitoring instruments and systems should be strengthened in order to provide detailed data on a system basis about the impacts of user fee policy on levels of utilisation, quality, referral patterns and other factors.

17
References 1. Akash H, Yamada T, Huot E, Koum K and Sugimoto T (2004) ‘User fees at a hospital in Cambodia:
Effects on hospital performance and provider attitudes’, Social Science and Medicine 58(3):553–64.
2. Amone J, Asio S, Cattaneo A, Kweyatulira AK, Macaluso A, Maciocco G, Mukokoma M, Ronfani L and Santini S (2005) ‘User fees in private non-for-profit hospitals in Uganda: A survey and intervention for equity’, International Journal of Equity in Health May (4):6.
3. Arhin-Tenkorang D (2000) Mobilising Resources for Health: The Case for User Fees Revisited. World Health Organisation: Geneva.
4. Asbu EZ (1999) ‘Analysis of the user fee for healthcare policy in Eritrea’, Central African Journal of Medicine 45(4):86–93.
5. Benjamin L, Sapak P and Purai JK (2000) ‘User charges and utilisation of obstetric services in the National Capital District, Papua New Guinea’, Pacific Health Dialogue 8(1):38–43.
6. Bennett S and, Gilson L (2001) Health Financing: Designing and Implementing Pro-poor Policies. The DFID Health Systems Resource Centre: London.
7. Birbeck GL and Munsat T (2002) ‘Neurological services in sub-Saharan Africa: A case study among Zambian primary healthcare workers’, Journal of Neurological Science 200(1–2):75–78.
8. Bossert T, Chitah MB and Bowser D (2003) ‘Decentralisation in Zambia: Resource allocation and district performance’, Health Policy and Planning 18(4):357–369.
9. Burnham GM, Pariyo G, Galimwango E and Wabwire-Mangen F (2004) ‘Discontinuation of cost sharing in Uganda’, Bulletin of the World Health Organisation 82:187–195.
10. Central Statistical Office (2003) Living Conditions Monitoring Survey 2002/3. Central Statistical Office: Lusaka.
11. Central Statistical Office (2002) Zambian Demographic and Health Survey 2001/2. Central Statistical Office: Lusaka.
12. Chisadza E, Maponga CC and Nazerali H (1995) ‘Household health seeking behaviour in Zambia’, Partnerships for Health Reform technical report 20. ABT Associates: Bethesda, Maryland.
13. Diop F, Mulenga C and Seshamani V (1998) ‘The impact of cost recovery schemes on access and equity in Niger’, Health Policy and Planning 10(3):223–240.
14. Diop F, Yazbeck A and Bitran R (1995) ‘The impact of cost recovery schemes on access and equity in Niger’, Health Policy and Planning 10(3):223–240.
15. Enemark U and Schleimann F (1999) ‘Financing health care services in poor countries: Feeding a white elephant?’ DANIDA Discussion Paper 1. Unpublished paper.
16. Fiedler JL and Suazo J (2002) ‘Ministry of Health user fees, equity and decentralisation: Lessons from the Honduras’, Health Policy and Planning 17(4):362–377.
17. Gilson L and McIntyre D (2005) ‘Removing user fees for primary care in Africa: The need for careful action’, British Medical Journal 331:762–765.
18. Gottret P and Schieber G (2006) Health Financing Revisited: A Practitioner’s Guide. World Bank: Washington DC.
19. Habtom GK and Ruys P (2007) ‘The choice of a health care provider in Eritrea’, Health Policy 80(1):202–217.
20. Health Systems Resource Guide. User Fees for Health. http://www.eldis.org/healthsystems/userfees/index.htm (accessed 7 September 2006).
21. Hjortsberg C (2003) ‘Why do the sick not utilise health care? The case of Zambia’, Health Economics 12:755–770.

18
22. Hsiao W and Liu Y (2001) ‘Health care financing: Assessing its relationship to health equity’, in Evans T, Whitehead M, Diderichsen F, Bhuiya A and Wirth M (eds) Challenging Inequities in Health. Oxford University Press: New York.
23. Hussein AK and Mujinja PG (1997) ‘Impact of user charges on government health facilities in Tanzania’, East African Medical Journal 74(12):749–750.
24. Jacobs B and Price N (2004) ‘The impact of the introduction of user fees at a district hospital in Cambodia’, Health Policy and Planning 19(5):310–321.
25. James C, Morris SS, Keith R and Taylor A (2005) ‘Impact on child mortality of removing user fees: A simulation model’, British Medical Journal 331(7519):747–749.
26. James CD, Hanson K and McPake B (2006) ‘To retain or remove user fees? Reflections on the current debate in low- and middle-income countries’, Applied Health Economics and Health Policy 5(3):137–153.
27. Laterveer L, Munga M and Schwerzel P (2004) Equity Implications of Health Sector User Fees in Tanzania: Do We Retain the User Fee or Set the User F(r)ee? Research on Poverty Alleviation (REPOA): Tanzania.
28. Leighton C (1995) ‘Overview: Health Financing Reforms in Africa’, Health Policy and Planning 10(3):213–222.
29. Malama C, Chen O, De Vogli R and Birbeck GL (2002) ‘User fees impact on access to health care for female children in rural Zambia’, Journal of Tropical Pediatrics 48(6):371–372.
30. Malik EM, Hanafi K and Ali K (2006) ‘Treatment-seeking behaviour for malaria in children under five years of age: Implication for home management in rural areas with high seasonal transmission in Sudan', Malaria Journal 5:60.
31. MARA. Mapping Malaria Risk in Africa. www.mara.org.za (accessed 17 December 2007).
32. Mariko M (2003) ‘Quality of care and the demand for health services in Bamako, Mali: The specific roles of structural, process and outcome components’, Social Science and Medicine 56(6):1183–96.
33. Masiye F, Seshamani V, Cheelo C, Mphuka C and Odegaard K (2005) ‘Health care financing in Zambia: A review of options for implementation’, unpublished MoH report. Department of Economics, University of Zambia: Lusaka.
34. Masiye F, Mphuka C and Simeo F (2006) ‘A baseline survey on patient and health perceptions about the role of user fees in health service organisation’, a consultancy report submitted to DFID: Lusaka.
35. Matee M, Simon E (2000) ‘Utilisation of dental services in Tanzania before and after the introduction of cost-sharing’, International Dental Journal 50(2):69–72.
36. Ministry of Health (2007) ‘Public expenditure tracking and quality of service delivery in the health sector: Findings and implications’, Government of Zambia: Lusaka.
37. Ministry of Health (2006) ‘National Health Accounts: 1995-2004 Report’, Government of Zambia: Lusaka.
38. Ministry of Health (2001) ‘National Strategic Plan 2001-2005’, Government of Zambia: Lusaka.
39. Ministry of Health (1998) ‘National Health Care Financing Policy (draft)’, Government of Zambia: Lusaka.
40. Ministry of Health (1995) ‘National Strategic Plan 1995-1999’, Government of Zambia: Lusaka.
41. Ministry of Health (1993) ‘National Health Policies and Strategies Act’, Government of Zambia: Lusaka.

19
42. Onwujekwe O, Hanson K and Fox-Rushby J (2004) ‘Inequalities in purchase of mosquito nets and willingness to pay for insecticide-treated nets in Nigeria: Challenges for malaria control interventions’, Malaria Journal 3:6.
43. Schieber G and Maeda A (1997) ‘A curmudgeon's guide to financing health in developing countries’, in Schieber G (ed) Innovations in Health Care Financing. World Bank: Washington DC.
44. Stekelenburg J, Kyanamina S, Mukelabai M, Wolffers I and van Roosmalen J (2004) ‘Waiting too long: Low use of maternal health services in Kalabo, Zambia’, Tropical Medicine and International Health 9(3):390–398.
45. Thomas S, Killingsworth JR and Acharya S (1998) ‘User fees, self-selection and the poor in Bangladesh’, Health Policy and Planning 13(1):50–58.
46. Thomason J, Mulou N and Bass C (1994) ‘User charges for rural health services in Papua New Guinea’, Social Science and Medicine 39(8):1105–1115.
47. Van der Geest S, Macwan’gi M, Kamwanga J, Mulikelela D, Mazimba A and Mwangelwa M (2000) ‘User fees and drugs: What did the health reforms in Zambia achieve?’ Health Policy and Planning 15(1):59–65.
48. Van Doorslaer E, O’Donnell O, Rannan-Eliya RP, Somanathan A, Adhikari SR and Akkazieva B (2005) ‘Paying out-of-pocket for health care in Asia: Catastrophic and poverty impact’, EQUITAP Working Paper 2. http://www.equitap.org (accessed 10 November 2007).
49. Van der Plaetse B, Hlatiwayo G, Van Eygen L, Meessen B and Criel B (2005) ‘Costs and revenue of health care in a rural Zimbabwean district’, Health Policy and Planning 20(4):243–251.
50. Wagstaff A and van Doorslaer E (2003) ‘Catastrophe and impoverishment in paying for health care: With applications to Vietnam 1993-1998’, Health Economics 12:921–934.
51. Wilkinson D, Gouws E, Sach M and Karim SSA (2001) ‘Effect of removing user fees on attendance for curative and preventive primary health care services in rural South Africa’, Bulletin of the World Health Organisation 79(7): 665–671.
52. World Health Organisation (2007) ‘World Health Statistics 2007’, www.who.int/whosis/en/index (accessed 16 December 2007).
53. Wouters A (1995) ‘Improving quality through cost recovery in Niger’, Health Policy and Planning 10(3):257–270.
54. Xu K, Evans DB, Kadama P, Nabyonga J, Ogwal PO and Aguilar AM (2005) ‘The elimination of user fees in Uganda: Impact on utilisation and catastrophic health expenditure’, World Health Organisation, EIP/HSF/DP.05.5: Geneva.
Acknowledgements The researchers would sincerely like to thank our two field assistants, Masauso Phiri and Chipo Mpamba. Their hard work and dedication during the field research proved crucial to the completion of this study. We also pay respect to one of our research team member, Felix Simeo, who passed on before this study was completed. At UNZA we also sincerely thank Prof Ndulo and colleagues for their assistance in facilitating this work. The paper has benefited significantly from helpful comments from Prof Di McIntyre and one anonymous reviewer. We gratefully acknowledge the financial support from EQUINET and IDRC Canada co-ordinated through the University of Cape Town Health Economics Unit. Usual disclaimers apply.

20
Equity in health implies addressing differences in health status that are unnecessary, avoidable and unfair. In southern Africa, these typically relate to disparities across racial groups, rural/urban status, socio-economic status, gender, age and geographical region. EQUINET is primarily concerned with equity motivated interventions that seek to allocate resources preferentially to those with the worst health status (vertical equity). EQUINET seeks to understand and influence the redistribution of social and economic resources for equity oriented interventions, EQUINET also seeks to understand and inform the power and ability people (and social groups) have to make choices over health inputs and their capacity to use these choices towards health. EQUINET implements work in a number of areas identified as central to health equity in the region:
• Public health impacts of macroeconomic and trade policies • Poverty, deprivation and health equity and household resources for health • Health rights as a driving force for health equity • Health financing and integration of deprivation into health resource allocation • Public-private mix and subsidies in health systems • Distribution and migration of health personnel • Equity oriented health systems responses to HIV/AIDS and treatment access • Governance and participation in health systems • Monitoring health equity and supporting evidence led policy
EQUINET is governed by a steering committee involving institutions and individuals co-ordinating theme, country or process work in EQUINET:
R Loewenson, R Pointer, F Machingura TARSC, Zimbabwe; M Chopra MRC, South Africa; I Rusike, CWGH, Zimbabwe; L Gilson, Centre for Health Policy, South Africa; M Kachima, SATUCC; D McIntyre, Health Economics Unit, Cape Town, South Africa; G Mwaluko, M
Masaiganah, Tanzania; Martha Kwataine, MHEN Malawi; A Ntuli, Health Systems Trust; S Iipinge, University of Namibia; N Mbombo UWC, L London UCT Cape Town, South Africa; A Mabika SEATINI, Zimbabwe; I Makwiza, REACH Trust Malawi; S Mbuyita, Ifakara Tanzania
For further information on EQUINET please contact the secretariat:
Training and Research Support Centre (TARSC) Box CY2720, Causeway, Harare, Zimbabwe Tel + 263 4 705108/708835 Fax + 737220
Email: [email protected] Website: www.equinetafrica.org
Series Editor: Rene Loewenson Issue Editor: Di McIntyre, Pierre Norden, Rebecca Pointer