Embed Size (px)
Citation preview

-����.��"��/�+��� � �����0� $$���� �������$ �����0����� ������(((�� ��0��� ���$�" $� ��%���� �1�0��" � ��2%���� �+���3�� $��
��������� ����� �������������� ��� ���� ��������
����������� �!"�#$���%�!�&"���" �#'� ���%����� �����()������(��**+++,��-��� ���,���* ��*)��&�
.���� ����(���(��������+���+�������)��� � )
�)�����/��)�0�1�/��2���31�3�����-��,�4,�5���1�6,��((�1�$��-�����7�2��2���)����
2��������������� ���������� ��� ����� ��� ��� ����� ����������� ��������������� ���� !"��#�� �� �������$%&%&'(�)��! *��+������� "�+����, �", "�������-� *��* ��."� "�� *����� *��+��!����" *� *�"�- *�/����"����01.(�2&�2&3&4&5&67528�%&28�27&38&7
2�� ��8������������ ����������� ��������������������������������
���� �������� ������� �������
!��" ��#���� �� $�������� ��%���� ��
&�� $���' �(��))
* �(���� ���� �� $����
* �(�+����" �,�� �

ARTICLE
Removal of phosphate from wastewater using coal slagNguyen Hoang Lama, Hoa Thai Mab, Mohammed J. K. Bashirc, G. Epped, Pramod Avtie
and Tan Tai Nguyenf
aBiotechnology and Environment Center, School of Agriculture and Aquaculture, Tra Vinh University, TraVinh city, Vietnam; bDepartment of Activated Polymer and Nano Materials Applications, School of AppliedChemistry, Tra Vinh University, Tra Vinh city, Vietnam; cFaculty of Engineering and Green Technology (FEGT),Universiti Tunku Abdul Rahman, Jalan Universiti, Bandar Barat, Kampar, Perak, Malaysia; dMass Spectrometrylaboratory, MolSys Research Unit, University of Liège, Liège, Belgium; eDepartment of Biophysics,Postgraduate Institute of Medical Education and Research (PGIMER), Chandigarh, India; fDepartment ofMaterials Science, School of Applied Chemistry, Tra Vinh University, Tra Vinh city, Vietnam
ABSTRACTAdsorption is an efficient, cost-effective, and eco-friendly methodfor the treatment of phosphorus from wastewater. This work pre-sents the adsorptive removal of phosphate ions in aqueous solutionusing coal slag (CS) from a thermal power plan. The surface mor-phological analysis showed that the CS particles were around 50µm with a surface area of 9.20 m2 g−1 and adsorption average porewidth of 6.42 nm, offering the high capability for phosphate ionsadsorption. The optimising phosphate ions adsorption conditionswere investigated based on various parameters, including contacttime, pH, and amount of absorbent. The experimental resultsshowed that the maximum loading adsorption capacity was21.63 mg g−1 in the concentration range of 0–30 mg L−1 underoptimising conditions (i.e. pH of 6, adsorbent dosage (0.1 g vol−1
used) and contact time of 45 min). Furthermore, the use of CS offersseveral benefits like reducing the sample pre-treatment steps forcostly, less time-consuming and reliable methods.
ARTICLE HISTORYReceived 30 September 2019Accepted 13 December 2019
KEYWORDSAdsorption Capacity;Chemical Composition; CoalSlag; Phosphate Ions;Isothermal
1. Introduction
Nowadays, the aquaculture industry is developing and is extremely important to theeconomy of Vietnam. Higher rate of phosphate production in recent years is one of thesignificant issues for the environment. Phosphorus can stimulate the growth of an aquaticorganism, including macro and microorganism, which can cause eutrophication [1].Previously, the only available adsorption techniques were based on high organic waste-water treatment including advanced oxidation processes [2], activated sludge treatment[3] and biological contact oxidation [4], which were adequate for removal of organiccarbon and nitrogen in wastewater. However, those methods were not suitable for theremoval of the phosphorus ions. Therefore, post-treatment procedures were usuallycombined with biological processes to remove phosphorus in advanced wastewatertreatment [5].
CONTACT Tan Tai Nguyen [email protected]
INTERNATIONAL JOURNAL OF ENVIRONMENTAL ANALYTICAL CHEMISTRYhttps://doi.org/10.1080/03067319.2019.1708907
© 2020 Informa UK Limited, trading as Taylor & Francis Group
A few decades ago, phosphorus was removed from wastewater using a sedimentationmethod, biological treatments, and chemical precipitations [6,7]. However, they haveseveral drawbacks such as high costs, time-consuming to perform, complicated in opera-tion, and low efficiency in processing [8]. Therefore, adsorption-based methods are themost useful and economical among the various techniques mentioned above due tobenefits such as high adsorption capacity, low cost and an environmentally friendlyapproach [9,10].
Previously, phosphate ion adsorption has been studied based on several adsorptionmaterials, such as slag [5,9], natural soil [11–13], limestone [14,15], zeolite and sand[16,17], Moroccan oil shale [18,19], water treatment fly ash [1,4,20], red mud [21,22],cement [23,24], modified bentonite [25] and calcium bentonite clay mineral [26].However, some materials mentioned require pretreatment for adsorption. It is worthmentioning also that coal slag (CS) promises adsorptive materials for the removal ofheavy metals including Cd2+, Cu2+, Zn2 [27,28] and nutrients [1,29]. In addition, the CS isa by-product of a thermal power plant that can cause damage to the surroundingenvironment and can be harmful to human beings [30]. So, the reuse and recyclingprocess of CS is a cost-effective method that could partially eliminate the disposalproblems.
This study investigated the adsorption efficiency of phosphate ion adsorption using CSproduced from a thermal power plant. The adsorption method was adopted to efficientlyremove phosphate ions under specific controlled conditions, including pH control, con-tact time, and mass of adsorbent.
2. Materials and methods
2.1. Chemical and reagents
The CS used was generated from the Duyen Hai 3 thermal power plant (Tra Vinh province,Vietnam). Sulphuric acid (H2SO4, 98%), Ammonium molybdate tetrahydrate ((NH4)6Mo7O24.4H2O, 99%), Potassium dihydrogen phosphate (KH2PO4, 99.5%), Antimony potassiumtartrate hydrate (K(SbO)C4H4O6.5H2O, 99.5%), ascorbic acid (C6H8O6, 98%) were pur-chased from Merck KGaA.
2.2. Phosphate ions adsorption study
The CS used was sampled from the Duyen Hai 3 thermal power plant. The drying processconsisted of leaving the CS in an oven at 80°C for 2 h. Later, it was ground and sieved witha 2 mm filter porosity size. The CS powder obtained was ready for use to evaluatephosphate removal. Our major factors, including the effect of pH, concentration ofadsorbate, contact time, and mass of adsorbent at room temperature were studied foradsorption of phosphate ions. pH was tested in the range changed from 3 to 9; concen-tration range from 5 to 30 mg L−1; the mass of adsorbent was set up from 1 to 6 g, and thecontact time varied from 15 to 75 min with 15 min increment.
The concentration of the phosphate ions was analysed by using a UV-Vis spectrumanalyser. The standard phosphate solution preparation includes the mixing of potassiumdihydrogen phosphate with distilled water. A calibration curve of phosphate concentration
2 N. HOANG LAM ET AL.

was plotted based on the concentration range of 2 ppm. The capacity (Qcap) and efficiency(Heff) of adsorption were analysed based on Equations 1 and 2.
Qcap ¼Cin " Ceq
mV (1)
Heff ¼Cin " Ceq
Cin# 100% (2)
where Cin, Ceq, V, and m were the initial concentration, the equilibrium concentration ofphosphate ions, the volume of adsorbate and the mass of adsorbent, respectively.
2.3. Physicochemical and morphological characterisation
The physicochemical characterisation of CS and adsorption of phosphate ions wasobtained using six analytical techniques: X-ray-Fluorescence (XRF, Thermo Scientific ARLQUANT’X) and X-ray Diffraction (XRD, Thermo Scientific ARL EQUINOX 1000X) for thecrystallographic structure and chemical composition of CS used; Scanning ElectronMicroscopy (SEM, Keyence VKX-1000) for ultrastructural analysis; Fourier TransformInfrared Spectroscopy (FTIR, Thermo Scientific Nicolet iS50) for determination of func-tional groups in a range 4000–500 cm−1; Ultraviolet-Visible Spectroscopy (UV-Vis, ShimazuUV-2600) for measurement of concentration of phosphate solution; pore size distributionobtained by BJH (Micrometrics ASAP 2010), surface area measured by the BET methodand Atomic Adsorption Spectrometer (AAS, Varian AA240) for detection of leachingcontaminants in wastewater treated.
2.4. Determination point of zero charge
The experiments were conducted to measure the pH at the potential of zero point charge(pHpzc) based on the pH drift method. The initial pH of sodium chloride was in the rangeof 2 to 12 with an increment of 2 pH unit. The CS of 150 mg was added into the abovesolution for 24 h with stirring speed of 200 rpm. Then, the final pH was measured and therelation between initial pH and final pH was plotted in Figure 3.
2.4.1. Results and discussionThe XRD analysis of the CS sample is presented in Figure 1(a). Twelve distinct peaks at16.37°, 20.77°, 26.20°, 26.54°, 30.94°, 33.18°, 35.16°, 36.51°, 39.35°, 42.38°, 50.08° and 67.87°are clearly outlined. Those diffraction peaks represent the composition of quartz andmullite. It was confirmed after with a good match when interrogating database in JCPDSfile (No. 22–700) [31]. Then, the XRF analysis was conducted to verify the elementalcomposition of CS. The analysed results indicated that the CS samples are abundantwith silica dioxide (SiO2) representing up to 56% of the total amount. This result is in goodagreement and comparable to other adsorbent materials reported in the literature, asshown in Table 1. The level of SiO2 in our CS material is promising and could exhibit therequired adsorption properties for phosphate. One should note that the CS sample alsocontains a small proportion of trace metal elements like iron, magnesium, and aluminium,as depicted in Table 1.
INTERNATIONAL JOURNAL OF ENVIRONMENTAL ANALYTICAL CHEMISTRY 3

Figure 1(b) represents the FTIR spectrum of the CS samples. The strong absorptionbands at 1019 and 594 cm−1 correspond to the symmetric Si-O-Si vibration and Al-O-Sibond, respectively [32]. Relevant signals on the FTIR spectra of CS were the adsorptionbands in the region 550–750 cm−1 (these bands correspond to AlO6 groups or the Si-Hbond) [33]. These results showed agreement with the XRF analysis as mentioned above. Inaddition, the surface analysis of SEM showed that CS had a random shape with anaveraged diameter of approximately 50 µm. BET and BJH analyses of CS were carriedout and the results gave a specific surface area of 9.20 m2 g−1 and an average pore size of
Figure 1. Physicochemical characterisation of CS from Duyen Hai thermal power plant. Note: (a) X-raydiffraction pattern; (b) Fourier transform infrared spectrum; (c) SEM image; (d) Real image.
Table 1. Comparison of the chemical composition between CS used in this study and other materials.Noted: the numbers represent the weight percentage (%) of each composition.Materials Al2O3 SiO2 Fe2O3 CaO MgO K2O TiO2 Source
Coal slag 28.7 55.9 5.14 1.04 1.96 3.45 0.72 In this studyFly ash 1.34 68.01 0.25 5.77 2.39 2.09 0.07 [9]Iron Slag 2.31 17.57 7.22 48.43 7.84 0.04 1.15 [9]Fly ash 28 49 8.3 5.3 1.6 3.70 1.1 [38]Fly ash 33.01 49.3 4.84 2.98 0.95 - - [39]Fly ash 18.61 48.59 7.99 10.91 2.76 1.73 0.97 [39]Fly ash 21.87 51.64 5.54 1.05 3.01 1.05 - [41]Slag 12.24 32.98 7.56 5.53 1.83 0.69 - [41]
4 N. HOANG LAM ET AL.

6.42 nm. All these information indicate that our CS material could be potentially used forremoval of phosphate applications.
To obtain the optimised conditions for phosphate removal, the effect of adsorbentmass, the concentration of adsorbate, pH and contact time were investigated. Only thestirring velocity of 180 rpm was maintained constant during the entire process for mixingof the adsorbent and adsorbate [9] and initial concentration of phosphate ions in aqueoussolution is 20 ppm. It should be noted that each datapoint in Figures 2(a,b) and 4 isrepresented by the mean value of three experimental results.
The adsorption capacity (mg g−1) and efficiency of adsorption (%) for phosphate ionremoval by CS were firstly investigated by varying the pH change. As seen in Figure 2(a),the removal efficiency of phosphate ion was reached a maximum value of 69.55% at pH 6,while the removal efficiency dropped down when pH value was higher or lower than 6.The pH increased or decreased, the deformation of phosphate from H2PO4
− to HPO42-, CS
surface charge and active sites may prevent phosphate ion adsorption. When pHincreases from 2 to 7, the concentration of divalent HPO4
2- ion increases ten-fold foreach unit in pH [34]. HPO4
2- with two nucleophilic centres and the potential to act asbidentate ligand may have a greater affinity for the CS surface than H2PO4
−. The surface ofCS contained many active sites (Ca2±, Mg2±), which are able to form precipitation of Ca3(PO4)2 or Mg3(PO4)2. In acidic pH, Ca2± and Mg2± ions were released more from the CS toprecipitate Ca3(PO4)2 or Mg3(PO4)2. This leads to achieve more significant absorptioncapacity at pH 6 even though the CS surface has negative charge. For pH ≥ 6, the CSsurface has positive charge as shown in Figure 3. This positive charge of the CS surfacecould contribute to adsorb of phosphate ion via electrostatic attractive force. However,the increase in concentration of HPO4
2- was slowly down to zero at pH ≥ 7 [35]. This maybe the reason for the decrease in phosphate ion adsorption as shown in Figure 2(a).
The parabolic shape curve was fitted with a quadratic second-order equation q = qo +ax + bx2 to themeasured data in Figures 2(a,b) and 4 to find the ideal characteristic parabolicshape for phosphate removal with varying parameters including pH, mass and contact timeduring the adsorption process. The fitting results in Table 2 showed that the minimumpossible capacity of phosphate ion adsorption (qo) based on CS was 2.3 mg g−1 for pHchange (Figure 2(a)); 10.4 mg g−1 for CS mass change (Figure 2(b)), and 8.1 mg g−1 contact
Figure 2. Capacity of phosphate adsorption and efficiency of phosphate removal by CS. Note: (a)Influence of pH; (b) Influence of Mass.
INTERNATIONAL JOURNAL OF ENVIRONMENTAL ANALYTICAL CHEMISTRY 5

time change (Figure 4), respectively. Results also showed the minimum possible adsorptioncapacity in case the pH drops to a value 4 times lower the different cases. This was caused bythe deformation of phosphate from H2PO4
−to HPO42-, CS surface charge and active sites as
Figure 3. The pHpzc determination curve of the CS.
Table 2. Kinetic parameters in phosphate removal.
Minimum adsorption capacity qo (mg g−1)
Fitting coefficients
A b R2
Time 8.1 0.02 − 1.91 0.97Mass 10.4 35.5 29 0.92pH 2.3 0.37 − 0.03 0.95
Figure 4. Adsorption kinetics of phosphate ions by CS.
6 N. HOANG LAM ET AL.
discussed above. Moreover, all the correlation coefficients (R2) for three different cases (pH,mass and contact time) were higher than 0.90, indicating that the model proposed, i.e.the second-order quadratic model, fitted well into the experimental data.
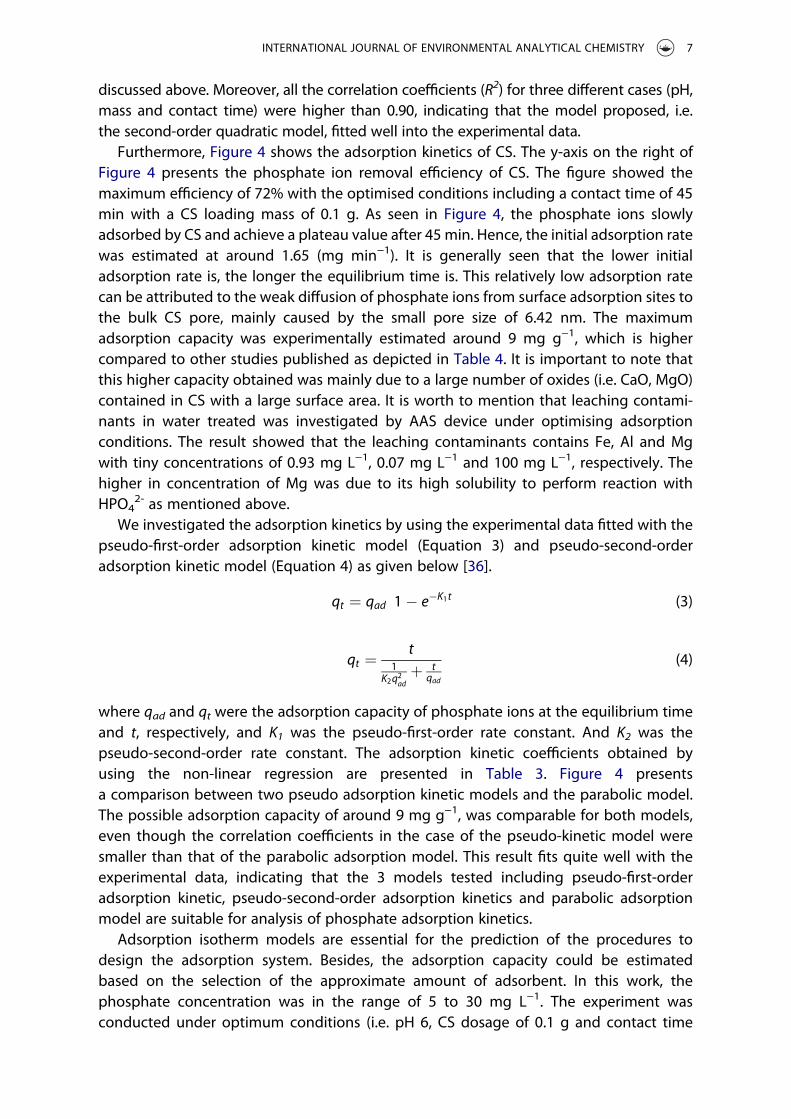
Furthermore, Figure 4 shows the adsorption kinetics of CS. The y-axis on the right ofFigure 4 presents the phosphate ion removal efficiency of CS. The figure showed themaximum efficiency of 72% with the optimised conditions including a contact time of 45min with a CS loading mass of 0.1 g. As seen in Figure 4, the phosphate ions slowlyadsorbed by CS and achieve a plateau value after 45 min. Hence, the initial adsorption ratewas estimated at around 1.65 (mg min−1). It is generally seen that the lower initialadsorption rate is, the longer the equilibrium time is. This relatively low adsorption ratecan be attributed to the weak diffusion of phosphate ions from surface adsorption sites tothe bulk CS pore, mainly caused by the small pore size of 6.42 nm. The maximumadsorption capacity was experimentally estimated around 9 mg g−1, which is highercompared to other studies published as depicted in Table 4. It is important to note thatthis higher capacity obtained was mainly due to a large number of oxides (i.e. CaO, MgO)contained in CS with a large surface area. It is worth to mention that leaching contami-nants in water treated was investigated by AAS device under optimising adsorptionconditions. The result showed that the leaching contaminants contains Fe, Al and Mgwith tiny concentrations of 0.93 mg L−1, 0.07 mg L−1 and 100 mg L−1, respectively. Thehigher in concentration of Mg was due to its high solubility to perform reaction withHPO4
2- as mentioned above.We investigated the adsorption kinetics by using the experimental data fitted with the
pseudo-first-order adsorption kinetic model (Equation 3) and pseudo-second-orderadsorption kinetic model (Equation 4) as given below [36].
qt ¼ qad 1" e"K1t! "
(3)
qt ¼t
1K2q2ad
þ tqad
(4)
where qad and qt were the adsorption capacity of phosphate ions at the equilibrium timeand t, respectively, and K1 was the pseudo-first-order rate constant. And K2 was thepseudo-second-order rate constant. The adsorption kinetic coefficients obtained byusing the non-linear regression are presented in Table 3. Figure 4 presentsa comparison between two pseudo adsorption kinetic models and the parabolic model.The possible adsorption capacity of around 9 mg g−1, was comparable for both models,even though the correlation coefficients in the case of the pseudo-kinetic model weresmaller than that of the parabolic adsorption model. This result fits quite well with theexperimental data, indicating that the 3 models tested including pseudo-first-orderadsorption kinetic, pseudo-second-order adsorption kinetics and parabolic adsorptionmodel are suitable for analysis of phosphate adsorption kinetics.
Adsorption isotherm models are essential for the prediction of the procedures todesign the adsorption system. Besides, the adsorption capacity could be estimatedbased on the selection of the approximate amount of adsorbent. In this work, thephosphate concentration was in the range of 5 to 30 mg L−1. The experiment wasconducted under optimum conditions (i.e. pH 6, CS dosage of 0.1 g and contact time
INTERNATIONAL JOURNAL OF ENVIRONMENTAL ANALYTICAL CHEMISTRY 7

of 45 min at room temperature). Then, the Langmuir (Equation 5) and Freundlich(Equation 6) models were applied to analyse the experimental data, respectively [37,40].
Ceqqeq
¼ Ceqqmax
þ 1KLqmax
(5)
log qeq ¼ n log Ceq þ log KF (6)
where Ceq and qeq were the phosphate ions concentration in solution, and the number ofphosphate ions adsorbed at equilibrium, respectively. And qmaxwas themaximum capacity ofadsorption; KL was the energy adsorption; KF was the adsorption capacity; n was the adsorp-tion intensity. The adsorption parameters and correlation coefficients obtained by usingLangmuir and Freundlich equations are shown in Table 5. The fitting results based on theFreundlich model (Figure 5(b)) showed that the adsorption intensity (n) of 0.84, which wassmaller than one that indicated low speed in adsorption of phosphate ions, which corre-sponds to the long adsorption time of 45 min as shown in Figure 4. Also, the Freundlichisotherm described a better fit with the experimental data based on correlation coefficient(R2), which was higher than that of Langmuir isotherm. Besides, the affinity between CS andphosphate ions (KL) of 0.51 L mg−1 represented small initial sorption isotherm slope. It wasworth noting that the larger KL produced the faster adsorption of phosphate ions in anapproximately linear fashion. However, the plot based on the Langmuir isotherm model(Figure 5(a)) showed nonlinear behaviour at around the lowest concentration (8 mg L−1),accounting for the low initial adsorption rate of 1.65 (mg min−1) as mentioned above.
Table 3. Adsorption kinetic coefficients for phosphate removal.
Possible adsorption capa-city qad (mg g−1)
Kinetic coefficients
K1 (min−1)K2
(g mg−1 min−1) R2
Pseudo-first-order adsorptionkinetic model
8.73 0.58 0.39
Pseudo-second-orderadsorption kinetic model
8.85 0.27 0.71
Table 4. Comparison of phosphate adsorption capacity of CS with adsorbent materials.
AdsorbentConcentration range
(mg L−1)Phosphate adsorption capacity
(mg g−1) Treatment condition ReferencesCoal slag 5 – 30 8.22 Raw coal slag This studyFly ash 50 – 2000 3.34 Raw fly ash [4]Steel slag 11.40–45.59 5.3 Raw steel slag [5]Red mud 0.01 – 1 0.58 HCl treatment, pH = 5, 40°C [22]Steel slag 10 – 125 5.3 Thermally modified slag [42]
Table 5. Phosphate adsorption isotherm coefficients.
Maximum adsorption capacity qmax(mg g−1)
Isotherm coefficients
KF(mg g−1) n KL (L mg−1) R2
Freundlich isotherm 1.20 0.84 0.93Langmuir isotherm 21.63 0.51 0.51
8 N. HOANG LAM ET AL.

Moreover, the maximum adsorption capacity of 21.63 mg g−1 was obtained based on theLangmuir isotherm, implying that the phosphate ions adsorption on CS in our experimentwasan effective process for phosphate removal from aqueous solution.
2.4.2. ConclusionThis study investigated the adsorption process of phosphate ion from aqueous solutionusing CS under different conditions such as adsorbent mass, the concentration of adsor-bate, pH and contact time were investigated. The results showed that CS with the surfacearea of 9.20 m2 g−1 offered the maximum loading adsorption capacity of 21.63 mg CS/gphosphate ion obtained at pH 6, contact time of 45 min and CS dosage of 0.1 g withoutpre-treatment of the CS. In addition, the reuse of CS for phosphate ion adsorption offeredseveral benefits such as low cost adsorbent, less time-consuming method, ease-of-useand partial elimination of the disposal problems.
Data availability statement
These data used to support the findings of this study are available from the corresponding authorupon request.
Disclosure statement
No potential conflict of interest was reported by the authors.
Funding
This research was supported by Tra Vinh University under Basic Science Research fund No. [179/HĐ.HĐCN-ĐHTV].
References
[1] A. Ugurlu and B. Salman, Environ. Int. 24, 911 (1998). doi:10.1016/S0160-4120(98)00079-8.
Figure 5. Adsorption isotherms of phosphate by CS. Note: (a) Langmuir isotherm model; (b) Freundlichisotherm model.
INTERNATIONAL JOURNAL OF ENVIRONMENTAL ANALYTICAL CHEMISTRY 9

[2] I. Oller, S. Malato and J.A. Sanchez-Perez, Sci. Total Environ. 409, 4141 (2011). doi:10.1016/j.scitotenv.2010.08.061.
[3] M. Coma, M. Verawaty, M. Pijuan, Z. Yuan and P.L. Bond, Bioresour. Technol. 103, 101 (2012).doi:10.1016/j.biortech.2011.10.014.
[4] S.G. Lu, S.Q. Bai, L. Zhu, H.D. Shan and J. Hazard, Mater. 161, 95 (2009). doi:10.1016/j.jhazmat.2008.02.123.
[5] J. Yu, W. Liang, L. Wang, F. Li, Y. Zou and H. Wang, J. Environ. Sci. 31, 81 (2015). doi:10.1016/j.jes.2014.12.007.
[6] S.A. Parsons and J.A. Smith, J. Element 4, 109 (2008). doi:10.2113/GSELEMENTS.4.2.109.[7] H.N. Bhatti, J. Hayat, M. Iqbal, S. Noreen and S. Nawaz, JMRT 7, 300 (2018). doi:10.1016/j.
jmrt.2017.08.010.[8] S. Mignardi, A. Corami and V. Ferrini, Chemosphere 84, 354 (2012). doi:10.1016/j.
chemosphere.2011.09.050.[9] S.M. Ragheb, Hbrc J. 9, 270 (2013). doi:10.1016/j.hbrcj.2013.08.005.
[10] T.T. Nguyen, H.T. Ma, P. Avti, M.J.K. Bashir, C.A. Ng, L.Y. Wong, H.K. Jun, Q.M. Ngo, N.Q. Tranand J. Anal, Methods Chem. ID 6210240, 8 (2019). doi:10.1155/2019/6210240.
[11] E.M. Muindi, J.P. Mrema, E. Semu, P.W. Mtakwa, C.K. Gachene and M.K. Njogu, Int. J. Plant SoilSci. 4, 203 (2015). doi:10.9734/IJPSS/2015/13037.
[12] J.N. Quinton, J.A. Catt and T.M. Hess, J. Environ. Qual. 30, 538 (2001). doi:10.2134/jeq2001.302538x.
[13] X. Wanga, R.S. Yost and B.A. Linquist, Soil Sci. Soc. Am. J. 65, 139 (2001). doi:10.2136/sssaj2001.651139x.
[14] S. Hussain, H.A. Aziz, M.H. Isa, A. Ahmad, J.V. Leeuwen, L. Zou, S. Beecham and M. Umar,Desalin. 271, 265 (2011). doi:10.1016/j.desal.2010.12.046.
[15] M. Zhou and Y. Li, Soil Sci. Soc. Am. J. 65, 1404 (2001). doi:10.2136/sssaj2001.6551404x.[16] Z. Ganrot, G. Dave and E. Nilsson, Bioresour. Technol. 98, 3112 (2007). doi:10.1016/j.
biortech.2006.10.038.[17] C. Jiang, L. Jia, B. Zhang, Y. He and G. Kirumba, J. Environ. Sci. 26, 466 (2014). doi:10.1016/
S1001-0742(13)60410-6.[18] S. Mansouri, N. Elhammoudi, S. Aboul-hrouz, M. Mouiya, L. makouki, A. Chham, A. Abourriche,
H. Hannache and M. Oumam, Chem. Inter. 4, 7 (2018).[19] A. Chham, E.H. Khouya, M. Oumam, A. Abourriche, S. Gmouh, M. larzek, S. Mansouri,
N. Elhammoudi, N. Hanafi and H. Hannache, Chem. Inter. 4, 67 (2018).[20] M.Y. Can, E. Yildiz and J. Hazard, Mater. 135, 165 (2006). doi:10.1016/j.jhazmat.2005.11.036.[21] G. Akay, B. Keskinler, A. Cakici and U. Danis, Water Resour. 32, 717 (1998). doi:10.1016/S0043-
1354(97)00236-4.[22] W. Huang, S. Wang, Z. Zhu, L. Li, X. Yao, V. Rudolph and F. Haghseresht, J Hazard. Mater. 158,
35 (2008). doi:10.1016/j.jhazmat.2008.01.061.[23] A.D. Atasoy andM.O. Sahin, Clean: Soil, Air, Water 42, 415 (2014). doi:10.1002/clen.201300074.[24] X. Wang, J. Chen, Y. Kong and X. Shi, Water Resour. 62, 88 (2014). doi:10.1016/j.
watres.2014.05.021.[25] S. Ghezali, A.M. Benzerdjeb, M. Ameri and A.Z. Bouyakoub, Chem. Inter. 4, 24 (2018).[26] T.N. Chikwe, R.E. Ekpo and I. Okoye, Chem. Inter. 4, 230 (2018).[27] B. Bayat and A. Water, Soil Pollut. 136, 69 (2002). doi:10.1023/A:101529603.[28] V. Hequet, P. Ricou, I. Lecuyer and P.L. Cloire, Fuel 80, 851 (2001). doi:10.1016/S0016-2361(00)
00153-8.[29] N.M. Agyei, C.A. Strydom and J.H. Potgieter, Cem. Concr. Res. 30, 823 (2000). doi:10.1016/
S0008-8846(00)00225-8.[30] A. Habib, H. Bhatti and M. Iqbal, J. Phys. Chem. 2019. doi:10.1515/zpch-2019-0001[31] C. Zhou, G. Liu, S. Cheng, T. Fang and P.K.S. Lam, Sci. Rep. 4, 6221 (2014). doi:10.1038/
srep06221.[32] Y. Cheng, M. Hongqiang, C. Hongyu, W. Jiaxin, S. Jing, L. Zonghui and Y. Mingkai, Constr.
Build. Mater. 187, 318 (2018). doi:10.1016/j.conbuildmat.2018.07.220.
10 N. HOANG LAM ET AL.

[33] P. Ning, H.J. Bart, B. Li, X. Lu and Y. Zhang, J. Environ. Sci. 20, 670 (2008). doi:10.1016/S1001-0742(08)62111-7.
[34] W.L. Lindsay and A.P. Schwab, J. Plant Nutr. 5, 821 (1982). doi:10.1080/01904168209363012.[35] F.J. Kingston, A.M. Posner and J.P. Quirk, Eur. J. Soil Sci. 23, 177 (1972). doi:10.1111/j.1365-
2389.1972.tb01652.x.[36] J. Ayala, F. Blanco, P. Garcia, P. Rodriguez and J. Sancho, Fuel 77, 1147 (1998). doi:10.1016/
S0016-2361(98)00027-1.[37] J. Chen, H. Kong, D. Wu, D. Chen, D. Zhang, Z. Sun and J. Hazard, Mater. 139, 293 (2007).
doi:10.1016/j.jhazmat.2006.06.034.[38] D. Panias, I.P. Giannopoulou and T. Perrak, Colloids Surf., A 301, 246 (2006). doi:10.1016/j.
colsurfa.2006.12.064.[39] M. Šešlija, A. Rosić, N. Radović, M. Vasić, M. Đogo and M. Jotić, Geol. Croat. 69, 317 (2016).
doi:10.4154/gc.2016.26.[40] J. Xiong, Z. He, Q. Mahmood, D. Liu, X. Yang, E. Islam and J. Hazard, Mater. 152, 211 (2008).
doi:10.1016/j.jhazmat.2007.06.103.[41] G. Blanchard, M. Maunaye and G. Martin, Water Res. 18, 1501 (1984). doi:10.1016/0043-
1354(84)90124-6.[42] C. Gerente, V.K.C. Lee, P. Le Cloirec and G. McKay, Rev. Environ. Sci. Technol. 37, 41 (2007).
doi:10.1080/10643380600729089.
INTERNATIONAL JOURNAL OF ENVIRONMENTAL ANALYTICAL CHEMISTRY 11