Embed Size (px)
Citation preview

REMOVAL OF NITRATES FROM STORMWATER USING NANOCLAYS
A Thesis presented to
the Faculty of California Polytechnic State University, San Luis Obispo
In Partial Fulfillment of the Requirements for the Degree
Master of Science in Civil & Environmental Engineering
by Rubia Siddiqi August 2017

ii
ã 2017 Rubia Siddiqi
ALL RIGHTS RESERVED

iii
COMMITTEE MEMBERSHIP
TITLE: Removal of Nitrates from Stormwater Using
Nanoclays
AUTHOR:
Rubia Siddiqi
DATE SUBMITTED:
August 2017
COMMITTEE CHAIR:
Rebekah Oulton, Ph.D., Assistant Professor of
Civil and Environmental Engineering
COMMITTEE MEMBER: Amro El Badawy, Ph. D., Lecturer of Civil and
Environmental Engineering
COMMITTEE MEMBER:
Misgana Muleta, Ph. D., Associate Professor
of Civil Engineering
iv
ABSTRACT
Removal of Nitrates from Stormwater Using Nanoclays Rubia Siddiqi
Creeks and rivers are often polluted as a result of stormwater runoff that carries various contaminants in to open water bodies, causing adverse environmental and health effects. Low impact development (LID) techniques are currently employed to treat this runoff prior to discharge. Nitrate, however, is not consistently removed by these LID techniques. This study analyzed the ability of several nanoclays to remove nitrate in runoff and determined the feasibility of using them as a soil supplement for LID implementation. Six different nanoclays and HCl-treated clays were compared (pre-modified trimethyl stearyl ammonium nanoclay, pre-modified dimethyl dialkyl amine nanoclay, unmodified hydrophilic bentonite, unmodified halloysite nanoclay, HCl modified hydrophilic bentonite and HCL modified kaolin) to the control clay, unmodified kaolin, for their ability to adsorb nitrate solution by batch adsorption experiments. The findings determined that the pre-modified trimethyl stearyl ammonium nanoclay was the most effective adsorbent, decreasing the nitrate concentration up to 86% for a nitrate to clay ratio of 6.25 mg: 1 g under normal pH (5-6) and temperature (25⁰C) conditions. The HCl acid modification did not prove to provide significant additional benefits to the clays. Column studies were also conducted on the most successful clay, pre-modified trimethyl stearyl ammonium nanoclay, to assess the breakthrough point when 0.1% w/w and 1% w/w of the nanoclay were added to Nevada Sand. The results showed a projected breakthrough pore volume of 17 when the larger fraction was added to the sand, and a corresponding hydraulic conductivity of 12.6 in/hr, which is 35% slower than the un-amended Nevada Sand. Such a high hydraulic conductivity indicated that future work can test larger fractions of clay to sand mixtures to achieve a higher number of pore volumes before the soil reaches its breakthrough point. Future studies can also further explore both batch and column experiments to assess the feasibility of implementing soil amendments to a filtration system by changing the experimental parameters, such as base soil material, types of nanoclays used, and the nanoclay to nitrate ratios. Additionally, synthetic stormwater from runoff should be used as the influent instead of a nitrate-only solution to reflect more realistic scenarios for a potential real-world application.

v
ACKNOWLEDGMENTS
I’d like to thank my advisor, Dr. Rebekah Oulton, for working with me throughout the year to devise a new research project, design the experimental procedure, and complete this thesis report. You have encouraged me and provided me with guidance during this process, which I deeply appreciate. I’d also like to thank Dr. Amro El Badawy for dedicating his time, knowledge, and resources towards helping me understand nanotechnology and chemistry principles that were vital to incorporate throughout my research. Without your input, this research project would not have been possible. Thank you to Dr. Misgana Muleta as well for encouraging me to think outside of theory and focus on practical aspects of the research project. And a special thank you to Professor Nephi Derbidge for volunteering his countless number of hours and resources towards helping me with geotechnical and soil aspects, which I had very little exposure to beforehand. Your patience and time to teach me were a tremendous help and allowed for my project to come together at the end. Lastly, I’d like to thank my family and my peers for their support, encouragement, and help throughout the year. I am honored to have worked with this group of teachers, staff, students, and friends to complete my graduate education.
vi
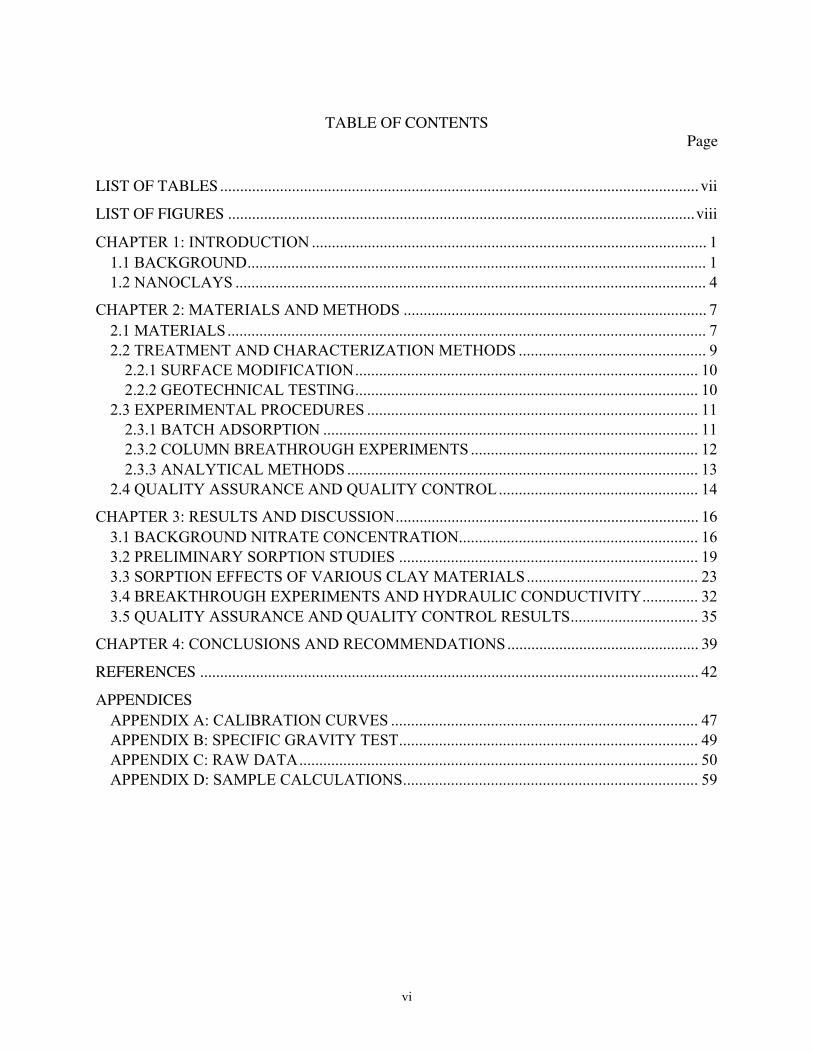
TABLE OF CONTENTS
Page
LIST OF TABLES ........................................................................................................................ vii
LIST OF FIGURES ..................................................................................................................... viii
CHAPTER 1: INTRODUCTION ................................................................................................... 11.1 BACKGROUND ................................................................................................................... 11.2 NANOCLAYS ...................................................................................................................... 4
CHAPTER 2: MATERIALS AND METHODS ............................................................................ 72.1 MATERIALS ........................................................................................................................ 72.2 TREATMENT AND CHARACTERIZATION METHODS ............................................... 9
2.2.1 SURFACE MODIFICATION ...................................................................................... 102.2.2 GEOTECHNICAL TESTING ...................................................................................... 10
2.3 EXPERIMENTAL PROCEDURES ................................................................................... 112.3.1 BATCH ADSORPTION .............................................................................................. 112.3.2 COLUMN BREATHROUGH EXPERIMENTS ......................................................... 122.3.3 ANALYTICAL METHODS ........................................................................................ 13
2.4 QUALITY ASSURANCE AND QUALITY CONTROL .................................................. 14
CHAPTER 3: RESULTS AND DISCUSSION ............................................................................ 163.1 BACKGROUND NITRATE CONCENTRATION ............................................................ 163.2 PRELIMINARY SORPTION STUDIES ........................................................................... 193.3 SORPTION EFFECTS OF VARIOUS CLAY MATERIALS ........................................... 233.4 BREAKTHROUGH EXPERIMENTS AND HYDRAULIC CONDUCTIVITY .............. 323.5 QUALITY ASSURANCE AND QUALITY CONTROL RESULTS ................................ 35
CHAPTER 4: CONCLUSIONS AND RECOMMENDATIONS ................................................ 39
REFERENCES ............................................................................................................................. 42
APPENDICESAPPENDIX A: CALIBRATION CURVES ............................................................................. 47APPENDIX B: SPECIFIC GRAVITY TEST ........................................................................... 49APPENDIX C: RAW DATA .................................................................................................... 50APPENDIX D: SAMPLE CALCULATIONS .......................................................................... 59
vii
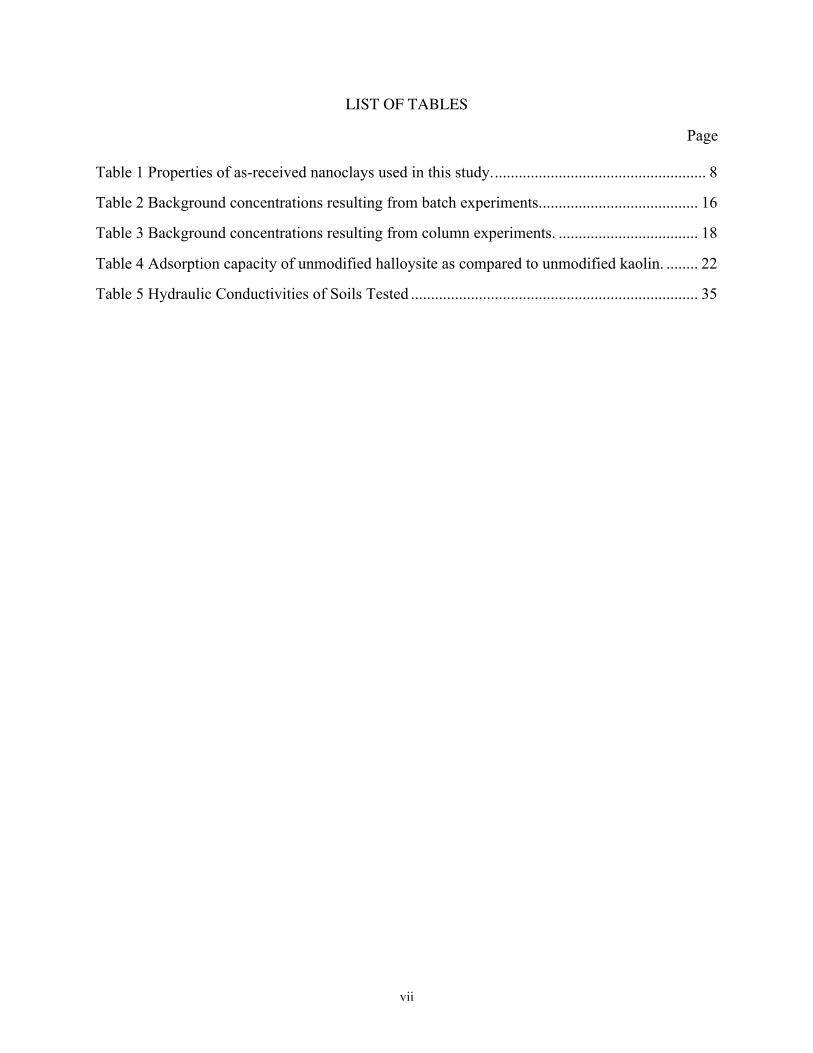
LIST OF TABLES
Page
Table 1 Properties of as-received nanoclays used in this study. ..................................................... 8
Table 2 Background concentrations resulting from batch experiments. ....................................... 16
Table 3 Background concentrations resulting from column experiments. ................................... 18
Table 4 Adsorption capacity of unmodified halloysite as compared to unmodified kaolin. ........ 22
Table 5 Hydraulic Conductivities of Soils Tested ........................................................................ 35

viii
LIST OF FIGURES
Page
Figure 1 Comparison of unmodified kaolin adsorption at different nitrate to clay ratios. ........... 20
Figure 2 General sorption models of Freundlich and Langmuir isotherms used to characterize adsorption behavior. .............................................................................................................. 21
Figure 3 Concentration vs. Sorption at equilibrium for 221:1, 110:1, and 6.25:1 mg of nitrate to g of kaolin clay ratios. .............................................................................................................. 21
Figure 4 Average nitrate adsorption capacity of clay materials during Phase 2. Background nitrate concentration has been removed (See Appendix). .................................................... 24
Figure 5 Structural diagram of montmorillonite clay. .................................................................. 27
Figure 6 Structural diagram of Kaolinite. ..................................................................................... 29
Figure 7 Breakthrough curves for clay amended Nevada Sand. ................................................... 33
1
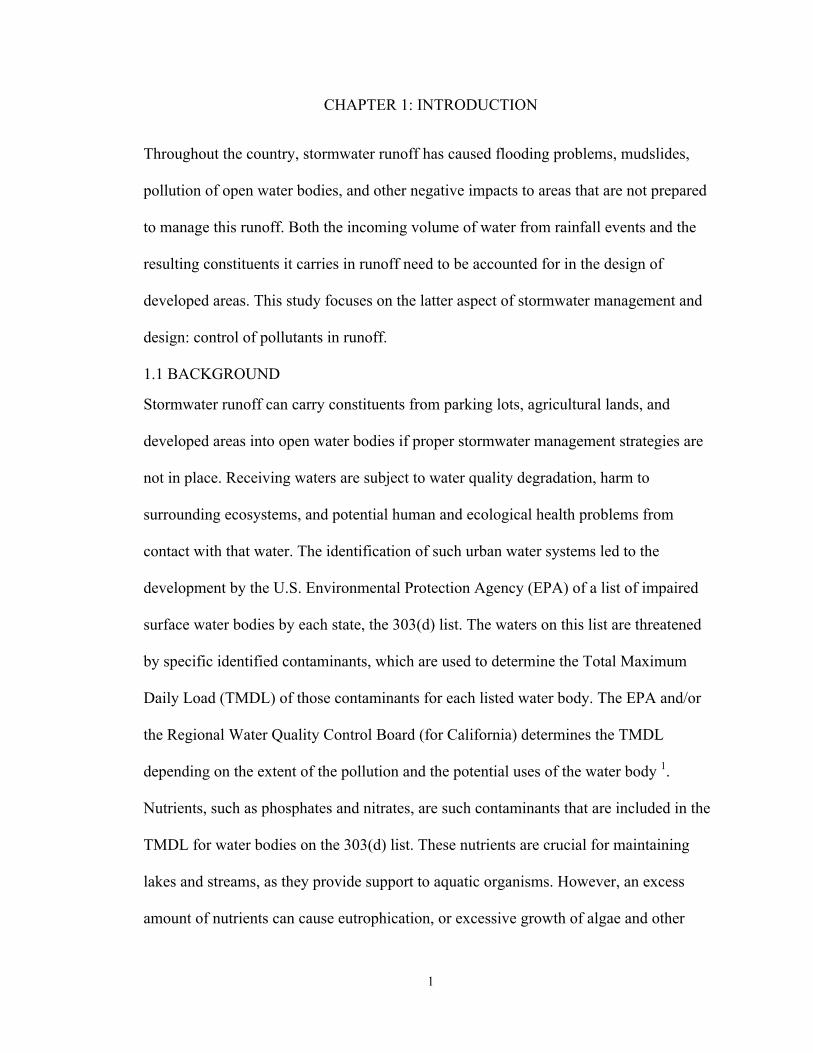
CHAPTER 1: INTRODUCTION
Throughout the country, stormwater runoff has caused flooding problems, mudslides,
pollution of open water bodies, and other negative impacts to areas that are not prepared
to manage this runoff. Both the incoming volume of water from rainfall events and the
resulting constituents it carries in runoff need to be accounted for in the design of
developed areas. This study focuses on the latter aspect of stormwater management and
design: control of pollutants in runoff.
1.1 BACKGROUND
Stormwater runoff can carry constituents from parking lots, agricultural lands, and
developed areas into open water bodies if proper stormwater management strategies are
not in place. Receiving waters are subject to water quality degradation, harm to
surrounding ecosystems, and potential human and ecological health problems from
contact with that water. The identification of such urban water systems led to the
development by the U.S. Environmental Protection Agency (EPA) of a list of impaired
surface water bodies by each state, the 303(d) list. The waters on this list are threatened
by specific identified contaminants, which are used to determine the Total Maximum
Daily Load (TMDL) of those contaminants for each listed water body. The EPA and/or
the Regional Water Quality Control Board (for California) determines the TMDL
depending on the extent of the pollution and the potential uses of the water body 1.
Nutrients, such as phosphates and nitrates, are such contaminants that are included in the
TMDL for water bodies on the 303(d) list. These nutrients are crucial for maintaining
lakes and streams, as they provide support to aquatic organisms. However, an excess
amount of nutrients can cause eutrophication, or excessive growth of algae and other

2
aquatic plants. This excessive plant growth can cause the death of aquatic organisms as
the dissolved oxygen available reduces significantly with the degradation of the algae and
plants. Eutrophication also increases the water’s pH, which can be toxic and have a
synergistic effect on other existing contaminants 2.
Nitrates are the focus of this study because in addition to accelerating eutrophication,
they can also cause harm to human health. Nitrates in drinking water are associated with
gastric cancer, infectious diseases, Methemoglobinemia (commonly known as Blue Baby
Syndrome), and diabetes 3. Therefore, the concentration of nitrate from runoff needs to be
controlled before it is discharged into surface water bodies that serve as a source of
drinking water. Nutrients in receiving water bodies can originate from runoff that flows
over agricultural fields or urban landscaping with fertilizers and animal feces, from point
sources, and from developed areas with urban and septic discharges 4.
Current efforts to remove pollutants from stormwater include low impact development
(LID) best management practices (BMPs). These techniques are a supplement to
conventional stormwater management systems, such as pipes, culverts, and storm drains.
LID techniques can help improve water quality, and reduce runoff volume and peak
flows entering the storm drainage system. LIDs accomplish these goals by facilitating
natural processes, such as infiltration and evaporation, to occur in urban settings. They
aim to route runoff away from streets and into bioswales, detention basins, and other
LIDs prior to entering the storm drainage system. These techniques allow for pollutants
to be filtered out before being routed to open water bodies.5
Sand filters are one example of an LID technique that is effective at removing dissolved
nutrients which adsorb to the surface of the sand. However, they are not as commonly
3
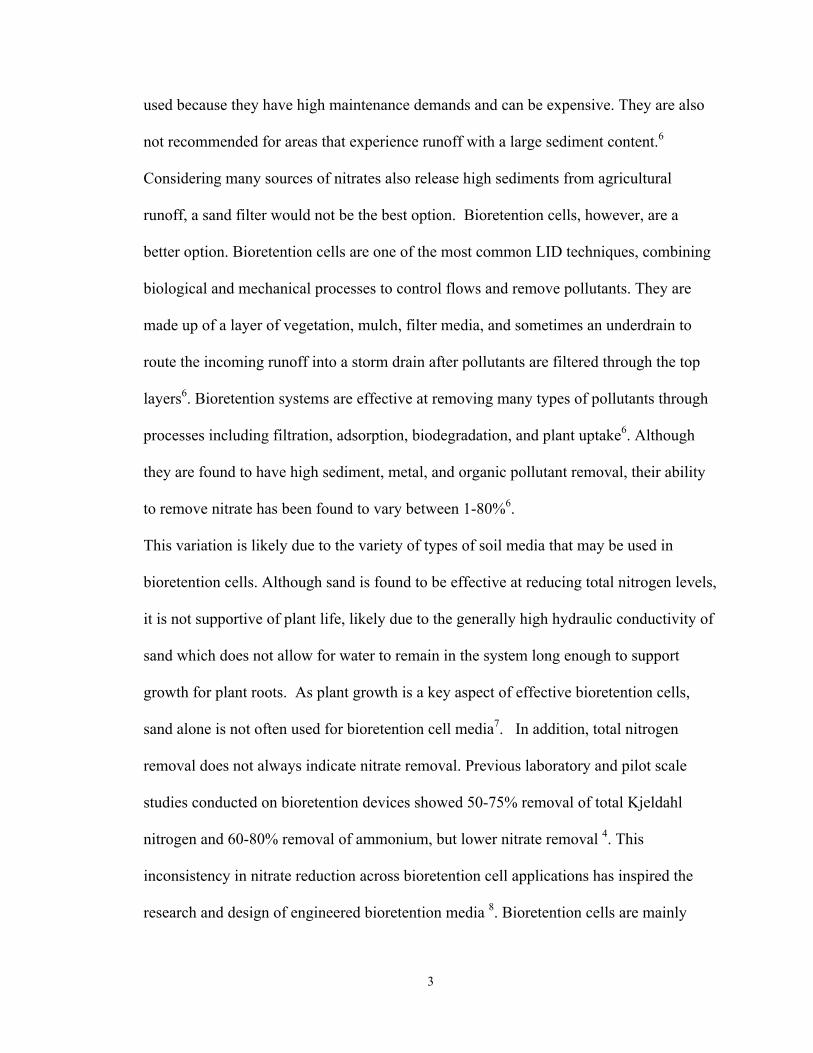
used because they have high maintenance demands and can be expensive. They are also
not recommended for areas that experience runoff with a large sediment content.6
Considering many sources of nitrates also release high sediments from agricultural
runoff, a sand filter would not be the best option. Bioretention cells, however, are a
better option. Bioretention cells are one of the most common LID techniques, combining
biological and mechanical processes to control flows and remove pollutants. They are
made up of a layer of vegetation, mulch, filter media, and sometimes an underdrain to
route the incoming runoff into a storm drain after pollutants are filtered through the top
layers6. Bioretention systems are effective at removing many types of pollutants through
processes including filtration, adsorption, biodegradation, and plant uptake6. Although
they are found to have high sediment, metal, and organic pollutant removal, their ability
to remove nitrate has been found to vary between 1-80%6.
This variation is likely due to the variety of types of soil media that may be used in
bioretention cells. Although sand is found to be effective at reducing total nitrogen levels,
it is not supportive of plant life, likely due to the generally high hydraulic conductivity of
sand which does not allow for water to remain in the system long enough to support
growth for plant roots. As plant growth is a key aspect of effective bioretention cells,
sand alone is not often used for bioretention cell media7. In addition, total nitrogen
removal does not always indicate nitrate removal. Previous laboratory and pilot scale
studies conducted on bioretention devices showed 50-75% removal of total Kjeldahl
nitrogen and 60-80% removal of ammonium, but lower nitrate removal 4. This
inconsistency in nitrate reduction across bioretention cell applications has inspired the
research and design of engineered bioretention media 8. Bioretention cells are mainly
4
composed of sand mixed with small amounts of organic matter, silts, and clays 6. The fine
particles, specifically clays, not only allow for adsorption, but also reduce the naturally
high hydraulic conductivity of sand itself to further facilitate water quality improvement.
1.2 NANOCLAYS
Physicochemical treatment of pollutants has been explored through a variety of
technologies, with adsorption on solid adsorbents producing efficient and cost-effective
results. For wastewater applications, activated carbon is the most widely used adsorbent
but has decreased in popularity due to its high cost. Instead, clays have begun to gain
popularity for not only their lower cost, but also for their high surface area available for
adsorption as well as for their mechanical and chemical stability.9
Adsorption of various pollutants on clay minerals has been studied, showing the potential
this material has for removing pollutants from water. One study showed that a clay’s
specific surface area and porosity largely affect the adsorption capacity of benzene, a
volatile organic compound 10. Clay has also been found to be an effective adsorbent for
inorganics, including heavy metals and phosphate, which is a parallel to nitrate 11,12. The
removal of nitrate itself by clay has also been studied (Ouardi study), showing that an
increase in pH decreases the adsorption capacity of the clay, and a higher clay to
pollutant ratio increases adsorption of nitrate3. The clay used for the Ouardi study was
composed of Kaolinite, Illite, Quartz and Calcite with a surface area of 53.47 m2/g, and
has many porous and microporous particles that created cavities, providing binding sites
for nitrate 3. Another study by Bekele et al. conducted on Ethiopian bentonite clay also
analyzed its ability to remove nitrate ions, finding that 80% removal was possible if the
clay was subjected to HCl acid treatment and under optimal initial nitrate concentration,

5
clay dosage, contact time, temperature, and pH (250 mg/L, 2.0 g, 90 minutes, 30°C, 5,
respectively) 13.
Related to modifications of natural clay minerals, a study on nanoscale zero-valent iron
particles supported by natural Hangjin clay was conducted to analyze their capacity to
remove nitrobenzene from contaminated waters. The Hangjin clay supplemented with the
nanomaterial was found to be 93% effective at removing nitrobenzene, while the clay
alone and the nanomaterial alone resulted in 38% removal and 52% removal,
respectively. The synergistic effect of combining the nanomaterial with the clay was
attributed to an even distribution of the nanoscale zero-valent iron particles on the clay,
making them more efficient and more capable of adsorption with the clay support.14
Nanotechnology is an emerging method to solve several issues in a variety of fields, from
medicine to food preservation. Within this field, scientists have discovered that
nanotechnology can also be applied to solve environmental problems, one of them being
removing pollutants from water.15 Combining the properties of nanomaterials and clay
minerals is the focus of this study, building on findings from previous experiments.
These previous studies all show a similar trend that a high surface area has a significant
effect on the ability of the material to adsorb pollutants. Because nanomaterials are
known to have a high surface area, it is expected that they will also show high sorption
characteristics. Their capacity to adsorb nitrates will be explored in batch adsorption and
column breakthrough experiments. Although there have been studies that modify a clay
with nanomaterials, adsorption on nanoclays themselves has not been explored widely.
The hydraulic conductivity of soil amended with nanoclays will also be determined to
assess the feasibility of implementing this material as a soil amendment for LIDs since
6
fine particles such as clays can reduce hydraulic conductivity, but a high hydraulic
conductivity is important for infiltration in LID facilities. An effective nanoclay-based
soil amendment would provide high nitrate sorption characteristics at a low enough
loading that the effect on the hydraulic conductivity of the overall soil mixture is
minimal.

7
CHAPTER 2: MATERIALS AND METHODS
Batch adsorption studies and column breakthrough experiments were conducted on
several different types of clays to analyze their ability to adsorb nitrate. The goal of the
batch adsorption study was to determine the time required for each clay to reach its
greatest potential of decreasing nitrate concentration. The column breakthrough
experiments had a similar goal, but assessed through the number of pore volumes passed
through a soil column before the clay-amended soil could not retain any more nitrate. The
sections below describe the materials and methods used to accomplish these goals.
2.1 MATERIALS
The clays used in this study were four different nanoclays along with kaolin clay. The
nanoclays used were two pre-modified montmorillonite clay bases, while the other two
were unmodified halloysite nanoclay and unmodified hydrophilic bentonite. The clays
were purchased from Sigma Aldrich, which provided basic product specifications for the
unmodified halloysite nanoclay, and the sizes of the pre-modified nanoclays and the
unmodified hydrophilic bentonite, as shown in Table 1 below.
8
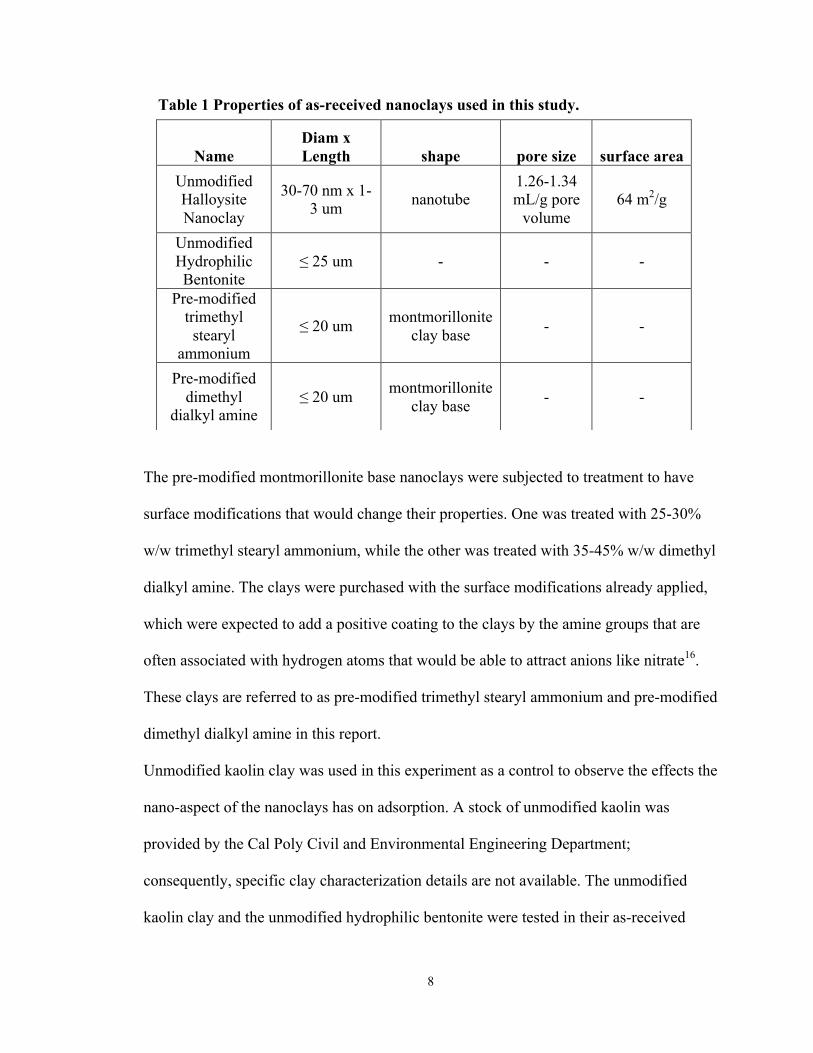
Table 1 Properties of as-received nanoclays used in this study.
The pre-modified montmorillonite base nanoclays were subjected to treatment to have
surface modifications that would change their properties. One was treated with 25-30%
w/w trimethyl stearyl ammonium, while the other was treated with 35-45% w/w dimethyl
dialkyl amine. The clays were purchased with the surface modifications already applied,
which were expected to add a positive coating to the clays by the amine groups that are
often associated with hydrogen atoms that would be able to attract anions like nitrate16.
These clays are referred to as pre-modified trimethyl stearyl ammonium and pre-modified
dimethyl dialkyl amine in this report.
Unmodified kaolin clay was used in this experiment as a control to observe the effects the
nano-aspect of the nanoclays has on adsorption. A stock of unmodified kaolin was
provided by the Cal Poly Civil and Environmental Engineering Department;
consequently, specific clay characterization details are not available. The unmodified
kaolin clay and the unmodified hydrophilic bentonite were tested in their as-received
Name Diam x Length shape pore size surface area
Unmodified Halloysite Nanoclay
30-70 nm x 1-3 um nanotube
1.26-1.34 mL/g pore
volume 64 m2/g
Unmodified Hydrophilic Bentonite
≤ 25 um - - -
Pre-modified trimethyl
stearyl ammonium
≤ 20 um montmorillonite clay base - -
Pre-modified dimethyl
dialkyl amine ≤ 20 um montmorillonite
clay base - -
9
form, but were also subjected to hydrochloric (HCl) acid modification (procedure
discussed in Section 2.2.A) to observe any changes in their adsorption capacity. The
reagent-grade HCl acid was purchased from Fisher Science.
To prepare the initial nitrate concentration introduced to the clays, both sodium nitrate
and potassium nitrate were used. The sodium nitrate (CAS number 7631-99-4) was
purchased from Fisher Science, while the potassium nitrate (CAS number 7757-79-1)
was purchased from JT Baker Chemical Company (now available through Fisher
Science).
The soil used as the base material for the column breakthrough experiment was Nevada
Sand purchased from the Gordon Sand Company in 1997 by Cal Poly. It is a fine,
uniform sand with a coefficient of uniformity of 1.06 and a mean grain diameter of 0.15
mm 17. For further characterization of the sand, the specific gravity was determined
through geotechnical analysis, as explained in Section 2.2.B.
2.2 TREATMENT AND CHARACTERIZATION METHODS
The ultimate goal of this research is to determine the feasibility of applying an effective
clay material to an LID facility, which will likely involve infiltration through various
soils. Therefore, several types of nanoclays were tested, of which some were treated to
achieve surface modifications that may help with nitrate adsorption, to determine the best
clay material. Geotechnical analysis was also conducted to characterize the clay and soil
materials used in this experiment for implementation in practical applications. The
surface modification and geotechnical analysis methods are explained in Section 2.2.A
and Section 2.2.B, respectively.

10
2.2.1 SURFACE MODIFICATION
The unmodified kaolin and hydrophilic bentonite clays were surface modified with HCl
acid to observe any changes in adsorption behavior, following a procedure developed by
others 13. Briefly, 5 grams of the as-received clay material was mixed with 25 mL of 2M
HCl acid solution in a temperature controlled oil bath for 3 hours at 80⁰C. The treated
clays were then cleaned using one of two different methods. For Method A, the HCl-clay
mixture was filtered repeatedly in a vacuum filtration assembly with DI water until the
pH of the rinse water reached 5-6. The treated clay was captured on a 0.2 µm
nitrocellulose membrane. For Method B, the HCl-clay solution was split up into a few 50
mL falcon tubes, mixed with DI and sonicated with a probe sonicator (Bruker Nano Opt
Interferometer, serial # NPF-11-209) to allow for adequate mixing, then centrifuged
(Thermo Fisher Scientific, Sorvail Legend XTR, serial # 41291964) until the supernatant
had separated from the clay. The supernatant was removed with a pipette, while the clay
remained in the tube. Fresh DI water was then added to the tube and the procedure was
repeated until the pH of the supernatant reached 5-6. After the clay was adequately
rinsed, it was placed in glass petri dishes and oven dried at 105⁰C for approximately 24
hours.
2.2.2 GEOTECHNICAL TESTING
To characterize the base material used for the breakthrough experiment (discussed in
Section 2.3.B), a specific gravity test was conducted on the Nevada Sand. The specific
gravity test was conducted according to the ASTM D854 Test Method.
The hydraulic conductivity of the Nevada Sand, as well as that of the soil amendments
(discussed in Section 2.3.B), was tested to assess the feasibility of implementing the
nanoclay as a filtration device. The hydraulic conductivity was determined by the falling
11
head test, which has not been standardized by ASTM as of 1991, but can be referenced to
the constant head test, ASTM D 2434-68 and AASHTO T 215-70.
2.3 EXPERIMENTAL PROCEDURES
The adsorption behavior of the different nanoclays was studied in both batch and column
experiments, with the results of the batch experiment paving the testing parameters for
the column experiment. Quality assurance and quality control (QA/QC) practices to
ensure reliable data were utilized, as discussed in Section 2.4.
2.3.1 BATCH ADSORPTION
A batch adsorption experiment was conducted to determine the nitrate sorption capability
of the four nanoclays compared to the unmodified kaolin clay, which served as a control.
The batch adsorption study was conducted in two phases, with the second phase refined
by the results of the first. In the first phase, a 50 mg/L NO3-N solution was prepared
using sodium nitrate. 35 mL of this nitrate solution were mixed with either 35 grams or
70 grams of clay (221:1 or 110:1 mg of nitrate to gram of clay, respectively), in a 50 mL
falcon tube. Falcon tubes were shaken using a shaker table (Brunswick Incubator Shaker,
model # 3530) for specific intervals ranging from 1 hour to 5 days.
In the second phase of the sorption study, a 1.42 mg/L nitrate solution (NO3-N) was
prepared using potassium nitrate, and mixed with 35 mg of clay material to achieve a
final ratio of 6.25 mg nitrate: 1 g of clay (and a 1:1 ratio of grams of clay to mL of
solution). In the second phase, shorter time intervals were used for shaking the
clay/nitrate mixtures, ranging from 1 to 120 minutes, based on the experiment conducted
by Ouardi et al (2015) and findings from Phase 1.
For both phases, after the clay was mixed with the nitrate solution, the mixture was
immediately sonicated using the probe sonicator for 10-20 seconds, or until no visible

12
clay particles remained in the solution. The content appeared milky in the falcon tube,
which was assumed to mean the clay particles were dispersed in the solution in their nano
form. This step was crucial to ensure that any aggregate clumps of the nanomaterials
were broken up, allowing full benefit of the nanoscale size of the materials.
After shaking at about 325 rpm on the shaker table for the specific time intervals, sample
tubes were put into the centrifuge for 1-5 minutes at a speed of 7,500-10,000 rpm, or until
the clay had attached to the side of the tube and no particles were visible in the
supernatant. The supernatant was then either immediately put into an ion chromatography
system (IC) and IC autosampler system (Dionex, ICS-1600; AS-DV Serial # 15022516)
for nitrate analysis, or they were sealed with the falcon tube cap and refrigerated for up to
2 days until IC analysis was conducted (discussed in Section 2.4).
2.3.2 COLUMN BREATHROUGH EXPERIMENTS
The column breakthrough experiments were conducted using a permeameter of height
2.98 inches and diameter of 2.43 inches, which was utilized as a small column. This
column allowed for observation of the breakthrough concentration after various pore
volumes of nitrate solution passed through the experimental soil mixture. The Nevada
Sand served as the base material to which 0.1% w/w and 1% w/w of nanoclay or
unmodified kaolin clay (which served as the baseline for comparison) was added. The
cylinder in the permeameter held a mass of 346.5 grams of Nevada Sand, which had a dry
weight of 344.19 grams. For the 0.1% w/w and 1% w/w soil amendments, tested clays
were weighed to 0.34419 grams and 3.4419 grams, respectively, and sonicated with about
35 mL of DI water right before mixing with the Nevada Sand. A control of Nevada Sand
with no clay amendment was tested as well.
13
The 0.1% w/w unmodified kaolin clay sonicated with DI water was added to 346.5 grams
of Nevada Sand and mixed with a spoon, adding DI water as necessary to ensure the
entire mass of clay was incorporated into the Nevada Sand. The consistency of the
mixture was moist, but not pooling with water. This mixture was packed into the
permeameter, and flushed with the top of the cylinder.
The burette attached to the permeameter apparatus was first filled with DI water, and the
contents collected after 1 pore volume, 96.5 mL, and after 4 pore volumes to analyze
background nitrate concentrations existing in the mixture. The burette was then filled
with 1.7 mg/L NO3-N solution and several pore volume samples were collected, ranging
from 0.25-20 pore volumes, based on the porosity of pure Nevada Sand. This procedure
was repeated for the 1% w/w unmodified kaolin clay sample and the 0.1% w/w and 1%
w/w pre-modified trimethyl stearyl ammonium samples.
2.3.3 ANALYTICAL METHODS
To analyze the capacity of the various clays to adsorb nitrate, the nitrate concentration
introduced initially to the system and the concentration at the end of the time interval or
pore volume were compared using the IC, as specified in Section 2.3.A.
The IC analyzes samples by producing a curve with a specific area that corresponds to a
concentration, which is determined by creating a calibration curve. The calibration curve
was created by running known concentrations ranging from 0 mg/L NO3-N to 100 mg/L
NO3-N through the IC, which resulted in corresponding curves and their areas. A graph
of area vs. concentration was created to determine the best fit line and its equation (see
Appendix). This equation was used to determine each unknown nitrate concentration
from the known area resulting from the IC analysis.

14
2.4 QUALITY ASSURANCE AND QUALITY CONTROL
Both the batch experiment and the column experiment were tested with QA/QC
parameters to serve as a check for any discrepancies, background behavior, and the
accuracy and precision of the data collected.
Phase 1 of the batch experiment was conducted in triplicate for each time increment
tested, which aimed to identify any outliers and observe the fluctuations in concentration
that the clay may experience. Each time increment also included a single falcon tube that
was filled with nitrate solution-only without any clay to observe any adsorption onto the
falcon tubes. A split sample, or one identical sample to another, was tested through the IC
to check the process and machine operations to ensure precise data was collected. A
control verification standard (CVS) was also run through the machine for the same
purpose. The CVS was prepared from a stock with a known concentration of 25 mg/L
NO3-N, and was analyzed towards the beginning, middle, and end of the run to check the
entire IC run was operating correctly. If the CVS fell within ±10% of the expected
concentration, the data was assumed to be accurate.
Phase 2 of the batch experiment also included the CVS checks, splits, and nitrate-only
samples. However, the nitrate-only samples were collected for the last time increment
instead of every time increment tested. This was changed from Phase 1 because the last
time increment would be indicative of the entire process’s losses, deeming this control
unnecessary to test for every time increment. Controls with clay-only mixed with DI
water instead of nitrate solution, were also added to Phase 2 to determine if the tested
clays leached any background nitrate concentrations. This background nitrate
concentration would need to be subtracted from the IC nitrate concentration results, as
15
they would reflect nitrate concentrations from a source other than the nitrate solution as
well as the nitrate concentration remaining after it had adsorbed onto the clays.
Phase 2 included a combination of duplicate runs and triplicate runs, limited by the time
available for this study. Each run also included one sample tested in duplicate within the
run as a control parameter to check the process in that particular test. Duplicates and
triplicates were averaged and those values were used for analysis.
The column tests also included similar QA/QC processes, with duplicates for each trial
and CVS’s tested throughout the run. To test for background nitrate concentrations, the
sand-clay mixtures were first flushed with DI water only, instead of the nitrate solution,
and the effluent tested to observe if any nitrate leached. This analysis was conducted after
one pore volume of DI and after four-five pore volumes of DI as a test to see if more
nitrate leaching occurs as more water is flushed through the system. Another control,
sand-only without any clay mixed in, was flushed with DI water only then nitrate solution
to observe the capacity of the sand to retain any nitrate. This served as the control to
which the clay amendments would be compared to observe any changes in adsorption.
16
CHAPTER 3: RESULTS AND DISCUSSION
3.1 BACKGROUND NITRATE CONCENTRATION
As explained in Section 2.3.A, the batch adsorption study was conducted in two phases,
the second phase modified by findings from the first. The batch studies were followed by
the column studies that served as a bench-scale experiment for future implementation.
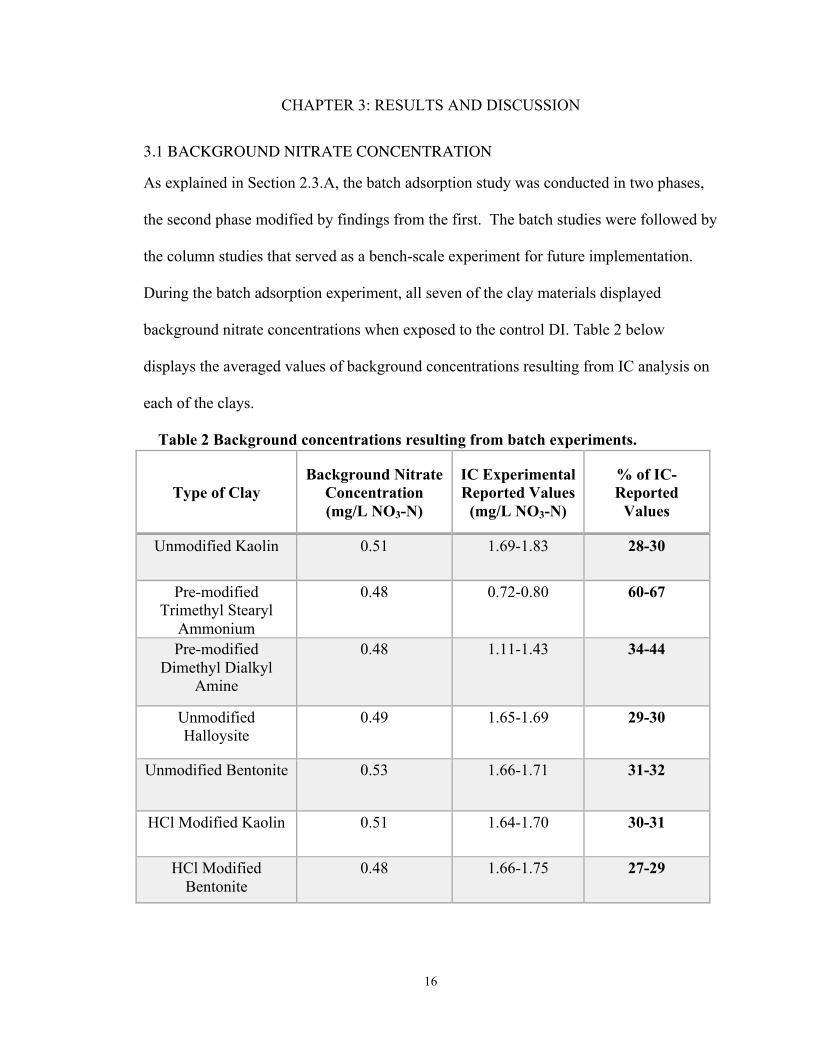
During the batch adsorption experiment, all seven of the clay materials displayed
background nitrate concentrations when exposed to the control DI. Table 2 below
displays the averaged values of background concentrations resulting from IC analysis on
each of the clays.
Table 2 Background concentrations resulting from batch experiments.
Type of Clay Background Nitrate
Concentration (mg/L NO3-N)
IC Experimental Reported Values
(mg/L NO3-N)
% of IC-Reported
Values
Unmodified Kaolin 0.51 1.69-1.83 28-30
Pre-modified Trimethyl Stearyl
Ammonium
0.48 0.72-0.80 60-67
Pre-modified Dimethyl Dialkyl
Amine
0.48 1.11-1.43 34-44
Unmodified Halloysite
0.49 1.65-1.69 29-30
Unmodified Bentonite 0.53 1.66-1.71 31-32
HCl Modified Kaolin 0.51 1.64-1.70 30-31
HCl Modified Bentonite
0.48 1.66-1.75 27-29
17
This table is indicative of the amount of nitrate inherent to the samples by sources other
than the introduced nitrate solution, both in terms of concentration and its relativity to the
total value reported by the IC. The last column in Table 2, “% of IC-Reported Values”,
shows that all seven clays have a background concentration of greater than 25% of the
total concentration reported by the IC for the samples taken at each time increment in
question. However, each clay’s IC analysis resulted in a value of about 0.50 mg/L NO3-
N, which is not expected as each clay has various chemical compositions, and therefore
this concentration may not be leaching from the clays themselves. The source of the
background nitrate concentration is unclear, as the DI blanks that were run through the IC
did not produce any detectable NO3-N concentrations, so the DI is likely not the source.
The surrounding air may be a factor that contributed to the total nitrate concentration, but
this was not confirmed in this experiment. If the clays are in fact the source of the
background nitrate concentration, this indicates that nitrates are inherent to the clay
materials tested and may be released in aqueous environments. Although the source was
not identified in this experiment, a background nitrate concentration was still reported by
the IC and therefore needed to be subtracted from the total reported IC values for both
Phase 1 and Phase 2 of the study. This showed a more accurate representation of the
clays’ ability to reduce external nitrate concentrations introduced via the nitrate solution
influent. The smaller of the range of percentages was used as a conservative estimate for
adsorption, subtracting less background nitrate concentration and therefore leaving a
larger portion of the IC result as the indication of the remaining nitrate concentration in
solution (see Appendix for example calculations).

18
The column experiments were also tested for background nitrate concentrations released
by the sand and clay mixtures by running DI water through the column prior to
introducing the nitrate solution. The results showed that the sand and clay mixtures also
contributed more than 25% of the initial NO3-N solution introduced, as shown in Table 3
below.
Table 3 Background concentrations resulting from column experiments.
Description of Soil Background Nitrate
Concentration (mg/L NO3-N)
Initial Nitrate Solution
Introduced (mg/L NO3-N)
% of Initial Nitrate Solution
Introduced
Nevada Sand Only 0.51 1.69 30
0.1% Trimethyl Stearyl Ammonium
0.47 1.69 28
1% Trimethyl Stearyl Ammonium
0.56 1.69 33
0.1% Kaolin 0.67 1.68 40
1% Kaolin 0.58 1.68 34
For this set of data, however, the background nitrate concentrations were not subtracted
during analysis of the number of pore volumes reached at breakthrough. Because the
column experiments were aimed at reflecting a real-world scenario in which these soil
amendments would be applied to a filter media, the background nitrate concentrations (if
leached by the clays) would also be released and would therefore reach breakthrough
sooner than if these concentrations were taken out for this analysis. Therefore, for the
goals of this aspect of the study, the background concentrations remained intact.
19
3.2 PRELIMINARY SORPTION STUDIES
Phase 1 served as the preliminary study that was refined in Phase 2 (discussed in Section
3.3) to obtain more conclusive findings. Phase 1 conducted studies on unmodified kaolin
as a control and unmodified halloysite as a representative nanoclay, to learn about the
general time needed to decrease nitrate concentration and reach equilibrium.
The unmodified kaolin clay study used a starting concentration of 50 mg/L NO3-N, in
contact with either 35 mg or 70 mg of unmodified kaolin. The effect of clay dosage was
tested to observe any differences in adsorption behavior. First, 35 mg of unmodified
kaolin, then 70 mg of unmodified kaolin were exposed to 50 mg/L NO3-N for 4-5 days
(96-120 hours) of contact time, resulting in a ratio of 221 mg of nitrate: 1 g of clay
(221:1) and 110 mg of nitrate: 1 g of clay (110:1), respectively. This nitrate
concentration is significantly higher than environmentally relevant nitrate concentrations
in stormwater runoff.
Note that Phase 2 was adjusted to reflect typical nitrate concentrations in surface waters,
which range from about 0.1 mg/L to 2.10 mg/L 18,19. Therefore, an initial nitrate
concentration of 1.42 mg/L NO3-N was prepared and shaken with 35 mg of unmodified
kaolin (resulting in the ratio 6.25 mg nitrate: 1 g clay or 6.25:1). The expectation was that
a lower nitrate loading rate that is more reflective of real world scenarios would result in
more adsorption, due to the fewer number of nitrate molecules competing for adsorption
sites on the clay. The Phase 2 ratio results are included in Figure 1 for comparison.
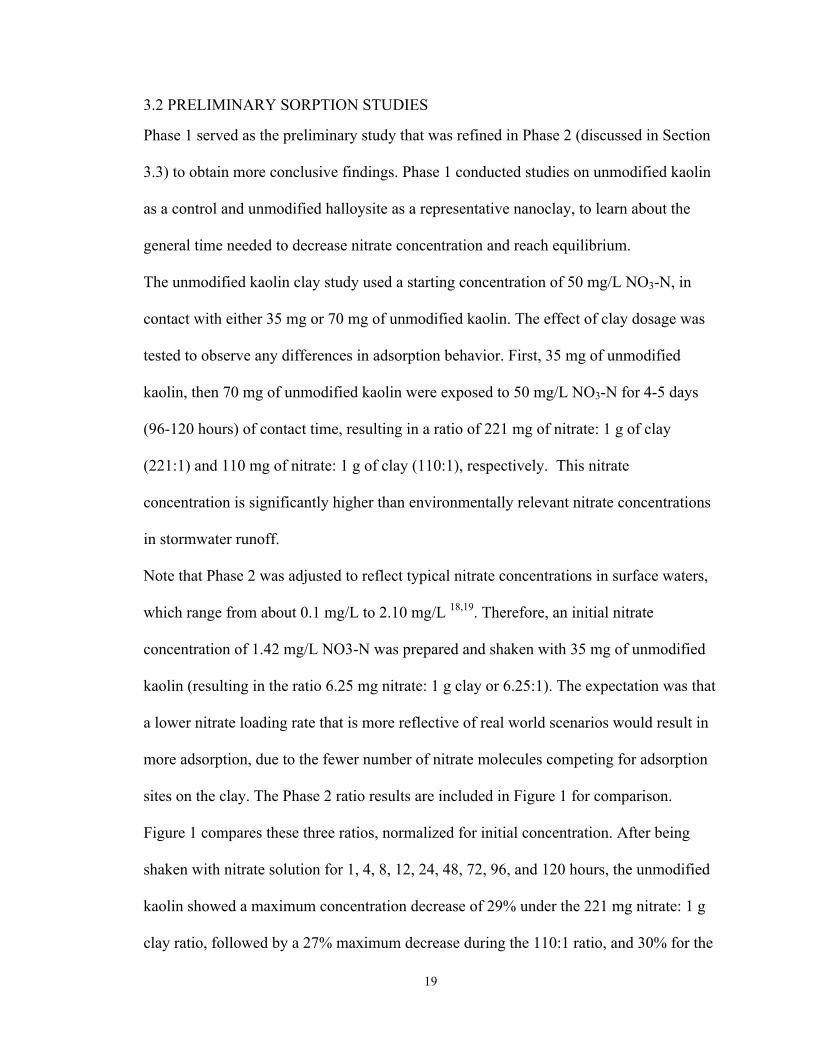
Figure 1 compares these three ratios, normalized for initial concentration. After being
shaken with nitrate solution for 1, 4, 8, 12, 24, 48, 72, 96, and 120 hours, the unmodified
kaolin showed a maximum concentration decrease of 29% under the 221 mg nitrate: 1 g
clay ratio, followed by a 27% maximum decrease during the 110:1 ratio, and 30% for the
20
6.25:1 ratio. The minor fluctuation of 1-2% can be ignored and assumed that all three
ratios have similar adsorption capacities. These results show that various nitrate to clay
loading ratios used in this study did not make a significant impact on unmodified kaolin
clay’s adsorption capacity. This may imply that unmodified kaolin is capable of
adsorbing about 30% of nitrate in runoff that flows through it, irrespective of the initial
concentration.
Figure 1 Comparison of unmodified kaolin adsorption at different nitrate to clay ratios.
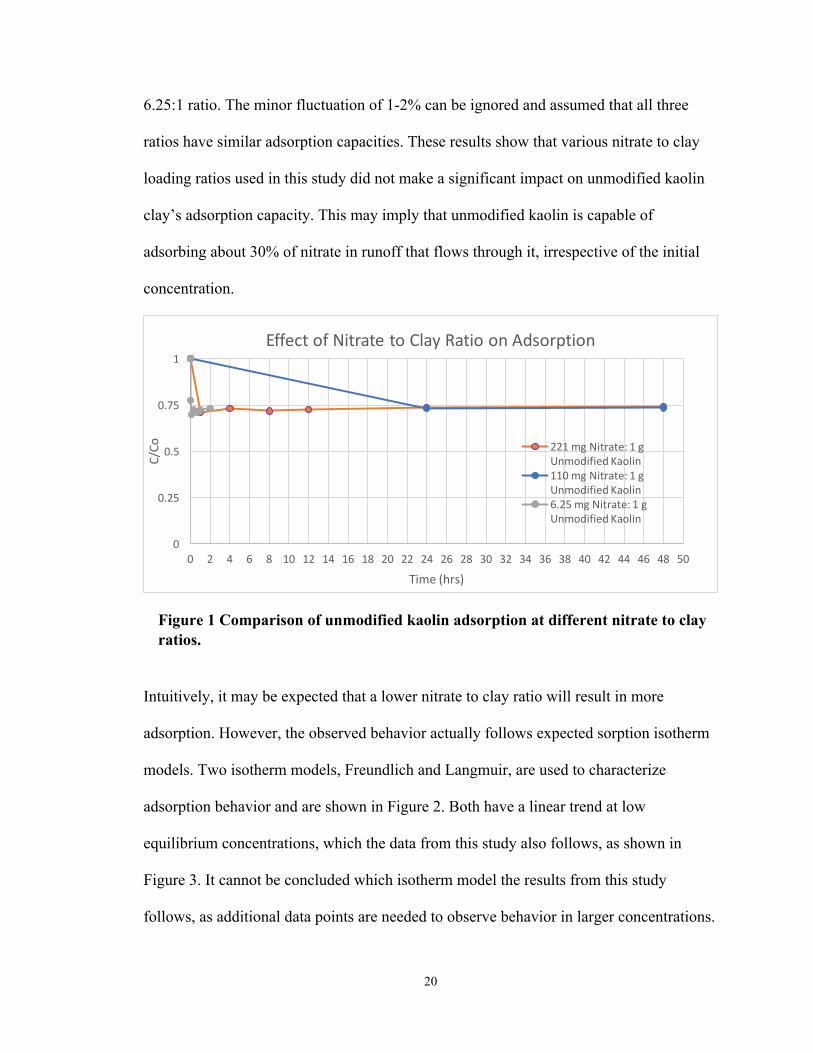
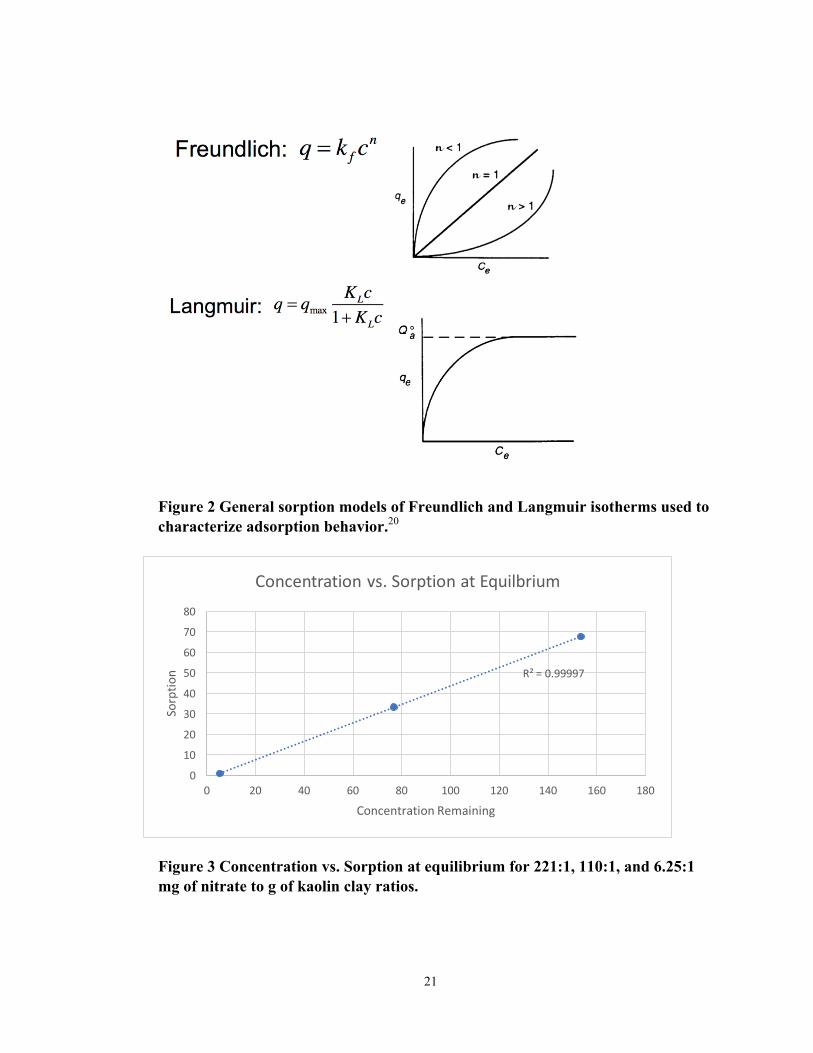
Intuitively, it may be expected that a lower nitrate to clay ratio will result in more
adsorption. However, the observed behavior actually follows expected sorption isotherm
models. Two isotherm models, Freundlich and Langmuir, are used to characterize
adsorption behavior and are shown in Figure 2. Both have a linear trend at low
equilibrium concentrations, which the data from this study also follows, as shown in
Figure 3. It cannot be concluded which isotherm model the results from this study
follows, as additional data points are needed to observe behavior in larger concentrations.
0
0.25
0.5
0.75
1
0 2 4 6 8 10 12 14 16 18 20 22 24 26 28 30 32 34 36 38 40 42 44 46 48 50
C/Co
Time(hrs)
EffectofNitratetoClayRatioonAdsorption
221mgNitrate:1gUnmodifiedKaolin110mgNitrate:1gUnmodifiedKaolin6.25mgNitrate:1gUnmodifiedKaolin
21
Figure 2 General sorption models of Freundlich and Langmuir isotherms used to characterize adsorption behavior.20
Figure 3 Concentration vs. Sorption at equilibrium for 221:1, 110:1, and 6.25:1 mg of nitrate to g of kaolin clay ratios.
R²=0.99997
0
10
20
30
40
50
60
70
80
0 20 40 60 80 100 120 140 160 180
Sorptio
n
ConcentrationRemaining
Concentrationvs.SorptionatEquilbrium
22
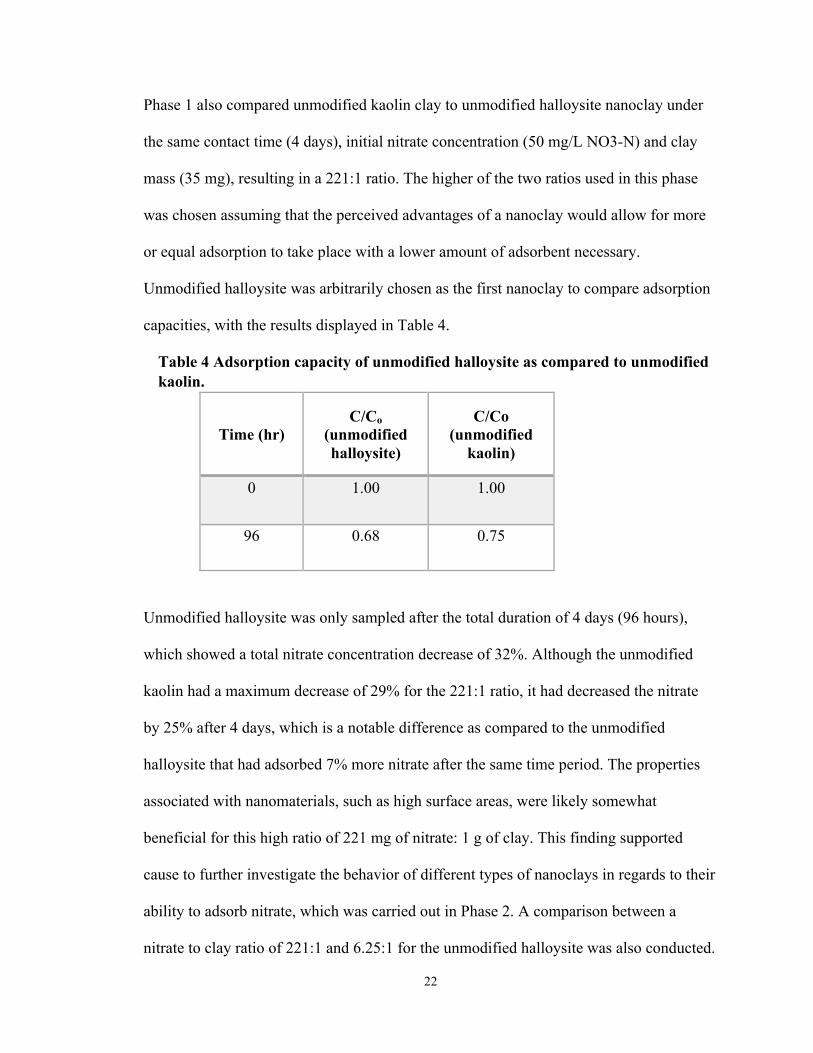
Phase 1 also compared unmodified kaolin clay to unmodified halloysite nanoclay under
the same contact time (4 days), initial nitrate concentration (50 mg/L NO3-N) and clay
mass (35 mg), resulting in a 221:1 ratio. The higher of the two ratios used in this phase
was chosen assuming that the perceived advantages of a nanoclay would allow for more
or equal adsorption to take place with a lower amount of adsorbent necessary.
Unmodified halloysite was arbitrarily chosen as the first nanoclay to compare adsorption
capacities, with the results displayed in Table 4.
Table 4 Adsorption capacity of unmodified halloysite as compared to unmodified kaolin.
Time (hr) C/Co
(unmodified halloysite)
C/Co (unmodified
kaolin)
0 1.00 1.00
96 0.68 0.75
Unmodified halloysite was only sampled after the total duration of 4 days (96 hours),
which showed a total nitrate concentration decrease of 32%. Although the unmodified
kaolin had a maximum decrease of 29% for the 221:1 ratio, it had decreased the nitrate
by 25% after 4 days, which is a notable difference as compared to the unmodified
halloysite that had adsorbed 7% more nitrate after the same time period. The properties
associated with nanomaterials, such as high surface areas, were likely somewhat
beneficial for this high ratio of 221 mg of nitrate: 1 g of clay. This finding supported
cause to further investigate the behavior of different types of nanoclays in regards to their
ability to adsorb nitrate, which was carried out in Phase 2. A comparison between a
nitrate to clay ratio of 221:1 and 6.25:1 for the unmodified halloysite was also conducted.
23
The lower ratio resulted in a maximum concentration decrease of 30%, as compared to
the 32% decrease observed with the higher ratio. This finding supports that changing
nitrate to clay ratios does not significantly affect the adsorption capacity of unmodified
halloysite for nitrate, in agreement with the findings for unmodified kaolin in this study.
Phase 1 also identified that 1 hour is sufficient time to reach the equilibrium point for
adsorption. Figure 1 shows that the nitrate concentration remains fairly constant after the
1-hour sample, with minor fluctuations occurring for the remainder of the time
increments. This was further explored in Phase 2, during which shorter time increments
were tested to identify more specifically the time at which the nitrate concentration
decreases.
3.3 SORPTION EFFECTS OF VARIOUS CLAY MATERIALS
For Phase 2 of the batch adsorption study, nitrate adsorption was tested on seven different
clay surfaces. The surfaces chosen were the four as-received nanoclays (pre-modified
trimethyl stearyl ammonium, pre-modified dimethyl dialkyl amine, unmodified
halloysite, and unmodified hydrophilic bentonite), the two HCl acid modified clays (HCl
modified hydrophilic bentonite nanoclay and HCl modified kaolin clay), and unmodified
kaolin clay as a control. The seven clays were shaken for a maximum of 120 minutes,
with samples collected intermittently to observe the effects of contact time on adsorption,
as shown in Figure 4. For this phase, the nitrate to clay ratio was 6.25:1, while the clay
mass to solution volume ratio was 1 mg: 1 mL.

24
Figure 4 Average nitrate adsorption capacity of clay materials during Phase 2. Background nitrate concentration has been removed (See Appendix).
The initial NO3-N concentration was to be 1.42 mg/L of NO3-N, but due to standard
laboratory limitations, the nitrate solution prepared was between 1.6 -1.9 mg/L NO3-N
according to IC analysis, which still falls within the range of typical concentrations found
in stormwater. This results in a ratio of about 7.09-8.41 mg of nitrate: 1 g of clay, which
is slightly higher than that which was originally expected (6.25 mg of nitrate: 1 g of clay).
Figure 4 presents normalized concentration over time to account for these slight
variations in initial concentration.
Despite the slight variation in starting concentration, analysis can still be conducted on
the various clays as the trend is still a reflection of clay behavior. The seven clays were
all shaken for 1, 5, 20, 40, 60, and 120-minute time intervals to observe the range of
adsorption behaviors with changing contact times. Phase 1 showed that equilibrium was
0
0.2
0.4
0.6
0.8
1
1.2
0 20 40 60 80 100 120 140
C/Co
Time(min)
NitrateAdsoptiononVariousClayMaterials
UnmodifiedKaolin
UnmodifiedHalloysite
UnmodifiedHydrophilicBentonite
PremodifiedTrimethylStearylAmmonium
PremodifiedDimethylDialkylAmine
HClModifiedKaolin
HClModifiedHydrophilicBentonite
25
reached by the first time increment tested at 60 minutes; Phase 2 tested shorter time
intervals to observe whether equilibrium was reached prior to the 60-minute mark found
in Phase 1. All seven clays displayed the steepest decline after immediate contact of 1-5
minutes, indicating that the main adsorption occurs fairly quickly after contact with the
clay. The clays then reach equilibrium by the 20-minute sample, after which the
concentration remains fairly constant for the remainder of the time sampled.
Achieving equilibrium by 20 minutes was not expected, as two previous studies found
that equilibrium was reached at approximately 180 minutes 3 or after 90 minutes 13. These
two previous studies had similar environmental parameters as were used in this study
with a temperature of 20-30ºC and a pH of about 5, but different clay types were used.
The Bekele study used an Ethiopian bentonite clay13, while the Ouardi study used a
Moroccan clay mineral that is made up of Kaolinite, Illite, Quartz and Calcite3. The clays
used in this study were similar species, but not the identical sources, potentially affecting
both sorption behavior and other characteristics. The clays tested in this study have
different surface properties and characteristics arising from their nano-size that may have
prompted them to fill up their sites available for adsorption more quickly than those clays
used in the previous studies.
Additionally, this study found more nitrate reduction could be achieved by one of the pre-
modified nanoclays tested (86%), compared to the 80% decrease achieved by the Bekele
study and the 72% decrease by the Ouardi study. As shown in Figure 3, none of the seven
clays completely removed nitrate. Although the starting concentration and the nitrate to
clay ratio was fairly low, the clays were not able to treat it completely. This implies that
26
these particular clays may not have the capacity to retain all of the nitrate they are
exposed to on their surfaces.
The pre-modified trimethyl stearyl ammonium showed the greatest nitrate adsorption
capacity out of the seven clays tested, reaching a maximum of 86% decrease in NO3-N
concentration. The maximum removal was achieved after 40 minutes of contact time, but
remained above 80% removal throughout the 120-minute span of the experiment. Such a
high nitrate removal can be attributed in part to this nanoclay’s surface properties brought
about from the trimethyl stearyl ammonium modification. This modification is associated
with producing cations on the surface of the material and adding a positive surface charge
by way of the plentiful hydrogen atoms linked with its methyl (CH3)21, stearyl (CxHx)22,
and ammonium (NH4) groups23. The overall positive charge resulting from this
modification likely facilitated adsorption of the negatively-charged nitrate ions.
The other pre-modified nanoclay, dimethyl dialkyl amine, was the second-most effective
adsorbent, decreasing the nitrate concentration by a maximum of 66%. This result can
also be attributed in part to its modified surface properties. The surface modification
added an overall positive charge to the nanoclay23, allowing for the nitrate to bind more
effectively to it. However, it was less effective than the trimethyl stearyl ammonium
modification, possibly because there may have been less hydrogen atoms applied in this
modification. The fewer number of hydrogen atoms on the surface of the pre-modified
dimethyl dialkyl amine nanoclay may explain why fewer nitrates were able to bind to it.
In addition to the surface treatment design that increases anionic sorption, both of these
nanoclays have a montmorillonite clay base, which also has properties that favor nitrate
adsorption. Montmorillonite is composed of silica tetrahedral sheets surrounding an
27
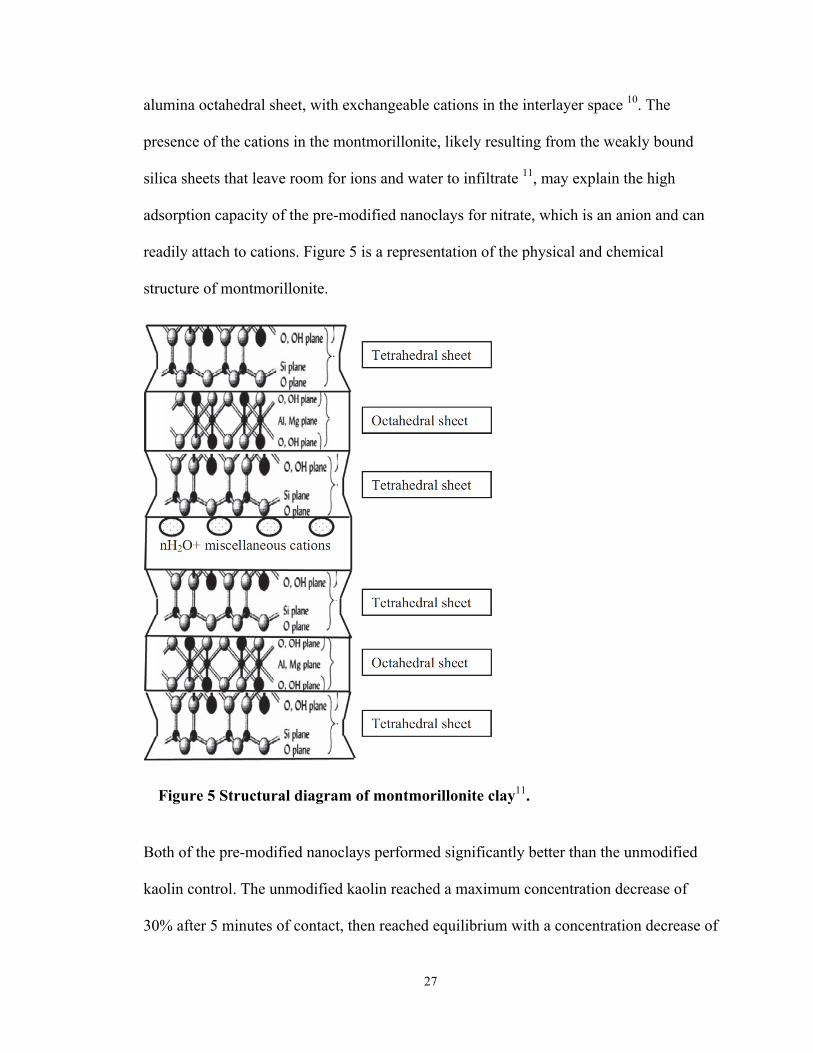
alumina octahedral sheet, with exchangeable cations in the interlayer space 10. The
presence of the cations in the montmorillonite, likely resulting from the weakly bound
silica sheets that leave room for ions and water to infiltrate 11, may explain the high
adsorption capacity of the pre-modified nanoclays for nitrate, which is an anion and can
readily attach to cations. Figure 5 is a representation of the physical and chemical
structure of montmorillonite.
Figure 5 Structural diagram of montmorillonite clay11.
Both of the pre-modified nanoclays performed significantly better than the unmodified
kaolin control. The unmodified kaolin reached a maximum concentration decrease of
30% after 5 minutes of contact, then reached equilibrium with a concentration decrease of
28
27-29%. This result shows that not only are there fewer sites available for adsorption on
the unmodified kaolin, but they are also taken up fairly quickly. Because kaolin has a
much lower cation exchange capacity compared to montmorillonite 24, this behavior was
expected.
Unmodified kaolin showed slightly less nitrate reduction than the other nanoclays as
well, with the exception of unmodified halloysite, which also had a maximum nitrate
reduction of approximately 30%. This result was different from the findings in Phase 1,
which showed that unmodified halloysite had decreased nitrate concentration by 7%
more than the unmodified kaolin. The difference between these two phases in regards to
unmodified halloysite and unmodified kaolin were the time periods tested and the nitrate
to clay ratios. Phase 1 determined that the tested nitrate to clay ratios were not a
significant factor affecting unmodified halloysite or kaolin adsorption, so the longer time
period of 4 days in Phase 1 versus the shorter time in Phase 2 may have affected their
adsorption behavior. The similar response by the two clays may be attributed to the
unmodified halloysite’s structural similarity to unmodified kaolin, as halloysite belongs
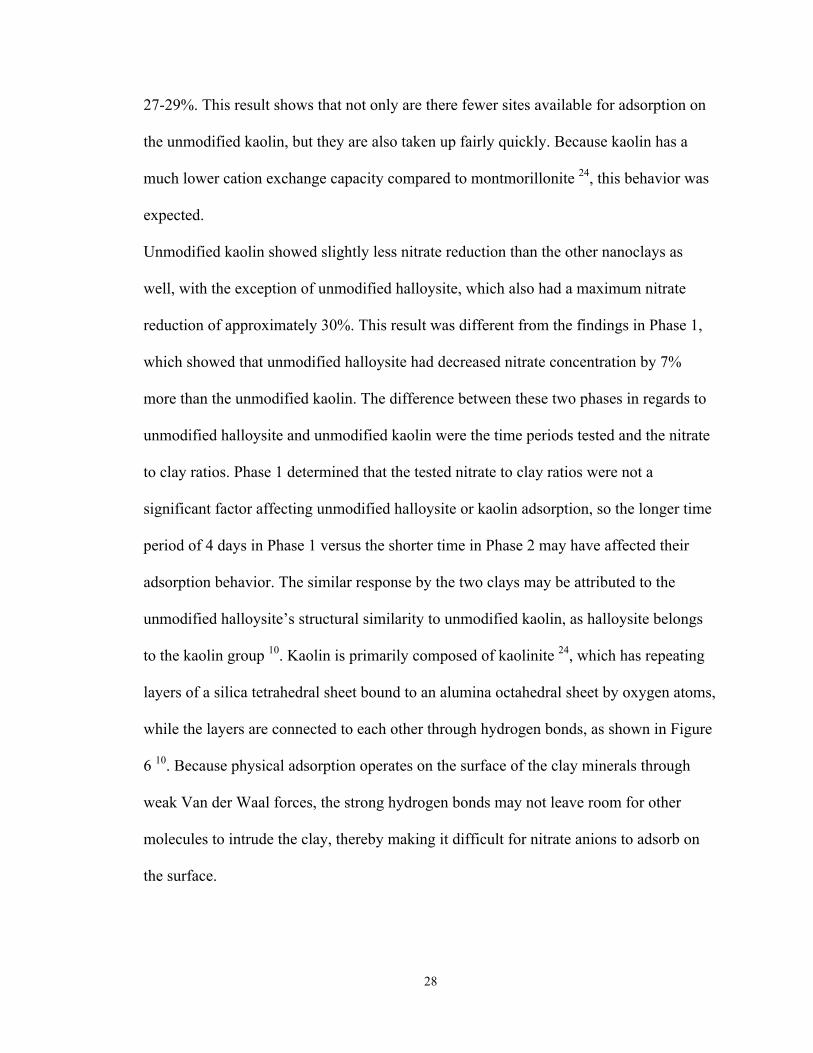
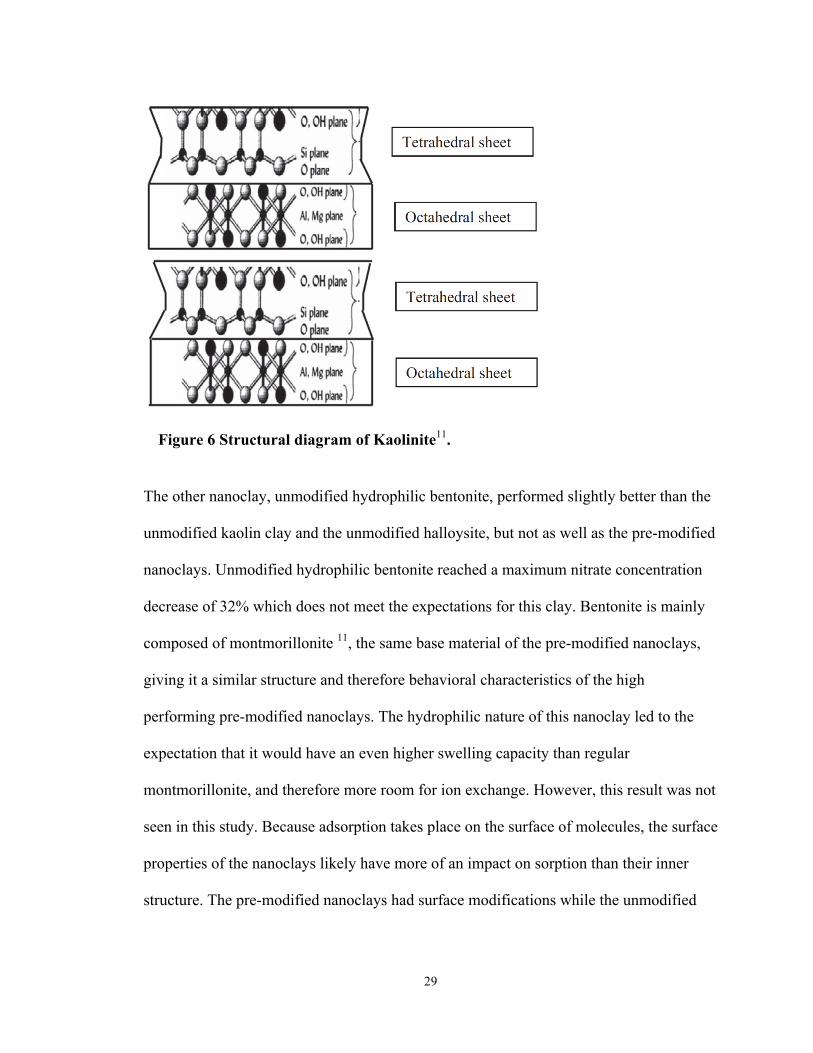
to the kaolin group 10. Kaolin is primarily composed of kaolinite 24, which has repeating
layers of a silica tetrahedral sheet bound to an alumina octahedral sheet by oxygen atoms,
while the layers are connected to each other through hydrogen bonds, as shown in Figure
6 10. Because physical adsorption operates on the surface of the clay minerals through
weak Van der Waal forces, the strong hydrogen bonds may not leave room for other
molecules to intrude the clay, thereby making it difficult for nitrate anions to adsorb on
the surface.
29
Figure 6 Structural diagram of Kaolinite11.
The other nanoclay, unmodified hydrophilic bentonite, performed slightly better than the
unmodified kaolin clay and the unmodified halloysite, but not as well as the pre-modified
nanoclays. Unmodified hydrophilic bentonite reached a maximum nitrate concentration
decrease of 32% which does not meet the expectations for this clay. Bentonite is mainly
composed of montmorillonite 11, the same base material of the pre-modified nanoclays,
giving it a similar structure and therefore behavioral characteristics of the high
performing pre-modified nanoclays. The hydrophilic nature of this nanoclay led to the
expectation that it would have an even higher swelling capacity than regular
montmorillonite, and therefore more room for ion exchange. However, this result was not
seen in this study. Because adsorption takes place on the surface of molecules, the surface
properties of the nanoclays likely have more of an impact on sorption than their inner
structure. The pre-modified nanoclays had surface modifications while the unmodified
30
bentonite did not, which may explain why the two pre-modified nanoclays performed
better than their unmodified counterpart.
To explore the effects surface modifications have on nanoclays, an HCl acid treatment
was applied to the unmodified kaolin control as well as the unmodified hydrophilic
bentonite. The surface treatment was modeled after a previous study that found an
optimal 80% nitrate reduction using surface-treated bentonite clay 13. The unmodified
hydrophilic bentonite was chosen because the reference study also used a type of
bentonite clay. Furthermore, as discussed above, bentonite is similar structurally to
montmorillonite clays which had previously shown successful sorption characteristics
after surface modification.
The HCl acid treatment was expected to enhance adsorption by increasing the number of
active sites on the clay through the addition of hydrogen ions, or a positive charge, by
way of the dissociation of hydrogen and chloride ions13. However, the surface treatment
did not seem to provide improved adsorption capabilities to the unmodified hydrophilic
bentonite or to the unmodified kaolin. The nitrate concentration decreased by
approximately 32% for both unmodified and HCl modified hydrophilic bentonite.
Similarly, the HCl modified kaolin showed only a 3% improvement compared to the
unmodified kaolin. These results were considered insignificant, as slight fluctuations in
adsorption are expected between sample analyses.
These results were unexpected, as a previous study found that the HCl acid treatment was
effective, showing an 80% decrease on the Ethiopian bentonite clay that the example
study examined as opposed to the 32% decrease found in this study13. However, the
chemical composition of bentonite clay found in various locations differs, making the
31
adsorption capacity for nitrate differ between bentonite clay types 13. The Ethiopian
bentonite used in the Bekele study was composed of 61% SiO2, 11.5% Al2O3, 6.9%
Fe2O3, and less than 5% of several other oxides by weight 13. The specific chemical
constituents and the geographical origin of the unmodified hydrophilic bentonite used in
this study were not provided by Sigma Aldrich, but assuming it is primarily composed of
montmorillonite, it could have had 57.41% SiO2, 15.66% Al2O3, 4.93% Fe2O3, and less
than 5% of other oxides 10 or 65.34% SiO2, 12.89% Al2O3, 2.38% Fe2O3, and less than
5% of other oxides 11 or numerous other variations of these chemicals. Characteristics of
clay materials differs from location to location, which is why these montmorillonite clays
have various compositions, and each will affect its properties and behavior towards other
constituents, including nitrate.
The procedure for this treatment was also slightly amended from the example study, as
the same resources and materials were not available. Specifically, the temperature
controller on the oil bath available had a temperature fluctuation of ± 20ºC, never
remaining at the target temperature of 80ºC, which was used in the reference study. This
may have also made a difference to the HCl acid treatment by not allowing for the
consistent temperature conditions for acid activation to take place on the nanoclay’s
surface.
This specific surface modification did not have the same effects as the surface
modifications that the pre-modified trimethyl stearyl ammonium and pre-modified
dimethyl dialkyl amine nanoclays had. The pre-modified nanoclays were subjected to
several constituents (methane, amine, alkyl groups) that likely had synergistic effects on
the montmorillonite nanoclay base and had several sources of hydrogen atoms, whereas
32
the HCl acid did not. The stronger proton treatment on the pre-modified nanoclays gave
them an adsorption advantage over the HCl treated clays, which should have still
performed better than shown in these results.
Overall, the nanoclays resulted in a higher adsorption capacity as compared to the
unmodified kaolin control, which can be attributed to the nanoclays’ large surface areas.
Nanomaterials are emerging in industry because of their advantageous properties and
behaviors that arise with their increased surface area. The pre-modified nanoclays tested
in this study are especially indicative of the advantages of nano-sized particles for
adsorption.
3.4 BREAKTHROUGH EXPERIMENTS AND HYDRAULIC CONDUCTIVITY
Hydraulic conductivity determines the feasibility of implementing a soil amendment for a
bioretention mechanism, as too low of a hydraulic conductivity will prevent adequate
infiltration needed to prevent flooding. As a comparison to Nevada Sand, Concrete Sand,
which is another media tested for use in biofiltration units, was found to have a hydraulic
conductivity of 42.2 in/hr. This is more than double that of Nevada Sand alone, and is a
very high infiltration rate for adequate water quality improvement. The Concrete Sand
was also not able to retain the clay in its mixture well, but instead washed out the clay
through its pores. Therefore, Concrete Sand was not used for the soil amendment. The
Nevada Sand, on the other hand, had a slower hydraulic conductivity as it is made up of
finer, more uniform particles. It was also able to trap the added clay minerals in its pores,
which was necessary for the column tests to determine its adsorption capability.
The Nevada Sand, which was found to have a specific gravity of 1.8 from the
geotechnical test conducted, was treated with 0.1% and 1% w/w of unmodified kaolin
clay and pre-modified trimethyl stearyl ammonium nanoclay to compare breakthrough
33
pore volumes. This test was conducted using an initial concentration of about 1.7 mg/L
NO3-N, and determined the number of pore volumes this solution could pass through the
different soil amendments before the same or higher concentration “broke through”. The
number of pore volumes reached at breakthrough indicate what this soil would be able to
handle during storm events. The larger number of pore volumes the soil is able to flush
the solution through before reaching breakthrough, the better the adsorption capacity of
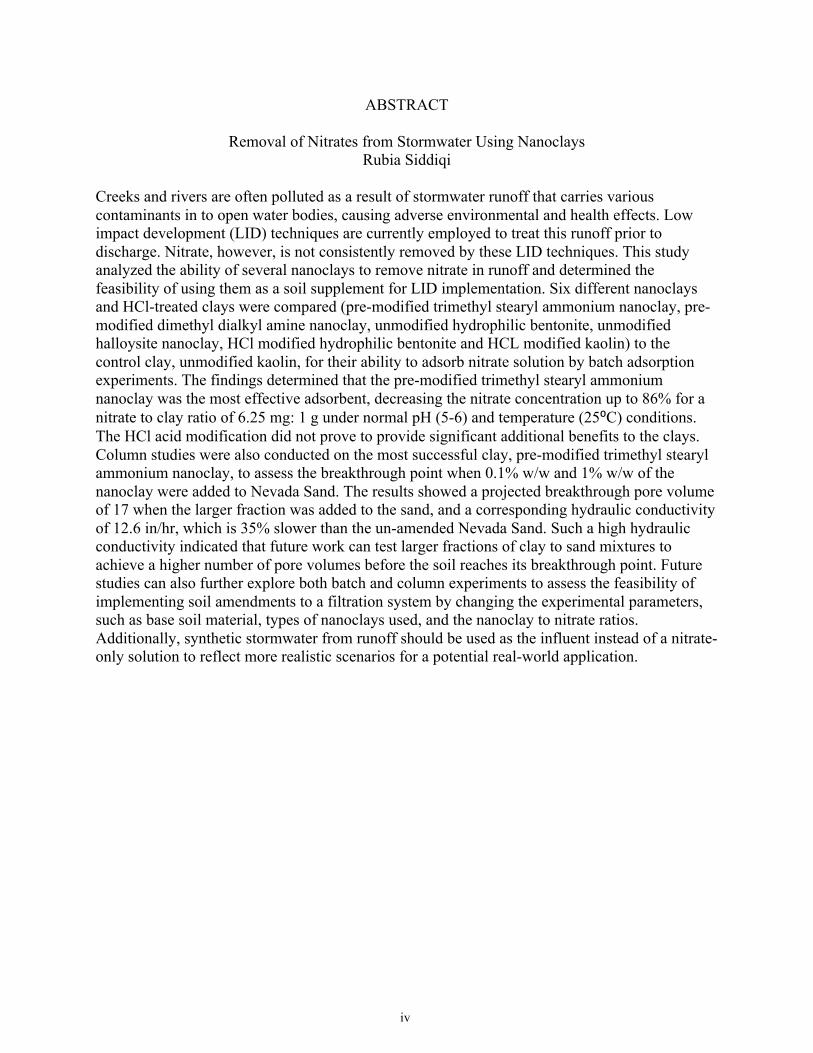
the soil. Figure 7 shows the breakthrough curves for the four experimental conditions
compared to the sand-only control.
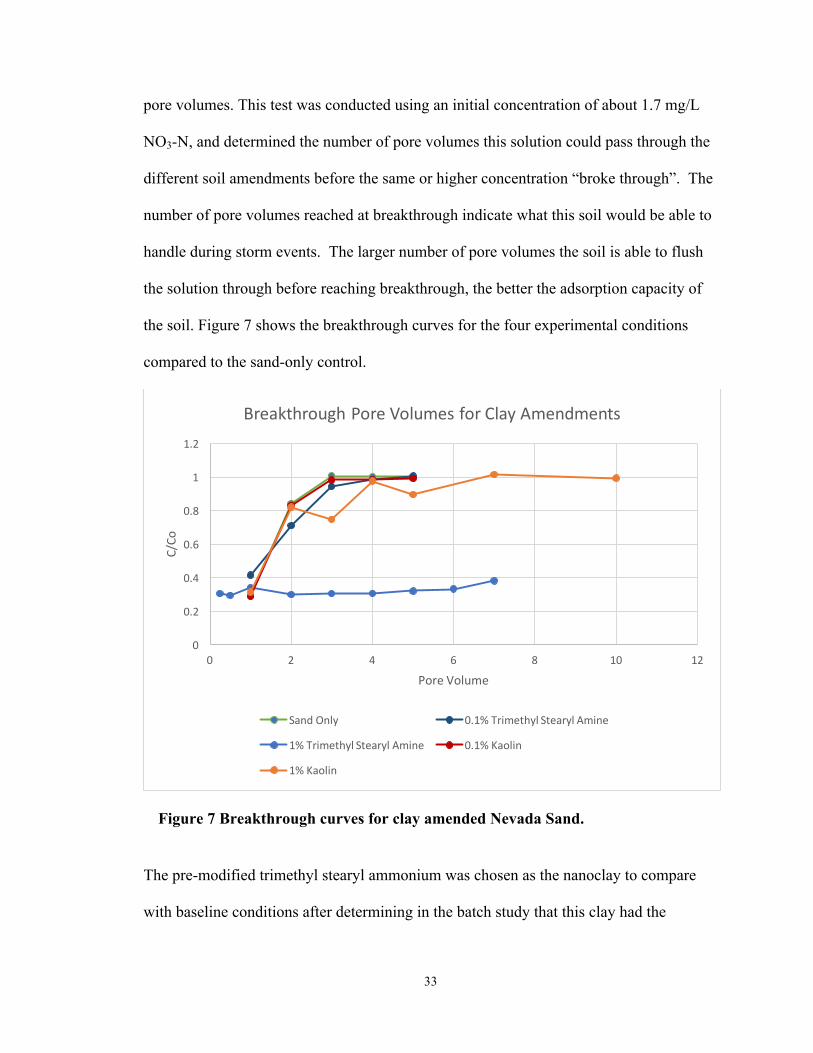
Figure 7 Breakthrough curves for clay amended Nevada Sand.
The pre-modified trimethyl stearyl ammonium was chosen as the nanoclay to compare
with baseline conditions after determining in the batch study that this clay had the
0
0.2
0.4
0.6
0.8
1
1.2
0 2 4 6 8 10 12
C/Co
PoreVolume
BreakthroughPoreVolumesforClayAmendments
SandOnly 0.1%TrimethylStearylAmine
1%TrimethylStearylAmine 0.1%Kaolin
1%Kaolin
34
greatest potential to adsorb nitrate. The HCl modified nanoclays were not chosen to be
tested in this experiment because they resulted in similar adsorption capabilities as the
unmodified kaolin clay, which was included as a control in this experiment. Low clay
fractions were added to the sand as a precaution to prevent excessively lowering the
hydraulic conductivity of the Nevada Sand and to minimize potential costs of nanoclay
materials for the practical implementation of this soil as a filtration device. The curves
show that both the 0.1% w/w unmodified kaolin clay amendment and the 0.1% w/w pre-
modified nanoclay amendment behave almost identically to Nevada Sand only, reaching
breakthrough within 3 or 4 pore volumes. This was expected, as there was not enough
clay in the mixture to adsorb much more nitrate than the sand alone.
The 1% w/w clay amendments both performed better than the smaller fraction of clay
amended soil, with the unmodified kaolin-amended soil reaching breakthrough after 7
pore volumes, and the nanoclay-amended soil reaching 38% of the initial concentration
after 7 pore volumes. The nanoclay shows a slight, but steady inclination after 2 pore
volumes, with a projected breakthrough at 17 pore volumes, assuming a polynomial
behavior trend. This is much higher than the other clay amended soils, showing great
potential for this type of nanoclay to be effective at removing nitrate in a filtration unit.
The 1% addition of clay, however, did reduce the hydraulic conductivity of the sand by
46% (pre-modified trimethyl stearyl ammonium) and by 36% (unmodified kaolin clay).
This is a significant reduction considering the minimal amount of clay added, though the
overall hydraulic conductivity is still quite high, as shown in Table 3. The hydraulic
conductivity of all four clay amendments ranges from 10-13 in/hr, while the
recommended infiltration rate to achieve greater nitrate removal in a biofiltration device
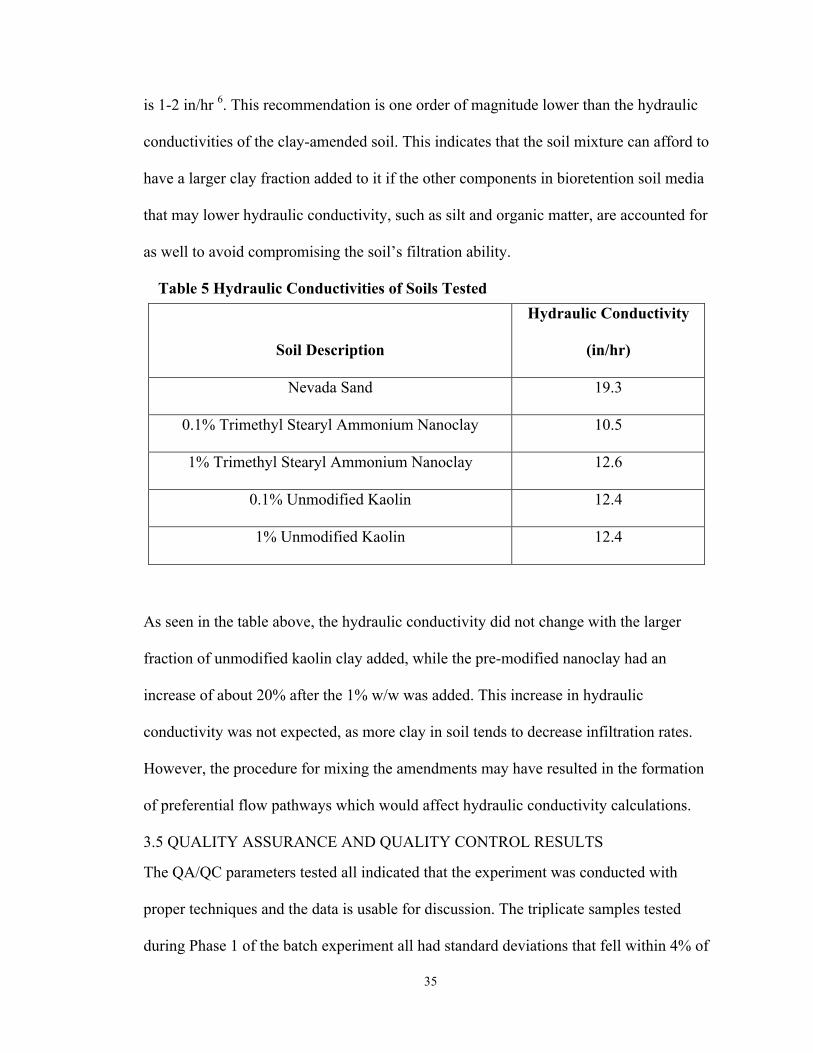
35
is 1-2 in/hr 6. This recommendation is one order of magnitude lower than the hydraulic
conductivities of the clay-amended soil. This indicates that the soil mixture can afford to
have a larger clay fraction added to it if the other components in bioretention soil media
that may lower hydraulic conductivity, such as silt and organic matter, are accounted for
as well to avoid compromising the soil’s filtration ability.
Table 5 Hydraulic Conductivities of Soils Tested
As seen in the table above, the hydraulic conductivity did not change with the larger
fraction of unmodified kaolin clay added, while the pre-modified nanoclay had an
increase of about 20% after the 1% w/w was added. This increase in hydraulic
conductivity was not expected, as more clay in soil tends to decrease infiltration rates.
However, the procedure for mixing the amendments may have resulted in the formation
of preferential flow pathways which would affect hydraulic conductivity calculations.
3.5 QUALITY ASSURANCE AND QUALITY CONTROL RESULTS
The QA/QC parameters tested all indicated that the experiment was conducted with
proper techniques and the data is usable for discussion. The triplicate samples tested
during Phase 1 of the batch experiment all had standard deviations that fell within 4% of
Soil Description
Hydraulic Conductivity
(in/hr)
Nevada Sand 19.3
0.1% Trimethyl Stearyl Ammonium Nanoclay 10.5
1% Trimethyl Stearyl Ammonium Nanoclay 12.6
0.1% Unmodified Kaolin 12.4
1% Unmodified Kaolin 12.4

36
the average, implying that the experimental process was executed precisely. The samples
that were filled with nitrate solution only, without any clay adsorbents, did not display
any adsorption losses to the falcon tube walls. The concentration in these tubes remained
within 10% of the initial concentration added, thus deeming the losses negligible for
analysis of the results. There was one outlier in this phase: one of the 3-day nitrate-only
samples, which resulted in a concentration that was 96% lower than the initial
concentration. The 2-day and 4-day nitrate only samples in that same run resulted in a
0.04% and 1% difference from the initial concentration, and the other 3-day nitrate only
sample resulted in a 2% difference, all of which indicate that this was not a natural
phenomenon that occurred, but was instead an outlier as no other results follow this
drastic change. This outlying point was not included in subsequent analysis.
Phase 2 had two outliers for the entirety of the experiment: one occurred during the pre-
modified trimethyl stearyl ammonium run at the first 1-minute test, which showed a
concentration of 1.25 mg/L NO3-N, as opposed to the other two runs which resulted in
concentrations of 0.8 and 0.81 mg/L NO3-N for the 1-minute test (before subtracting out
the background nitrate concentration). The other outlier occurred at the first hydrophilic
bentonite 40-minute run, resulting in a concentration of 0.90 mg/L NO3-N, while the
remainder of the time intervals all had concentrations between 1.64 and 1.72 mg/L NO3-
N for both trials, also before subtracting out the background nitrate concentration. The
background nitrate concentrations did not need to be subtracted to identify outliers, as all
of the data points would be reduced by the same proportional amount. These outliers
were not included in the analysis of the results, and were omitted from the calculation of
averages that determined overall adsorption capacity of the various nanoclays.
37
The batch experiments using unmodified kaolin and the two pre-modified nanoclays were
conducted in triplicates, while the remaining 4 clays (unmodified halloysite, unmodified
hydrophilic bentonite, HCl modified bentonite, and HCl modified kaolin) were all
conducted in duplicate due to time constraints. All multiples of the samples fell within a
10% standard deviation of each other, except for the pre-modified dimethyl dialkyl amine
tests. The multiple samples that were run for this nanoclay allowed for a representative
range of the capacity for it to reduce nitrate, and averages were taken to compare
adsorption. The duplicates in the batch experiments showed a relative percent difference
that also fell within 10% for each sample taken. The controls to test for adsorption losses
to the falcon tubes at the 120-minute time increment for each run also showed that there
were negligible losses, as most samples fell within 4% of the initial concentration added,
with one within 6% of the initial concentration. These minimal losses were not taken into
account when determining the adsorption capability of the nanoclays. Aside from overall
duplicate and triplicates, each run included one sample that was conducted identically to
another (the 60-minute time interval) to ensure that the process of the experiment was
carried out consistently from sample to sample. These types of duplicates also showed
that they all fell within 5% of each other, implying that the process was carried out
reliably.
Both Phase 1 and Phase 2 included CVS’s and splits as machine checks. The CVS’s
tested during these runs fell within 10% of the expected 25 mg/L NO3-N, indicating
correct representations of the unknown nitrate concentration samples by the IC. Those
that showed greater than a 10% discrepancy from the expected concentration indicated
the data collected before it to be unreliable, and this data was therefore omitted from

38
analysis. There were only two CVS’s that led to omitting data, one that resulted in no
data and the other that resulted in a 19% difference from the expected NO3-N
concentration. The data points that were taken out of consideration due to the 19%
discrepancy were one of the 60-minute duplicates for pre-modified dimethyl dialkyl
amine and the following 120-minute sample. The CVS that had an output of no data
caused 12 data points to be excluded from analysis: one of the unmodified kaolin clay
runs for the entire duration of 1-120 minutes, including the sample taken for background
nitrate concentration, and the 40, 60, and 120-minute pre-modified dimethyl dialkyl
amine nanoclay samples for that specific run, also including the background nitrate
sample. Although this was a significant amount of data taken out, there were enough data
points from other replicates of the run to have information for each clay’s behavior at
those specific time intervals.
In addition to the CVS’s, a split of one sample during each IC run was also included as a
secondary check. The results displayed nearly identical values for each split sample, with
most splits showing a 1% difference between each other, but overall reaching a maximum
6% discrepancy between splits. This indicated that the machine was operating correctly
as they all fell within 10% of each other.
The column test also included both CVS’s and duplicates for each sample, and those
results confirmed that the data was reliable for this phase as well. The CVS’s all fell
within 10% of the expected 25 mg/L NO3-N concentration, so the IC results were all
included in analysis. The duplicates allowed for averages to be taken for a better
representation of the resulting concentrations instead of using just one single sample.
39
CHAPTER 4: CONCLUSIONS AND RECOMMENDATIONS
The findings from this study suggest that certain nanoclays can successfully adsorb
nitrate, but further experimentation is needed before they can be applied to real-world
LIDs.
The batch adsorption experiment indicated that the pre-modified montmorillonite-based
nanoclays are the most effective at adsorbing nitrate, as compared to kaolin, bentonite,
and halloysite species. Surface modifications that apply a positive coating to the
nanoclay, like the trimethyl stearyl ammonium and the dimethyl dialkyl amine
modifications applied to montmorillonite, have very high adsorption capacities for typical
nitrate loadings from runoff, reaching 86% and 66% under normal pH and temperature
conditions (5-6, 25ºC), with a nitrate to clay ratio of 6.25 mg: 1 g.
The properties associated with nanomaterials such as different behaviors with larger
surface areas were not shown to have significant advantages over the unmodified control
clay, kaolin, unless a surface modifcation was used. This may be a result of possible
aggregation of the nanoclays, which would prevent them from exhibiting their true nano-
size and the corresponding characteristics. For this specific experiment, the
characteristics of the surface of the material are vital, as adsorption is a surface-based
process. The HCl acid modification that was aimed at changing the surface of the clays
did not prove to have a beneficial impact on the adsorption capacity, unlike previous
studies 13. The small impact the modification had during this experiment is not reflective
of its expected advantages, and must therefore be explored in more detail in future
research. Perhaps a system able to more reliably maintain a constant temperature during
treatment would create the desired environmental conditions for the HCl acid

40
modification to be successful. Additionally, different surface modifications should also
be explored to identify the optimal conditions for nitrate adsorption.
The column breakthrough experiments were indicative of the feasibility of using
nanoclays as a soil amendment for treatment of stormwater such as in a bioretention cell
installation. Under the tested parameters (pre-modified trimethyl stearyl ammonium
surface modified nanoclay added to Nevada Sand, exposed to 1.7 mg/L NO3-N solution),
the 1% w/w nanoclay amendment resulted in the best outcome out of the 4 conditions,
reaching a projected nitrate breakthrough at 17 pore volumes. However, future
experimentation should run the experiment until breakthrough is reached for a more
accurate breakthrough pore volume result. The hydraulic conductivity of this best-case
scenario was 12.6 in/hr, while a bioretention cell is recommended to have an infiltration
rate of 1-2 in/hr for nitrate removal. Therefore, a larger clay fraction could be added to
the Nevada Sand and possibly extend the useful life, but would need to account for
additional materials that go into a bioretention cell that reduce hydraulic conductivity
(e.g. silt and organic matter).
Further column studies with different base materials could also be conducted, perhaps
with a soil mixture that is recommended for use in industry. This would allow for a
comparison with an in-use soil and possible alterations that would enhance bioretention
cell performance. For a more in-depth look at the adsorption capacity of such an
amendment, a batch study could also be conducted to compare the nanoclay’s ability to
adsorb nitrate compared to that of the industry-approved soil.
For future work, the batch adsorption studies should also be tested under different
environmental conditions. For example, changing the nitrate to clay ratios for the

41
nanoclays and not just the unmodified kaolin to observe any changes in adsorption.
Testing more variations of nanoclays, either purchased from a manufacturer or amended
with different surface modification methods, would also provide a greater understanding
of nanomaterial behavior in this context. In the future, it is recommended that instead of a
nitrate-only solution, synthetic stormwater is used as the influent. Synthetic stormwater,
or solution made in lab that mimics real stormwater with known concentrations of typical
constituents in stormwater, would give a more realistic representation of the behavior of
nanoclays in a real-world application where they would be exposed to not only nitrate,
but other constituents in runoff as well. This may change their adsorption capacity, as
other pollutants may compete for the same adsorption sites on the nanoclays. If repeated
studies show feasible application of nanoclays in a bioretention soil media, an extensive
health and environmental risk assessment would need to be conducted prior to adoption
of the new media. For example, the health effects pertaining to ingestion, inhalation, or
skin exposure to nanoclays should be studied, in the chance that they are released into
open water bodies in which both humans and aquatic life come in contact with.
42
REFERENCES
1. United States Environmental Protection Agency. Program Overview: 303(d)
Listing of Impaired Waters. https://www.epa.gov/tmdl/program-overview-303d-
listing-impaired-waters. Published 2017. Accessed April 24, 2017.
2. Lindberg R. Nutrients in Lakes and Streams. Water Encyclopedia.
http://www.waterencyclopedia.com/Mi-Oc/Nutrients-in-Lakes-and-Streams.html .
3. Ouardi M El, Qourzal S, Alahiane S, Assabbane A, Douch J. Effective Removal of
Nitrates Ions from Aqueous Solution Using New Clay as Potential Low-Cost
Adsorbent. 2015;(December):178-190.
4. Davis AP, Shokouhian M, Sharma H, Minami C. Water Quality Improvement
through Bioretention Media: Nitrogen and Phosphorus Removal. Water Environ
Res. 2006;78(3):284-293. doi:10.2175/106143005X94376.
5. Overview of Stormwater Control Measures.
https://polylearn.calpoly.edu/AY_2016-
2017/pluginfile.php/620670/mod_resource/content/0/Overview of Stormwater
Control Measures.pdf.
6. Stormwater Runoff BMP Options. City St Barbar Storm Water BMP Guid Man.
2013;Chapter 6.
http://www.santabarbaraca.gov/civicax/filebank/blobdload.aspx?BlobID=168698.
7. Jonasson OJ, Davies P, Findlay S. Hydraulic conductivity and impact on retrofit
stormwater biofiltration - case study of the design , assessment and function of
retrofit raingardens using different filter media in Sydney. 2010:1-10.
43
http://documents.irevues.inist.fr/bitstream/handle/2042/35829/23406-011JON.pdf.
8. Kim H, Seagren EA, Davis AP. Engineered Bioretention for Removal of Nitrate
from Stormwater Runoff. Water Environ Res. 2003;75(4):355-367.
doi:10.2175/106143003X141169.
9. Hassani A, Kiranşan M, Darvishi Cheshmeh Soltani R, Khataee A, Karaca S.
Optimization of the adsorption of a textile dye onto nanoclay using a central
composite design. Turkish J Chem. 2015;39(4):734-749. doi:10.3906/kim-1412-
64.
10. Deng L, Yuan P, Liu D, Annabi-bergaya F, Zhou J. Effects of microstructure of
clay minerals, montmorillonite, kaolinite and halloysite, on their benzene
adsorption behaviors. Appl Clay Sci. 2017;143(March):184-191.
doi:10.1016/j.clay.2017.03.035.
11. Uddin MK. A review on the adsorption of heavy metals by clay minerals, with
special focus on the past decade. Chem Eng J. 2017;308:438-462.
doi:10.1016/j.cej.2016.09.029.
12. Prof A, Hussein A, Neamah MM. Batch Experiment and Adsorption Isotherm of
Phosphate Removal by Using Drinking Water Treatment Sludge and Red Mud.
2015;2(3):557-571.
13. Bekele W, Faye G, Fernandez N. REMOVAL OF NITRATE ION FROM
AQUEOUS SOLUTION BY MODIFIED ETHIOPIAN BENTONITE CLAY.
2014;4(1):192-201.
44
14. Li X, Zhao Y, Xi B, et al. Removal of nitrobenzene by immobilized nanoscale
zero-valent iron: Effect of clay support and efficiency optimization. Appl Surf Sci.
2016;370:260-269. doi:10.1016/j.apsusc.2016.01.141.
15. Nanotechnology 101. United States National Nanotechnology Initiative.
https://www.nano.gov/nanotech-101.
16. Nitrate CID 943. National Center for Biotechnology Information. PubChem
Compound Database.
https://pubchem.ncbi.nlm.nih.gov/compound/nitrate#section=Top.
17. Mikola RG, Sitar N. Seismic Earth Pressures on Retaining Structures in
Cohesionless Soils. 2013;(65).
18. Lawler DF, Barrett ME, Limouzin M. Performance Comparison of Stormwater
Biofiltration Designs.; 2011.
19. Bratieres K, Fletcher TD, Deletic A, Zinger Y. Nutrient and sediment removal by
stormwater biofilters : A large-scale design optimisation study. 2008;42:3930-
3940. doi:10.1016/j.watres.2008.06.009.
20. Adsorption Equilibria.
21. Britannica E of E. Methyl Group. Encyclopedia Britannica.
https://www.britannica.com/science/methyl-group. Published 1998.
22. Stearyl Group. Royal Society of Chemistry.
http://www.rsc.org/publishing/journals/prospect/ontology.asp?id=CHEBI:26755&
MSID=b821987g.

45
23. Soderberg T. Volume I With a Biological Emphasis. 2016;I.
24. Engineering A. Properties and Characterization of Kaolin Clay from Alkaleri ,.
2013;3(11):387-392.

46
APPENDICES

47
APPENDIX A: CALIBRATION CURVES
1. Calibration data and curve for Phase 1 starting concentration 50 mg/L NO3-N
CalibrationCurve
SampleName AreaConcentration(mg/LNO3-
N)0nitrate0nitrite n.a. -0.25nitrate0.125
nitrite 0.0861 0.250.5nitrate0.25nitrite 0.1694 0.51Nitrate0.5Nitrite 0.3587 15Nitrate2.5Nitrite 1.9376 510Nitrate5Nitrite 4.1438 10
25Nitrate12.5Nitrite 11.8101 2550Nitrate25Nitrite 27.1125 50100Nitrate50Nitrite 60.9656 100
y=1.6427x+2.0826
0
50
100
150
0 5 10 15 20 25 30 35 40 45 50 55 60 65
Concen
tration(m
g/LN
O3-N
)
Area
CalibrationCurve
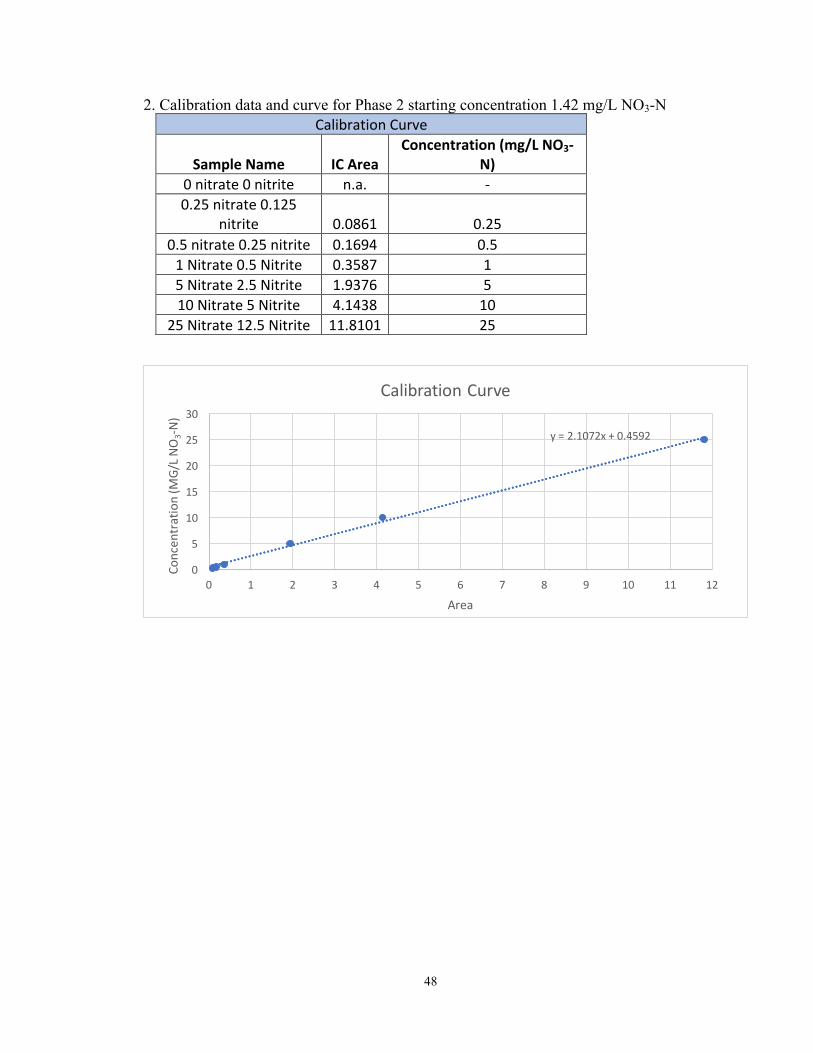
48
2. Calibration data and curve for Phase 2 starting concentration 1.42 mg/L NO3-N CalibrationCurve
SampleName ICAreaConcentration(mg/LNO3-
N)0nitrate0nitrite n.a. -0.25nitrate0.125
nitrite 0.0861 0.250.5nitrate0.25nitrite 0.1694 0.51Nitrate0.5Nitrite 0.3587 15Nitrate2.5Nitrite 1.9376 510Nitrate5Nitrite 4.1438 10
25Nitrate12.5Nitrite 11.8101 25
y=2.1072x+0.4592
0
5
10
15
20
25
30
0 1 2 3 4 5 6 7 8 9 10 11 12
Concen
tration(M
G/LN
O3-N
)
Area
CalibrationCurve
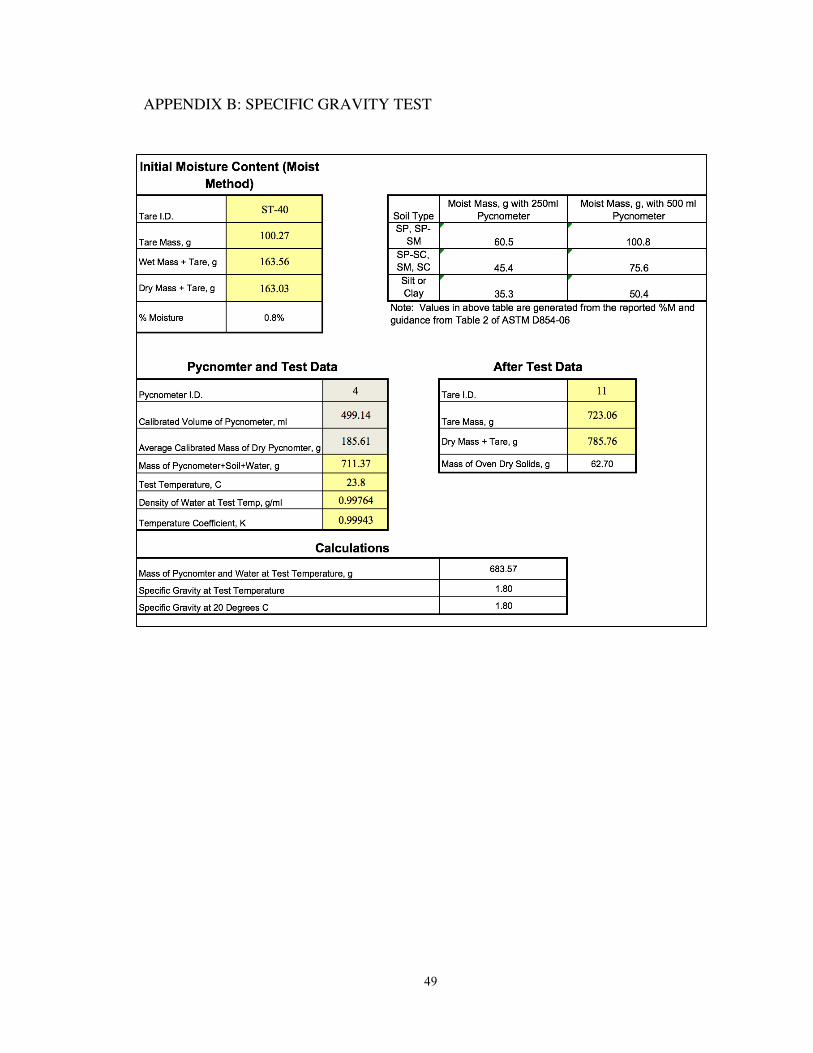
49
APPENDIX B: SPECIFIC GRAVITY TEST

50
APPENDIX C: RAW DATA
1. Phase 1 Batch Adsorption-Results from IC Analysis, after applying equation from calibration curve for Phase 1. The values shown are without any QA/QC applied and background concentrations are not subtracted.
DataResults:Run1-KaolinOnly35mgclayper35mLof50mg/LNO3-N
SampleDescription SampleName Area Concentration(mg/LNO3-N)ControlVerificationStandard25ppm cvs 13.2085 23.77
1hourKaolinSampleA 1ka 25.8904 44.591hourKaolinSampleB 1kb 27.5796 47.371hourKaolinSampleC 1kc 27.872 47.85
1HourNO3only,noKaolin 1k0 28.6509 49.134hourKaolinSampleA 4ka 28.5877 49.024hourKaolinSampleB 4kb 27.5331 47.294hourKaolinSampleC 4kc 27.6746 47.52
4HourNO3only,noKaolin 4k0 30.7372 52.558hourKaolinSampleA 8ka 27.2444 46.828hourKaolinSampleB 8kb 27.4775 47.208hourKaolinSampleC 8kc 27.3426 46.98
8HourNO3only,noKaolin 8k0 29.316 50.219472DeionizedWater DI n.a. #VALUE!
ControlVerificationStandard25ppm cvs 15.2475 27.1212hourKaolinSampleA 12ka 27.3922 47.0612hourKaolinSampleB 12kb 27.6455 47.4812hourKaolinSampleC 12kc 27.9631 48.00
12HourNO3only,noKaolin 12k0 29.0926 49.852649224hourKaolinSampleA 24ka 28.4801 48.8524hourKaolinSampleB 24kb 27.6941 47.5624hourKaolinSampleC 24kc 28.4224 48.75
24HourNO3only,noKaolin 24k0 29.1337 49.920135448hourKaolinSampleA 48ka 28.3309 48.6048hourKaolinSampleB 48kb 28.7579 49.3048hourKaolinSampleC 48kc 27.7685 47.68
48HourNO3only,noKaolin 48k0 29.1801 49.996324248hourKaolinSampleCSplit split48kc 27.7199 47.60
InitialConc,withKaolinSampleA 0ka 28.3072 48.56InitialConc,withKaolinSampleB 0kb 28.2289 48.43InitialConc,withKaolinSampleC 0kc 27.554 47.33
InitialConcofSolutionAddedtoSamples 0k0 31.0464 53.06DeionizedWater di n.a. #VALUE!
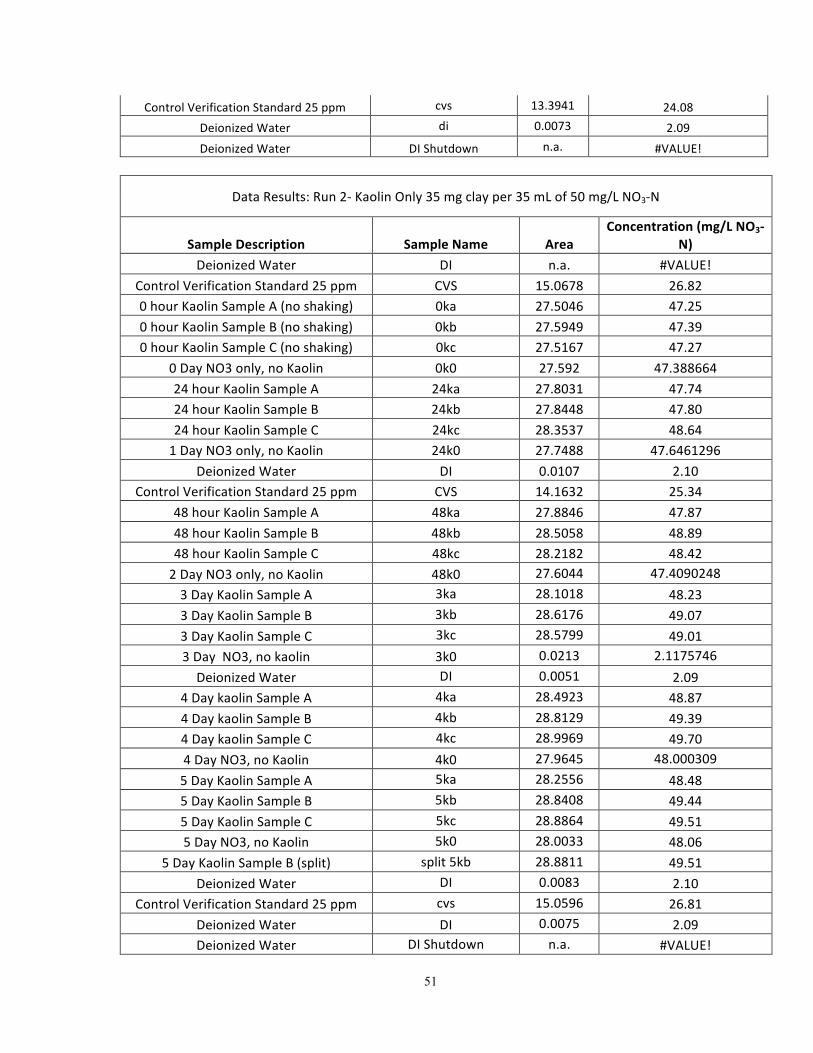
51
ControlVerificationStandard25ppm cvs 13.3941 24.08DeionizedWater di 0.0073 2.09DeionizedWater DIShutdown n.a. #VALUE!
DataResults:Run2-KaolinOnly35mgclayper35mLof50mg/LNO3-N
SampleDescription SampleName AreaConcentration(mg/LNO3-
N)DeionizedWater DI n.a. #VALUE!
ControlVerificationStandard25ppm CVS 15.0678 26.820hourKaolinSampleA(noshaking) 0ka 27.5046 47.250hourKaolinSampleB(noshaking) 0kb 27.5949 47.390hourKaolinSampleC(noshaking) 0kc 27.5167 47.27
0DayNO3only,noKaolin 0k0 27.592 47.38866424hourKaolinSampleA 24ka 27.8031 47.7424hourKaolinSampleB 24kb 27.8448 47.8024hourKaolinSampleC 24kc 28.3537 48.641DayNO3only,noKaolin 24k0 27.7488 47.6461296
DeionizedWater DI 0.0107 2.10ControlVerificationStandard25ppm CVS 14.1632 25.34
48hourKaolinSampleA 48ka 27.8846 47.8748hourKaolinSampleB 48kb 28.5058 48.8948hourKaolinSampleC 48kc 28.2182 48.422DayNO3only,noKaolin 48k0 27.6044 47.40902483DayKaolinSampleA 3ka 28.1018 48.233DayKaolinSampleB 3kb 28.6176 49.073DayKaolinSampleC 3kc 28.5799 49.013DayNO3,nokaolin 3k0 0.0213 2.1175746DeionizedWater DI 0.0051 2.09
4DaykaolinSampleA 4ka 28.4923 48.874DaykaolinSampleB 4kb 28.8129 49.394DaykaolinSampleC 4kc 28.9969 49.704DayNO3,noKaolin 4k0 27.9645 48.0003095DayKaolinSampleA 5ka 28.2556 48.485DayKaolinSampleB 5kb 28.8408 49.445DayKaolinSampleC 5kc 28.8864 49.515DayNO3,noKaolin 5k0 28.0033 48.06
5DayKaolinSampleB(split) split5kb 28.8811 49.51DeionizedWater DI 0.0083 2.10
ControlVerificationStandard25ppm cvs 15.0596 26.81DeionizedWater DI 0.0075 2.09DeionizedWater DIShutdown n.a. #VALUE!

52
DataResults:Run3-KaolinandNanoclay(Halloysite)70mgclayper35mLof50mg/LNO3-Nand35mgofhalloysiteper35ml
SampleDescription SampleName AreaConcentration(mg/LNO3-
N)DeionizedWater DI n.a. #VALUE!
ControlVerificationStandard25ppm CVS 13.1694 23.710hourKaolinSampleA(noshaking) 0ka 26.7734 46.040hourKaolinSampleB(noshaking) 0kb 26.8955 46.250hourKaolinSampleC(noshaking) 0kc 26.9209 46.29
0DayNO3only,noKaolin 0k0 27.3892 47.061DayKaolinSampleA Mka 27.5069 47.251DayKaolinSampleB Mkb 27.2783 46.871DayKaolinSampleC Mkc 27.0784 46.55
1DayNO3only,noKaolin Mk0 27.5404 47.30DeionizedWater DI 0.0045 2.09
ControlVerificationStandard25ppm CVS 13.3089 23.942DayKaolinSampleA Tka 27.6427 47.472DayKaolinSampleB Tkb 27.3483 46.992DayKaolinSampleC Tkc 27.1877 46.72
2DayNO3only,noKaolin Tk0 27.6986 47.563DayKaolinSampleA Wka 27.3205 46.943DayKaolinSampleB Wkb 27.5736 47.363DayKaolinSampleC Wkc 27.7049 47.573DayNO3,nokaolin Wk0 27.8384 47.79DeionizedWater DI n.a. #VALUE!
4DaykaolinSampleA Rka 27.6896 47.554DaykaolinSampleB Rkb 27.7811 47.704DaykaolinSampleC Rkc 27.7307 47.624DayNO3,noKaolin Rk0 27.8917 47.88
4DayNanoclay(Halloysite)SampleA Rna 26.4364 45.494DayNanoclay(Halloysite)SampleA
Split SplitRna 26.4002 45.434DayNanoclay(Halloysite)SampleB Rnb 25.9057 44.624DayNanoclay(Halloysite)SampleC Rnc 26.5869 45.74
4DayNO3only,noNanoclay(Halloysite) Rn0 28.1454 48.30
DeionizedWater DI 0.0026 2.09ControlVerificationStandard25ppm cvs 15.3553 27.30
DeionizedWater DI 0.0091 2.10DeionizedWater DIShutdown n.a. #VALUE!
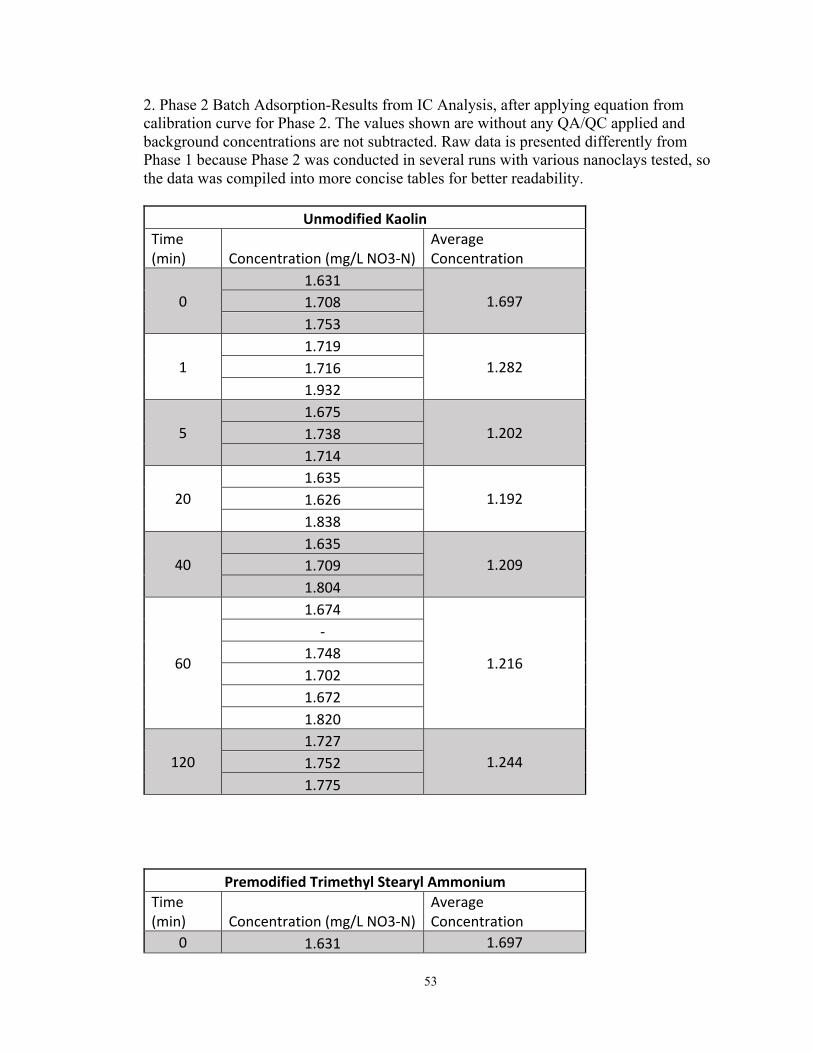
53
2. Phase 2 Batch Adsorption-Results from IC Analysis, after applying equation from calibration curve for Phase 2. The values shown are without any QA/QC applied and background concentrations are not subtracted. Raw data is presented differently from Phase 1 because Phase 2 was conducted in several runs with various nanoclays tested, so the data was compiled into more concise tables for better readability.
UnmodifiedKaolinTime(min) Concentration(mg/LNO3-N)
AverageConcentration
01.631
1.6971.7081.753
11.719
1.2821.7161.932
51.675
1.2021.7381.714
201.635
1.1921.6261.838
401.635
1.2091.7091.804
60
1.674
1.216
-1.7481.7021.6721.820
1201.727
1.2441.7521.775
PremodifiedTrimethylStearylAmmoniumTime(min) Concentration(mg/LNO3-N)
AverageConcentration
0 1.631 1.697
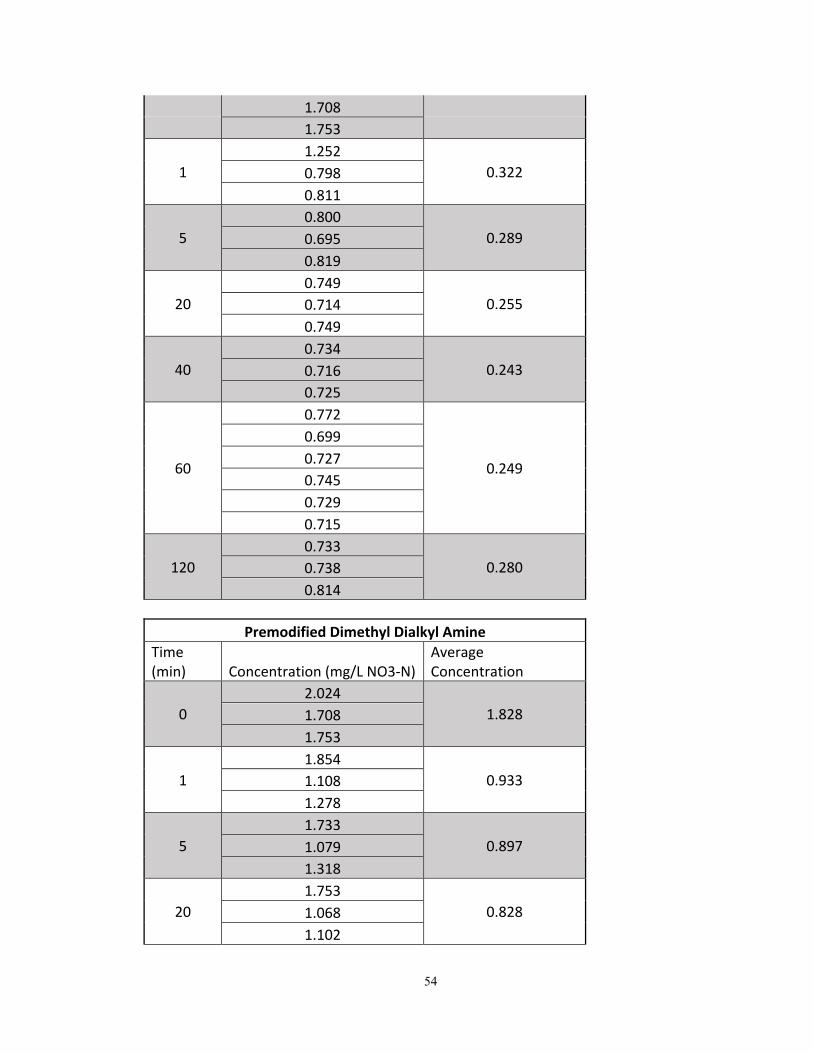
54
1.7081.753
11.252
0.3220.7980.811
50.800
0.2890.6950.819
200.749
0.2550.7140.749
400.734
0.2430.7160.725
60
0.772
0.249
0.6990.7270.7450.7290.715
1200.733
0.2800.7380.814
PremodifiedDimethylDialkylAmine
Time(min) Concentration(mg/LNO3-N)
AverageConcentration
02.024
1.8281.7081.753
11.854
0.9331.1081.278
51.733
0.8971.0791.318
201.753
0.8281.0681.102
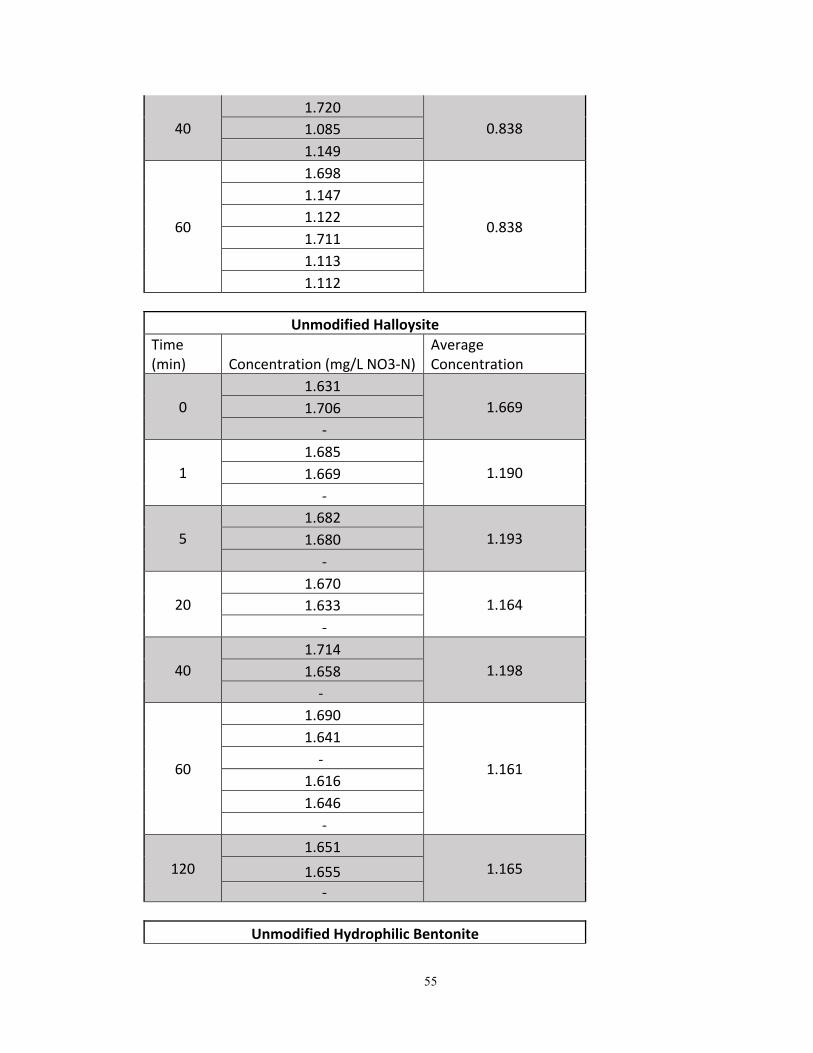
55
401.720
0.8381.0851.149
60
1.698
0.838
1.1471.1221.7111.1131.112
UnmodifiedHalloysite
Time(min) Concentration(mg/LNO3-N)
AverageConcentration
01.631
1.6691.706-
11.685
1.1901.669-
51.682
1.1931.680-
201.670
1.1641.633-
401.714
1.1981.658-
60
1.690
1.161
1.641-
1.6161.646-
1201.651
1.1651.655-
UnmodifiedHydrophilicBentonite

56
Time(min) Concentration(mg/LNO3-N)
AverageConcentration
01.631
1.6631.694-
11.684
1.1461.665-
51.692
1.1471.658-
201.717
1.1771.693-
400.899
1.1411.669-
60
1.722
1.154
1.635-
1.6971.675-
1201.670
1.1361.657-
HClmodifiedBentonite
Time(min) Concentration(mg/LNO3-N)
AverageConcentration
01.727
1.7271.727-
11.750
1.2541.711-
51.650
1.1691.640-

57
201.674
1.2191.717-
401.670
1.1821.647-
60
1.732
1.242
1.733-
1.691--
1201.698
1.2761.806-
HClmodifiedKaolin
Time(min) Concentration(mg/LNO3-N)
AverageConcentration
01.694
1.6941.694-
11.705
1.1831.690-
51.708
1.1801.682-
201.677
1.1361.625-
401.655
1.1271.629-
60
1.681
1.1531.675-
1.7051.611

58
-
1201.677
1.1521.657-
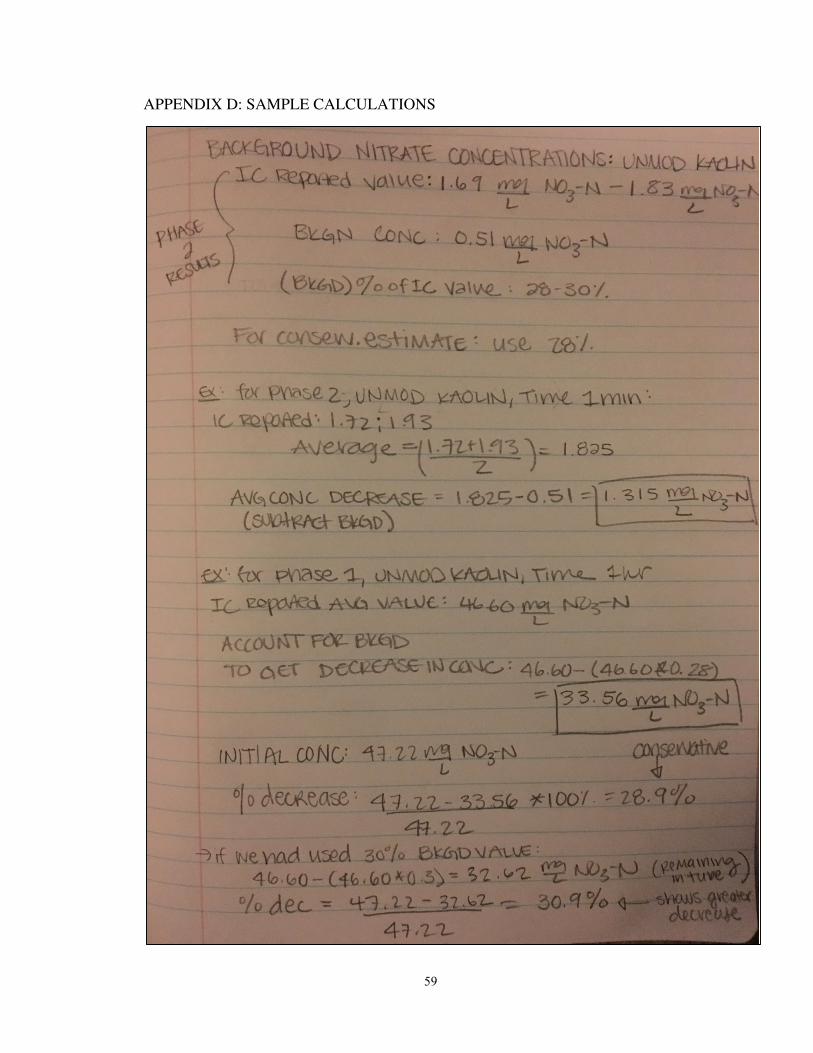
59
APPENDIX D: SAMPLE CALCULATIONS


![Growth and Nutrient Removal Efficiency of Sweet Wormwood ......accumulation of nitrates in recirculating aquaculture systems require water exchange that is costly and undesirable [12]](https://img.pdfslide.us/doc/110x75/60c38b028dfbfe75fb7ff8f9/growth-and-nutrient-removal-efficiency-of-sweet-wormwood-accumulation-of.jpg)