Embed Size (px)
Citation preview
Abdel-Aziz et al., JMES, 2017, 8 (5), pp. 1737-1747 1737
JMES, 2017 Volume 8, Issue 5, Page 1737-1747
http://www.jmaterenvironsci.com /
1. Introduction Nowadays water pollution by toxic heavy metals due to the discharge of industrial wastewater without
preliminary treatment is a worldwide environmental problem. A lot of industries especially that related to metal
processing operations and refineries are considered as dangerous sources of heavy metal emissions. Copper is
one of the toxic metals that has harmful effects on living beings, including but not limited to; kidney disease,
liver damage, stomach cramps, diarrhea, nausea and vomiting. Copper enters wastewater from many sources
such as corrosion of water piping, mining and refining of copper, fertilizer industries, petroleum refining,
infiltration and inflow of ground and surface water, etc. Depending on the standards of World Health
Organization (WHO), the concentration of copper in drinking water should not exceed 0.05 mg/l, and its
concentration in industrial sewage effluent discharge should be less than 3.0 mg/l. Based on the fact of harmful
effects of copper on living beings, it should be removed or eliminated from wastewater to match the standards.
There are many different technologies involving chemical and physical processes which have been
developed previously to eliminate heavy metal ions from wastewater such as chemical precipitation [1,2],
adsorption [3,4], ion exchange [5,6], electrochemical technique [7,8], cementation [9-11], membrane processes
[12], and solvent extraction [13]. Awual [14] created a novel facial composite adsorbent to improve the
detection of Cu (II) and removal from wastewater. The author investigated the effects of several parameters
such as initial pH, Cu (II) ions concentration, shaking time, foreign ions. He found the maximum sorption
capacity was 176.27 mg/g based on the Langmuir sorption isotherm study. Huang and He [15] investigated the
performance of electrosorption in removal of copper ions from wastewater on ordered mesoporouscarbon
(OMC) electrode, they found the amount of saturated adsorbed of Cu (II) on the OMC electrosorbent was 56.62
mg/ g at 0.9 V and pH = 4, which is close to 5 times higher than that recorded at open circuit. Siu et al. [16]
Journal of Materials and Environmental Sciences ISSN : 2028-2508
Copyright © 2017,
University of Mohammed Premier
Oujda Morocco
http://www.jmaterenvironsci.com/
Removal of heavy metals from wastewater using thermally treated sewage
sludge adsorbent without chemical activation
M. H. Abdel-Aziz1,2*
, M. Bassyouni1,3
, M. F. Soliman4,5
, S. A. Gutub6, S. F. Magram
6
1. Chemical and Materials Engineering Department, Faculty of Engineering, King Abdulaziz University, Rabigh 21911, Saudi Arabia
2. Chemical Engineering Department, Faculty of Engineering, Alexandria University, Alexandria, Egypt
3. Department of Chemical Engineering, Higher Technological Institute, Tenth of Ramdan City, Egypt
4. Civil Engineering Department, Faculty of Engineering, King Abdulaziz University, Rabigh 21911, Saudi Arabia
5. Department of Civil Engineering, Faculty of Engineering, Aswan University, Egypt
6. Civil Engineering Department, Faculty of Engineering, King Abdulaziz University, Jeddah, Saudi Arabia
Abstract
Removal of copper as an example of heavy metals from synthetic wastewater by
adsorption on sewage sludge adsorbent was studied. The sludge was dried,
grinded and thermally treated at various temperatures. Surface morphology and
chemical structure of treated sludge were investigated using SEM and FTIR.
Parameters studied are initial concentration of copper ions, contact time, sludge
dosage, and the heat treatment temperature of the sludge. The removal efficiency
of Cu+2
increases with increasing sludge dosage. Increasing initial concentration
of Cu+2
has two opposing effects on the % removal depending on the
concentration range used. The maximum removal efficiency was 73%.
Experimental data were modeled by using Langmuir and Freundlich isotherms.
The data fits Freundlich linear model with R2 = 0.9585. The mechanism of
adsorption of Cu+2
by sludge adsorbent was found to take place through a
monolayer and heterogeneous surface. Possible applications of the present data in
removing copper and other heavy metals from industrial effluents were
highlighted.
Received 29 Aug 2016,
Revised 01 Oct 2016,
Accepted 04 Oct 2016
Keywords
Heavy metals;
Sewage sludge,
Wastewater;
Adsorption;
Copper
Tel: +966568235508

Abdel-Aziz et al., JMES, 2017, 8 (5), pp. 1737-1747 1738
studied equilibrium and kinetics of removal of copper from wastewater using ion exchange technique using an
iminodiacetate resin. The resin capacity for the copper ions was 2.30 mmol/g. Al-Harahsheh et al. [17] used Fly
ash based geopolymer for copper removal, and found that maximum sorption capacity (qm) occurred at 45 ˚C,
reaching a value of 152 mg/g. Mosier et al. [18] carried out experiments to investigate the removal of Cu+2
by
Microbial biofilms from Chemical Mechanical Planarization (CMP) wastewater. Xu et al. [19] created novel
sorbent for the copper removal from waste water, so-called ZnS nanocrystals (NCs). He achieved copper
removal efficiency over 99.0 % in one minute. According to his experiments, the saturated adsorption capacity
of ZnS NCs sorbent on copper is about 650 mg/g. Bilal et al. [20] studied copper removal from industrial
wastewater by waste biomass adsorbents, and conclude bio-adsorbents as agriculture and forest derived have
greater potential for removal of Cu+2
, and attributed it to cheaper nature, higher uptake, bulk availability and
mono to multilayer adsorption behavior.
In another point of view, an increase in amount of sewage sludge generated by wastewater treatment plant as a
result of increasing of urbanization and industrialization is considered too as a worldwide problem and requires
great attention [21,22]. Approximately 50 percent of the total costs of wastewater treatment are required for
final disposal of sludge [23,24]. Reuse of sludge consider as an attractive alternative and best way for final
dispose by environmentally friendly way. The idea of reusing solid wastes as adsorbent has been studied by
different authors [25,26]. Using sewage sludge is a promising adsorbent since it has low production cost
and high environmental sustainability.
Managing the sludge disposal is considered as one of crucial challenges. Water can be discharged to
seas, rivers and lakes. Table 1 shows that the treated municipal wastewater represent around 68% of
total municipal wastewater. This sludge would add drawback that it tends to accumulate heavy metals
and other persistent toxic compounds coming from industrial discharges, traffic related pollution and
other commercial activities. Heavy metals are mostly present in sludge because of their hydrophobic
nature as they are attached with the solid portion of the wastewater [27].
Table 1, Municipal wastewater production, collection and treatment in countries with the largest
urban populations. (Sources: Data from AQUASTAT 2014; GWI 2014)
Commonly, Industrial waste has higher heavy metals contents than domestic wastewater. Therefore
toxic metals such as nickel, chromium, lead, cadmium, mercury may be found in municipal
wastewater due to heavy urbanization and the entry of untreated industrial wastewater into the
Country Municipal wastewater (km3)
Produced (Year) Treated (Year) India 15.44 2011 4.42 2011
Brazil 9.73 2009 2.51 2009
Egypt, Arab Rep. 7.08 2012 3.71 2012
Canada 6.61 2009 3.55 2009 Germany 5.30 2007 5.18 2007
Italy 3.93 2007 3.9 2007
France 3.79 2008 3.77 2008
Turkey 3.58 2010 2.72 2010 Iran, Islamic Rep. 3.55 2010 0.89 2012
South Africa 3.54 2009 1.92 2009
Spain 3.18 2004 3.16 2004
Pakistan 3.06 2011 0.55 2011 Argentina 2.46 2010 0.29 2000
Colombia 2.40 2010 0.60 2010
Netherlands 1.93 2010 1.88 2010
Australia 1.83 2007 2.00 2013 Saudi Arabia 1.55 2010 1.06 2010
Algeria 0.82 2012 0.32 2012
Iraq 0.58 2012 0.10 2012

Abdel-Aziz et al., JMES, 2017, 8 (5), pp. 1737-1747 1739
municipal wastewater system [28-30]. Two groups of heavy metals can be classified. The first group
includes cadmium, mercury and lead are highly toxic to humans and animals with less toxic effect on
plants. The second group comprising zinc, nickel and copper have high toxic effect on plants when
present in excess concentration. The latter group has more damaging influence on plants than humans
and animals. Heavy metal removal from wastewater by % more than 50 has been achieved using adsorbent of
sewage sludge as a preliminary treatment, which will decrease the cost of removal comparing with using
commercial activated carbon only for example. And at the same time, disposing the sludge by friendly
environmental way and reusing it.
This works aims to study the removal of heavy metals by adsorption using sewage sludge as an adsorbent and
Cu+2
as an adsorbate example. Adsorption process is one of the most effective techniques can be applied to
remove non-biodegradable matters. Adsorption process can be taken place by physisorption or chemisorption
process. Adsorbate is attached to the adsorbent physically by Van der Waals forces. The chemisorption can be
achieved by chemical bond with the molecules of the adsorbent. Adsorption processes based on physisorption
can usually be reversed. Mass transfer of the adsorbate includes mainly four stages (i) convection, (ii) film
diffusion (iii) grain diffusion and then (iv) attachment by physical or chemical bonding. Kinetics of adsorption
can be controlled mainly by film diffusion and grain diffusion. Adsorbent has an outer and inner surface. The
inner surface represents the overall surface of all pores. Pore size and structure play a crucial role in the
adsorption capacity.
2. Experimental section 2.1 Materials
Raw sewage sludge has been collected from the final disposal area. Sludge was grinded and thermally treated at
three different temperatures, 200, 400, and 600 ˚C. All chemical reagents such as CuSO4.5 H2O, HCl, NaOH
were in analytical grade. Stock solution was prepared by dissolving CuSO4 in distilled water. Three different
initial concentrations of Cu+2
were prepared by dilution of the stock solution namely; 50, 100 and 150 ppm.
Initial pH of the solution was maintained at 5 by adding either HCl or NaOH. All experiments were conducted
at a temperature 25 ± 1 ˚C. Table 2 shows the typical properties of sewage sludge.
Table 2, sewage sludge properties
Element/Parameter Parameter Typical %
Proximate analysis
Moisture 5.3
Volatile matter 50
Ash 30.772
Ultimate analysis
C 29.75
H 4.1
N 4.235
O 19.7
S 1.71
F 0.008
Cl 0.125
2.2 Apparatus and analysis
A lab scale standard Jar test apparatus was used to conduct the experiments. It consists mainly of six impellers
mounted on stainless steel shafts, variable speed motor and six graduated cylinders of 1 L capacity. The impeller
is two 90˚ turbine blades of 5 cm diameter and 2 cm height. The impeller rotation speed was ranged from 0 to
200 rpm. During all experiments the rotational speed was maintained at 200 rpm. Surface morphology of
thermally treated sludge particles was carried out using JEOL JSM 6490A scanning electron microscope.
Images were obtained by secondary electrons at 20 kV, to study micro-structure of treated sludge particles at
200, 400 and 600 ˚C.
Samples were sputter coated with monolayers of gold to enhance the electrical conductivity of sludge particles.
Chemical structure was investigated using Fourier Transform Infrared (FT-IR). This analysis was performed
using Brukers Alpha FT-IR (Platinium ATR module).HACH DR/3900 spectrophotometer was used for
quantitative determination of Cu+2
using Phenanthroline method.

Abdel-Aziz et al., JMES, 2017, 8 (5), pp. 1737-1747 1740
Fig. 1 shows different sequence of steps involved in carrying out the present work including sludge treatment,
operating conditions and effluent analysis.
Fig. 1, Schematic presentation of the different steps of the experimental work.
The % removal of Cu+2
was calculated by using the equation (1):
% 𝑟𝑒𝑚𝑜𝑣𝑎𝑙 = 𝐶𝑜 − 𝐶
𝐶𝑜 × 100 (1)
where Co and C are initial and final concentrations of Cu+2
respectively.
3. Results and discussion Removal of Cu
+2 from aqueous solution was studied under various conditions such as contact time, initial
concentration of Cu+2
, adsorbent dosage, sludge treatment temperature.
To study the effect of contact time on the removal efficiency of Cu+2
at different initial concentrations, samples
of the solutions were analyzed at different time intervals, the % removal of Cu+2
increased with increasing
contact time with a decreasing rate. The % removal was rapid and on increasing contact time the % removal
increased slowly. This may attributed to the fact that at initial stages all active sites on the adsorbent surface
were vacant and solute concentration gradient was high and the ratio of adsorbate molecules to the adsorbent
molecules and to the available surface area is low. Also on increasing contact time the driving force between the
bulk of the solution and the liquid-adsorbent interface decrease with a consequent decrease in the rate of
removal [31,32].
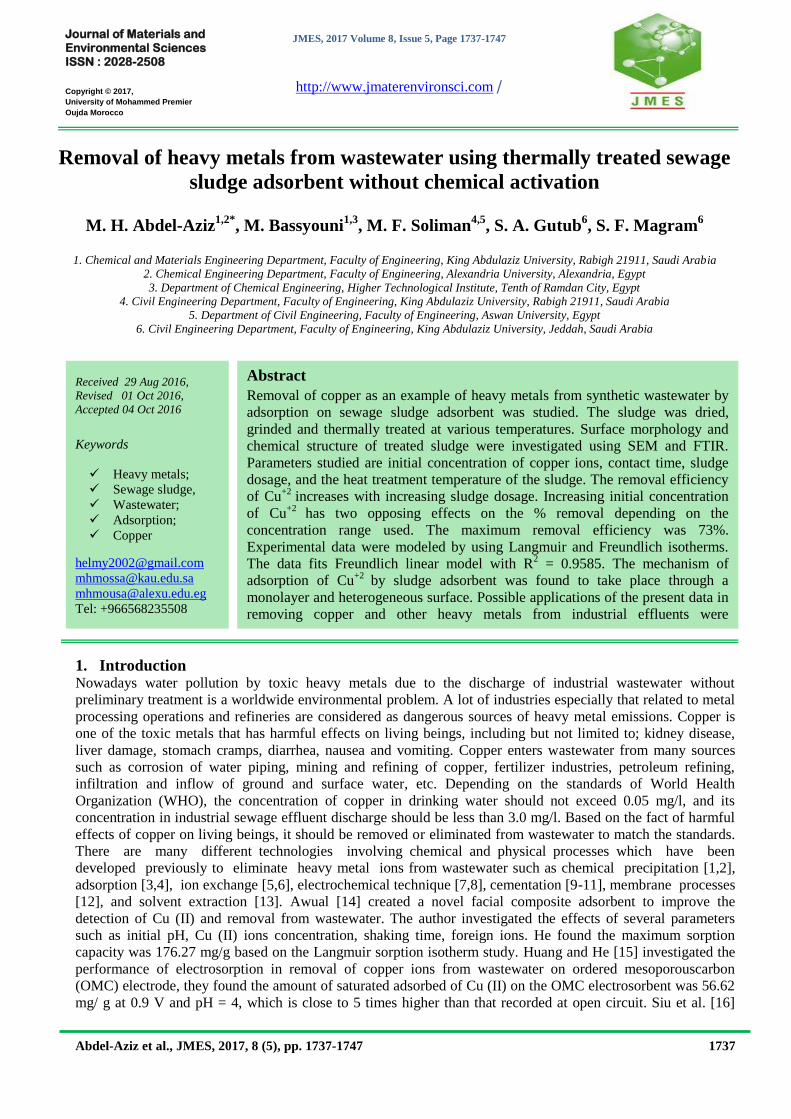
Fig. 2 shows the effect of initial concentration of Cu+2
on the % removal at different adsorbent dosages and
different sludge treatment temperatures.
The % removal of Cu+2
increases with increasing initial concentration of Cu+2
passes through maximum at 100
ppm and then decreases. Previous studies showed that initial concentration of dissolved ions has two opposing
effects namely [32-36]; (i) increasing initial concentration leads to increasing the bulk concentration and
increasing the concentration difference between the solution bulk and the interface with a consequent increase in
the driving force for ions transfer and increasing the rate of removal. (ii) increasing initial concentration leads to
increase the inter-ionic attraction and decreasing the diffusion of ions to the adsorbent surface with a consequent
decrease in the rate of Cu+2
transferfrom the solution bulk to the adsorbent surface [37]. As the concentration of
metal ion increases, rapid saturation of the adsorbent and more surface sites are covered at a constant adsorbent
dose consequently the adsorbent capacity gets exhausted due to non- availability of the surface sites [38]. Under
Abdel-Aziz et al., JMES, 2017, 8 (5), pp. 1737-1747 1741
0
5
10
15
20
25
30
35
50 100 150
% R
emo
val
of
Cu
+2
Initial concentration, ppm
200
400
600
Sludge dosage = 2 g/LHeat treatment temperature, ˚C
(A)
0
10
20
30
40
50
50 100 150
% R
emo
val
of
Cu
+2
Initial concentration, ppm
200
400
600
Sludge dosage = 4 g/LHeat treatment temperature, ˚C
(B)
0
10
20
30
40
50
60
70
80
50 100 150
% R
emo
val
of
Cu
+2
Initial concentration, ppm
200400600
Sludge dosage = 6 g/LHeat treatment temperature, ˚C
(C)
the present range of operating parameters it seems that the first effect is predominant in the concentration range
from 50 – 100 ppm and the second effect is predominant in the concentration range 100 – 150 ppm. Fig. 2 also
shows the effect of sludge dosage on the% removal of Cu+2
. The data show that within the present range of
parameters studied and for a given initial concentration of Cu+2
the % removal increases with increasing sludge
dosage and increasing sludge treatment temperature, this may be attributed the fact that with increasing the
adsorbent dose the surface area and the active adsorption sites for bonding the heavy metal ions will
increase[39,40]. Increasing the adsorbent dosage has two opposing effects namely; (i) the number of available
adsorption sites increases by increasing the adsorbent dose and it therefore results in an increase in the %
removal. (ii) the inter-particle interaction, such as aggregation, resulting from high adsorbent dose, would lead
to a decrease in the total surface area of the adsorbent and on an increase in diffusional path length [41].
Fig. 2, Effect of initial concentration of Cu+2
on the % removal at different adsorbent dosages and different
sludge treatment temperatures.

Abdel-Aziz et al., JMES, 2017, 8 (5), pp. 1737-1747 1742
The data on Fig. 2 shows that the first effect predominates within the present range of sludge dosages used (2 –
6 g/L). Despite the increase in the sludge dosage increased the % removal but the adsorption density with
decreases with increasing the adsorbent dosage, this may be because of unsaturation of adsorption sites through
the adsorption process [42].
To study the effect of heat treatment temperature, the sludge after drying and grinding was treated at three
different temperatures namely; 200, 400 and 600 ˚C for 3 hours holding time. Mass losses of sludge increased
with increasing temperaturewith a formation of little pores and structural changes. The weight losses are mainly
due to dehydration, organic and inorganic materials decomposition [43].
Fig. 2 shows that the maximum removal of Cu+2
was achieved with sludge samples treated at 600 ˚C at different
sludge dosages (2, 4, and 6 g/L). In order to explain the effect of sludge treatment temperature on the % removal
of Cu+2
, the sludge samples were analyzed by SEM analysis at the three temperatures 200, 400 and 600 ˚C
respectively before and after adsorption. Surface morphology of heat treated sludge particles was analyzed by
SEM. Fig.3 (a, b and c) shows the surface morphology of treated sludge particles at 200, 400 and 600 ˚C
respectively. Ash is mainly found in compact or spherical shapes of different size. Some unshaped fragments
refer to remaining volatile carbon [44]. Therefore it is noticed that the unshaped fragments are found mainly in
the treated sludge at lower temperature 200 ˚C. Fig.3 (c) also display partially developed morphology with more
roughness and some micro-holes on the surface.
Fig. 3, SEM analysis of sludge samples at different treatment temperatures (A: 200 ˚C, B: 400 ˚C, C: 600 ˚C).
It give a high potential for pollutants to be adsorbed and attached on the adsorbent surface and consequently has
higher adsorption capacity in the adsorption process [45]. Fig. 4 (a & b) shows the surface of loaded adsorbent
of heat treated sludge at 200 and 600 ˚C. It is noticed that sludge surface has less porosity after adsorption. This
can be attributed to the heavy impregnation of iron onto the adsorbent surface [46]. The concentration of
adsorbate can be found more on treated sludge at 600 than 200 ˚C. This can be attributed to the high adsorption
capacity of treated sludge at 600 ˚C [47].
B A
C

Abdel-Aziz et al., JMES, 2017, 8 (5), pp. 1737-1747 1743
Fig. 4, SEM of sludge after adsorption process (A) Treated sludge at 200 ˚C (B) Treated sludge at 600 ˚C.
Also FTIR spectra show visible changes during heating of sludge, which are related to surface structure. Fig.5
shows detailed spectra evolution with heating for selected wavenumber ranges.
Fig. 5, FTIR spectra of sludge samples at different treatment temperatures.
A
B

Abdel-Aziz et al., JMES, 2017, 8 (5), pp. 1737-1747 1744
A broad band at 3616 cm-1
corresponds to O−H stretching vibrations. These functional groups may represent
compounds such as alcohols and carboxylic acids found in the sample. The peak at 1653 cm-1
is due to the
Amide I band. C=O stretching vibrations from other functionalities are found at the left of the 1700 cm-1
peak.
They refer to fatty acid carboxylic groups. The band at 1525 cm-1
may be due to N-H bending, which is
characteristic of the Amide II band. C=C aromatic skeletal vibrations can also be found between 1653 and 1500
cm-1
and may exist in the sample due to lignin structures41. In the interval between 1400 and 1525 cm-1
,
vibration of CH2 groups and O−H bending vibrations for alcohols and carboxylic acids cause a variety of peaks.
Consequently, a broad band around 1426 cm-1
is detected. Band at 1027 cm-1
has been assigned by several
authors to polysaccharides. Peak at 873 cm- can be assigned to inorganic carbonates, particularly calcium
carbonate. Spectrum below 875 cm-1
could be result of aromatic structures, amine and amide groups. In this
study, an attempt has been made to detail the FTIR spectra of sewage sludge and chars regarding the changes
experienced by the solid fraction through heat treatment within the entire temperature range (200-600 ˚C), while
being aware of its obvious limitations. In general, organic functional groups found in sewage sludge tend to
decrease with increasing temperature [48]. Also some structural changes in the solid matrix can be discerned.
4. Adsorption isotherm
The performance of an adsorbent can be studied by adsorption isotherm data, which can be obtained by a series
of experimental tests. Several isotherm models are commonly used in modeling the adsorption data, such as
Freundlich and Langmuir [48-51]. The Freundlich isotherm is based on power function equation (2):
𝑞𝑒𝑞 = 𝐾𝐹 .𝐶𝑒𝑞𝑛𝐹 (2)
qeq : Equilibrium loading in mg/g
Ceq : Equilibrium concentration in mg/L
KF : Freundlich constant in mg/g
nF :Freundlich exponent
The Freundlich exponent nF has a decisive influence on the profile of the adsorption isotherm. Fig. 6 gives a
qualitative representation of the profiles of three isotherms with different Freundlich exponents.
Fig. 6, Effect of n𝐹 on the isotherm curve
In the field of water treatment, it is usually aiming for very low equilibrium concentrations. In this case, the
equilibrium concentration corresponds to the maximum permitted adsorbate concentration in the treated
water. Upon reaching the equilibrium concentration ceq, isotherm 1 reaches a significantly higher loading
than compared to isotherm 3. In the case of isotherm 1 the adsorbent’s capacity is therefore utilized much
better. This means that much less adsorbent is required to reach the equilibrium concentration ceq than would
be needed in the case of isotherm 3. As such, in the case of Freundlich exponents < 1 is a favourable
isotherm curve. Accordingly, in Freundlich exponents > 1 there is an unfavorable curve. The Freundlich
exponent therefore allows us to express how well a substance can be adsorbed. Where: the smaller the
Freundlich exponent, the better the adsorbate can be adsorbed.

Abdel-Aziz et al., JMES, 2017, 8 (5), pp. 1737-1747 1745
0
0.02
0.04
0.06
0.08
0.1
0.12
70 75 80 85 90
Ce/q
e(g
/L)
Ce (mg/L)
(b)
The linear forms of the Freundlich and Langmuir isotherms are given in equations (3) and (4) respectively:
ln qe = ln KF + 1
n𝐹lnCeq (3)
C𝑒
qe=
1
qm KL +
C𝑒
qm (4)
Fig. 7 shows linear fitting of Freundlich and Langmuir adsorption isotherms of the sewage sludge adsorbent by
linear analysis. The data suggests that Freundlich isotherm model generates a satisfactory fit to the experimental
data, while Langmuir isotherm model cannot.
In the field of water treatment it is usually aimed for very low equilibrium concentrations. In this case, the
equilibrium concentration corresponds to the maximum permitted adsorbate concentration in the treated water.
As such, in the case of Freundlich exponent n < 1 is a favorable isotherm curve. For the present experimental
data n is 3.9 which confirms favorable isotherm at higher concentrations of Cu+2
.
Fig. 7, linear fitting of isotherm models for the adsorption of Cu+2
by treated sludge (Sludge treatment Temp =
600 ˚C; dosage: 6 g/L; contact time: 150 min; pH: 5.0; at room temperature and agitation speed: 200 rpm) (a)
Freundlich, (b) Langmuir
R² = 0.958
2000
4000
8000
64 128
qe
(mg
Cu
/g)
Ce (mg/L)
(a)

Abdel-Aziz et al., JMES, 2017, 8 (5), pp. 1737-1747 1746
Conclusions The main objectives of this work was to find a low cost material (sludge) used as heavy metals adsorbent, and
minimize the cost of heavy meals elimination using commercial adsorbent by using sewage sludge. The sludge
showed reasonable removal of Cu+2
and the % removal increased with increasing sludge dose and the
temperature at which sludge was treated. The process is considered a friendly environmental for sludge reuse.
SEM analysis confirmed that sludge treatment at temperature 600 ˚C produce smallest particle size and in turn
larger surface area which enhance the adsorption process.
FTIR spectra showed that organic functional groups found in sewage sludge tend to decrease with increasing
treatment temperature.
The present experimental data fitted well Freundlich linear isotherm model with an exponent of 3.9 for Cu+2
which confirms a favorable isotherm for high concentrations of Cu+2
. The mathematical correlation obtained by
the modeling analysis is important for operational design and applicable practice of the adsorption systems.
To minimize the total cost of heavy metals removal from wastewater using any commercial adsorbent like
activated carbon, the treated sludge can be used as preliminary treatment process that will eliminate the initial
concentration of heavy metals and in turn decrease the dose of followed commercial adsorbents.
Acknowledgment The authors gratefully acknowledge financial support of King Abdulaziz city for science and Technology (KACST)
project number) 41-32 ص.م ).
References 1. Fu F., Wang Q., J. Environmental Management, 92 (2011) 407.
2. Abdennebi N., Benhabib K., Goutaudier C., Bagane M., J. Mater. Environ. Sci., 8 (2017) 557.
3. Tran V.T., Nguyen D.T., Ho V.T.T. , Hoang P. Q. H., Bui P.Q, Bach L.G., J. Mater. Environ. Sci., 8
(2017) 426.
4. El-Ashtoukhy E.-S.Z., Amin N. K., Abdelwahab O., Desalination, 223 (2008) 162.
5. Abdel-Aziz M. H., Amin N. K., El-Ashtoukhy E-S. Z., Hydrometallurgy, 137 (2013) 126.
6. Alyüz B., Veli S., J. Hazard. Mat., 167 (2009) 482.
7. Abdel-Aziz M. H., Nirdosh I., Sedahmed G. H., Ind. Eng. Chem. Res., 52 (2013) 11655.
8. Rincon G. J., La Motta E. J., J. Environmental Management 144 (2014) 42.
9. Stefanowicz T., Osifiska M., Napieralska-Zagozda S., Hydrometallurgy 47 (1997) 69.
10. Gros F., Baup S., Aurousseau M., Chem. Eng. Process., 47 (2008) 295.
11. Abdel-Aziz M. H., Bassyouni M., Mansour I. A. S., Nagi A., J. Ind. Eng. Chem., 20 (2014) 2650.
12. Stajcic A., Nastasovic A., Trosic J. S., Markovic J., Onjia A., Radovanovic F., J. Env.Chem. Eng., 3
(2015) 453.
13. Agrawal A., Kumari S., Sahu K .K., J. Environmental Management, 92 (2011) 3105.
14. Awual, Md. R., Chem. Eng. J., 266 (2015) 368.
15. Huang C., He J., Chem. Eng. J., 221 (2013) 469.
16. Siu P. C. C., Koong L. F., Saleem J., Barford J., McKay G., Chinese J. Chem. Eng., 24 (2015) 94.
17. Al-Harahsheh M. S., Al Zboon K., Al-Makhadmehc L., Hararah M., Mahasneh M., J. Environm. Chem.
Eng., 3 (2015) 1669.
18. Mosier A. P., Behnke J., Jin E. T., Cady N. C., J. Environm. Manage. 160 (2015) 67.
19. Xu J., Qu Z., Yan N., Zhao Y., Xu X., Li L., Chem. Eng. J., 284 (2016) 565.
20. Bilal M., Shah J. A., Ashfaq T., Gardazi S. M. H., Tahir A. A., Pervez A., Haroon H., Mahmood Q., J.
Hazard. Mat., 263 (2013) 322.
21. Vega E., ector Monclús H, Gonzalez-Olmos R., Martin M. J., J. Environmental Management, 150
(2015) 111.
22. Xu G., Yang X., Spinosa L., J. Environmental Management, 151 (2015) 221.
23. Davis R.D., Water Sci. Technol., 30 (1994) 149.
24. Filali-Merknassi Y., Tyagi R. D., Arasiah K. S., Process biochemistry, 36 (2000) 263.
25. Mahjoub B., Ben Brahim, I., J. Mater. Environ. Sci., 6 (2015) 3359.
26. Joo S. H., Monaco F. D., Antmann E., Chorath P., J. Environmental Management, 158 (2015) 133.
27. Page A. L., Chang A. C., Sposito G., Mattigod S., Trace elements in wastewater, their effects on plant
growth and composition and their behavior in soils, (1981) pp 182 - 222. In: Iskander, I.K. (Ed.).
Modeling Wastewater Renovation, Land Treatment. New York: John Wiley & Sons.

Abdel-Aziz et al., JMES, 2017, 8 (5), pp. 1737-1747 1747
28. McGrath D., Postma L., McCormack R. J., Dowdall C., Irish Journal of Agricultural and Food Research
39 (2000) 73.
29. Pires A. M. M., Mattiazzo M. E., Scientia Agricola 60 (2003) 161.
30. Singh K. P., Mohan D., Sinha S., Dalwani R., Chemosphere 55 (2004) 227.
31. Fouladgar M., Beheshti M., Sabzyan H., J. Mol. Liq. 211 (2015) 1060.
32. E. Igberase, P. Osifo, Equilibrium, kinetic, thermodynamic and desorption studies of cadmium and lead
by polyaniline grafted cross-linked chitosan beads from aqueous solution, J. Ind. Eng. Chem., 26 (2015)
340 – 347.
33. Abdel-Aziz M. H., Hydrometallurgy, 109 (2011) 161.
34. Gutub S. A., Bassyouni M., Abdel-hamid S. M.-S., Life Science Journal, 10 (2013) 464.
35. Abdel-Aziz M. H., El-Ashtoukhy E-S. Z., Bassyouni M., Metallurgical and Materials Transactions B,
47 (2016) 657.
36. Negm N. A., El Sheikh R., El-Farargy A. F., Hefni H. H. H., Bekhit M., J. Ind. Eng. Chem., 21 (2015)
526.
37. Abdel-Aziz M. H., Gutub S., Soliman M. F., Bassyouni M., Rocznik Ochrona Środowiska, 18 (2016)
28.
38. Namasivayam C., Muniasamy N., Gayatri K., Rani M., Ranganathan K., Bioresource Technology, 57
(1996) 37.
39. Teker M., Imamoglo M., Saltabas O., Turk. J. Chem., 23 (1999) 185.
40. Abdel-Ghani N. T., Hefray M., EL-Chaghaby G. A. F., Int. J. Environ. Sci. Tech. 4 (2007) 67.
41. Shukla S. S., Shukla A., Zhang Y. H., Dudey P., Margrave J. L., J. Hazard. Mat., B95 (2002) 137.
42. Dorris L. L., YuL J., Shukla S. S., Shukla A., Margrave J. L., J. Hazard. Mat., B100 (2003) 3.
43. Chen X., Jeyaseelan S., J. Environ. Eng., 127 (2001) 585.
44. Ghasemi M., Naushad M., Ghasemi N., Khosravi-fard Y., J. Ind. Eng. Chem., 20 (2014) 2193.
45. Zaini M. A. A., Zakaria M., Mohd.-Setapar S.H., Che-Yunus M. A., J. Environm. Chem. Eng. 1 (2013)
1091.
46. Roy P., Mondal N. K., Das K., J. Environm. Chem. Eng., 2 (2014) 585.
47. Lu G. Q., Low J. C. F., Liu C. Y., Lua A. C., Fuel, 74 (1995) 344.
48. Bandosz T. J., Block K., Appl. Catal. B-Environ., 67 (2006) 77.
49. Foo K. Y., Hameed B. H., Chem. Eng. J., 156 (2010) 2.
50. Langmuir I., J. Am. Chem. Soc., 38 (1916) 2221.
51. Freundlich H. M. F., J. Phys. Chem., 57 (1906) 385.
(2017); http://www.jmaterenvironsci.com


![Biochar Absorbents for Heavy Metals and Volatile Organics ... · • Industrial wastewater is discharged into the water [3] - 90% of wastewater produced. Background and Motivation](https://img.pdfslide.us/doc/110x75/5e8c9eab237ced4c09084272/biochar-absorbents-for-heavy-metals-and-volatile-organics-a-industrial-wastewater.jpg)