Embed Size (px)
Citation preview
Separation and Purification Technology 37 (2004) 81–92
Removal of dye from wastewater using micellar-enhancedultrafiltration and recovery of surfactant
M.K. Purkait, S. DasGupta, S. De∗
Department of Chemical Engineering, Indian Institute of Technology, Kharagpur 721302, India
Received 13 June 2003; received in revised form 6 August 2003; accepted 27 August 2003
Abstract
Micellar enhanced ultrafiltration (MEUF) is used to remove acid dye from aqueous solution. Cetyl(hexadecyl) pyridiniumchloride (CPC) and eosin (molecular weight 691.86) have been taken as cationic surfactant and acid dye, respectively. An organicpolyamide membrane of molecular weight cut-off 1000 is used in unstirred batch experiments. The effects of surfactant-to-dyeconcentration ratio in the feed and the transmembrane pressure drop on permeate flux and observed retention of the dye havebeen studied as a function of the operating time. The retention of dye without using surfactant is only 10% at a typical feeddye concentration of 10 × 10−3 kg/m3. Whereas under the same operating pressure (276 kPa), retention increases up to 73.4%using surfactant micelles. The maximum retention of eosin is obtained at a surfactant-to-eosin ratio of 2000. Free surfactantsmolecules present in the permeate are then recovered by a two-step chemical treatment procedure. In the first step, surfactant isprecipitated by potassium iodide and in the second step, the surfactant is recovered from the precipitate by addition of cupricchloride. In the first step, 1:1 molar ratio of potassium iodide to CPC results in about 90% precipitation of the surfactant. In thesecond step, 5:1 molar ratio of cupric chloride-to-cetyl pyridinium iodide (CPI, precipitated form of CPC) leads to about 90%recovery of the surfactant.© 2003 Elsevier B.V. All rights reserved.
Keywords: Solubilized molecules; Cationic surfactant; Precipitation; Micellar-enhanced ultrafiltration; Permeate flux; Observed retention
1. Introduction
Dye containing waste stream is one of the majortoxic industrial waste. Various types of dyes are usedin the process industries like textile, pulp and paper,paints etc. The effluents containing dyes are highlycolored and cause water pollution. Eosin is one suchdye and is used to color wool and silk. It is also usedin poster printing. Most red inks are dilute solutions
∗ Corresponding author. Tel.: +91-3222-283926;fax: +91-3222-2755303.
E-mail address: [email protected] (S. De).
of eosin [1]. In the present work, treatment of eosindye containing aqueous stream by micellar-enhancedultrafiltration (MEUF) is addressed.
Several techniques for removal of colored dye fromwastewater, i.e., coagulation/flocculation [2], variousadvance oxidation processes [3–9] and adsorption onto: (i) sludge of wastewater treatment plant [10]; (ii)different bentonites [11,12]; (iii) different types of ac-tivated carbon [13]; and (iv) surfactant impregnatedmontmorillonite [14], etc., are available in the liter-ature. Among these, adsorption is the most commontechnique. But it is inherently a slow process and itsperformance is limited by equilibrium. Nanofiltration
1383-5866/$ – see front matter © 2003 Elsevier B.V. All rights reserved.doi:10.1016/j.seppur.2003.08.005
82 M.K. Purkait et al. / Separation and Purification Technology 37 (2004) 81–92
Nomenclature
CPC cetyl(hexadecyl) pyridinium chlorideCp permeate concentration (kg/m3).C0 bulk concentration (kg/m3).R0 observed retention (1 − Cp/C0)
(NF) can be used for removal of these dyes [15] butthe major limitation of membrane-based separationprocesses is the decline in permeate flux due to con-centration polarization over the membrane surface andmembrane fouling.
In the present work, experimental investigationshave been undertaken to separate colored dye fromaqueous stream based on micellar-enhanced ultrafil-tration using an unstirred batch UF cell. The effectsof different operating conditions on the permeateflux and retention characteristic have been studiedin detail. In MEUF, dye-containing effluent needs tobe treated by a surfactant stream with a concentra-tion well above the critical micellar concentration(CMC). The CMC of cetyl pyridinium chloride is0.3222 kg/m3 in aqueous medium [16]. Most of thesolute (dye) molecules are solubilized in the micellesand these micelles being larger in size are rejectedby the ultrafiltration membrane. The permeate streamcontains unsolubilized solutes and free surfactants.Therefore, MEUF may be used as a polishing stepto nanofiltration. To make the MEUF system moreeconomical, it is also necessary to recycle the surfac-tant molecules that are present in the permeate streambefore final disposal. A two-step chemical treatmentprocess has been adopted to recover the surfactantfrom the permeate stream [17,18]. In the first step,monovalent iodide (I−) is used to precipitate cetylpyridinium ion. In the second step, concentrated CPCis regenerated using cupric chloride solution and isrecycled back to the feed stream. The optimum con-sumption of potassium iodide and cupric chloride arealso obtained experimentally.
2. Experimental
2.1. Materials
The different chemicals used are as follows: (i)surfactant CPC (MW 358) has been procured from
SISCO Research Laboratories, India; (ii) dye eosin(molecular weight 691.86) is obtained from BDHLaboratories, UK; (iii) potassium iodide (KI) andcupric chloride (CuCl2·2H2O) are obtained fromMerck, India. The structures of CPC and eosin arepresented in Appendix A.
2.2. Membranes
Organic polyamide membranes of molecular weightcut-off 1000, obtained from Permionics, Baroda (In-dia) has been used for the experiments. The perme-ability of the membrane is 3.57 × 10⁻¹¹ m/Pa s.
2.3. Ultrafiltration cell
Fifty milliliter ultrafiltration cell (MILLIPORE),model 8050, USA, has been used to conduct un-stirred batch experiments. The membrane diameter is44.5 mm and the effective membrane area is 13.4 cm2.The maximum operating pressure is 518 kPa.
2.4. Design of experiment
2.4.1. Micellar-enhanced ultrafiltrationFiltration experiments are carried out in the un-
stirred batch cell with feed containing: (i) only dye;and (ii) the mixture of surfactant and dye with differ-ent concentrations. Durations of ultrafiltration experi-ments are about 40 min for only dye solution and about60 min for dye and surfactant mixture. Experimentsare designed to observe the effects of surfactant-to-solute ratio and the transmembrane pressure drop onretention of the dye and the permeate flux. The se-lected operating pressures are 276, 345 and 414 kPa.For the filtration of only dye, a feed concentration of10×10−3 kg/m3 is selected. For the dye and surfactantmixture, two combinations of feed compositions arechosen. In the first case, dye concentration is kept con-stant at 10 × 10−3 kg/m3 and CPC concentrations arevaried as 5, 10, 20 and 25 kg/m3. In the second case,CPC concentration is kept constant at 10 kg/m3 anddye concentrations are varied as 5 × 10⁻³, 10 × 10−3,20 × 10−3, 30 × 10−3 and 40 × 10−3 kg/m3.
2.4.2. Chemical treatment for recycle ofCPC and eosin
Recovery of surfactant from the permeate streambefore final disposal is carried out by two successive
M.K. Purkait et al. / Separation and Purification Technology 37 (2004) 81–92 83
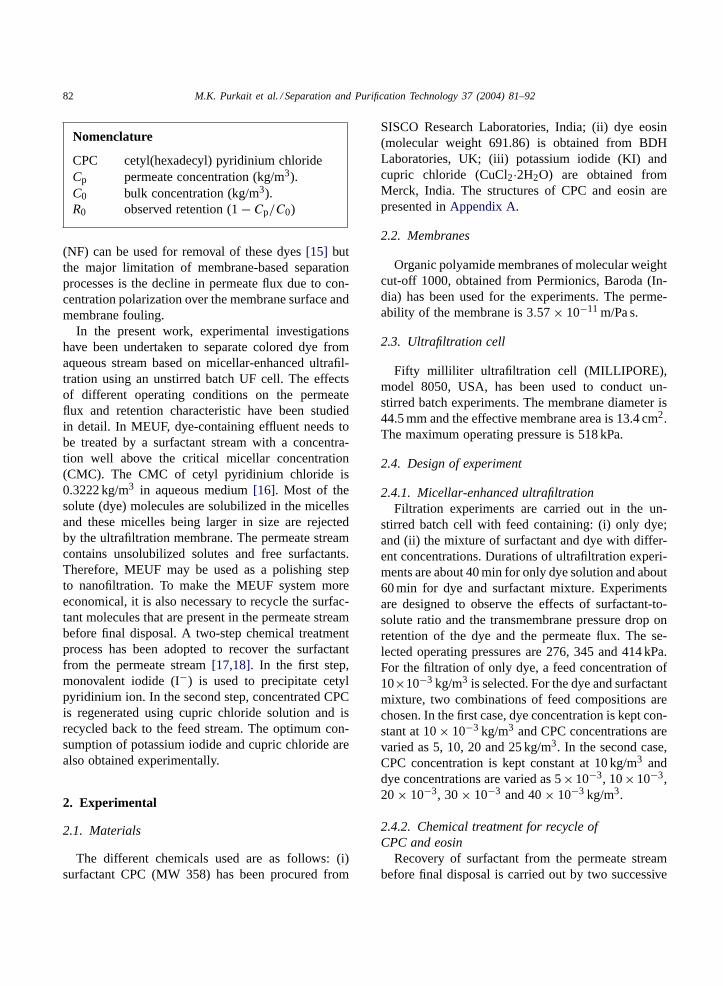
MEUF Retentate stream
Permeate Unsolubilized eosin and
surfactant KI
Chemical Treatment I
Disposable filtratePrecipitate
ChemicalTreatment II CuCl2.
Disposable precipitateSurfactant rich filtrate:
(Reusable stream)
Feed: Surfactant and Eosin dye.
Fig. 1. Schematic of the dye removal by MEUF and recovery of surfactants by chemical treatments.
chemical treatments. The main reactions of chem-ical treatments I and II as shown in Fig. 1 havebeen presented in Appendices A and B, respec-tively. A series of experiments have been carriedout to obtain the optimum ratio of KI-to-CPC formaximum precipitation of the surfactant in chemi-cal treatment I. Similarly, the ratio of CuCl2-to-cetylpyridinium iodide (CPI) in chemical treatmentII is varied to achieve maximum generation ofCPC.
2
3
1
4
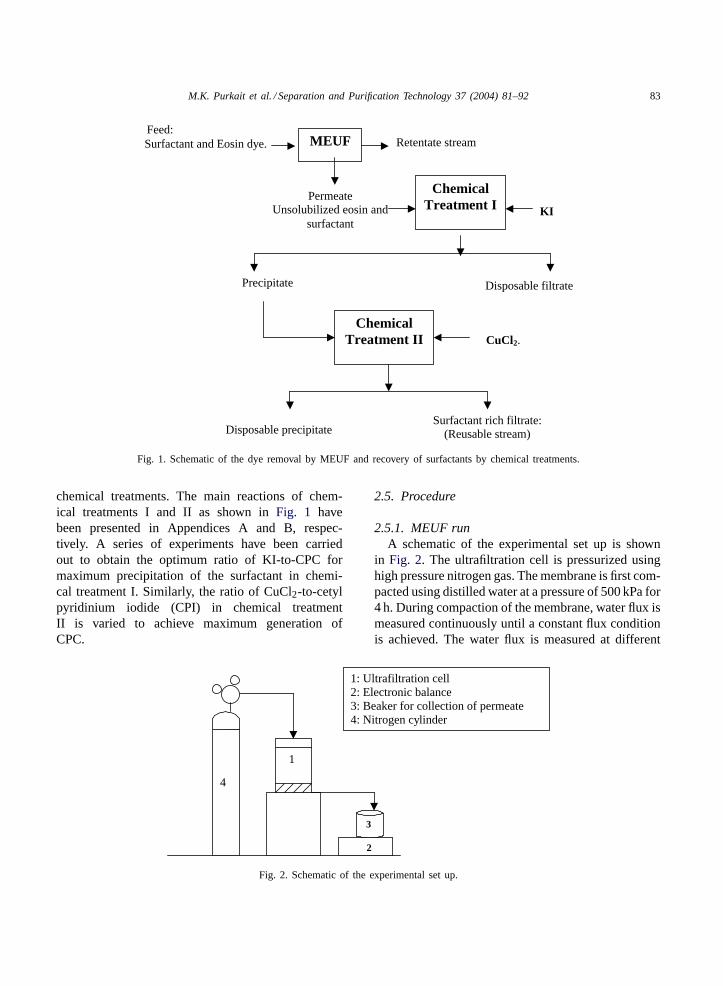
1: Ultrafiltration cell 2: Electronic balance 3: Beaker for collection of permeate 4: Nitrogen cylinder
Fig. 2. Schematic of the experimental set up.
2.5. Procedure
2.5.1. MEUF runA schematic of the experimental set up is shown
in Fig. 2. The ultrafiltration cell is pressurized usinghigh pressure nitrogen gas. The membrane is first com-pacted using distilled water at a pressure of 500 kPa for4 h. During compaction of the membrane, water flux ismeasured continuously until a constant flux conditionis achieved. The water flux is measured at different
84 M.K. Purkait et al. / Separation and Purification Technology 37 (2004) 81–92
operating pressures and from the slope of the flux ver-sus pressure curve, the membrane permeability is de-termined (3.57 × 10⁻¹¹ m/Pa s).
Feed solution for each experimental run is preparedby weighing exact amount of solute and surfactant anddissolving them in distilled water. After filling by thefeed solution, the cell is pressurized at the operatingpressure using a pressure regulator. Permeate from thebottom of the cell is collected in a small beaker (10 mlcapacity), where its cumulative weight is continuouslymeasured with the help of an electronic balance. Thecumulative weights are converted to cumulative vol-umes and from the slope of the cumulative volumeversus time curve, the permeate flux is obtained as afunction of operating time. The permeate concentra-tions are measured spectrophotometrically [19]. Theobserved retention of the species is defined as R0 =1 − Cp/C0.
After each run, the cell and the membrane arewashed thoroughly with distilled water. The mem-brane permeability is checked and it has been observedthat the permeability varies within ±2% of the initiallymeasured value. All the experiments have been con-ducted at room temperature (32 ± 2 ◦C). A schematicof the experimental set up is shown in Fig. 2.
2.5.2. Chemical treatmentA typical permeate of the MEUF experiment, corre-
sponding to the optimum dye in the feed-to-surfactantratio (for maximum dye retention), has been selectedfor the chemical treatment I. Keeping the CPC con-centration (at the permeate level) constant, the KIconcentrations are varied. The solution is filtered aftercomplete precipitation. The equilibrium concentra-tions of CPC and eosin in filtrate have been measuredusing UV-spectrophotometer and the amounts of CPCprecipitated and solubilized eosin in the precipitatehave been calculated by material balance.
In the chemical treatment II, CuCl2 solution hasbeen added in different concentrations to the precipi-tate that is obtained from chemical treatment I. Percentredissolution of CPC and eosin have been calculatedin the same way as in chemical treatment I.
2.6. Analysis
Feed and permeate concentrations of surfactantand solute are measured by a UV-spectrophotometer
(make: Thermo Spectronic, USA; model: GENESYS2). The wavelengths at which maximum absorptionoccur are 259 nm for CPC and 517 nm for eosin. Themolar extinction coefficients are obtained from themeasurements of the pure components. This coef-ficient for CPC is 3852.57 m3/kg cm at 259 nm and10.47 m3/kg cm at 517 nm. For eosin, the coefficientsare 28920.51 and 75462.67 m3/kg cm at the wave-lengths of 259 and 517 nm, respectively. Concentra-tions of the dye and the surfactant in the mixture aremeasured using the standard method [19].
3. Results and discussions
This section is divided into two parts, namely: (i)micellar-enhanced ultrafiltration; and (ii) chemicaltreatment (I and II).
3.1. Micellar-enhanced ultrafiltration
3.1.1. Variations of eosin retention and permeateflux during UF of eosin solution in absence and inpresence of surfactant
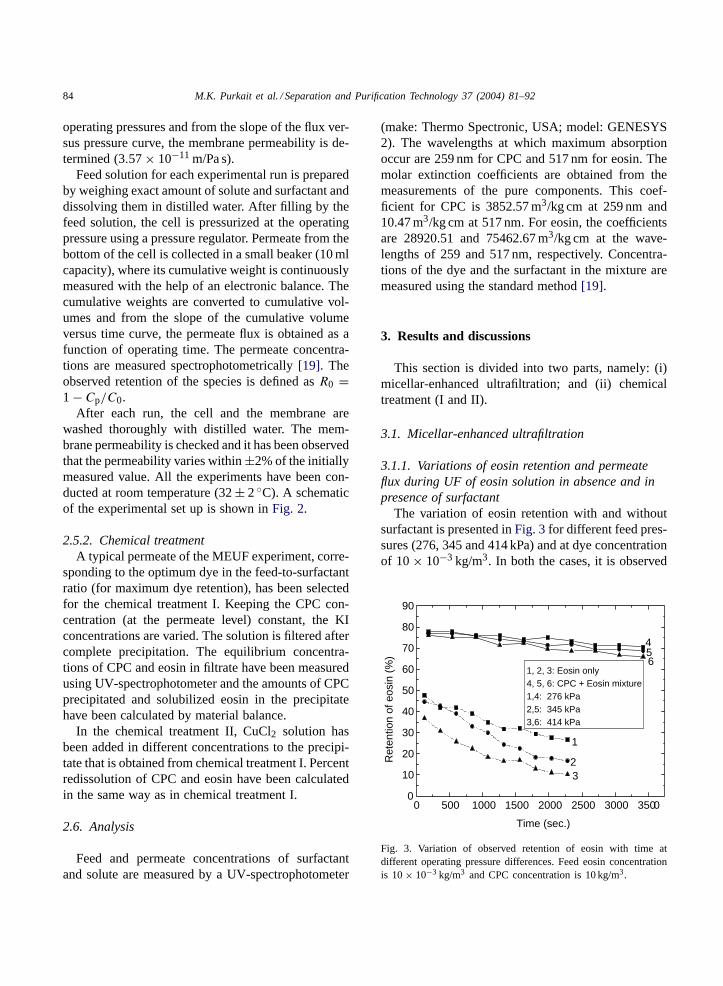
The variation of eosin retention with and withoutsurfactant is presented in Fig. 3 for different feed pres-sures (276, 345 and 414 kPa) and at dye concentrationof 10 × 10−3 kg/m3. In both the cases, it is observed
0 500 1000 1500 2000 2500 3000 35000
10
20
30
40
50
60
70
80
90
1, 2, 3: Eosin only4, 5, 6: CPC + Eosin mixture1,4: 276 kPa2,5: 345 kPa3,6: 414 kPa
654
32
1
Ret
entio
n of
eos
in (
%)
Time (sec.)
Fig. 3. Variation of observed retention of eosin with time atdifferent operating pressure differences. Feed eosin concentrationis 10 × 10−3 kg/m3 and CPC concentration is 10 kg/m3.
M.K. Purkait et al. / Separation and Purification Technology 37 (2004) 81–92 85
0 500 1000 1500 2000 2500 3000 35004
6
8
10
121, 2, 3: Eosin only4, 5, 6: CPC + Eosin mixture1,4: 276 kPa2,5: 345 kPa3,6: 414 kPa
65
4
3
2
1
Flu
x X
10
6 (m
3 /m2 ·s
)
Time (sec.)
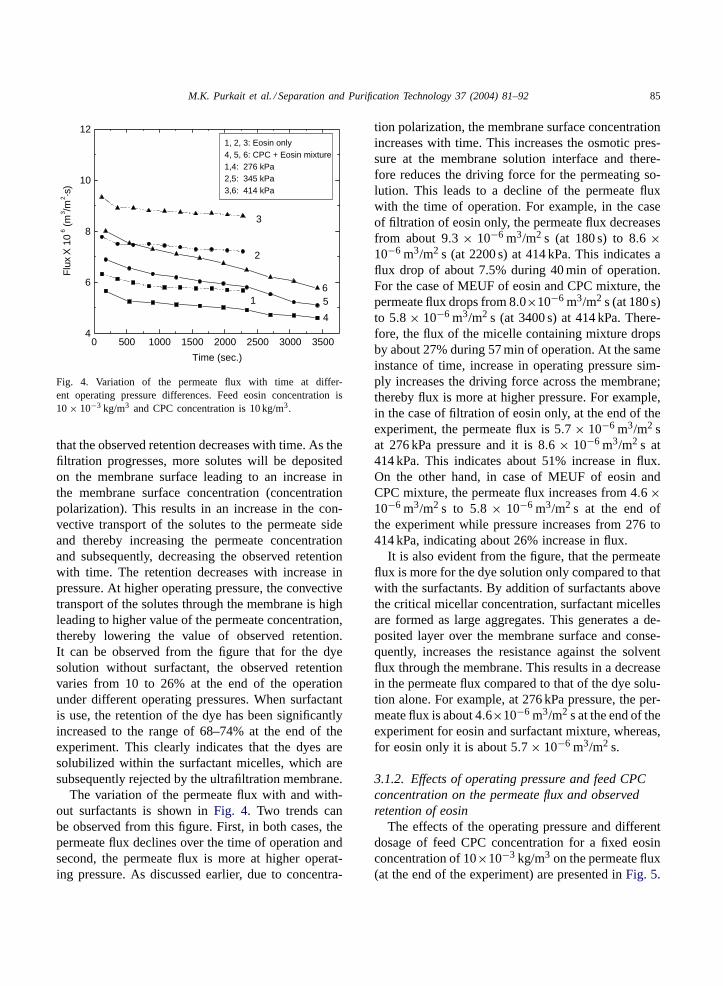
Fig. 4. Variation of the permeate flux with time at differ-ent operating pressure differences. Feed eosin concentration is10 × 10−3 kg/m3 and CPC concentration is 10 kg/m3.
that the observed retention decreases with time. As thefiltration progresses, more solutes will be depositedon the membrane surface leading to an increase inthe membrane surface concentration (concentrationpolarization). This results in an increase in the con-vective transport of the solutes to the permeate sideand thereby increasing the permeate concentrationand subsequently, decreasing the observed retentionwith time. The retention decreases with increase inpressure. At higher operating pressure, the convectivetransport of the solutes through the membrane is highleading to higher value of the permeate concentration,thereby lowering the value of observed retention.It can be observed from the figure that for the dyesolution without surfactant, the observed retentionvaries from 10 to 26% at the end of the operationunder different operating pressures. When surfactantis use, the retention of the dye has been significantlyincreased to the range of 68–74% at the end of theexperiment. This clearly indicates that the dyes aresolubilized within the surfactant micelles, which aresubsequently rejected by the ultrafiltration membrane.
The variation of the permeate flux with and with-out surfactants is shown in Fig. 4. Two trends canbe observed from this figure. First, in both cases, thepermeate flux declines over the time of operation andsecond, the permeate flux is more at higher operat-ing pressure. As discussed earlier, due to concentra-
tion polarization, the membrane surface concentrationincreases with time. This increases the osmotic pres-sure at the membrane solution interface and there-fore reduces the driving force for the permeating so-lution. This leads to a decline of the permeate fluxwith the time of operation. For example, in the caseof filtration of eosin only, the permeate flux decreasesfrom about 9.3 × 10⁻⁶ m3/m2 s (at 180 s) to 8.6 ×10⁻⁶ m3/m2 s (at 2200 s) at 414 kPa. This indicates aflux drop of about 7.5% during 40 min of operation.For the case of MEUF of eosin and CPC mixture, thepermeate flux drops from 8.0×10⁻⁶ m3/m2 s (at 180 s)to 5.8 × 10⁻⁶ m3/m2 s (at 3400 s) at 414 kPa. There-fore, the flux of the micelle containing mixture dropsby about 27% during 57 min of operation. At the sameinstance of time, increase in operating pressure sim-ply increases the driving force across the membrane;thereby flux is more at higher pressure. For example,in the case of filtration of eosin only, at the end of theexperiment, the permeate flux is 5.7 × 10⁻⁶ m3/m2 sat 276 kPa pressure and it is 8.6 × 10⁻⁶ m3/m2 s at414 kPa. This indicates about 51% increase in flux.On the other hand, in case of MEUF of eosin andCPC mixture, the permeate flux increases from 4.6 ×10⁻⁶ m3/m2 s to 5.8 × 10⁻⁶ m3/m2 s at the end ofthe experiment while pressure increases from 276 to414 kPa, indicating about 26% increase in flux.
It is also evident from the figure, that the permeateflux is more for the dye solution only compared to thatwith the surfactants. By addition of surfactants abovethe critical micellar concentration, surfactant micellesare formed as large aggregates. This generates a de-posited layer over the membrane surface and conse-quently, increases the resistance against the solventflux through the membrane. This results in a decreasein the permeate flux compared to that of the dye solu-tion alone. For example, at 276 kPa pressure, the per-meate flux is about 4.6×10⁻⁶ m3/m2 s at the end of theexperiment for eosin and surfactant mixture, whereas,for eosin only it is about 5.7 × 10⁻⁶ m3/m2 s.
3.1.2. Effects of operating pressure and feed CPCconcentration on the permeate flux and observedretention of eosin
The effects of the operating pressure and differentdosage of feed CPC concentration for a fixed eosinconcentration of 10×10−3 kg/m3 on the permeate flux(at the end of the experiment) are presented in Fig. 5.
86 M.K. Purkait et al. / Separation and Purification Technology 37 (2004) 81–92
500 1000 1500 2000 2500
3.5
4.0
4.5
5.0
5.5
6.0
6.5
7.0
7.5
Eosin: 10 x 10-3kg/m
3
Pressure (kPa):1: 2762: 3453: 414
3
2
1
Flu
x X
10
6 (m
3 /m2 ·s
)
CPC to eosin ratio
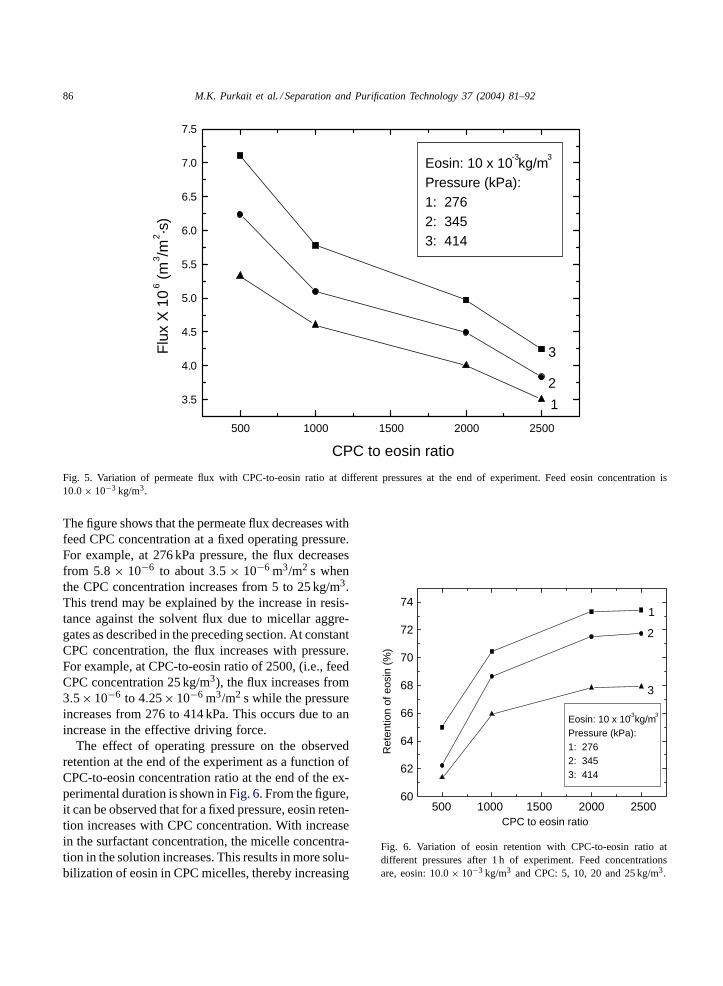
Fig. 5. Variation of permeate flux with CPC-to-eosin ratio at different pressures at the end of experiment. Feed eosin concentration is10.0 × 10−3 kg/m3.
The figure shows that the permeate flux decreases withfeed CPC concentration at a fixed operating pressure.For example, at 276 kPa pressure, the flux decreasesfrom 5.8 × 10⁻⁶ to about 3.5 × 10⁻⁶ m3/m2 s whenthe CPC concentration increases from 5 to 25 kg/m3.This trend may be explained by the increase in resis-tance against the solvent flux due to micellar aggre-gates as described in the preceding section. At constantCPC concentration, the flux increases with pressure.For example, at CPC-to-eosin ratio of 2500, (i.e., feedCPC concentration 25 kg/m3), the flux increases from3.5 × 10−6 to 4.25 × 10⁻⁶ m3/m2 s while the pressureincreases from 276 to 414 kPa. This occurs due to anincrease in the effective driving force.
The effect of operating pressure on the observedretention at the end of the experiment as a function ofCPC-to-eosin concentration ratio at the end of the ex-perimental duration is shown in Fig. 6. From the figure,it can be observed that for a fixed pressure, eosin reten-tion increases with CPC concentration. With increasein the surfactant concentration, the micelle concentra-tion in the solution increases. This results in more solu-bilization of eosin in CPC micelles, thereby increasing
500 1000 1500 2000 250060
62
64
66
68
70
72
74
Eosin: 10 x 10-3kg/m
3
Pressure (kPa):1: 276 2: 3453: 414
3
2
1
Ret
entio
n of
eos
in (
%)
CPC to eosin ratio
Fig. 6. Variation of eosin retention with CPC-to-eosin ratio atdifferent pressures after 1 h of experiment. Feed concentrationsare, eosin: 10.0 × 10⁻³ kg/m3 and CPC: 5, 10, 20 and 25 kg/m3.
M.K. Purkait et al. / Separation and Purification Technology 37 (2004) 81–92 87
the retention of eosin. For a fixed CPC-to-eosin ratio,the retention of eosin increases with the decrease inthe operating pressure. This may be due to the fact thatat higher operating pressure, micelles may becomecompact and therefore solubilization capability of themicelles decreases [20]. Therefore, less amount ofdye is solubilized in the micelles at higher operatingpressure. The permeate concentration increases lead-ing to a decrease in the observed retention of eosin athigher pressure. It can also be observed from Fig. 6that at a fixed pressure, the increase of eosin retentionis fast for lower CPC-to-eosin concentration ratio andis gradual as this ratio is increased. Beyond a ratioof 2000, the increase in eosin retention is marginal.Therefore, lower operating pressure and a ratio of feedconcentration of CPC-to-eosin of 2000 may be con-sidered as optimum for maximum removal of eosin.
3.1.3. Effects of feed eosin concentrations on theobserved retention of dye at a fixed CPC feedconcentration
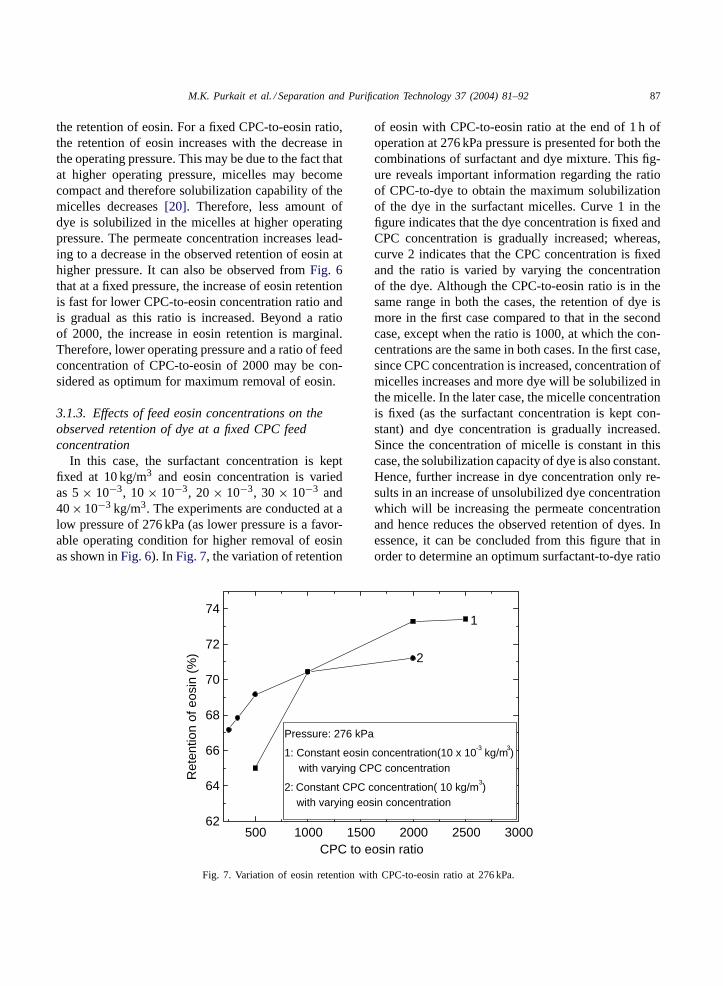
In this case, the surfactant concentration is keptfixed at 10 kg/m3 and eosin concentration is variedas 5 × 10⁻³, 10 × 10−3, 20 × 10−3, 30 × 10−3 and40 × 10−3 kg/m3. The experiments are conducted at alow pressure of 276 kPa (as lower pressure is a favor-able operating condition for higher removal of eosinas shown in Fig. 6). In Fig. 7, the variation of retention
500 1000 1500 2000 2500 300062
64
66
68
70
72
74
Pressure: 276 kPa
1: Constant eosin concentration(10 x 10-3 kg/m
3)
with varying CPC concentration
2: Constant CPC concentration( 10 kg/m3)
with varying eosin concentration
2
1
Ret
entio
n of
eos
in (
%)
CPC to eosin ratio
Fig. 7. Variation of eosin retention with CPC-to-eosin ratio at 276 kPa.
of eosin with CPC-to-eosin ratio at the end of 1 h ofoperation at 276 kPa pressure is presented for both thecombinations of surfactant and dye mixture. This fig-ure reveals important information regarding the ratioof CPC-to-dye to obtain the maximum solubilizationof the dye in the surfactant micelles. Curve 1 in thefigure indicates that the dye concentration is fixed andCPC concentration is gradually increased; whereas,curve 2 indicates that the CPC concentration is fixedand the ratio is varied by varying the concentrationof the dye. Although the CPC-to-eosin ratio is in thesame range in both the cases, the retention of dye ismore in the first case compared to that in the secondcase, except when the ratio is 1000, at which the con-centrations are the same in both cases. In the first case,since CPC concentration is increased, concentration ofmicelles increases and more dye will be solubilized inthe micelle. In the later case, the micelle concentrationis fixed (as the surfactant concentration is kept con-stant) and dye concentration is gradually increased.Since the concentration of micelle is constant in thiscase, the solubilization capacity of dye is also constant.Hence, further increase in dye concentration only re-sults in an increase of unsolubilized dye concentrationwhich will be increasing the permeate concentrationand hence reduces the observed retention of dyes. Inessence, it can be concluded from this figure that inorder to determine an optimum surfactant-to-dye ratio
88 M.K. Purkait et al. / Separation and Purification Technology 37 (2004) 81–92
0 500 1000 1500 2000 250092
93
94
95
96
97
98
99
100
Pressure (kPa):1, 3: 276; 2: 414
1, 2: Constant eosin concentration(10 x 10-3 kg/m3) with varying CPC concentration
3: Constant CPC concentration(10 kg/m3) with varying eosin concentration
3
21
Ret
entio
n of
CP
C (
%)
CPC to eosin ratio
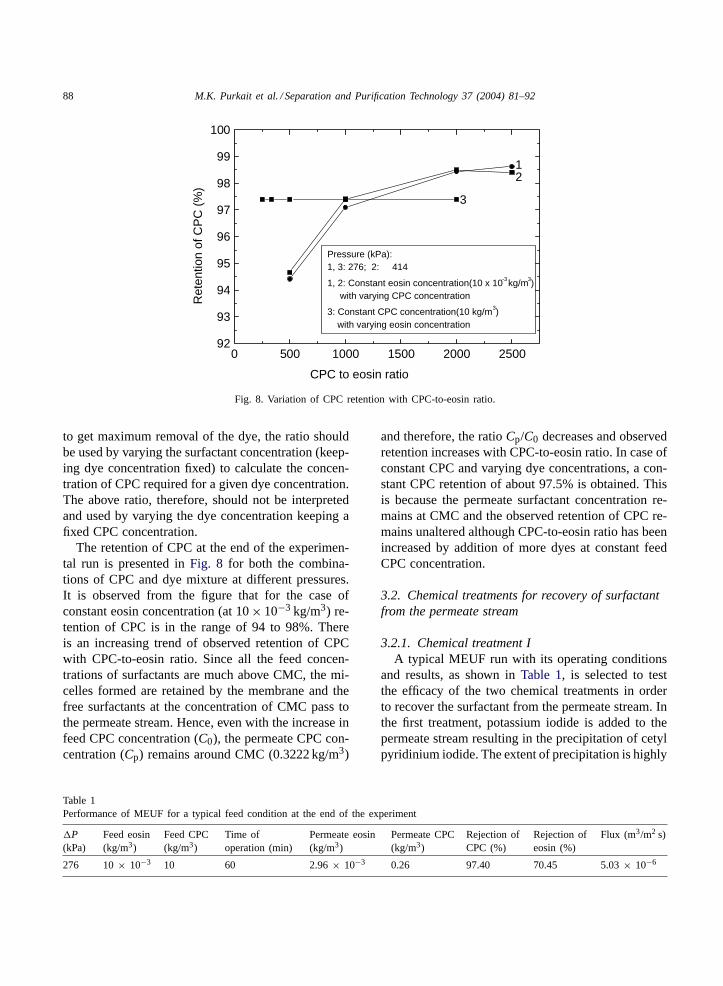
Fig. 8. Variation of CPC retention with CPC-to-eosin ratio.
to get maximum removal of the dye, the ratio shouldbe used by varying the surfactant concentration (keep-ing dye concentration fixed) to calculate the concen-tration of CPC required for a given dye concentration.The above ratio, therefore, should not be interpretedand used by varying the dye concentration keeping afixed CPC concentration.
The retention of CPC at the end of the experimen-tal run is presented in Fig. 8 for both the combina-tions of CPC and dye mixture at different pressures.It is observed from the figure that for the case ofconstant eosin concentration (at 10 × 10−3 kg/m3) re-tention of CPC is in the range of 94 to 98%. Thereis an increasing trend of observed retention of CPCwith CPC-to-eosin ratio. Since all the feed concen-trations of surfactants are much above CMC, the mi-celles formed are retained by the membrane and thefree surfactants at the concentration of CMC pass tothe permeate stream. Hence, even with the increase infeed CPC concentration (C0), the permeate CPC con-centration (Cp) remains around CMC (0.3222 kg/m3)
Table 1Performance of MEUF for a typical feed condition at the end of the experiment
�P(kPa)
Feed eosin(kg/m3)
Feed CPC(kg/m3)
Time ofoperation (min)
Permeate eosin(kg/m3)
Permeate CPC(kg/m3)
Rejection ofCPC (%)
Rejection ofeosin (%)
Flux (m3/m2 s)
276 10 × 10−3 10 60 2.96 × 10⁻³ 0.26 97.40 70.45 5.03 × 10⁻⁶
and therefore, the ratio Cp/C0 decreases and observedretention increases with CPC-to-eosin ratio. In case ofconstant CPC and varying dye concentrations, a con-stant CPC retention of about 97.5% is obtained. Thisis because the permeate surfactant concentration re-mains at CMC and the observed retention of CPC re-mains unaltered although CPC-to-eosin ratio has beenincreased by addition of more dyes at constant feedCPC concentration.
3.2. Chemical treatments for recovery of surfactantfrom the permeate stream
3.2.1. Chemical treatment IA typical MEUF run with its operating conditions
and results, as shown in Table 1, is selected to testthe efficacy of the two chemical treatments in orderto recover the surfactant from the permeate stream. Inthe first treatment, potassium iodide is added to thepermeate stream resulting in the precipitation of cetylpyridinium iodide. The extent of precipitation is highly
M.K. Purkait et al. / Separation and Purification Technology 37 (2004) 81–92 89
0 2 4 6 8 10
30
40
50
60
70
80
90
100
1: For CPC2: For eosin
2
1
Per
cent
age
of p
reci
pita
ted
CP
C o
r eo
sin
Feed KI to CPC ratio
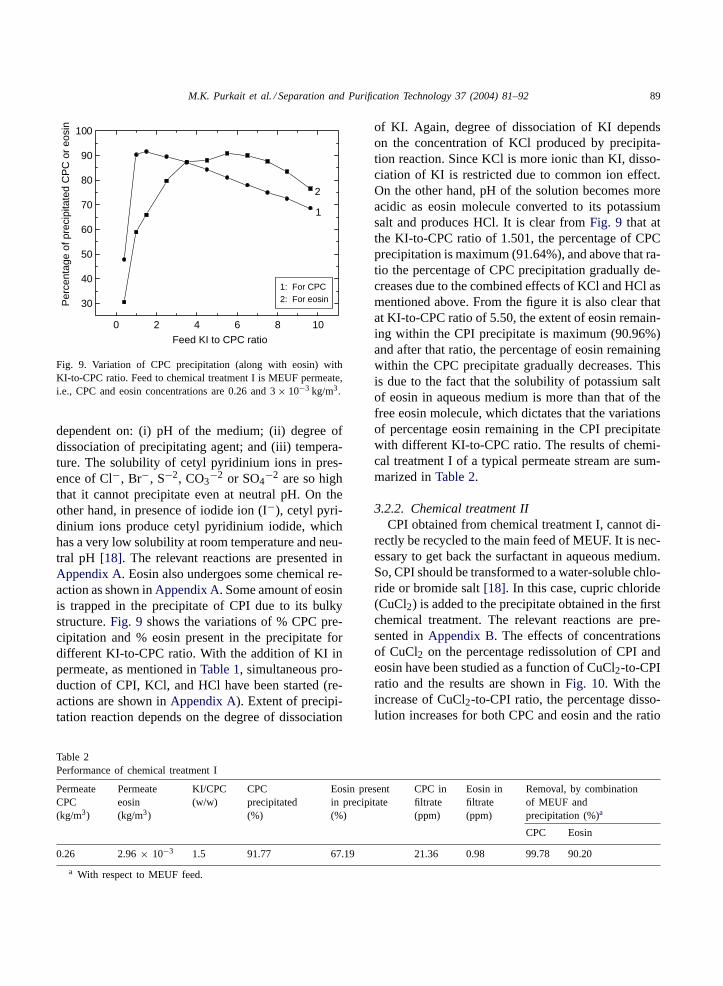
Fig. 9. Variation of CPC precipitation (along with eosin) withKI-to-CPC ratio. Feed to chemical treatment I is MEUF permeate,i.e., CPC and eosin concentrations are 0.26 and 3 × 10⁻³ kg/m3.
dependent on: (i) pH of the medium; (ii) degree ofdissociation of precipitating agent; and (iii) tempera-ture. The solubility of cetyl pyridinium ions in pres-ence of Cl−, Br−, S−2, CO3
−2 or SO4−2 are so high
that it cannot precipitate even at neutral pH. On theother hand, in presence of iodide ion (I−), cetyl pyri-dinium ions produce cetyl pyridinium iodide, whichhas a very low solubility at room temperature and neu-tral pH [18]. The relevant reactions are presented inAppendix A. Eosin also undergoes some chemical re-action as shown in Appendix A. Some amount of eosinis trapped in the precipitate of CPI due to its bulkystructure. Fig. 9 shows the variations of % CPC pre-cipitation and % eosin present in the precipitate fordifferent KI-to-CPC ratio. With the addition of KI inpermeate, as mentioned in Table 1, simultaneous pro-duction of CPI, KCl, and HCl have been started (re-actions are shown in Appendix A). Extent of precipi-tation reaction depends on the degree of dissociation
Table 2Performance of chemical treatment I
PermeateCPC(kg/m3)
Permeateeosin(kg/m3)
KI/CPC(w/w)
CPCprecipitated(%)
Eosin presentin precipitate(%)
CPC infiltrate(ppm)
Eosin infiltrate(ppm)
Removal, by combinationof MEUF andprecipitation (%)a
CPC Eosin
0.26 2.96 × 10⁻³ 1.5 91.77 67.19 21.36 0.98 99.78 90.20
a With respect to MEUF feed.
of KI. Again, degree of dissociation of KI dependson the concentration of KCl produced by precipita-tion reaction. Since KCl is more ionic than KI, disso-ciation of KI is restricted due to common ion effect.On the other hand, pH of the solution becomes moreacidic as eosin molecule converted to its potassiumsalt and produces HCl. It is clear from Fig. 9 that atthe KI-to-CPC ratio of 1.501, the percentage of CPCprecipitation is maximum (91.64%), and above that ra-tio the percentage of CPC precipitation gradually de-creases due to the combined effects of KCl and HCl asmentioned above. From the figure it is also clear thatat KI-to-CPC ratio of 5.50, the extent of eosin remain-ing within the CPI precipitate is maximum (90.96%)and after that ratio, the percentage of eosin remainingwithin the CPC precipitate gradually decreases. Thisis due to the fact that the solubility of potassium saltof eosin in aqueous medium is more than that of thefree eosin molecule, which dictates that the variationsof percentage eosin remaining in the CPI precipitatewith different KI-to-CPC ratio. The results of chemi-cal treatment I of a typical permeate stream are sum-marized in Table 2.
3.2.2. Chemical treatment IICPI obtained from chemical treatment I, cannot di-
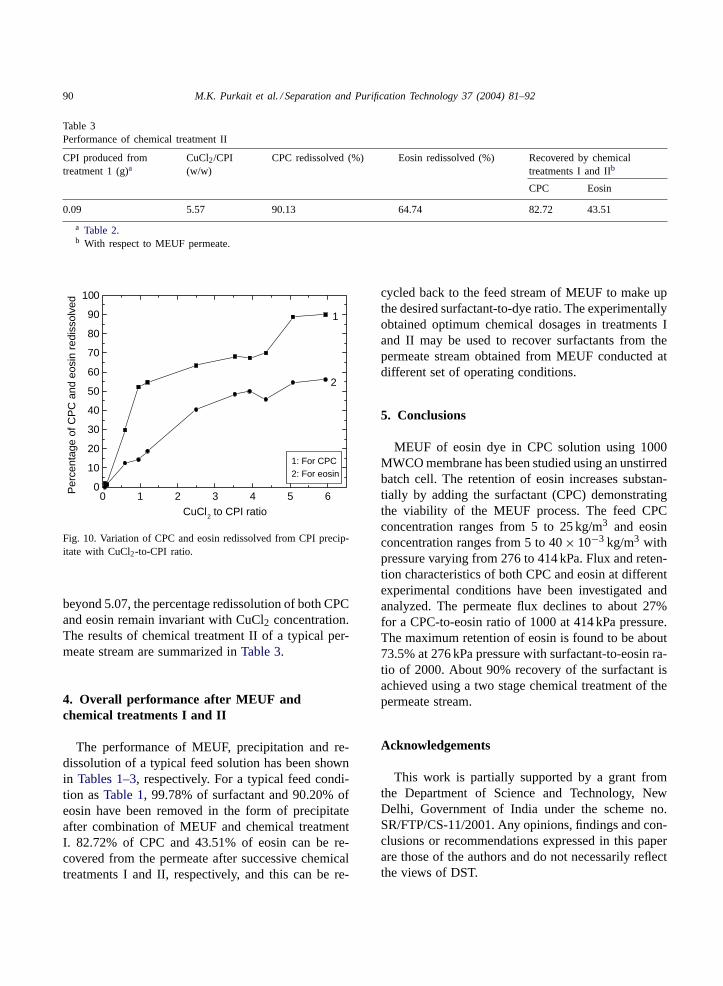
rectly be recycled to the main feed of MEUF. It is nec-essary to get back the surfactant in aqueous medium.So, CPI should be transformed to a water-soluble chlo-ride or bromide salt [18]. In this case, cupric chloride(CuCl2) is added to the precipitate obtained in the firstchemical treatment. The relevant reactions are pre-sented in Appendix B. The effects of concentrationsof CuCl2 on the percentage redissolution of CPI andeosin have been studied as a function of CuCl2-to-CPIratio and the results are shown in Fig. 10. With theincrease of CuCl2-to-CPI ratio, the percentage disso-lution increases for both CPC and eosin and the ratio
90 M.K. Purkait et al. / Separation and Purification Technology 37 (2004) 81–92
Table 3Performance of chemical treatment II
CPI produced fromtreatment 1 (g)a
CuCl2/CPI(w/w)
CPC redissolved (%) Eosin redissolved (%) Recovered by chemicaltreatments I and IIb
CPC Eosin
0.09 5.57 90.13 64.74 82.72 43.51
a Table 2.b With respect to MEUF permeate.
0 1 2 3 4 5 60
10
20
30
40
50
60
70
80
90
100
1: For CPC2: For eosin
2
1
Per
cent
age
of C
PC
and
eos
in r
edis
solv
ed
CuCl2 to CPI ratio
Fig. 10. Variation of CPC and eosin redissolved from CPI precip-itate with CuCl2-to-CPI ratio.
beyond 5.07, the percentage redissolution of both CPCand eosin remain invariant with CuCl2 concentration.The results of chemical treatment II of a typical per-meate stream are summarized in Table 3.
4. Overall performance after MEUF andchemical treatments I and II
The performance of MEUF, precipitation and re-dissolution of a typical feed solution has been shownin Tables 1–3, respectively. For a typical feed condi-tion as Table 1, 99.78% of surfactant and 90.20% ofeosin have been removed in the form of precipitateafter combination of MEUF and chemical treatmentI. 82.72% of CPC and 43.51% of eosin can be re-covered from the permeate after successive chemicaltreatments I and II, respectively, and this can be re-
cycled back to the feed stream of MEUF to make upthe desired surfactant-to-dye ratio. The experimentallyobtained optimum chemical dosages in treatments Iand II may be used to recover surfactants from thepermeate stream obtained from MEUF conducted atdifferent set of operating conditions.
5. Conclusions
MEUF of eosin dye in CPC solution using 1000MWCO membrane has been studied using an unstirredbatch cell. The retention of eosin increases substan-tially by adding the surfactant (CPC) demonstratingthe viability of the MEUF process. The feed CPCconcentration ranges from 5 to 25 kg/m3 and eosinconcentration ranges from 5 to 40 × 10−3 kg/m3 withpressure varying from 276 to 414 kPa. Flux and reten-tion characteristics of both CPC and eosin at differentexperimental conditions have been investigated andanalyzed. The permeate flux declines to about 27%for a CPC-to-eosin ratio of 1000 at 414 kPa pressure.The maximum retention of eosin is found to be about73.5% at 276 kPa pressure with surfactant-to-eosin ra-tio of 2000. About 90% recovery of the surfactant isachieved using a two stage chemical treatment of thepermeate stream.
Acknowledgements
This work is partially supported by a grant fromthe Department of Science and Technology, NewDelhi, Government of India under the scheme no.SR/FTP/CS-11/2001. Any opinions, findings and con-clusions or recommendations expressed in this paperare those of the authors and do not necessarily reflectthe views of DST.
M.K. Purkait et al. / Separation and Purification Technology 37 (2004) 81–92 91
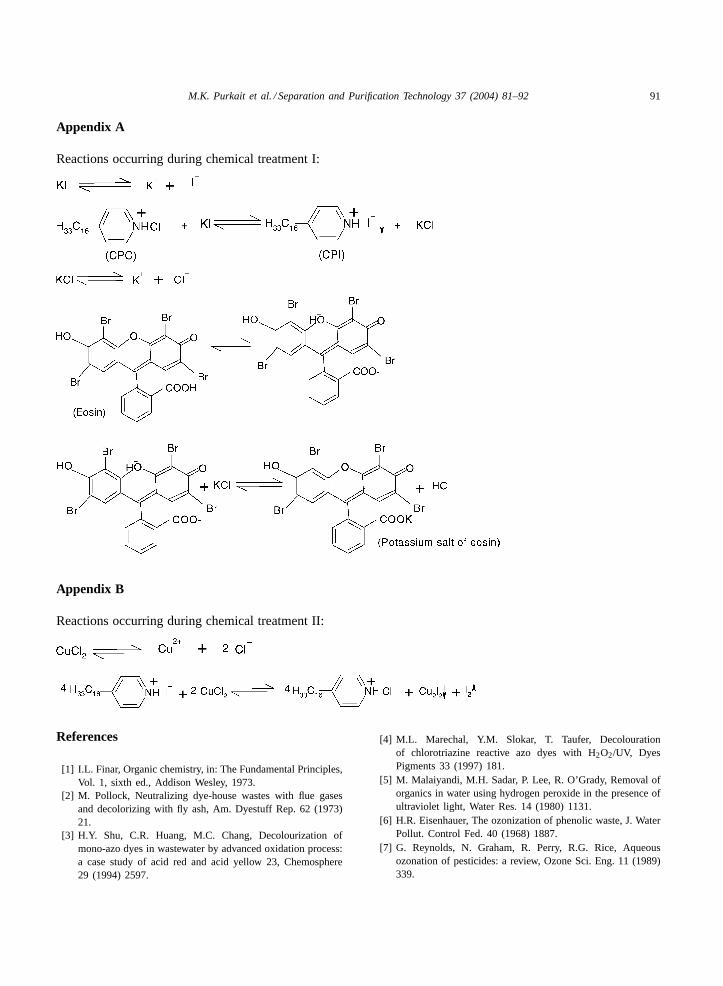
Appendix A
Reactions occurring during chemical treatment I:
Appendix B
Reactions occurring during chemical treatment II:
References
[1] I.L. Finar, Organic chemistry, in: The Fundamental Principles,Vol. 1, sixth ed., Addison Wesley, 1973.
[2] M. Pollock, Neutralizing dye-house wastes with flue gasesand decolorizing with fly ash, Am. Dyestuff Rep. 62 (1973)21.
[3] H.Y. Shu, C.R. Huang, M.C. Chang, Decolourization ofmono-azo dyes in wastewater by advanced oxidation process:a case study of acid red and acid yellow 23, Chemosphere29 (1994) 2597.
[4] M.L. Marechal, Y.M. Slokar, T. Taufer, Decolourationof chlorotriazine reactive azo dyes with H2O2/UV, DyesPigments 33 (1997) 181.
[5] M. Malaiyandi, M.H. Sadar, P. Lee, R. O’Grady, Removal oforganics in water using hydrogen peroxide in the presence ofultraviolet light, Water Res. 14 (1980) 1131.
[6] H.R. Eisenhauer, The ozonization of phenolic waste, J. WaterPollut. Control Fed. 40 (1968) 1887.
[7] G. Reynolds, N. Graham, R. Perry, R.G. Rice, Aqueousozonation of pesticides: a review, Ozone Sci. Eng. 11 (1989)339.
92 M.K. Purkait et al. / Separation and Purification Technology 37 (2004) 81–92
[8] W.H. Glaze, W.J. Kang, D.H. Chapin, The chemistry of watertreatment process involving ozone, hydrogen peroxide andultraviolet radiation, Ozone Sci. Eng. 9 (1987) 335.
[9] G.R. Rice, Ozone for the treatment of hazardous materials,AIChE Symp. Ser. (1981) 79.
[10] L. Davis, C. Randal, Development of color removal potentialin organisms treating pulp and paper wastewaters, J. WaterPollut. Control Fed. 50 (1968) 382.
[11] I. Arvanitoyannis, I. Eleftheriadis, E. Kavlentis, Treatmentof dye containing effluents with different bentonites, Chemo-sphere 16 (1987) 2523.
[12] I. Arvanitoyannis, I. Eleftheriadis, E. Tsatsaroni, Influence ofpH on adsorption of dye containing effluents with differentbentonites, Chemosphere 18 (1989) 1707.
[13] Y. Al-Degs, M.A.M. Khraisheh, S.J. Allen, M.N.A. Ahmad,Sorption behavior of cationic and anionic dyes from aqueoussolution on different types of activated carbons, Sep. Sci.Technol. 36 (1) (2001) 91.
[14] J.H. Bae, D.I. Song, Y.W. Jeon, Adsorption of anionic dye andsurfactant from water onto organomontmorillonite, Sep. Sci.Technol. 35 (3) (2000) 353.
[15] S. Chakraborty, M.K. Purkait, S. Dasgupta, S. De, J.K. Basu,Nanofiltration of textile plant effluent for color removal andreduction in COD, Sep. Purif. Technol. 31 (2003) 141.
[16] M.J. Rosen, Surfactants and Interfacial Phenomena,Wiley/Interscience, New York, 1978.
[17] J.F. Scamehorn, J.H. Harwell (Eds.), Surfactant BasedSeparation Processes, Surfactant Science Series, vol. 33,Marcel Dekker, New York, 1989.
[18] A.K. Vanjara, S.G. Dixit, Recovery of cationic surfactantusing precipitation method, Sep. Technol. 6 (1996) 91.
[19] A.I. Vogel, Text Book Of Practical Organic Chemistry,1970.
[20] M. Syamal, S. De, P.K. Bhattacharya, Phenol solubilizationby cetylpyridinium chloride micelles in micellar-enhancedultrafiltration, J. Membr. Sci. 137 (1995) 99.