Embed Size (px)
Citation preview
RemoteSensing
Seminar
Chris J. JohannsenAugust 24, 2005
AGRY 598G

Expectations of our Students
Students are expected to:
Attend the seminars through thesemester.
Present a 5-minute presentation oftheir research or a remote sensingtopic at the end of the semester.

1) Interact with professionals workingwith remote sensing, GPS, and GIS
2) Hear and see the latest informationabout spatial technologies
3) Provide opportunities to explorefuture career paths
Purposes of our Seminars
Provide a forum for students to:

Today’s Topic - “Good and Not as GoodExamples”
Items to consider for a Seminar Presentation:• Colors that you can use: Depends on the background
• Size of “font”
• Graphics that will support your efforts
• Tables of data
• Customizing your slide presentations
• The medium through which your Seminar is traveling
• How to Keep your Audience’s Interest
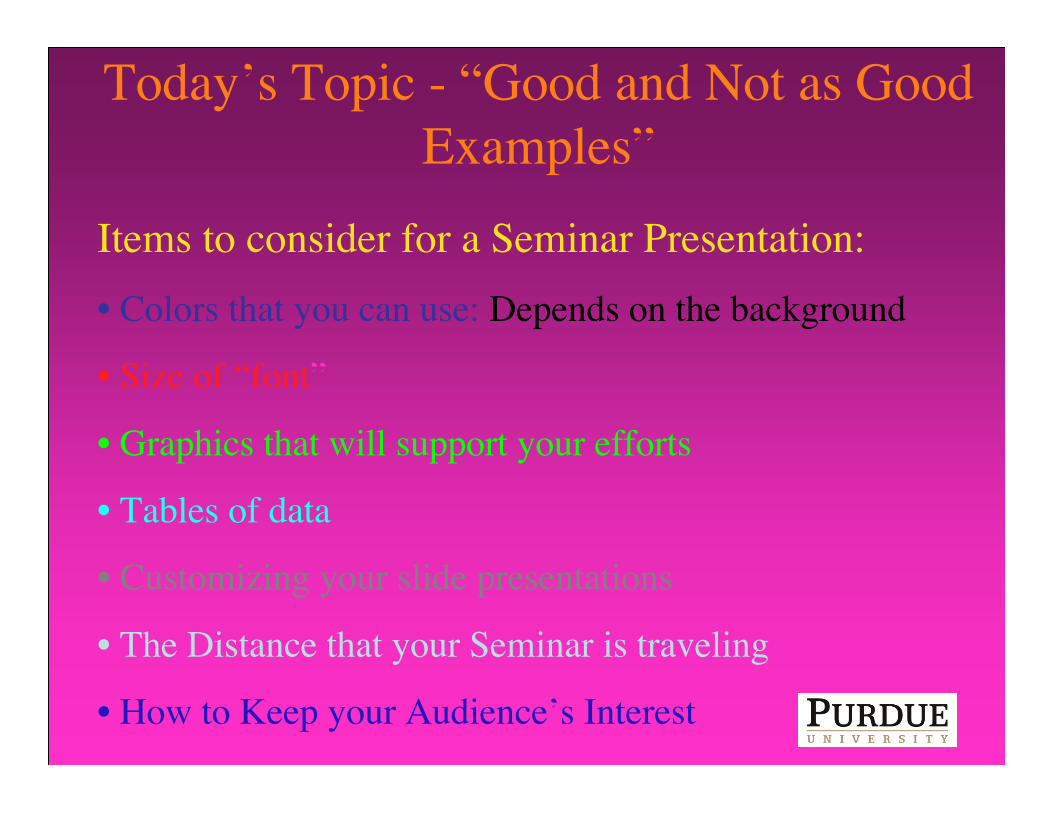
Today’s Topic - “Good and Not as GoodExamples”
Items to consider for a Seminar Presentation:• Colors that you can use: Depends on the background
• Size of “font”
• Graphics that will support your efforts
• Tables of data
• Customizing your slide presentations
• The Distance that your Seminar is traveling
• How to Keep your Audience’s Interest

Size of Font
28 - Depends on presentation - keep verbage to a minimum
32 - Depends on presentation
36 - Depends on presentation
40 - Depends on presentation
44 - Depends on presentation
48 - Depends on presentation
Size16 - Depends on presentation - keep verbage to a minimum as you don’t have much space on a slide

Purdue Terrestrial Observatory(PTO)
Purdue TerrestrialObservatory (PTO)
Sample Applications: Precision Farming Homeland Security Disaster Intervention Forestry & Ecology Urban Planning Epidemiology Oceanography Industrial Development Geology & Mineralogy
Real-Time Remote Sensing Data
Participating DepartmentsAgronomyAg. & Biological EngineeringAgricultureAgricultural EconomicsAtmospheric ScienceChemistryCivil EngineeringComputer ScienceEarth & Atmospheric SciencesElectrical & Computer Eng.Center for the EnvironmentForestry & Natural ResourcesITaPManagementNuclear Engineering
Data Storage

ComputationalResearch Infrastructure
• I-Light– State investment by
Indiana to purchaseoptical fiber infrastructure
– 1-2 Gigabit/sec– Application pending to
enhance national gridconnectivity to 10Gigabits
– Enhanced researchcapabilities including testbed environment anddistributed terascalecomputing
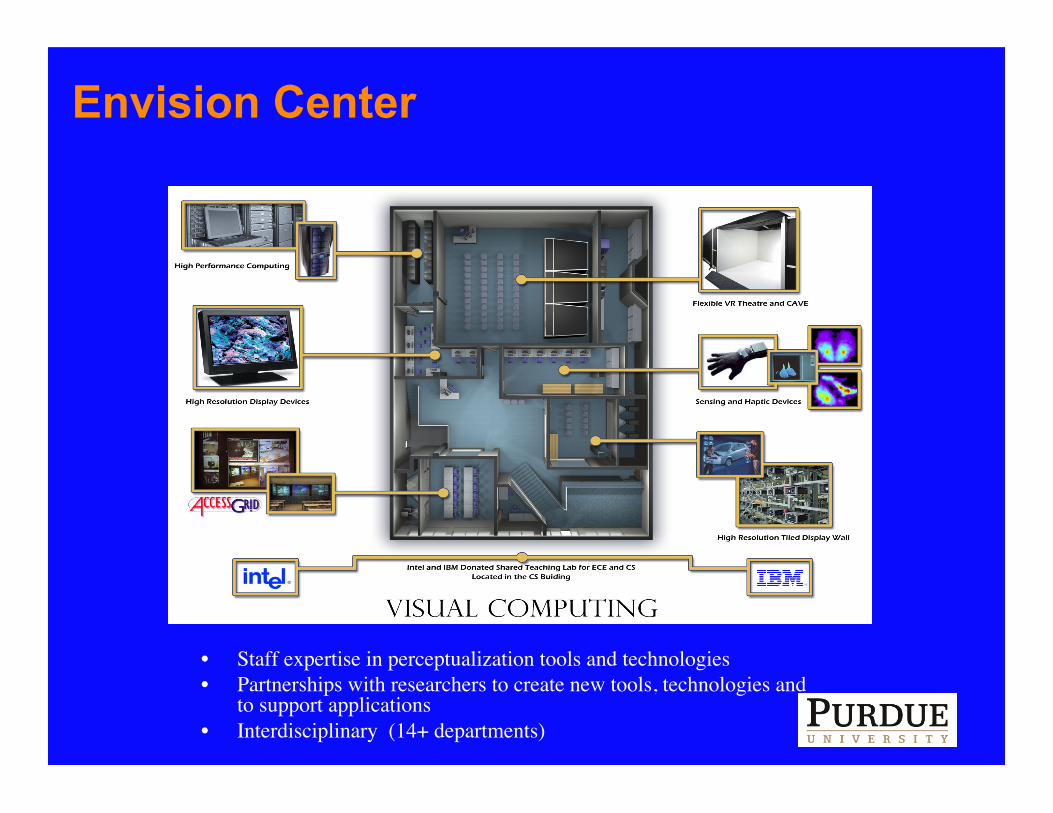
• Staff expertise in perceptualization tools and technologies• Partnerships with researchers to create new tools, technologies and
to support applications• Interdisciplinary (14+ departments)
Envision Center

Table Error! No text of specified style in document.–1. Basic statistics of yield estimation methods for each study site.
Method Mean Median Min. Max. SD Pixels < 0†
______________ Mg ha-1 ______________
DPAC P, N = 44412
O
K
4
.
5
9
4
.
6
3
0
.
0
1
1
3
.
3
7
2
.
1
9
D
E
C
R
4
.
6
8
4
.
6
7
-
1
.
0
0
1
1
.
3
3
2
.
0
3
4
2
S
K
L
M
4
.
6
5
4
.
7
1
-
0
.
8
8
1
3
.
3
5
2
.
2
4
1
3
2
Woodman, N = 23365
O
K
9
.
5
9
9
.
8
9
0
.
0
7
1
2
.
5
6
1
.
4
8
D
E
C
R
9
.
6
1
1
0
.
0
1
0
.
4
3
1
2
.
7
8
1
.
3
1 0
S
K
L
M
9
.
5
9
9
.
9
3
-
0
.
9
6
1
3
.
0
2
1
.
4
6 8
DPAC E, N = 16863
O
K
8
.
3
2
8
.
2
2
0
.
2
0
1
3
.
6
3
2
.
0
6

Yield Estimation Statistics
Method r2 RMSEOrdinary Kriging 0.714*** 1.152
DECRa 0.808*** 0.952
SKLMb 0.823*** 0.943
a: Discretization, Extraction, Classification and Regression
b: Simple Kriging with varying Local Means

Farming - 10 years agoBasic Premise: A field was treated as a unit >Tillage was uniform across the field >Seeding involved one variety >Applied one rate of fertilizer >Applied one rate of pesticide >Yields were estimated based on volume

Farming Today
Basic Premise: Specific variations withinthe field are a potential unit
• Variable tillage by soil type, relief, etc• Adjust seed variety and rates on the go• Adjust fertilizer rate according to soil tests• Apply variable rate of pesticides• Scouting accomplished by walking the fields –
known variations• Remote Sensing images through the season –
scouting, nutrients, drainage, yield, etc.• Yield maps showing variation by location

Farming Tomorrow
Sensors to measure soil and plantcharacteristics to vary inputs
Crop specialty – bred for specific newcharacteristics
Timed release of fertilizer, chemicals, and otherinputs
Variable harvest techniques Improved software for automating management
decisions
Basic Premise: If you can measure it, it’sa potential management unit

Outline of Student Seminars
Background
Hypothesis and Objectives
Research Approach and Analysis
Results (or Preliminary Results)
Conclusions (or Expected Conclusions)
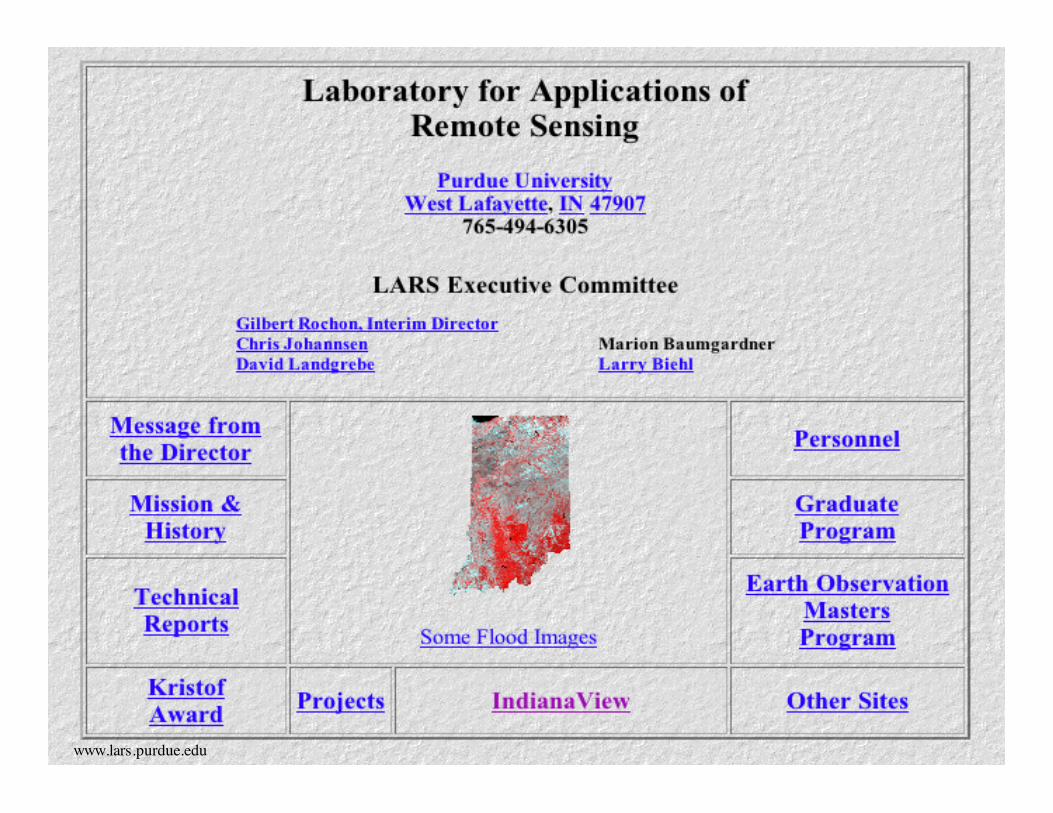
www.lars.purdue.edu
www.lars.purdue.edu/seminar
RemoteSensing
Seminar
Are there anyQuestions orSuggestions?


![Technical Seminar Presentation-2004 MICROWAVE REMOTE SENSING Kishore Kumar ParidaEC200117313 [1] Microwave Remote Sensing (MRS) Presented by Kishore Kumar](https://img.pdfslide.us/doc/110x75/56649eb35503460f94bba821/technical-seminar-presentation-2004-microwave-remote-sensing-kishore-kumar.jpg)


![[REMOTE SENSING] 3-PM Remote Sensing](https://img.pdfslide.us/doc/110x75/61f2bbb282fa78206228d9e2/remote-sensing-3-pm-remote-sensing.jpg)


