Embed Size (px)
Citation preview
Page 1 of 20
GEOINFORMATICS | RESEARCH ARTICLE
Remote sensing of vegetation cover changes in the humid tropical rainforests of Southeastern Nigeria (1984–2014)Friday Uchenna Ochege and Chukwunonyelum Okpala-Okaka
Cogent Geoscience (2017), 3: 1307566
Ochege & Okpala-Okaka, Cogent Geoscience (2017), 3: 1307566http://dx.doi.org/10.1080/23312041.2017.1307566
GEOINFORMATICS | RESEARCH ARTICLE
Remote sensing of vegetation cover changes in the humid tropical rainforests of Southeastern Nigeria (1984–2014)Friday Uchenna Ochege1,2* and Chukwunonyelum Okpala-Okaka2
Abstract: This study demonstrates a 30-year multi-temporal variations in vegeta-tion cover changes as a means of filling the vegetation knowledge gap in the humid tropical forests of southeastern Nigeria. Landsats 4TM, 5TM and 7ETM+ data-sets were accessed and analysed using the Maximum Likelihood Classification algo-rithm to discriminate and geovisualize the spatiotemporal variations in the general vegetation and other land cover types, from 1984 to 2014. This was supported with detailed field surveys in dry and rainy seasons of 2011 and 2014 to ascertain the status of wide-ranging vegetation cover stands. A 44% vegetation decline was recorded given the reduction in dense vegetation spatial extent from 330.63 km2 in 1984 to 170.87 km2 in 2014. Sparse vegetation equally increased in spatial extent by 25% given the variations registered from 6.86 km2 in 1984 to 97.16 km2 in 2014. The reduction in vegetation cover was found to have been replaced by increase in other land cover types—residential (18.97 km2) and industrial areas (39.87 km2). Suggesting that, heterogeneity in the spatial distribution of land resources, in addition to weak concerns towards preserving the accruing benefits of vegetation resources attracted anthropogenic phenomenon (e.g. urbanization) to vegetated
*Corresponding author: Friday Uchenna Ochege, Laboratory for Cartography and GIS, Department of Geography & Environmental Management, University of Port Harcourt, Choba, Rivers State, Nigeria; Faculty of Environmental Studies, Department of Surveyingand Geoinformatics, University of Nigeria, Enugu, NigeriaE-mail: [email protected]
Reviewing editor:Louis-Noel Moresi, University of Melbourne, Australia
Additional information is available at the end of the article
ABOUT THE AUTHORSFriday Uchenna Ochege is a PhD candidate with special interest in the application of Cartographic, GIS and Remote Sensing techniques to environment related issues. He has been involved in internationally and nationally funded research projects. We are currently working on the application of geospatial techniques to modeling climate change impacts on agriculture and watershed resilience and resilient landscapes in the Humid Tropics of Southeastern Nigeria. We aim to develop frameworks for non-technical policy makers that will guide in sustainable land use.
Chukwunonyelum Okpala-Okaka is a professor in the Department of Surveying and Geoinformatics, Faculty of Environmental studies at the University of Nigeria. His area of research interest is Cartography, Remote Sensing and GIS modelling. He currently teaches both undergraduate and postgraduate courses in Cartography and GIS and its environmental applications, within Nigeria. He has over 29 years of teaching experience with several scientific publications to his credit.
PUBLIC INTEREST STATEMENTThis study provides baseline information on the spatial variations and temporal patterns of vegetation cover and other land-use changes in the humid tropical rainforest of Nigeria using satellite data-sets. Key factors responsible for the changes have been identified and documented. The validated results helped to reveal interclass confusion especially as earlier report assert that the region lacks adequate monitoring framework and information on vegetation cover changes. With this research, appropriate place-specific reinvestigations and or decisions can be made, such as rapid identification of alternatives where necessary, and to incorporate same in the formulation of sound policies required in the sustainable governance and management of natural resources in the humid tropical rainforest.
Received: 14 March 2016Accepted: 13 March 2017First Published: 22 March 2017
Page 2 of 20
© 2017 The Author(s). This open access article is distributed under a Creative Commons Attribution (CC-BY) 4.0 license.
Page 3 of 20
Ochege & Okpala-Okaka, Cogent Geoscience (2017), 3: 1307566http://dx.doi.org/10.1080/23312041.2017.1307566
areas. As such, strengthening institutional monitoring and urban planning frame-works would help to improve sustainable governance of the tropical rainforests.
Subjects: Vegetation; Environmental Studies & Management; GIS, Remote Sensing & Cartography
Keywords: remote sensing; vegetation cover changes; tropical rainforest; Southeastern Nigeria
1. IntroductionVegetation is the general plant life or the total plant cover forming parts of the biological system and it is the primary producer of any ecosystem (Ochege, 2014b). Local and regional wide-ranging natu-ral vegetations are important component on earth and they govern all forms of life (Millennium Ecosystem Assessment, 2005). They provide food, oxygen, fertility and finally enhance survival of all living beings (Matlack, 1994; Mckey, Waterman, Gartlan, & Struhsaker, 1978; Newbold et al., 2014). For the earth’s environment, natural vegetation constitutes the biologically richest ecosystems and play vital roles in regional hydrology, carbon storage and the global climate dynamics (Du et al., 2015; Forkel et al., 2013; Igbawua, Zhang, Chang, & Yao, 2016).
The benefits accruing to humankind from the natural functioning of a healthy and productive vegetation system cannot be over emphasized. Because, the natural vegetation provides not only the basic needs of life (i.e. food, clothing and shelter), but enables purification of water bodies (Friberg et al., 2011), manages diseases (Fisher & Turner, 2008), regulates climate and the function-ing of biosphere (Millennium Ecosystem Assessment, 2005) and provides mankind with spiritual ful-filment that contributes to improving quality of life (Food & Agriculture Organisation, 2013). As such, vegetation remains the lifeblood of human societies around the world (United Nations Environment Programme & the International Institute for Sustainable Development, 2004).
Nevertheless, human being has long distinguished himself from other species by shaping ecosys-tem forms and processes using fire, tools and technologies that are beyond the capacity of other organisms including natural vegetation stands (Smith, 2007). As a result, man is inextricably and unavoidably attached to the environment, which often time gives him the nerve to impact nega-tively on forests and natural vegetations resulting in other land uses.
Based on the considerations of the Intergovernmental Panel on Climate Change (IPCC), land use and land cover are not technically synonymous. Land cover is the observed physical and biological cover of the Earth’s land, such as vegetation or man-made features, whilst the total arrangements, activities and inputs undertaken in a certain land cover type (e.g. a set of human actions) for both social and economic purposes (e.g. grazing, timber extraction, conservation) are referred to as land use (Watson et al., 2000). Since vegetation is continuously changing—alteration in the surface com-ponents of the vegetation cover, the rate of change can either be dramatic and or abrupt—as exem-plified by fire, subtle and or gradual (Lund, 1983; Milne, 1988). This is a common global scenario, especially, with regard to forest cover and biomass accumulation or mass deforestation (Hansen et al., 2013).
Africa has been observed to be experiencing the fastest rate of vegetation change and most of its segments are already evidently been impacted and plagued with diverse ecological problems (Erika et al., 2015; Ofori, Owusu, & Attuquayefio, 2014; Yeshaneh, Wagner, Exner-Kittridge, Legesse, & Blöschl, 2013). Especially, as land use remains a significant driver of habitat degradation and re-moval and associated losses in biodiversity and vegetation resources (Lucas et al., 2015). According to Odjugo and Ikhuoria (2003), these problems, though anthropogenic in context, do have a direct link with the ongoing global climatic and environmental change. Nevertheless, natural vegetation equally suffers from these consequences, as they are profoundly been altered by human activities, and so, few natural stands remain (FAO, 2012).
Page 4 of 20
Ochege & Okpala-Okaka, Cogent Geoscience (2017), 3: 1307566http://dx.doi.org/10.1080/23312041.2017.1307566
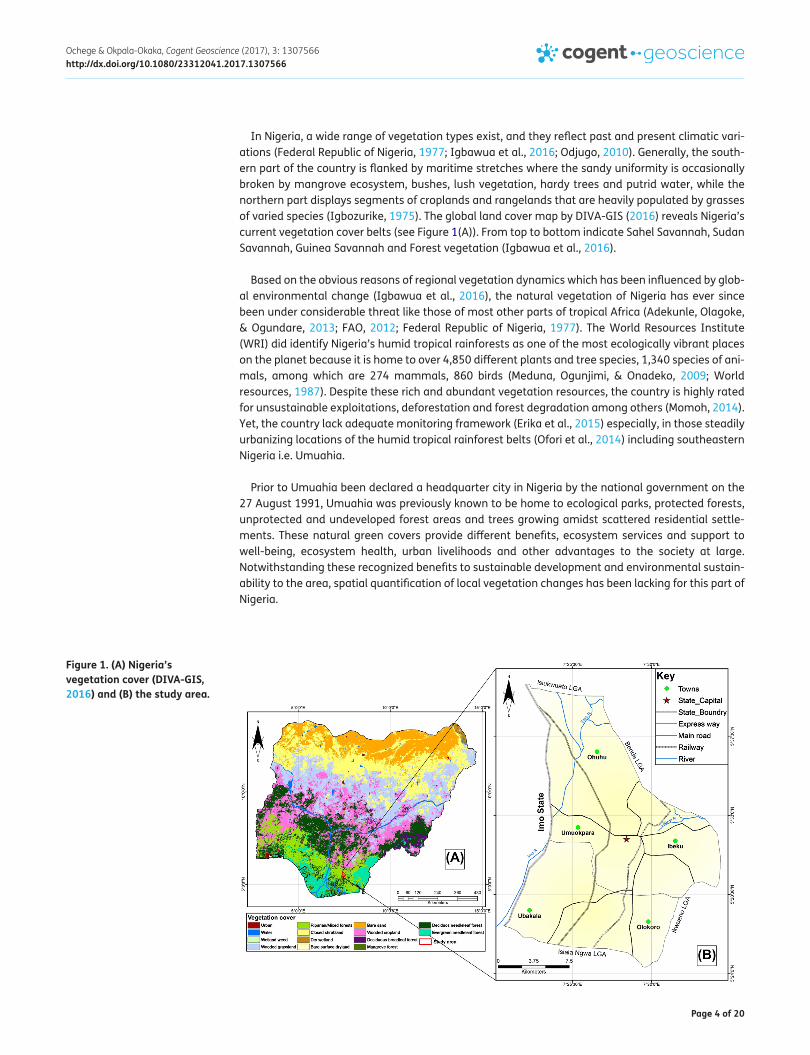
In Nigeria, a wide range of vegetation types exist, and they reflect past and present climatic vari-ations (Federal Republic of Nigeria, 1977; Igbawua et al., 2016; Odjugo, 2010). Generally, the south-ern part of the country is flanked by maritime stretches where the sandy uniformity is occasionally broken by mangrove ecosystem, bushes, lush vegetation, hardy trees and putrid water, while the northern part displays segments of croplands and rangelands that are heavily populated by grasses of varied species (Igbozurike, 1975). The global land cover map by DIVA-GIS (2016) reveals Nigeria’s current vegetation cover belts (see Figure 1(A)). From top to bottom indicate Sahel Savannah, Sudan Savannah, Guinea Savannah and Forest vegetation (Igbawua et al., 2016).
Based on the obvious reasons of regional vegetation dynamics which has been influenced by glob-al environmental change (Igbawua et al., 2016), the natural vegetation of Nigeria has ever since been under considerable threat like those of most other parts of tropical Africa (Adekunle, Olagoke, & Ogundare, 2013; FAO, 2012; Federal Republic of Nigeria, 1977). The World Resources Institute (WRI) did identify Nigeria’s humid tropical rainforests as one of the most ecologically vibrant places on the planet because it is home to over 4,850 different plants and tree species, 1,340 species of ani-mals, among which are 274 mammals, 860 birds (Meduna, Ogunjimi, & Onadeko, 2009; World resources, 1987). Despite these rich and abundant vegetation resources, the country is highly rated for unsustainable exploitations, deforestation and forest degradation among others (Momoh, 2014). Yet, the country lack adequate monitoring framework (Erika et al., 2015) especially, in those steadily urbanizing locations of the humid tropical rainforest belts (Ofori et al., 2014) including southeastern Nigeria i.e. Umuahia.
Prior to Umuahia been declared a headquarter city in Nigeria by the national government on the 27 August 1991, Umuahia was previously known to be home to ecological parks, protected forests, unprotected and undeveloped forest areas and trees growing amidst scattered residential settle-ments. These natural green covers provide different benefits, ecosystem services and support to well-being, ecosystem health, urban livelihoods and other advantages to the society at large. Notwithstanding these recognized benefits to sustainable development and environmental sustain-ability to the area, spatial quantification of local vegetation changes has been lacking for this part of Nigeria.
Figure 1. (A) Nigeria’s vegetation cover (DIVA-GIS, 2016) and (B) the study area.
Page 5 of 20
Ochege & Okpala-Okaka, Cogent Geoscience (2017), 3: 1307566http://dx.doi.org/10.1080/23312041.2017.1307566
Remote sensing technology has proven essentially relevant in establishing land use and land cov-er monitoring frameworks at different scales (Hansen et al., 2013; Loveland & Dwyer, 2012). It is the science by which information about an object is obtained from electromagnetic radiation reflected from the surface of that object (Jensen, 2014; Lillesand, Kiefer, & Chipman, 2015). Its mechanisms have revolutionized traditional mapping methods (Ariti, van Vliet, & Verburg, 2015; Newbold et al., 2014; Okpala-Okaka & Igbokwe, 2010; Scull et al., 2016; White & Oates, 1999), by advancing and characterizing the spatiotemporal distribution of environmental phenomena using air-borne sensor platforms and image processing and interpretation techniques or packages (Chen, Lu, Luo, & Huang, 2015; Dubula, Tesfamichael, & Rampedi, 2016; Forkel et al., 2013; Hansen et al., 2013; Loveland & Dwyer, 2012; Luo, Zhou, Chen, & Li, 2008). The advent of remote sensing paved way for improved methodological mapping of vegetation cover changes since the establishment of Landsat mission in 1972 (Coppin & Bauer, 1996; Coppin, Jonckheere, Nackaerts, & Muys, 2004; Loveland & Dwyer, 2012).
Several researchers have comprehensively used Landsat imageries, with its extensive data ar-chive at no cost and suitable spectral and spatial resolutions to detect and quantify vegetation cover changes (Chen et al., 2015; Luo & Dai, 2012; Luo et al., 2008; Omo-Irabor et al., 2011; Zhu, Liu, & Chen, 2012). But literature search, with focus on the Umuahia segment of the tropical rainforest belt of Nigeria shows a dearth of information about the dynamics of vegetation cover changes in the area, probably due to limited accessible monitoring data and a lack of appropriate research methods.
This paper, therefore, initiated a remote sensing-based vegetation baseline assessment that is nonexistent in the study area (Erika et al., 2015), as a strategy for informing the non-technical and expert policy makers involved in the sustainable governance and development of the region.
This is necessary to understand the dynamic nature of emerging regional and local vegetation and land cover types that may have been impacted over time. The information will be useful in stream-lining policy efforts towards sustainable urban growth in the long-term, land cover recovery, agricul-tural resilience and carbon storage/sequestration in the face of increasing changing climate. The following specific objectives have been addressed:
(1) to estimate the spatial extent of the vegetation cover changes using remotely sensed satellite data;
(2) to quantify the temporal changes based on spatial extent of the vegetation cover, before and after 1991 (the year the study area was officially created) to a near present date—2014; and,
(3) to identify and document responsible factors for the changes in terms of areal extent of the study area.
The results generated in this study would, thus, show the spatial variations and pattern of vegeta-tion cover distribution of different vegetation classes. While their validation helped to reveal inter-class confusion than could be resolved with the use of other biased information (Foody, 2002), especially as it had been established that the region lacked adequate vegetation monitoring data (see, for example, Erika et al., 2015). In this way, appropriate place-specific reinvestigations and or decisions can be achieved, such as rapid identification of alternatives where necessary, and to incor-porate same in the formulation of sound policies required in the governance and natural resources management framework of the region (see, for example, Larcom, van Gevelt, & Zabala, 2016; Obydenkova, Nazarov, & Salahodjaev, 2016).
Page 6 of 20
Ochege & Okpala-Okaka, Cogent Geoscience (2017), 3: 1307566http://dx.doi.org/10.1080/23312041.2017.1307566
2. Materials and method
2.1. Case study areaGeographically referred to as Umuahia, the study area (latitude 5°26′06.00″N to 05°36′04.00″N and longitude 07°21′50.00″E to 7°34′03.00″E) covered the administrative boundary of the present day Umuahia North and Umuahia South local government areas in Abia State. It lies entirely in the southeastern segment of the humid tropical rainforest in Nigeria (Figure 1(B)). It covers an area of about 363.13 km2 amidst a constellation of scattered villages and towns within a 15 km radius, while the total area covered by the metropolis is about 71 km2 (Ejenma, 2013).
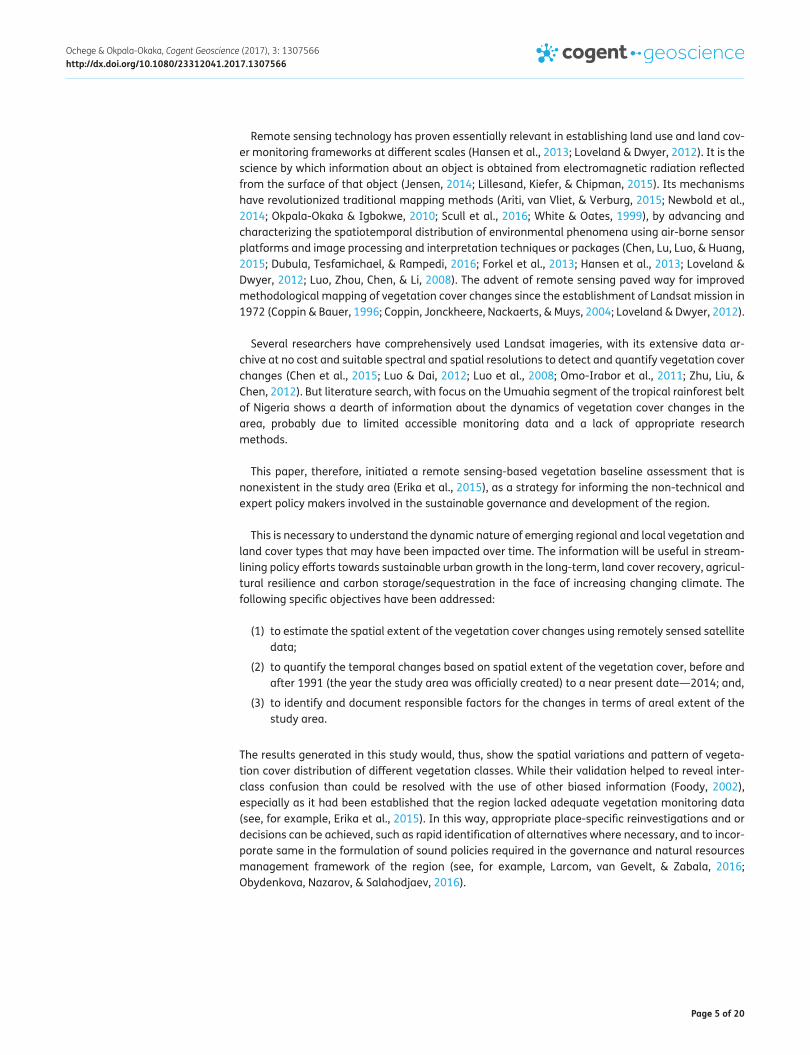
The climate is humid tropical rainforest—Koppen Af (Kottek, Grieser, Beck, Rudolf, & Rubel, 2006). Daily average insolation is generally low—4.8 h, nevertheless the area experiences mean annual maximum temperature of 31°C with little daily variations (Iloeje, 2007). Meteorologically, Umuahia experiences an annual mean rainfall of 2,278 mm, with eight months of precipitation, which extends from early March to late October (Figure 2). Meaning, that, the study area witnesses two major sea-sons—dry season and rainy season. The dry season is dominated by a period of short spell of dry/cool season referred to as harmattan. Usually, the heaviest of monthly total of rains → 363 mm (Figure 2), is experienced more in September, while the month with the lowest rainfall fluctuates between January and December, except for recent climatic anomalies with random variance of pre-cipitation in other locations (e.g. Nsukka & Ogbudu) (Campling, Gobin, & Feyen, 2001).
The soils of Umuahia have been greatly influenced by different ancient geologic formations, cli-mate, vegetation, and general topographic configuration of the area (Onu, Opara, & Ehirim, 2012). The major rivers that drain the catchment area of Umuahia are the Imo river on the west axis, Kwa-Ibo river draining southwardly and Enyong creek on the east axis. River Eme with it various tributar-ies in Ohuhu flows into the Imo river while the Ofenyi river tributaries transverse the Ibeku landscape to deposit into the Enyong creek. These rivers and streams are ephemeral and dry up after the ces-sation of rainfall. The study area currently serves as one of the nation’s commercial hubs for eco-nomic development, with high potentials for growth and development.
2.2. Field observationsValidation of remotely sensed data through field surveys, documented information and discussions with the local people has proven useful in several land use/land cover (LU/LC) studies (see, for exam-ple, Ariti et al., 2015; Scull et al., 2016; Yeshaneh et al., 2013). In this study, vegetation of the study area was carefully observed by extensive field surveys conducted during rainy season, and the early dry season in 2011 and 2014 respectively. Ground truth of relevant land cover types in the study area were collected alongside plant species and other landscape features. A Garmin 62s Global Positioning System (GPS) with 3 m accuracy was used to identify infrastructural facilities that were relocated to
Figure 2. Monthly distribution of rainfall and temperature over Umuahia.
Page 7 of 20
Ochege & Okpala-Okaka, Cogent Geoscience (2017), 3: 1307566http://dx.doi.org/10.1080/23312041.2017.1307566
previously vegetated areas. Likewise, certain geographical features, ranging from landscape con-figurations to vegetation types, were equally identified. This was necessary, to complement and af-firm the relationship and variations that may be there, would have occurred and the rationale behind the changes.
As such, the study area lies in the lowland rainforest vegetation belt typified by almost continuous cover of riparian forest along stream valleys. Tilling, in most cases, for agriculture and road construc-tion, has resulted in an ecological situation where the normal development of vegetation is mark-edly retarded (Onu et al., 2012). Although, most of these locations have been drastically affected by human activity so much, large sections of the upper rain forest zone may be called an “oil palm bush”. However, the observed vegetation of the area is characterized by an abundance of seed-bearing plants species, such as Brachustegia eurycoma, Carya spp., Steroulia, Canarium, Cassia si-ame, Triplochitan scleroxylong, Meliaceae, Mitragyna ciliate, Khaya spp., Entandrophrayma spp., Lovia trichiloides, Nauclea diderrichii, Gmelina arborea, Neliaceae, Acacia nilotica and Gum arabi. Others include Cauarea and Tarminalia. Many times, they occur in about 100 species per hectare. It is this great abundance of species that makes the area rich in terms of biomass productivity of all terres-trial ecosystems, therefore, requiring a periodic assessment.
2.3. Satellite remote sensing dataRemote sensing offers priceless source of geospatial information for ecological and vegetation re-source management (Hagenlocher, Lang, & Tiede, 2012; Hansen et al., 2013; Lillesand et al., 2015; Luo & Dai, 2012). With reference to complex terrain, data unavailability, area coverage, data ob-tained by remote sensing can be timely, cost-effective, and objectively presented and demonstrated for either specific or post assessment—spatiotemporal investigations (Hagenlocher et al., 2012; Omo-Irabor et al., 2011). In this study, vegetation variation in Umuahia was mapped and visualized from Landsat data covering the total extent occupied by the study area.
Given the different software algorithm-based platforms available for ecological studies (Coppin et al., 2004), ERDAS Imagine 2014 and ArcGIS 10.1 were used for image pre-processing so as to maintain data spatial reference consistency to the georectified format—the Universal Transverse Mercator (UTM) zone 32 North and the World Geodetic System 1984 datum, at the various stages. As such, classification challenges (Huang, Lu, Zhang, & Plaza, 2014; Lillesand et al., 2015) were minimized by selecting suitable dates—1984, 1991 and 2014. This was necessary for maintaining seasonal uni-formity as an a priori for increased ground vegetation and cloud cover during the wet season (Churches, Wampler, Sun, & Smith, 2014; Schwartz, 2003). More importantly, the 1991 data equally served as a second baseline date for the reason of the study area’s official pronouncement as head-quarter to a major state in southeastern Nigeria. A scan line corrector (SLC) error experienced by the Landsat 7/ETM+ was corrected with a gap fill function (Zhu et al., 2012) in ERDAS Imagine 2014.
Datasets of 1984, 1991 and 2014 (path 188, row 56 with a spatial resolution of 30 × 30 m) were obtained from the United States Geological Survey (USGS) archives at www.earthexplorer.usgs.gov. After image acquisition, bands 5 (mid-IR): 1.55–1.75 μm, 4 (NIR): 0.76–0.90 μm and 3 (red): 0.63–0.69 μm in each of the image scene were stacked together to form a single multispectral image data-set using the “layer stack” function in ERDAS Imagine.
The United Nations Fund for Population Activities (UNPFA) had recognized that population growth and its resultant human influence constitute serious pressures on global natural resources espe-cially on local and regional forests ecosystems and natural vegetation (United Nations Population Fund, 1991). Using the annual population growth rate of 2.83%, (Abia State of Nigeria, 2005), the population of the area was projected to present to determine the influence of population growth on vegetation resources.
So, the resulting multispectral images based on the layer-stacked data-sets were used as the baseline data—before impact imagery (1984–1991—marked year of population influx in the study
Page 8 of 20
Ochege & Okpala-Okaka, Cogent Geoscience (2017), 3: 1307566http://dx.doi.org/10.1080/23312041.2017.1307566
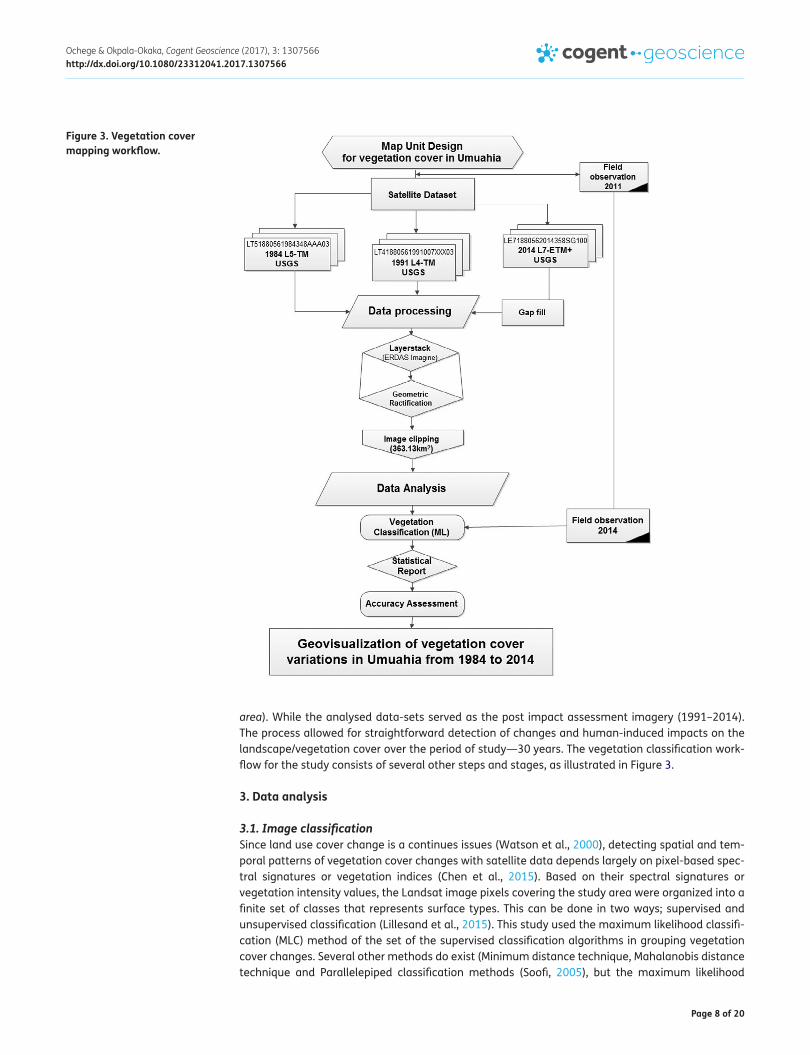
area). While the analysed data-sets served as the post impact assessment imagery (1991–2014). The process allowed for straightforward detection of changes and human-induced impacts on the landscape/vegetation cover over the period of study—30 years. The vegetation classification work-flow for the study consists of several other steps and stages, as illustrated in Figure 3.
3. Data analysis
3.1. Image classificationSince land use cover change is a continues issues (Watson et al., 2000), detecting spatial and tem-poral patterns of vegetation cover changes with satellite data depends largely on pixel-based spec-tral signatures or vegetation indices (Chen et al., 2015). Based on their spectral signatures or vegetation intensity values, the Landsat image pixels covering the study area were organized into a finite set of classes that represents surface types. This can be done in two ways; supervised and unsupervised classification (Lillesand et al., 2015). This study used the maximum likelihood classifi-cation (MLC) method of the set of the supervised classification algorithms in grouping vegetation cover changes. Several other methods do exist (Minimum distance technique, Mahalanobis distance technique and Parallelepiped classification methods (Soofi, 2005), but the maximum likelihood
Figure 3. Vegetation cover mapping workflow.
Page 9 of 20
Ochege & Okpala-Okaka, Cogent Geoscience (2017), 3: 1307566http://dx.doi.org/10.1080/23312041.2017.1307566
method is preferred because it required field observation to aid the classification procedure which tends towards accurate data analysis. The analysis was performed with ERDAS Imagine.
Using the (MLC) on ERDAS Imagine (Congalton & Green, 1999), the enhanced false colour compos-ite bands 5, 4 and 3 of the different years depicting the vegetation image pixels were trained and categorized into appropriate classes. A total of five classes were discriminated (i.e. densely vegetat-ed and sparsely vegetated areas, water bodies, congested residential and built-up industrial areas). The same five classes have been adopted in this work. This classification pattern is in accordance with the 2010 updated version of the global ecological zones for forest reporting by FAO (2012).
The supervised classification maps, showing the spatial extent and variations in forest cover across the study area, are presented in Figure 5. For effective visual interpretation, suitable colour patterns have been used to identify and show the various classes. A class name is assigned to a colour. Thick green represents dense vegetation, light green is for sparse vegetation (Ochege, 2014a), ox-blood is used to show congested sections in the study area, light brown represents built-up areas while blue is used to show the presence of any kind of water body in the area. This pattern is acceptable according to the vegetation classification standard as modified by Anderson, Hardy, Roach, and Witmer (1976).
3.2. Accuracy assessmentIt is usually very important to ensure the correctness of the classification analyses because it seeks to measure the quality of results shown on the classification maps (Banko, 1998; Congalton & Green, 1999). The accuracy assessment can either be quantitative or qualitative. In this study, we evaluated the accuracy process of vegetation classification by visual inspection of the classified image in ERDAS Imagine using Kappa statistics function on a scale range of −0.1 to 1 (Congalton, 1991). Kappa statistics is calculated as in Equation (1): …
where N = is the total number of samples in the matrix, r = corresponds to the number of rows in the matrix, xii = is the number in row i and column i, x+i = is the total for row i, and xi+ = is the total for column i.
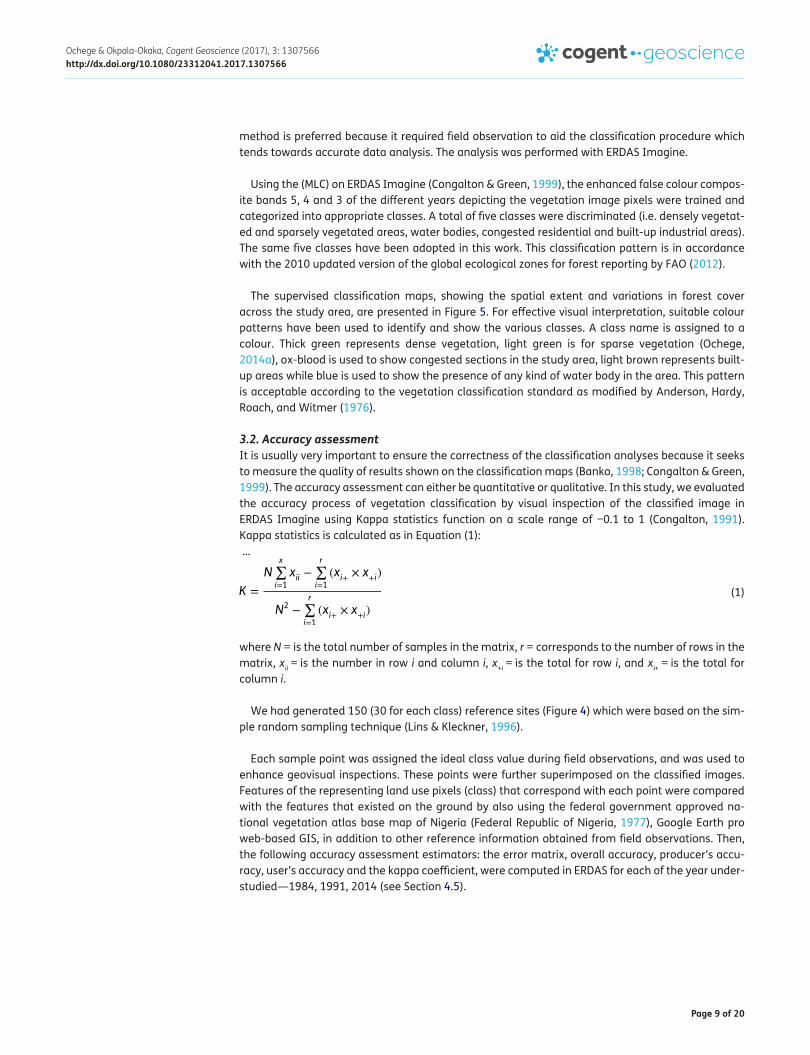
We had generated 150 (30 for each class) reference sites (Figure 4) which were based on the sim-ple random sampling technique (Lins & Kleckner, 1996).
Each sample point was assigned the ideal class value during field observations, and was used to enhance geovisual inspections. These points were further superimposed on the classified images. Features of the representing land use pixels (class) that correspond with each point were compared with the features that existed on the ground by also using the federal government approved na-tional vegetation atlas base map of Nigeria (Federal Republic of Nigeria, 1977), Google Earth pro web-based GIS, in addition to other reference information obtained from field observations. Then, the following accuracy assessment estimators: the error matrix, overall accuracy, producer’s accu-racy, user’s accuracy and the kappa coefficient, were computed in ERDAS for each of the year under-studied—1984, 1991, 2014 (see Section 4.5).
(1)K =
N
x∑
i=1
xii−
r∑
i=1
(xi+× x
+i)
N2−
r∑
i=1
(xi+× x
+i)
Page 10 of 20
Ochege & Okpala-Okaka, Cogent Geoscience (2017), 3: 1307566http://dx.doi.org/10.1080/23312041.2017.1307566
4. Results and discussion
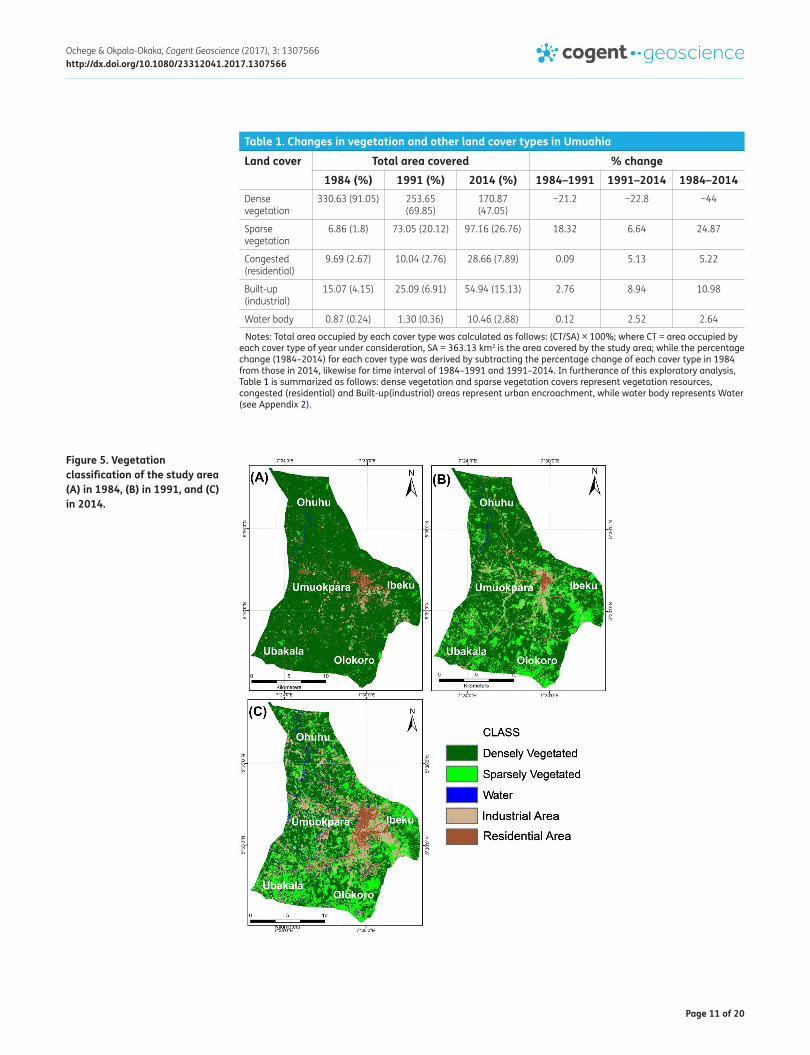
4.1. Spatio-temporal dynamics of vegetation cover changesResults from this study include a vegetation cover statistics and land-cover classification maps of the years understudied—1984, 1991 and 2014. From 1984 to 1991, dense vegetation (healthy veg-etation) had reduced in percentage by 21.2%. Between 1991 and 2014, it further reduced by 22.8%. While sparse vegetation (disturbed or unhealthy vegetation cover) increased by 18.32% (1984–1991) and 6.64 (1991–2014). Likewise, residential and built up areas increased by 0.09% and 2.76% in 1991, and 5.13 and 8.94% in 2014, respectively (Table 1).
4.2. Vegetation and other land cover stands as at 1984The 1984 classification map clearly shows that dense vegetation covered most of the fragments in the study area followed by patches of other cover types—sparse vegetation, water bodies, congested and built-up areas (Figure 5(A)). As such, vegetation resources in the study area may not be adjudged to be entirely untouched or referred to as pristine because of the scattered pattern of sparse vegeta-tion which indicates disturbances and stress on vegetation canopies and phenology (Ochege, 2014a). In this regard, there are chances that most vegetation fragments in the humid tropical rainforests of southeastern Nigeria have experienced one form of human or natural interruptions.
Often times, fragments of tropical forests are considered primary or virgin, whereas, in the actual sense, they have passed through a number of stages to become secondary forests (Aubreville, 1938;
Figure 4. Simple random points generated for vegetation classification validation.
Page 11 of 20
Ochege & Okpala-Okaka, Cogent Geoscience (2017), 3: 1307566http://dx.doi.org/10.1080/23312041.2017.1307566
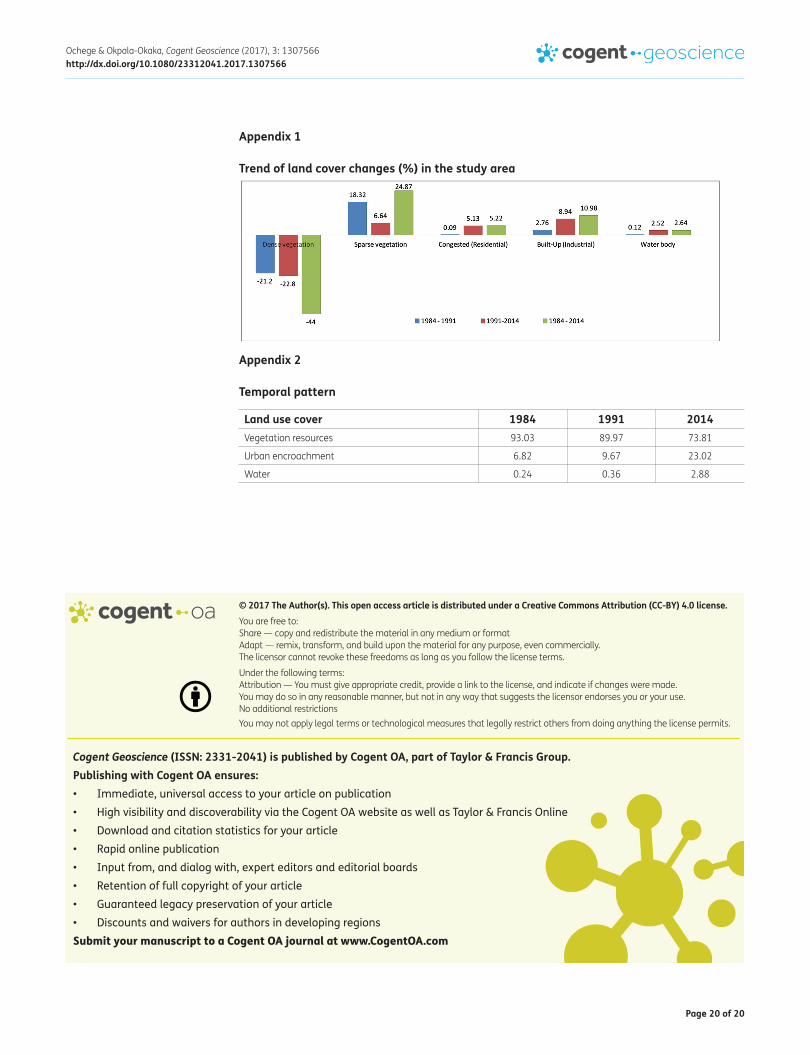
Table 1. Changes in vegetation and other land cover types in Umuahia
Notes: Total area occupied by each cover type was calculated as follows: (CT/SA) × 100%; where CT = area occupied by each cover type of year under consideration, SA = 363.13 km2 is the area covered by the study area; while the percentage change (1984–2014) for each cover type was derived by subtracting the percentage change of each cover type in 1984 from those in 2014, likewise for time interval of 1984–1991 and 1991–2014. In furtherance of this exploratory analysis, Table 1 is summarized as follows: dense vegetation and sparse vegetation covers represent vegetation resources, congested (residential) and Built-up(industrial) areas represent urban encroachment, while water body represents Water (see Appendix 2).
Land cover Total area covered % change1984 (%) 1991 (%) 2014 (%) 1984–1991 1991–2014 1984–2014
Dense vegetation
330.63 (91.05) 253.65 (69.85)
170.87 (47.05)
−21.2 −22.8 −44
Sparse vegetation
6.86 (1.8) 73.05 (20.12) 97.16 (26.76) 18.32 6.64 24.87
Congested (residential)
9.69 (2.67) 10.04 (2.76) 28.66 (7.89) 0.09 5.13 5.22
Built-up (industrial)
15.07 (4.15) 25.09 (6.91) 54.94 (15.13) 2.76 8.94 10.98
Water body 0.87 (0.24) 1.30 (0.36) 10.46 (2.88) 0.12 2.52 2.64
Figure 5. Vegetation classification of the study area (A) in 1984, (B) in 1991, and (C) in 2014.
Page 12 of 20
Ochege & Okpala-Okaka, Cogent Geoscience (2017), 3: 1307566http://dx.doi.org/10.1080/23312041.2017.1307566
Budowski, 1970; Bush & Colinvaux, 1994). For instance, the Okomu Forest Reserve in southwest Nigeria was considered to be a primary forest by Richards (1939), but later studies by Jones (1956) revealed extensive charcoal and pottery deposits and a tree population structure reflecting “second growth” vegetation. Recent studies now provide evidence that the forests of Okomu can be traced back to a period soon after 700 years ago, following a period of intensive human use (White & Oates, 1999).
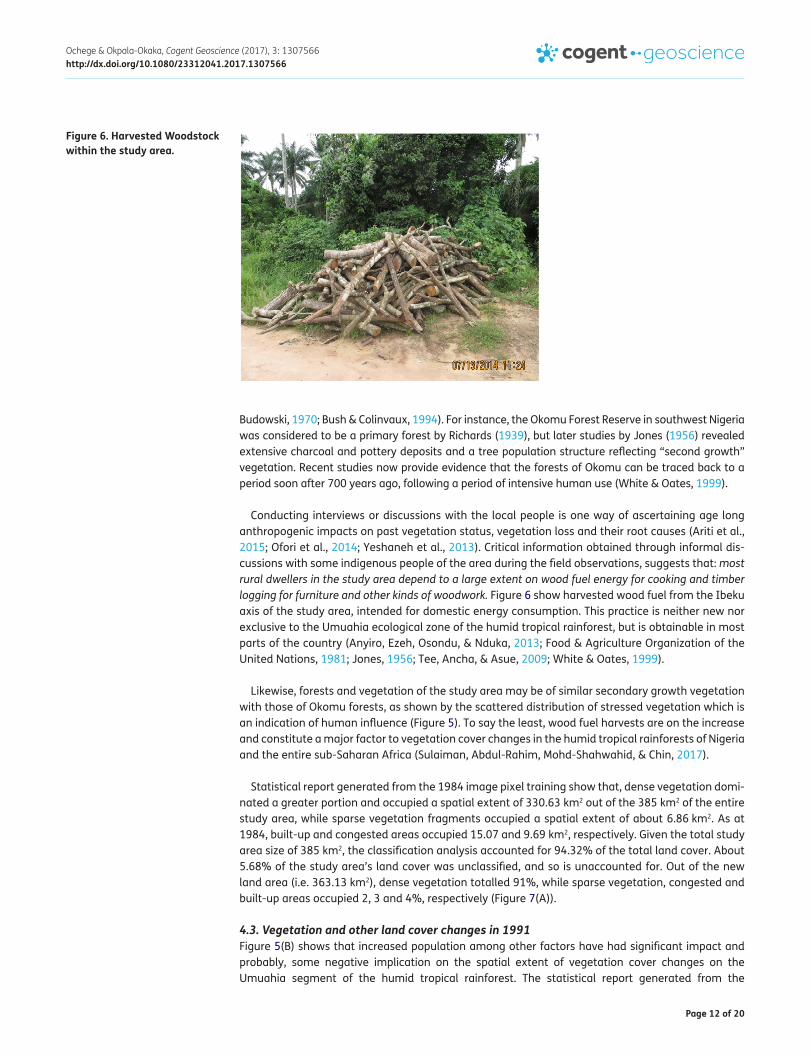
Conducting interviews or discussions with the local people is one way of ascertaining age long anthropogenic impacts on past vegetation status, vegetation loss and their root causes (Ariti et al., 2015; Ofori et al., 2014; Yeshaneh et al., 2013). Critical information obtained through informal dis-cussions with some indigenous people of the area during the field observations, suggests that: most rural dwellers in the study area depend to a large extent on wood fuel energy for cooking and timber logging for furniture and other kinds of woodwork. Figure 6 show harvested wood fuel from the Ibeku axis of the study area, intended for domestic energy consumption. This practice is neither new nor exclusive to the Umuahia ecological zone of the humid tropical rainforest, but is obtainable in most parts of the country (Anyiro, Ezeh, Osondu, & Nduka, 2013; Food & Agriculture Organization of the United Nations, 1981; Jones, 1956; Tee, Ancha, & Asue, 2009; White & Oates, 1999).
Likewise, forests and vegetation of the study area may be of similar secondary growth vegetation with those of Okomu forests, as shown by the scattered distribution of stressed vegetation which is an indication of human influence (Figure 5). To say the least, wood fuel harvests are on the increase and constitute a major factor to vegetation cover changes in the humid tropical rainforests of Nigeria and the entire sub-Saharan Africa (Sulaiman, Abdul-Rahim, Mohd-Shahwahid, & Chin, 2017).
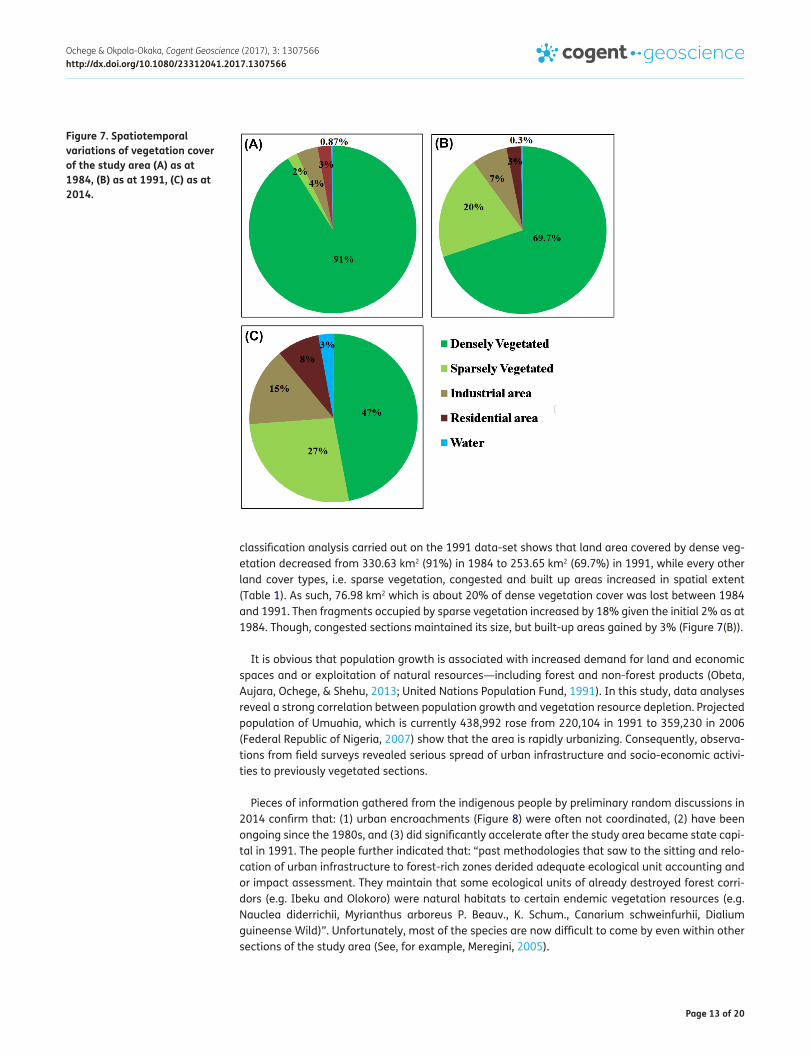
Statistical report generated from the 1984 image pixel training show that, dense vegetation domi-nated a greater portion and occupied a spatial extent of 330.63 km2 out of the 385 km2 of the entire study area, while sparse vegetation fragments occupied a spatial extent of about 6.86 km2. As at 1984, built-up and congested areas occupied 15.07 and 9.69 km2, respectively. Given the total study area size of 385 km2, the classification analysis accounted for 94.32% of the total land cover. About 5.68% of the study area’s land cover was unclassified, and so is unaccounted for. Out of the new land area (i.e. 363.13 km2), dense vegetation totalled 91%, while sparse vegetation, congested and built-up areas occupied 2, 3 and 4%, respectively (Figure 7(A)).
4.3. Vegetation and other land cover changes in 1991Figure 5(B) shows that increased population among other factors have had significant impact and probably, some negative implication on the spatial extent of vegetation cover changes on the Umuahia segment of the humid tropical rainforest. The statistical report generated from the
Figure 6. Harvested Woodstock within the study area.
Page 13 of 20
Ochege & Okpala-Okaka, Cogent Geoscience (2017), 3: 1307566http://dx.doi.org/10.1080/23312041.2017.1307566
classification analysis carried out on the 1991 data-set shows that land area covered by dense veg-etation decreased from 330.63 km2 (91%) in 1984 to 253.65 km2 (69.7%) in 1991, while every other land cover types, i.e. sparse vegetation, congested and built up areas increased in spatial extent (Table 1). As such, 76.98 km2 which is about 20% of dense vegetation cover was lost between 1984 and 1991. Then fragments occupied by sparse vegetation increased by 18% given the initial 2% as at 1984. Though, congested sections maintained its size, but built-up areas gained by 3% (Figure 7(B)).
It is obvious that population growth is associated with increased demand for land and economic spaces and or exploitation of natural resources—including forest and non-forest products (Obeta, Aujara, Ochege, & Shehu, 2013; United Nations Population Fund, 1991). In this study, data analyses reveal a strong correlation between population growth and vegetation resource depletion. Projected population of Umuahia, which is currently 438,992 rose from 220,104 in 1991 to 359,230 in 2006 (Federal Republic of Nigeria, 2007) show that the area is rapidly urbanizing. Consequently, observa-tions from field surveys revealed serious spread of urban infrastructure and socio-economic activi-ties to previously vegetated sections.
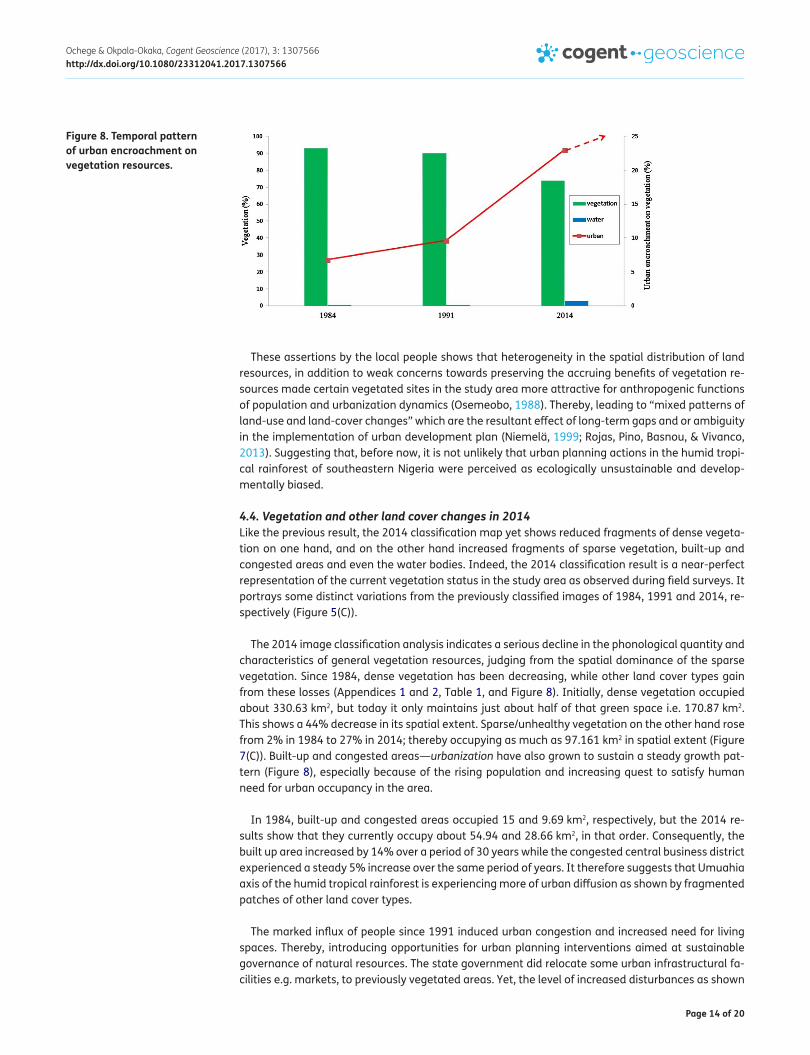
Pieces of information gathered from the indigenous people by preliminary random discussions in 2014 confirm that: (1) urban encroachments (Figure 8) were often not coordinated, (2) have been ongoing since the 1980s, and (3) did significantly accelerate after the study area became state capi-tal in 1991. The people further indicated that: “past methodologies that saw to the sitting and relo-cation of urban infrastructure to forest-rich zones derided adequate ecological unit accounting and or impact assessment. They maintain that some ecological units of already destroyed forest corri-dors (e.g. Ibeku and Olokoro) were natural habitats to certain endemic vegetation resources (e.g. Nauclea diderrichii, Myrianthus arboreus P. Beauv., K. Schum., Canarium schweinfurhii, Dialium guineense Wild)”. Unfortunately, most of the species are now difficult to come by even within other sections of the study area (See, for example, Meregini, 2005).
Figure 7. Spatiotemporal variations of vegetation cover of the study area (A) as at 1984, (B) as at 1991, (C) as at 2014.
Page 14 of 20
Ochege & Okpala-Okaka, Cogent Geoscience (2017), 3: 1307566http://dx.doi.org/10.1080/23312041.2017.1307566
These assertions by the local people shows that heterogeneity in the spatial distribution of land resources, in addition to weak concerns towards preserving the accruing benefits of vegetation re-sources made certain vegetated sites in the study area more attractive for anthropogenic functions of population and urbanization dynamics (Osemeobo, 1988). Thereby, leading to “mixed patterns of land-use and land-cover changes” which are the resultant effect of long-term gaps and or ambiguity in the implementation of urban development plan (Niemelä, 1999; Rojas, Pino, Basnou, & Vivanco, 2013). Suggesting that, before now, it is not unlikely that urban planning actions in the humid tropi-cal rainforest of southeastern Nigeria were perceived as ecologically unsustainable and develop-mentally biased.
4.4. Vegetation and other land cover changes in 2014Like the previous result, the 2014 classification map yet shows reduced fragments of dense vegeta-tion on one hand, and on the other hand increased fragments of sparse vegetation, built-up and congested areas and even the water bodies. Indeed, the 2014 classification result is a near-perfect representation of the current vegetation status in the study area as observed during field surveys. It portrays some distinct variations from the previously classified images of 1984, 1991 and 2014, re-spectively (Figure 5(C)).
The 2014 image classification analysis indicates a serious decline in the phonological quantity and characteristics of general vegetation resources, judging from the spatial dominance of the sparse vegetation. Since 1984, dense vegetation has been decreasing, while other land cover types gain from these losses (Appendices 1 and 2, Table 1, and Figure 8). Initially, dense vegetation occupied about 330.63 km2, but today it only maintains just about half of that green space i.e. 170.87 km2. This shows a 44% decrease in its spatial extent. Sparse/unhealthy vegetation on the other hand rose from 2% in 1984 to 27% in 2014; thereby occupying as much as 97.161 km2 in spatial extent (Figure 7(C)). Built-up and congested areas—urbanization have also grown to sustain a steady growth pat-tern (Figure 8), especially because of the rising population and increasing quest to satisfy human need for urban occupancy in the area.
In 1984, built-up and congested areas occupied 15 and 9.69 km2, respectively, but the 2014 re-sults show that they currently occupy about 54.94 and 28.66 km2, in that order. Consequently, the built up area increased by 14% over a period of 30 years while the congested central business district experienced a steady 5% increase over the same period of years. It therefore suggests that Umuahia axis of the humid tropical rainforest is experiencing more of urban diffusion as shown by fragmented patches of other land cover types.
The marked influx of people since 1991 induced urban congestion and increased need for living spaces. Thereby, introducing opportunities for urban planning interventions aimed at sustainable governance of natural resources. The state government did relocate some urban infrastructural fa-cilities e.g. markets, to previously vegetated areas. Yet, the level of increased disturbances as shown
Figure 8. Temporal pattern of urban encroachment on vegetation resources.
Page 15 of 20
Ochege & Okpala-Okaka, Cogent Geoscience (2017), 3: 1307566http://dx.doi.org/10.1080/23312041.2017.1307566
by the classification analyses of 1991 and 2014 suggests increased human impacts on the region’s ecological landscape. Regrettably, deforestation and habitat loss are the greatest threat to terres-trial biodiversity and ecosystem health which equally leads to species extinction at the time of oc-currence and in the future (Millennium Ecosystem Assessment, 2005).
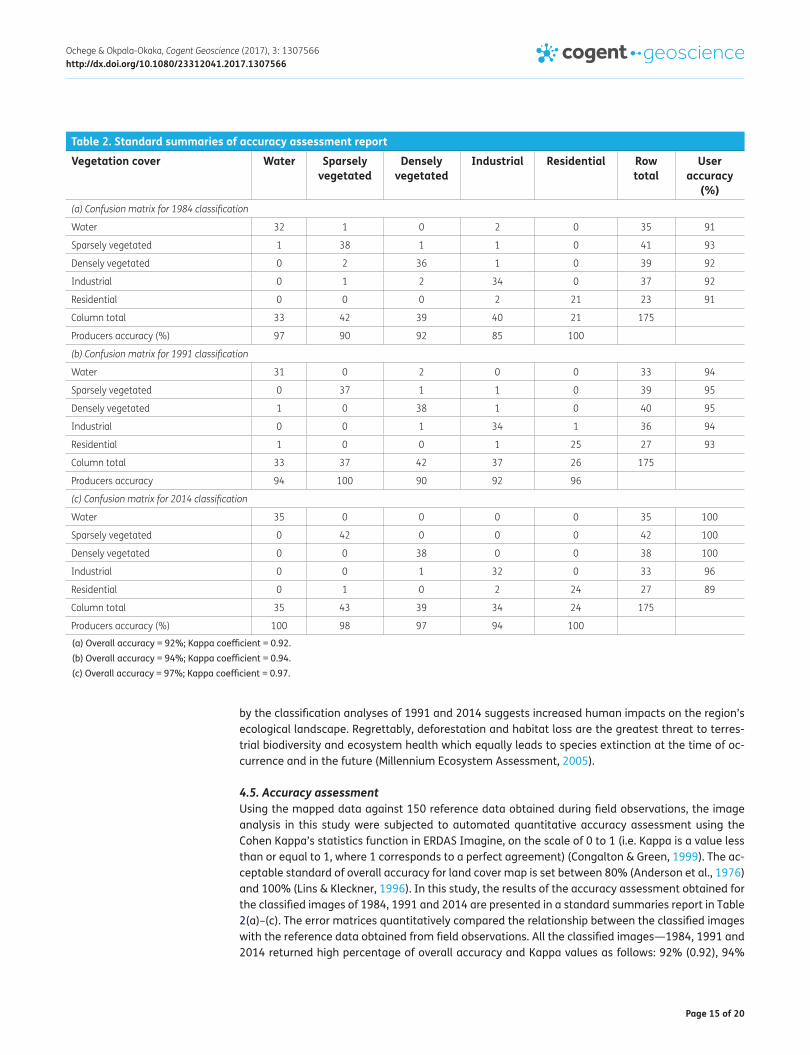
4.5. Accuracy assessmentUsing the mapped data against 150 reference data obtained during field observations, the image analysis in this study were subjected to automated quantitative accuracy assessment using the Cohen Kappa’s statistics function in ERDAS Imagine, on the scale of 0 to 1 (i.e. Kappa is a value less than or equal to 1, where 1 corresponds to a perfect agreement) (Congalton & Green, 1999). The ac-ceptable standard of overall accuracy for land cover map is set between 80% (Anderson et al., 1976) and 100% (Lins & Kleckner, 1996). In this study, the results of the accuracy assessment obtained for the classified images of 1984, 1991 and 2014 are presented in a standard summaries report in Table 2(a)–(c). The error matrices quantitatively compared the relationship between the classified images with the reference data obtained from field observations. All the classified images—1984, 1991 and 2014 returned high percentage of overall accuracy and Kappa values as follows: 92% (0.92), 94%
Table 2. Standard summaries of accuracy assessment report
(a) Overall accuracy = 92%; Kappa coefficient = 0.92.(b) Overall accuracy = 94%; Kappa coefficient = 0.94.(c) Overall accuracy = 97%; Kappa coefficient = 0.97.
Vegetation cover Water Sparsely vegetated
Densely vegetated
Industrial Residential Row total
User accuracy
(%)(a) Confusion matrix for 1984 classification
Water 32 1 0 2 0 35 91
Sparsely vegetated 1 38 1 1 0 41 93
Densely vegetated 0 2 36 1 0 39 92
Industrial 0 1 2 34 0 37 92
Residential 0 0 0 2 21 23 91
Column total 33 42 39 40 21 175
Producers accuracy (%) 97 90 92 85 100
(b) Confusion matrix for 1991 classification
Water 31 0 2 0 0 33 94
Sparsely vegetated 0 37 1 1 0 39 95
Densely vegetated 1 0 38 1 0 40 95
Industrial 0 0 1 34 1 36 94
Residential 1 0 0 1 25 27 93
Column total 33 37 42 37 26 175
Producers accuracy 94 100 90 92 96
(c) Confusion matrix for 2014 classification
Water 35 0 0 0 0 35 100
Sparsely vegetated 0 42 0 0 0 42 100
Densely vegetated 0 0 38 0 0 38 100
Industrial 0 0 1 32 0 33 96
Residential 0 1 0 2 24 27 89
Column total 35 43 39 34 24 175
Producers accuracy (%) 100 98 97 94 100
Page 16 of 20
Ochege & Okpala-Okaka, Cogent Geoscience (2017), 3: 1307566http://dx.doi.org/10.1080/23312041.2017.1307566
(0.94) and 97% (0.97), respectively. This show a high level of conformity with the supervised classifi-cation analysis carried out in the study (Table 2).
4.6. Factors responsible for vegetation cover changes in the study areaThis study identified four major factors responsible for vegetation cover changes in the humid tropi-cal rainforest segment of Umuahia. (1) Unchecked and increased local demand for forest and non-forest products, (2) Rapidly growing population induced by the reason of the study area’s centrality and official recognition as state capital in 1991, (3) Urban diffusion influenced by increased demand for land and economic spaces (i.e. urbanization), (4) Long-term gaps in the implementation of veg-etation monitoring frameworks (see, for example, Erika et al., 2015).
Field observations conducted in 2011 and 2014 reveal that the humid tropical rainforest of south-eastern Nigeria is a biodiversity rich belt, with abundance of several endemic vegetation resources that provides various benefits to the indigenous people and uphold useful potentials for posterity. Yet, this rich ecologically vibrant area is considered one of the most rapidly urbanizing and endan-gered areas in Nigeria.
In 1991, the study area was officially declared a headquarter city in southeastern Nigeria. The ac-tion trickled-down a ripple cause-effect response of vegetation resources to anthropogenic phe-nomenon of urbanization. The rising population initiated increased demand for land and economic spaces, which in turn, affected vegetated areas by increased exploitation of natural resources—in-cluding forest and non-forest products.
Data extracted from the analyses in this study (Table 1 and Appendix 2) showed increased human impact on vegetation cover. This is indicated by fragmented sparsely vegetated areas, growth of industrial and residential land uses (Figure 8). One of the understudied geographies of population impact on natural resources is the role of institutional governance in monitoring deforestation and vegetation loss in Africa (Erika et al., 2015; Larcom et al., 2016). Nevertheless, like most other re-gions, the study area continues to experience unrestrained exploitation of natural resources by vir-tue of domestic need and industrial demand for fuel wood and timber, respectively.
Also, the spatiotemporal extent maps generated in this study show that built-up and residential areas had become fragmented given the accelerated rate of vegetation reduction since 1991 to 2014. Generally, this kind of situation is often attributed to the concentration of built-up patches or new infrastructural developments along emerging economic corridors (Müller, Griffiths, & Hostert, 2016; Simmons et al., 2016).
Based on the forgoing, Umuahia section of the tropical rainforest is currently witnessing its middle phase of urbanization process. This is exemplified by the area experiencing more of urban diffusion, urban growth (Figure 8) and less of vegetation resilience and forest recovery (Table 1, Appendix 1). As such, vegetation reduction in the area is highly correlated with anthropogenic functions from population dynamics.
5. Conclusion and recommendationThis study shows that remote sensing of vegetation is a consistent methodology in ascertaining changes and phenological characteristics in the humid tropical rainforests. The change detection covered a 30-year period, starting from 1984 to 2014, and revealed a reduction in size of healthy vegetation by 159.76 km2 which indicates a 44% vegetation loss. Composite replacement of healthy vegetation cover in the area is impacted by other land use cover types as follows; 90.3 km2 (un-healthy vegetation), 18.97 km2 (congested/residential), 39.87 km2 (built-up/industrial area), 9.59 km2 (Water-body). Thereby, indicating a gross encroachment of urban land use of about 23.02% into vegetated areas, and reduced it from 93.03% in 1984 to 73.8% in 2014.
Page 17 of 20
Ochege & Okpala-Okaka, Cogent Geoscience (2017), 3: 1307566http://dx.doi.org/10.1080/23312041.2017.1307566
The most significant changes in the spatiotemporal dynamics of land use cover in the study area accelerated after the area became capital city in 1991. Similarly, the much higher percentage of vegetation loses recorded before 1991 (i.e. mid-1980s) is attributed to the persistent unsustainable exploitation of vegetation resources resulting from lack of adequate vegetation monitoring frame-works. Implying that, unsustainable exploitation of vegetation resources, increased economic activi-ties in need of industrial and residential occupancies, in addition to uncoordinated urban expansions constitutes the anthropogenic functions of urbanization currently experienced in the study area. These, therefore suggest that, there is need to strengthen institutional monitoring frameworks that should account for all ecological units in the humid tropical rainforests.
Though limited by data availability, this study provides the baseline information about vegetation depletion in the humid tropical rainforests of Nigeria, and recommends periodic integration of high-resolution satellite images with urban afforestation strategies in natural resources governance through public engagements. Stakeholders and the local people, whom the vegetation resources are domiciled in their communities, can be adequately consulted, sensitized and integrated into every activity that may directly or indirectly affect ecological heritage. This will increase rates of vegeta-tion resilience and forest recovery, such that, developments that disregard ecological losses and urban greening can be monitored effectively.
Acknowledgements Prof R.N.C. Anyadike (Late) significantly initiated the process that led to this study. We thank our local field guides, and all the reviewers for their helpful comments.
FundingThe authors received no direct funding for this research.
Author detailsFriday Uchenna Ochege1,2
E-mail: [email protected] ID: http://orcid.org/0000-0002-6661-0966Chukwunonyelum Okpala-Okaka2
E-mail: [email protected] Laboratory for Cartography and GIS, Department of
Geography & Environmental Management, University of Port Harcourt, Choba, Rivers State, Nigeria.
2 Faculty of Environmental Studies, Department of Surveying and Geoinformatics, University of Nigeria, Enugu, Nigeria.
Citation informationCite this article as: Remote sensing of vegetation cover changes in the humid tropical rainforests of Southeastern Nigeria (1984–2014), Friday Uchenna Ochege & Chukwunonyelum Okpala-Okaka, Cogent Geoscience (2017), 3: 1307566.
Cover imageSource: Authors.
ReferencesAbia State of Nigeria. (2005). Abia state economic
empowerment and development strategy. Abia State Government Publication. Retrived June 14, 2014, from http://web.ng.undp.org/documents/SEEDS/Abia_State.pdf
Adekunle, V. A. J., Olagoke, A. O., & Ogundare, L. F. (2013). Timber exploitation rate in tropical rainforest ecosystem of southwest nigeria and its implications on sustainable forest management. Applied Ecology and Environmental Research, 11, 123–136. http://dx.doi.org/10.15666/aeer
Anderson, J. R., Hardy, E. E., Roach, J. T., & Witmer, R. E. (1976). A land-use and land cover classification system for use with remote sensor data (Professional Paper 964). Washington, DC: United State Geological Survey.
Anyiro, C. O., Ezeh, C. I., Osondu, C. K., & Nduka, G. A. (2013). Economic analysis of household energy use: A rural urban case study of Abia State, Nigeria. Research and Reviews: Journal of Agriculture and Allied Sciences, 2, 20–27.
Ariti, A. T., van Vliet, J., & Verburg, P. H. (2015). Land-use and land-cover changes in the Central Rift Valley of Ethiopia: Assessment of perception and adaptation of stakeholders. Applied Geography, 65, 28–37. http://dx.doi.org/10.1016/j.apgeog.2015.10.002
Aubreville, A. (1938). La forêt coloniale: les forêts de l’Afrique occidentale française [The colonial forest: The forests of French West Africa]. Annuales Academie des Sciences Coloniales, 9, 1–245.
Banko, G. (1998). A review of assessing the accuracy of classifications of remotely sensed data and of methods including remote sensing data in forest inventory. In International Institution for Applied Systems Analysis, Laxenburg, Austria. IIASSA Interim Report No. IR-98-081. Retrived from http://pure.iiasa.ac.at/5570/1/IR-98-081.pdf
Budowski, G. (1970). The distinction between old secondary and climax species in tropical Central American lowland forests. Tropical Ecology, 11, 44–48.
Bush, M. B., & Colinvaux, P. A. (1994). Tropical forest disturbance: Paleoecological records from Darien, Panama. Ecology, 75, 1761–1768. http://dx.doi.org/10.2307/1939635
Campling, P., Gobin, A., & Feyen, J. (2001). Temporal and spatial rainfall analysis across a humid tropical catchment. Hydrological Processes, 15, 359–375. http://dx.doi.org/10.1002/(ISSN)1099-1085
Chen, Y., Lu, D., Luo, G. P., & Huang, J. (2015). Detection of vegetation abundance change in the alpine tree line using multitemporal Landsat Thematic Mapper imagery. International Journal of Remote Sensing, 36, 4683–4701. doi:10.1080/01431161.2015.1088675
Churches, E. C., Wampler, P. J., Sun, W. & Smith, A. J. (2014). Evaluation of forest cover estimates for Haiti using supervised classification of Landsat data. International Journal of Applied Earth Observation and Geoinformation, 30, 203–216. doi:10.1016/j.jag.2014.01.020
Congalton, R. (1991). A review of assessing the accuracy of classifications of remotely sensed data. Remote Sensing of Environment, 37, 35–46. http://dx.doi.org/10.1016/0034-4257(91)90048-B
Page 18 of 20
Ochege & Okpala-Okaka, Cogent Geoscience (2017), 3: 1307566http://dx.doi.org/10.1080/23312041.2017.1307566
Congalton, R. G., & Green, K. (1999). Assessing the accuracy of remotely sensed data: Principles and practices. Boca Raton, FL: Lewis Publishers.
Coppin, P., Jonckheere, I., Nackaerts, K., Muys, B., & Lambin, E. (2004). Digital change detection methods in ecosystem monitoring: A review. International Journal of Remote Sensing, 25, 1565–1596. http://dx.doi.org/10.1080/0143116031000101675
Coppin, P. R., & Bauer, M. E. (1996). Digital change detection in forest ecosystems with remote sensing imagery. Remote Sensing Reviews, 13, 207–234.
DIVA-GIS. (2016). Land cover map of Nigeria. Retrieved December, 2016, from http://biogeo.ucdavis.edu/data/diva/cov/NGA_cov.zip
Du, J., Shu, J., Yin, J., Yuan, X., Jiaerheng, A., Xiong, S., … Liu, W. (2015). Analysis on spatio-temporal trends and drivers in vegetation growth during recent decades in Xinjiang, China. International Journal of Applied Earth Observation and Geoinformation, 38, 216–228. doi:10.1016/j.jag.2015.01.006
Dubula, B., Tesfamichael, S. G., & Rampedi, I. T. (2016). Assessing the potential of remote sensing to discriminate invasive Asparagus laricinus from adjacent land cover types. Cogent Geoscience, 2(1), 1–17.
Ejenma, E. (2013). Trends and patterns of house rents in Umuahia (Unpublished PhD Seminar 1). Choba: Department of Geography and Environmental Management, University of Port Harcourt.
Erika, R., Celso, B. L., Martin, H., Erik, L., Robert, O., Arief, W., Daniel, M., & Louis, V. (2015). Assessing change in national forest monitoring capacities of 99 tropical Countries. Forest Ecology and Management, 352, 109–123.
FAO. (2012). State of the world’s forests 2012. Italy: Author.FAO. (2013). The latest state of the World’s Forest Report of the
Food and Agricultural Organisation (FAO) indicate a dangerous cutback in the overall forest reserves in Africa especially between 1990 and 2012. Italy: Author.
Federal Republic of Nigeria. (1977). The national atlas of the Federal Republic of Nigeria (FRN 1st ed.). Lagos: Federal Surveys.
Federal Republic of Nigeria. (2007). Official gazette: Legal notice on publication of the details of the breakdown of the national and state provisional totals 2006 census. Lagos: Author.
Fisher, B., & Turner, R. (2008). Ecosystem services: Classification for valuation. Biological Conservation, 141, 1167–1169. http://dx.doi.org/10.1016/j.biocon.2008.02.019
Food & Agriculture Organization of the United Nations. (1981). Map of fuelwood situation on developing countries (pp. 1–10). Rome: Author.
Foody, G. M. (2002). Status of land cover classification accuracy assessment. Remote Sensing of Environment, 80, 185–201. http://dx.doi.org/10.1016/S0034-4257(01)00295-4
Forkel, M., Carvalhais N., Verbesselt J., Mahecha M. D., Neigh S. R. C., & Reichstein M. (2013). Trend change detection in NDVI time series: Effects of inter-annual variability and methodology. Remote Sensing, 5, 2113–2144. doi:10.3390/rs5052113
Friberg, N., Bonada, N., Bradley, D. C., Dunbar, M. J., Edwards, F. K., Grey, J., … Woodward, G. (2011). Biomonitoring of human impacts in freshwater ecosystems: The good, the bad and the ugly. Advances in Ecological Research, 1–68. http://dx.doi.org/10.1016/B978-0-12-374794-5.00001-8
Hagenlocher, M., Lang, S., & Tiede, D. (2012). Integrated assessment of the environmental impact of an IDP camp in Sudan based on very high resolution multi-temporal satellite imagery. Remote Sensing of Environment, 126, 27–38. http://dx.doi.org/10.1016/j.rse.2012.08.010
Hansen, M. C., Potapov, P. V., Moore, R., Hancher, M., Turubanova, S. A., Tyukavina, A., … Townshend, J. R. G. (2013). High-resolution global maps of 21st-century forest cover change. Science, 342, 850–853.
Huang, X., Lu, Q., Zhang, L., & Plaza, A. (2014). New postprocessing methods for remote sensing image classification: A systematic study. IEEE Transactions on Geoscience and Remote Sensing, 52, 7140–7159. http://dx.doi.org/10.1109/TGRS.2014.2308192
Igbawua, T., Zhang, J., Chang, Q., & Yao, F. (2016). Vegetation dynamics in relation with climate over Nigeria from 1982 to 2011. Environmental Earth Sciences, 75, 1–16.
Igbozurike, M. U. (1975). Vegetation types. In G. E. K. Ofomata (Ed.), Nigeria in maps (pp. 30–32). Benin City: Ethiope Publishing House.
Iloeje, N. P. (2007). A new geography of Nigeria. Ikeja: Longman Nigerian PLC.
Jensen, J. R. (2014). Remote sensing of the environment: An earth resource perspective (2nd ed.). Harlow: Pearson.
Jones, E. W. (1956). Ecological studies of the rain forest of southern Nigeria IV. The plateau forest of the Okomu Forest Reserve, Part 2. The reproduction and history of the forest. The Journal of Ecology, 44, 83–117. http://dx.doi.org/10.2307/2257155
Kottek, M., Grieser, J., Beck, C., Rudolf, B., & Rubel, F. (2006). World map of the Köppen-Geiger climate classification updated. Meteorologische Zeitschrift, 15, 259–263.
Larcom, S., van Gevelt, T., & Zabala, A. (2016). Precolonial institutions and deforestation in Africa. Land Use Policy, 51, 150–161. http://dx.doi.org/10.1016/j.landusepol.2015.10.030
Lillesand, T., Kiefer, R., & Chipman, J. (Eds.). (2015). Remote sensing and image interpretation (7th ed.). Hoboken, NJ: John Wiley & Sons.
Lins, K. S., & Kleckner, R. L. (1996). Land cover mapping: An overview and history of the concepts. In J. M. Scott, T. H. Tear, & F. Davis (Eds.), Gap analysis: A landscape approach to biodiversity planning (pp. 57–65). Bethesda, MD: American Society for Photogrammetry and Remote Sensing.
Loveland, T. R., & Dwyer, J. L. (2012). Landsat: Building a strong future. Remote Sensing of Environment, 122, 22–29. http://dx.doi.org/10.1016/j.rse.2011.09.022
Lucas, R., Blonda, P., Bunting, P., Jones, G., Inglada, J., Arias, M., … Charnock, R. (2015). The earth observation data for habitat monitoring (EODHaM) system. International Journal of Applied Earth Observation and Geoinformation, 37, 17–28. http://dx.doi.org/10.1016/j.jag.2014.10.011
Lund, H. G. (1983). Change: Now you see it—now you don’t! In Proceedings of the international conference on renewable resource inventories for monitoring changes and trends (pp. 211–213). Corvallis, OR: Oregon State University.
Luo, G. P., & Dai, L. (2012). Detection of alpine tree line change with high spatial resolution sensed data. Journal of Applied Remote Sensing, 2. doi:10.1117/1.JRS.7.073520
Luo, G. P., Zhou, C. H., Chen, X., & Li, Y. (2008). A methodology of characterizing status and trend of land changes in oases: A case study of Sangong River watershed, Xinjiang, China. Journal of Environmental Management, 88, 775–783.
Matlack, G. R. (1994). Vegetation dynamics of the forest edge—Trends in space and successional time. The Journal of Ecology, 113–123. http://dx.doi.org/10.2307/2261391
Mckey, D., Waterman, P. G., Gartlan, J. S., & Struhsaker, T. T. (1978). Phenolic content of vegetation in two African rain forests: Ecological implications. Science (Washington, DC); (United States), 202.
Meduna, A. J., Ogunjimi, A. A., & Onadeko, A. (2009). Biodiversity conservation problems and their implications on Kainji Lake National Park, Nigeria. Journal of Sustainable Development in Africa, 10, 59–73.
Meregini, A. O. (2005). Some endangered plants producing edible fruits and seeds in Southeastern Nigeria. Fruits, 60, 211–220. http://dx.doi.org/10.1051/fruits:2005028
Page 19 of 20
Ochege & Okpala-Okaka, Cogent Geoscience (2017), 3: 1307566http://dx.doi.org/10.1080/23312041.2017.1307566
Millennium Ecosystem Assessment. (2005). Ecosystems and human well-being: Synthesis. Washington, DC: Island Press. Retrieved November 10, 2011, from http://www.maweb.org/documents/document.356.aspx.pdf
Milne, A. K. (1988). Change direction analysis using Landsat imagery: A review of methodology. In Proceedings of the IGARSS’88 Symposium Edinburgh, Scotland, ESASP-284 (pp. 541–544). Noordwijk: ESA.
Momoh, S. (2014). Endangered timber business. Vanguard, 2, 4.Müller, H., Griffiths, P., & Hostert, P. (2016). Long-term
deforestation dynamics in the Brazilian Amazon—Uncovering historic frontier development along the Cuiabá-Santarém highway. International Journal of Applied Earth Observation and Geoinformation, 44, 61–69. http://dx.doi.org/10.1016/j.jag.2015.07.005
Newbold, T., Hudson, L. N., Phillips, H. R., Hill, S. L., Contu, S., Lysenko, I., … Purvis, A. (2014). A global model of the response of tropical and sub-tropical forest biodiversity to anthropogenic pressures. Proceedings of the Royal Society B: Biological Sciences, 281, 20141371. http://dx.doi.org/10.1098/rspb.2014.1371
Niemelä, J. (1999). Ecology and urban planning. Biodiversity & Conservation, 8, 119–131. http://dx.doi.org/10.1023/A:1008817325994
Obeta, M. C., Ochege, F. U., Aujara, I. Y., & Shehu, S. M. (2013). Socio-economic significance of woodstocks and non-timber forest products in Jigawa State, Nigeria. In L. Popoola, F. O. Idumah, O. Y. Ogunsanwo, & I. O. Azeez, (Eds.). Forest industry in a dynamic global environment. Proceeding of the 35th Annual conference of the forestry Association of Nigeria (pp. 727–735). Sokoto: Forestry Association of Nigeria.
Obydenkova, A., Nazarov, Z., & Salahodjaev, R. (2016). The process of deforestation in weak democracies and the role of Intelligence. Environmental Research, 148, 484–490. http://dx.doi.org/10.1016/j.envres.2016.03.039
Ochege, F. U. (2014a). Spatio-temporal variations of vegetation cover over Umuahia, Abia state Nigeria from 1984 to 2014 (MSc thesis). University of Nigeria, Nsukka.
Ochege, F. U. (2014b). Geospatial assessment of forest degradation in Sagbama, Niger delta region of Nigeria (MSc thesis). University of Edinburgh, Scotland.
Odjugo, P. A. O. (2010). General overview of climate change impacts in Nigeria. Journal of Human Ecology, 29, 47–55.
Odjugo, P. A. O., & Ikhuoria, A. I. (2003). The impact of climate change and anthropogenic factors on desertification in the semi-arid region of Nigeria. Global Journal of Environmental Science, 2, 118–126.
Ofori, B. Y., Owusu, E. H., & Attuquayefio, D. K. (2014). Ecological status of the Mount Afadjato-Agumatsa range in Ghana after a decade of local community management. African Journal Ecology, 53, 116–120.
Okpala-Okaka, C., & Igbokwe, J. I. (2010). Revision of Nsukka N.E Topographic Map Sheet 287 1:50,000 (1964) using Nigeria SAT-1 Imagery. Nigerian Journal of Space Research, 7, 13–24.
Omo-Irabor, O., Olobaniyi, S. B., Akunna, J., Venus, V., Maina, J. M., & Paradzayi, C. (2011). Mangrove vulnerability modelling in parts of Western Niger Delta, Nigeria using satellite images, GIS techniques and Spatial Multi-Criteria Analysis (SMCA). Environmental Monitoring and Assessment, 178, 39–51. http://dx.doi.org/10.1007/s10661-010-1669-z
Onu, N. N., Opara, A. I., & Ehirim, C. N. (2012). Delineation of Active fractures in a gully erosion area using geophysical methods: Case study of the Okigwe—Umuahia Erosion Belt, Southeastern Nigeria. International Journal of Science and Technology, 2(4). ISSN 2224-3577.
Osemeobo, G. J. (1988). The Human causes of forest depletion in Nigeria. Environmental Conservation, 15, 17–28. http://dx.doi.org/10.1017/S0376892900028411
Richards, P. W. (1939). Ecological studies on the rain forest of southern Nigeria. 1. The structure and floristic composition of primary forest. The Journal of Ecology, 27, 1–61. http://dx.doi.org/10.2307/2256298
Rojas, C., Pino, J., Basnou, C., & Vivanco, M. (2013). Assessing land-use and-cover changes in relation to geographic factors and urban planning in the metropolitan area of Concepción (Chile). Implications for biodiversity conservation. Applied Geography, 39, 93–103.
Schwartz, M. D. (2003). Phenology: An integrative environmental science (vol. 39). Netherlands: Springer.
Scull, P., Cardelús, C. L., Klepeis, P., Woods, C. L., Frankl, A., & Nyssen, J. (2016). The resilience of Ethiopian church forests: Interpreting aerial photographs, 1938–2015. Land Degradation & Development.
Simmons, C., Walker, R., Perz, S., Arima, E., Aldrich, S., & Caldas, M. (2016). Spatial patterns of frontier settlement: Balancing conservation and development. Journal of Latin American Geography, 15, 33–58. http://dx.doi.org/10.1353/lag.2016.0011
Smith, B. D. (2007). The ultimate ecosystem engineers. Science, 315, 1797–1798. http://dx.doi.org/10.1126/science.1137740
Soofi, K. (2005). Remote sensing lecture: Image classification. UCSD: Satellite remote sensing - SIO 135/SIO 236. Retrieved from http://topex.ucsd.edu/rs/classification.pdf
Sulaiman, C., Abdul-Rahim, A. S., Mohd-Shahwahid, H. O., & Chin, L. (2017). Wood fuel consumption, institutional quality, and forest degradation in sub-Saharan Africa: Evidence from a dynamic panel framework. Ecological Indicators, 74, 414–419. http://dx.doi.org/10.1016/j.ecolind.2016.11.045
Tee, N. T., Ancha, P. U., & Asue, J. (2009). Evaluation of fuelwood consumption and implications on the environment: Case study of Makurdi area in Benue state, Nigeria. Journal of Applied Biosciences, 19, 1041–1048.
UNEP, IISD (Ed.). (2004). Exploring the links: Human well-being poverty and ecosystem services. Nairobi and Winnipeg, Manitoba: Author.
United Nations Population Fund. (1991). Population, resources and the environment: The critical challenges (154 p.). New York, NY. ISBN 0-89714-101-6.
Watson, R. T., Noble, I. R., Bolin, B., Ravindranath, N. H., Verardo, D. J., & Dokken, D. J. (2000). Land use, land-use change and forestry IPPC Report. Retrieved from www.ipcc.ch/pdf/special-reports/spm/srl-en.pdf
White, L. J. T., & Oates, J. F. (1999). New data on the history of the plateau forest of Okomu, southern Nigeria: An insight into how human disturbance has shaped the African rain forest. RESEARCH LETTER. Global Ecology and Biogeography, 8, 355–361. http://dx.doi.org/10.1046/j.1365-2699.1999.00149.x
World resources. (1987). An assessment of the resource base that supports the global economy. New York, NY: International institute of environment and development and the world resources institute Basic Books, 369 pp. https://www.wri.org/our-work/project/world-resources-report/publications?page=2
Yeshaneh, E., Wagner, W., Exner-Kittridge, M., Legesse, D., & Blöschl, G. (2013). Identifying land use/cover dynamics in the Koga catchment, Ethiopia, from multi-scale data, and implications for environmental change. ISPRS International Journal of Geo-Information, 2, 302–323. http://dx.doi.org/10.3390/ijgi2020302
Zhu, X., Liu, D., & Chen, J. (2012). A new geostatistical approach for filling gaps in Landsat ETM+ SLC-off images. Remote Sensing of Environment, 124, 49–60. http://dx.doi.org/10.1016/j.rse.2012.04.019
Page 20 of 20
Ochege & Okpala-Okaka, Cogent Geoscience (2017), 3: 1307566http://dx.doi.org/10.1080/23312041.2017.1307566
© 2017 The Author(s). This open access article is distributed under a Creative Commons Attribution (CC-BY) 4.0 license.You are free to: Share — copy and redistribute the material in any medium or format Adapt — remix, transform, and build upon the material for any purpose, even commercially.The licensor cannot revoke these freedoms as long as you follow the license terms.
Under the following terms:Attribution — You must give appropriate credit, provide a link to the license, and indicate if changes were made. You may do so in any reasonable manner, but not in any way that suggests the licensor endorses you or your use. No additional restrictions You may not apply legal terms or technological measures that legally restrict others from doing anything the license permits.
Cogent Geoscience (ISSN: 2331-2041) is published by Cogent OA, part of Taylor & Francis Group. Publishing with Cogent OA ensures:• Immediate, universal access to your article on publication• High visibility and discoverability via the Cogent OA website as well as Taylor & Francis Online• Download and citation statistics for your article• Rapid online publication• Input from, and dialog with, expert editors and editorial boards• Retention of full copyright of your article• Guaranteed legacy preservation of your article• Discounts and waivers for authors in developing regionsSubmit your manuscript to a Cogent OA journal at www.CogentOA.com
Appendix 1
Trend of land cover changes (%) in the study area
Appendix 2
Temporal pattern
Land use cover 1984 1991 2014Vegetation resources 93.03 89.97 73.81
Urban encroachment 6.82 9.67 23.02
Water 0.24 0.36 2.88


![Thermophysicalpropertiesofdryandhumidair ... · range of temperature and pressure. Data on gW of compressed humid air [7], humid nitrogen, humid argon, and humid carbon dioxide [9]](https://img.pdfslide.us/doc/110x75/5e626081cfea87225a37645c/thermophysicalpropertiesofdryandhumidair-range-of-temperature-and-pressure.jpg)