Embed Size (px)
Citation preview

Review Article
Remote Sensing of Urban/Suburban Infrastructure and
Socio-Economic Attributes* John R. Jensen and Dave C. Cowen
Temporal and spatial resolution requirements for extracting urban/suburban infrastructure and socio-economic attributes from remote sen.& data are presented. The goal is to relate the user information requirements with the current and pro- posed remote sensing systems to determine if there are sub- stantive gaps in capability. Several remote sensing systems currently provide some of the desired urban/suburban infra- structure and socio-economic information when the required spatial resolution is poorer than 4 by 4 m and the temporal resolution is between 1 and 55 days (e.g., Landsat MSS and Thematic Mapper, SPOTI-4, Russian TK-350, RADARSAT, In- dian IRS-ICD, NOAA AVHRR, GOES, Meteosat). Current high spatial resolution sensor systems such as the Russian SPIN-2 KVR-1000 (2- by 2-m panchromatic; when in orbit) and pro- posed sensor systems (EOSAT Space Imaging IKONOS 1- by 1-m panchromatic; Earth Watch Quickbird 0.82 by 0.82 m; Orbview-3 1 by I m) may provide additional capability. Large-scale metric aerial photography or digital camera imagery with spatial resolutions ranging from I 0.25 to 1 m will still be required to satisfy several important urban/sub- urban information requirements.
Introduction Urban landscapes are composed of diverse materials (con- crete, asphalt, metal, plastic, glass, shingles, water, grass, shrubs, trees, and soil) arranged by humans in complex ways to build housing, transportation systems, utilities, commer- cial buildings, and recreational landscapes (Welch, 1982; Swerdlow, 1998). The goal of this construction is usually to improve the quality-of-life. A significant number of profes- sional businessmen and women and public organizations re- quire up-to-date information about the city and suburban infrastructure. For example, detailed urban information is re- quired by (Cullingworth, 1997; American Planning Associa- tion, 1998):
city, county, and regional planning agencies and councils of governments that legislate zoning regulations to improve the
* Preliminarv versions were reoorted in T.R. Tensen and D.C. Cowen (1997), ~e&ote Sensing of ~;ban/~ub&b& Socio-economic Attrib- utes, Proceedings, Land Satellite Information in the Next Decade 11, American Society for Photogrammetry and Remote Sensing, Be- thesda, Maryland, compact disk, 19 p., and D.C. Cowen and J.R. Jensen (1998), Extraction and Modeling of Urban Attributes Using Remote Sensing Technology, People and Pixels: Linking Remote Sensing and Social Science, National Academy Press, Washington, D.C., pp. 164-188.
Department of Geography, University of South Carolina, Columbia, SC 29208 ([email protected]).
city and state Departments of Commerce to stimulate devel- opment; Tax Assessor offices that maintain legal geographic descrip- tions of every parcel of land, assess its value, and levy a tax millage rate; Departments of Transportation that maintain existing facili- ties, build new facilities, and prepare for future transporta- tion demand; private utility companies (water, sewer, gas, electricity, tele- phone, cable) that attempt to predict where new demand will occur and plan for the most efficient and cost-effective method of delivering services; Public Service Commissions that insure that utility services are available economically to the public; Departments of Parks, Recreation and Tourism who improve recreation facilities and promote tourism; Departments of Emergency Management and Preparedness who plan for and allocate resources in the event of a disaster; private real estate companies attempting to find the ideal lo- cation for industrial, commercial, and residential develop- ment; and residential, commercial, and industrial developers.
The urbanlsuburban land these professionals manage or de- velop is of significant monetary value. Therefore, it is not surprising that city, county, state, and federal agencies as well as private companies spend millions of dollars each year obtaining aerial photography and other forms of re- motely sensed data to extract the required urban information. Much of the required information simply cannot be obtained through in situ site surveys.
Temporal, Spectral, and Spatial Characteristlcs of Urban Attributes and Remote Sensing Systems Many of the detailed urbanlsuburban attributes that busi- nesses and public agencies require are summarized in Table 1. This paper reviews how remotely sensed data may be of value for collecting information about these attributes. To re- motely sense these urban phenomena, it is h s t necessary to appreciate the urban attributes' temporal, spectral, and spa- tial resolution characteristics.
Urban/Suburban Temporal Considerations Three types of temporal resolution should be considered when monitoring urban environments using remote sensor data. First, urbanlsuburban phenomena progress through an identifiable developmental cycle much like vegetation pro- gresses through a phenological cycle. For example, Jensen
- - -
Photogrammetric Engineering & Remote Sensing, Vol. 65, No. 5, May 1999, pp. 611-622.
0099-1112I99I6505-611$3.00/0 O 1999 American Society for Photogrammetry
and Remote Sensing
PHOTOGRAMMETRIC ENGINEERING & REMOTE SENSING May 1999 611

TABLE 1. URBAN/SUBURBAN A ~ R I B U T E S AND THE MINIMUM REMOTE SENSING RESOLUTIONS REQUIRED TO PROVIDE SUCH ~NFORMAT~ON
Minimum Resolution Requirements
Attributes Temporal Spatial Spectral
Land UseILand Cover L1-USGS Level I LZ-USGS Level I1 L3-USGS Level III L4-USGS Level IV Building and Property Infrastructure Bl-building perimeter, area, height and cadastra
information (property lines) Transportation Inhastructure TI-general road centerline T2-precise road width T3-traffic count studies (cars, airplanes, etc.) T4-parking studies Utility Infrastructure U1-general utility line mapping and routing UZ-precise utility line width, right-of-way Us-location of poles, manholes, substations Digital Elevation Model (DEM) Creation Dl-large scale DEM D2-large scale slope map Socioeconomic Characteristcs S1-local population estimation SZ-regionallnational population estimation S3-quality of life indicators Energy Demand and Conservation El-energy demand and production potential E2-building insulation surveys Meteorological Data MI-weather prediction M2-current temperature M3-clear air and precipitation mode M4-severe weather mode M5-monitoring urban heat island effect Critical Environmental Area Assessment C1-stable sensitive environments C2-dynamic sensitive environments Disaster Emergency Response DEl-pre-emergency imagery DEZ-post-emergency imagery DEB-damaged housing stock DE4-damaged transportation DE5-damaged utilities, services
5-10 years 5-10 years 3-5 years 1-3 years
1-5 years
1-5 years 1-2 years 5-10 rnin
10-60 rnin
1-5 years 1-2 years 1-2 years
5-10 years 5-10 years
5-7 years 5-15 years 5-10 years
1-5 years 1-5 years
3-25 min 3-25 min 6-10 min 5 rnin
12-24 hr
1-2 years 1-6 months
1-5 years 12 hr-2 days
1-2 days 1-2 days 1-2 days
1-30 m 0.25-0.5 m 0.25-0.5 m 0.25-0.5 m
1-30 m 0.25-0.6 m 0.25-0.6 m
0.25-0.5 m 0.25-0.5 m
0.25-5 m 5-20 m
0.25-30 m
0.25-1 m 1-5 m
1-8 km 1-8 km l k m 1 km 5-30 m
1-10 m 0.25-2 m
1-5 m 0.25-2 m 0.25-1 m 0.25-1 m 0.25-1 m
V-NIR-MIR-Radar V-NIR-MIR-Radar Pan-V-NIR-MIR Panchromatic
Pan-Visible
Pan-V-NIR Pan-Visible Panchromatic
Pan-Visible Pan-Visible
Pan-v-NIR TIR
V-NIR-TIR TIR WSR-88D Radar WSR-88D Radar TIR
v-NIR-MIR V-NIR-MIR-TIR
and Toll (1983) documented a ten-stage single-family resi- dential housing development cycle at work in suburban Den- ver, Colorado that progressed from (1) rangeland to (10) fully-landscaped residential housing, often within one year. The image analyst must understand the temporal develop- ment cycle of the urban phenomena. If it is not understood, embarrassing and costly interpretation mistakes can be made.
The second type of temporal resolution is how often it is possible for a remote sensor system to collect data of the urban landscape, e.g., every 8 days, every 16 days, or on- demand. Generally, satellite sensors that can be pointed off- nadir (e.g., SPOT HRV) have higher temporal resolution than sensors that only sense the terrain at nadir (e.g., Landsat Thematic Mapper). Orbital characteristics of the satellite platform and the latitude of the study area also impact the revisit schedule. Remote sensor data may be collected on de- mand from sub-orbital aircraft (airplanes, helicopters), weather conditions permitting. up-to-date remote sensor data are critical for most urbanlsuburban applications.
Finally, temporal resolution may refer to how often land managerslplanners need a specific type of information. For example, local planning agencies may require population es- timates every 5 to 7 years in addition to the estimates pro-
vided by the decennial census. The managerial temporal resolution requirements for many important urban applica- tions are summarized numerically in Table 1 and graphically in Figure 1.
Urban/Suburban Spectral Considerations Most image analysts would agree that, when extracting ur- banlsuburban information from remotely sensed data, it is more important to have high spatial resolution (often < 5 by 5 m) than high spectral resolution (i.e., a large number of multispectral bands). For example, local population estimates based on building unit counts usually require a minimum spatial resolution of from I 0.25 to 5 m (0.82 ft to 16.4 ft) to detect, distinguish between, andlor identify the type of indi- vidual buildings. Practically any visible band (e.g., green or red) or near-infrared spectral band at this spatial resolution will do. Of course, there must be sufficient spectral contrast between the object of interest (e.g., a building) and its back- ground (e.g., the surrounding landscape) in order to detect, distinguish between, and identify the object from its back- ground.
While high spectral resolution is not required, there are still optimum portions of the electromagnetic spectrum that
I 612 M a y 1 9 9 9 PHOTOGRAMMETRIC ENGINEERING & REMOTE SENSING

0.3 0.5 1 rn 5 10 2 0 3 0 100 m
IRS-I A6 USSI 72.5 x 72.5
L I S P 38.25 X 38.25
23.5 x 23.5; MIR 70 x 70 W S 188 x 188
SWlR30x30m TIRQOxQOm
: : . , . , : :
, ' . * . . - <
~. . ' , > ' . ; : i j . , i : lkm : : 2 - : :
l m 2 3 5 1 0 1 5 2 0 3 0 100m 1000 m 5km lOkm I I I I I I I I
o . ; d s o ! s . ; l . o 1 4 1 ' ~ b 1 : i \& i i '1A3 d o 4
Nominal Spatial Resolution in meters
Figure 1. Subjective spatial and temporal resolution requirements for urban/suburban attributes overlaid on the spatial and temporal resolution capabilities of current and proposed remote sensor systems. Refer to Table 1 for urban/suburban codes. Information presented in this type of diagram will constantly change due to (a) the development of new remote sensing instruments and their associated temporal and spatial resolutions, and (b) the user community continuously redefines existing data requirements and identifies new attributes to be collected.
are especially useful for extracting certain types of urban/ land cover is best acquired using the visible color (0.4 to 0.7 suburban information (Table 1). For example, USGS Level 111 pn; V), near-infrared (0.7 to 1.1 ym; NIR), middle-infrared
PHOTOGRAMMETRIC ENGINEERING & REMOTE SENSING May 1999 613
-
(1.5 to 2.5 pm; MIR), andlor panchromatic (0.5 to 0.7 pm) portions of the spectrum. Building perimeter, area, and height information is best acquired using black-and-white panchromatic (0.5 to 0.7 pm) or color imagery (0.4 to 0.7 pm). The thermal infrared portion of the spectrum (3 to 1 2 pm; TIR) may be used to obtain urban temperature measure- ments. Active microwave sensors may obtain imagery of cloud shrouded or tropical urban areas (e.g., Japanese RRS-1 L-band, Canadian RADARSAT C-band, and European Space Agency ERS-1, 2 C-band).
Urban/Suburban Spatial Conslderatlons Trained image analysts utilize the tone, color, texture, shape, size, orientation, pattern, shadow silhouette, site, and situa- tion of objects in the urban landscape to identify and judge their significance (Jensen, 1996). The geometric elements of image interpretation (e.g., object shape, size, orientation, pat- tern, shadow silhouette) are especially useful when high spa- tial resolution imagery of urban environments are available. But should we judge the usefulness of a given type of im- agery (e.g., aerial photography or Landsat Thematic Mapper imagery) for extracting very specific types of urbanlsuburban information based solely on its spatial characteristics? One solution might be to use the military andlor civilian versions of the National Image Interpretation Rating Scales (NWS) de- veloped by the Image Resolution Assessment and Reporting Standards Committee (IRARS). The NI IR~ is the metric used by the intelligence community to characterize the usefulness of imagery for intelligence purposes (Leachtenaurer, 1996; Leachtenaurer et al., 1998; Logicon, 1995; Logicon, 1997; Pike, 1998). The NWS criteria consist of ten rating levels (0 to 9) for a given type of imagery arrived at through evalua- tion by trained image analysts. The IRARS committee makes it clear that spatial resolution (ground resolved distance) is only one of the measures of the interpretability of an image. Other factors such as film quality, atmospheric haze, con- trast, angle of obliquity, and noise can reduce the ability of a well trained analyst to detect, distinguish between, and iden- tify military and civilian objects in an image. While it would be useful to use the NIIRS criteria, it is not optimum for this review because (1) the civil NWS criteria were only recently made available (Hothem et al., 1996; Leachtenauer et al., 1998); (2) there has not been sufficient time for the civilian community to familiarize itself with the concept; and, conse- quently, (3) the civilian community has never reported their collective experiences in urbanlsuburban information extrac- tion during the current and past decades in this context.
Fortunately, the civilian user community has often re- ported the utility of a given type of imagery for extracting urban information based on the comparatively easy to under- stand concept of nominal spatial resolution. When using sat- ellite remote sensing systems, the nominal spatial resolution (ground resolved distance) of the sensor system is typically used such as the Landsat Thematic Mapper's six 30- by 30-m multispectral bands or SPOT Image's 10- by 10-m panchro- matic band. Conversely, the figure of merit for measuring re- solvability of a film camera system is the area weighted average resolution (AWAR) measured in line-pairs-per-milli- meter (lplrnm) (Light, 1993). A line pair is the width of one black bar and one white space as contained on resolution targets in an aerial photograph. Together, they form a pair and serve as a measure of image quality for the aerial film camera industry. The five essential elements that make up the system AWAR are the lens, original film, image blur (smear) on the film due to aircraft forward velocity, angular motion, and the resolution of the duplicating film. Also, scene contrast of the Earth and atmosphere play a role in system resolution. Fortunately, scientists have studied the general relationship between aerial photography scale and
AWAR. For example, Light (1993; 1996) documented that, if we assume that the Earth is a low contrast scene, the 1: 40,000-scale National Aerial Photography Program (NAPP) photography exhibits approximately 39 lplrnm and yields ap- proximately 25 pm for the size of 1 lp in the image. At 1: 40,000 scale, 25 pm equates to a ground resolution of 1 by 1 m for low-contrast scenes. Therefore, a minimum of a 1-m ground resolution can be expected throughout the photo- graphic mission. In fact, the usGs digital orthophoto quarter- quad files produced from 1:40,000-scale NAPP photography are provided at a 1- by 1-m (3.28- by 3.28-ft) spatial resolu- tion by scanning the photography with a pixel size of 11 vm. Light (personal communication, 1998) suggests that there is a general linear relationship for larger scale aerial photography obtained using metric cameras, i.e., 1:20,000-scale aerial pho- tography equates to approximately 0.5 by 0.5 m (1.64 by 1.64 ft), 1:10,000-scale photography to 0.25 by 0.25 m (0.82 by 0.82 ft), and 1:5,000-scale photography to 0.125 by 0.125 m (0.41 by 0.41 ft).
Another general spatial resolution rule is that there needs to be a minimum of four spatial obsenrations (e.g., pix- els) within an urban object to identify it. Stated another way, the sensor spatial resolution should be one-half the diameter of the smallest object-of-interest. For example, to identify mobile homes that are 5 m wide, the minimum spatial reso- lution of high quality imagery without haze or other prob- lems is I 2.5- by 2.5-m pixels (Cowen et a]., 1995).
The temporal, spectral, and spatial resolution require- ments for the urban attributes summarized in Table 1 and Figure 1 were synthesized from subjective, practical experi- ence reported in journal articles, symposia, chapters in books, and government and society manuals (Chisnell and Cole, 1958; Stone, 1964; Branch, 1971; Ford, 1979; Jensen, 1983; Avery and Berlin, 1993; Light, 1993; Light, 1996; Greve, 1996; Jensen, 1996; Philipson, 1997; Haack et al., 1997; Keister, 1997; Cowen and Jensen, 1998; Pike, 1998; Ridley et al., 1998; and others in the individual sections). Ideally, there would always be a remote sensing system that could obtain images of the terrain that satisfy the urban at- tributes' resolution requirements (Table 1). Practically, this is not always the case.
Evaluation of Urban/Suburban Attributes' Spatial and Temporal Requirements and the Availability of Remote Sensing Systems to Provide Such Information The relationship between temporal and spatial data require- ments for selected urbanlsuburban attributes and the tem- poral and spatial characteristics of available and proposed remote sensing systems is presented in Figure 1.
Land Use/Land Cover The term land use refers to how the land is being used. Land cover refers to the biophysical materials found on the land. For example, a state park may be used for recreation but have a deciduous forest cover. One method of organizing land-uselland-cover information is to use a classification sys- tem. The most comprehensive hierarchical classification system for urbanlsuburban land use is the Land-Based Clas- sification Standard (LBCS) under development by the Ameri- can Planning Association (1998) that updates the 1965 Standard Land Use Coding Manual (Urban Renewal Admin- istration, 1965) which is cross-referenced with the 1987 Stan- dard Industrial Classification (SIC) Manual (Bureau of the Budget, 1987) and the updated North American Industrial Classification Standard (NAICS). The LBCS requires extensive input from in situ site surveys, aerial photography, and satel- lite remote sensor data to obtain information at the parcel level on the following five characteristics: activity, function,
PHOTOGRAMMETRIC ENGINEERING & REMOTE SENSING
land Cover Class Level
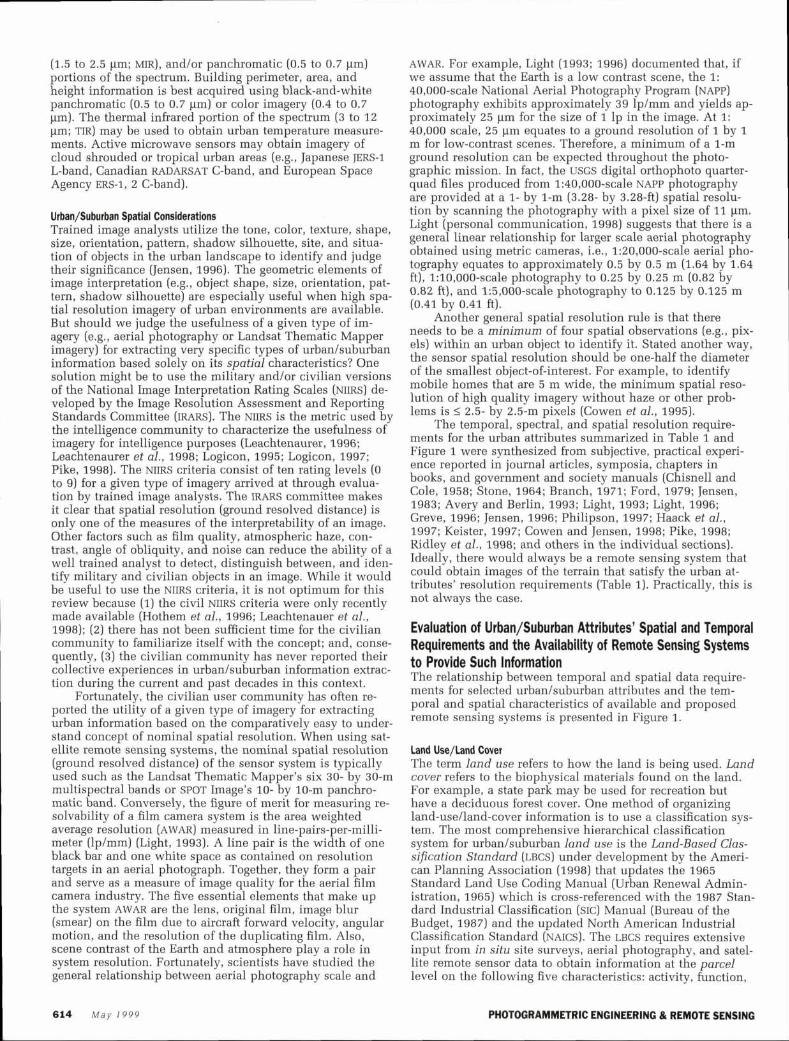
Figure 2. The general relationship between the U.S. Geological Survey Land Use and Land Cover Classifica tion System class level and the nominal spatial resolution of the re- mote sensing system (often referred to as ground resolved distance in meters).
site development, structure, and ownership (American Plan- ning Association, 1998). The system does not provide infor- mation on land cover or vegetation characteristics in the urban environment because it is relying on the Federal Geo- graphic Data Committee "Standards" on these topics. The LBCS is not complete at this time. Therefore, the following discussion will focus on the use of the "land use and land cover classification system for use with remote sensor data" developed by the U.S. Geological Survey (Anderson et al., 1976).
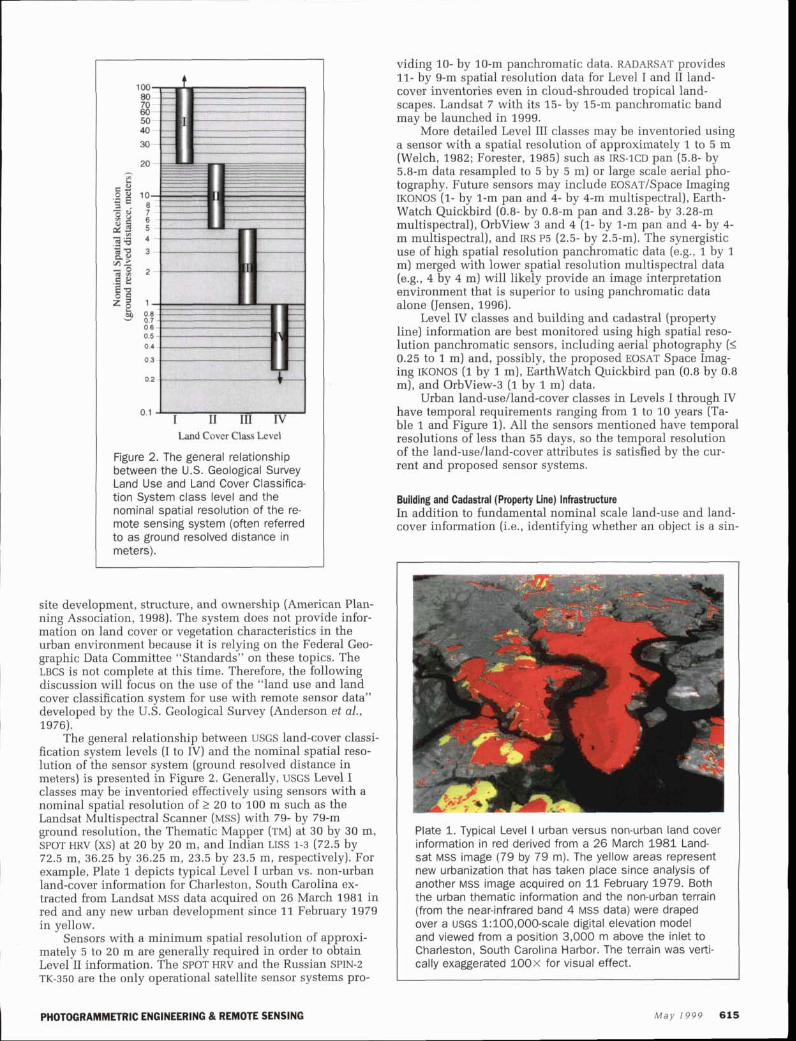
The general relationship between USGS land-cover classi- fication system levels (I to IV) and the nominal spatial reso- lution of the sensor system (ground resolved distance in meters) is presented in Figure 2. Generally, UsGs Level I classes may be inventoried effectively using sensors with a nominal spatial resolution of 2 20 to 100 m such as the Landsat Multispectral Scanner (MSS) with 79- by 79-m ground resolution, the Thematic Mapper (TM) at 30 by 30 m, SPOT HRV (XS) at 20 by 20 m, and Indian LISS 1-3 (72.5 by 72.5 m, 36.25 by 36.25 m, 23.5 by 23.5 m, respectively). For example, Plate 1 depicts typical Level I urban vs. non-urban land-cover information for Charleston, South Carolina ex- tracted from Landsat MSS data acquired on 26 March 1981 in red and any new urban development since 11 February 1979 in yellow.
Sensors with a minimum spatial resolution of approxi- mately 5 to 20 m are generally required in order to obtain Level II information. The SPOT HRV and the Russian SPIN-2 TK-350 are the only operational satellite sensor systems pro-
) -METRIC IIIPINEERINQ & REMOTE SENSING
viding 10- by 10-m panchromatic data. RADARSAT provides 11- by 9-m spatial resolution data for Level I and 11 land- cover inventories even in cloud-shrouded tropical land- scapes. Landsat 7 with its 15- by 15-m panchromatic band may be launched in 1999.
More detailed Level III classes may be inventoried using a sensor with a spatial resolution of approximately 1 to 5 m (Welch, 1982; Forester, 1985) such as IRS-lcD pan (5.8- by 5.8-m data resampled to 5 by 5 m) or large scale aerial pho- tography. Future sensors may include ~ o s ~ ~ / S p a c e Imaging IKONOS (1- by 1-m pan and 4- by 4-m multispectral), Earth- Watch Quickbird (0.8- by 0.8-m pan and 3.28- by 3.28-m multispectral), Orbview 3 and 4 (1- by 1-m pan and 4- by 4- m multispectral), and IRS P5 (2.5- by 2.5-m). The synergistic use of high spatial resolution panchromatic data (e.g., 1 by 1 m] merged with lower spatial resolution multispectral data (e.g., 4 by 4 m) will likely provide an image interpretation environment that is superior to using panchromatic data alone (Jensen, 1996).
Level IV classes and building and cadastral (property line) information are best monitored using high spatial reso- lution panchromatic sensors, including aerial photography (5 0.25 to 1 m) and, possibly, the proposed EOSAT Space Imag- ing IKONOS (1 by 1 m), Earthwatch Quickbird pan (0.8 by 0.8 m), and Orbview-3 (1 by 1 m) data.
Urban land-uselland-cover classes in Levels I through IV have temporal requirements ranging from 1 to 10 years (Ta- ble 1 and Figure 1). All the sensors mentioned have temporal resolutions of less than 55 days, so the temporal resolution of the land-uselland-cover attributes is satisfied by the cur- rent and proposed sensor systems.
Bulldlng and Cadastral (Property Une) Infrastructure In addition to fundamental nominal scale land-use and land- cover information (i.e., identifying whether an object is a sin-
I Plate 1. Typical Level I urban versus non-urban land cover information in red derived from a 26 March 1981 Land- sat MSS image (79 by 79 m). The yellow areas represent new urbanization that has taken place since analysis of another MSS image acquired on 11 February 1979. Both the urban thematic information and the non-urban terrain (from the near-infrared band 4 MSS data) were draped over a usos 1:100,000-scale digital elevation model and viewed from a position 3,000 m above the inlet to Charleston, South Carolina Harbor. The terrain was verti- cally exaggerated 100x for visual effect.
May 1999 618

gle-family residence or a commercial building), transporta- tion planners, utility companies, tax assessors, and others require more detailed information on building footprint pe- rimeter, area, and height; driveways; patios; fences; pools; storage buildings; and the distribution of landscaping every 1 to 5 years. These building and property parameters are best obtained using stereoscopic (overlapping) panchromatic aer- ial photography or other remote sensor data with a spatial resolution of < 0.25 to 0.5 m (Jensen, 1995; Warner, 1996). For example, panchromatic stereoscopic aerial photography with 0.3- by 0.3-m (1 ft) spatial resolution was used to ex- tract the building perimeter and area information for the sin- gle-family residential area in Figure 3. With this type of data, each building footprint, patio, outbuilding, tree, pool, drive- way, fence, and contour may be extracted. In many instances, the fence lines are the cadastral property lines. If the fence lines are not visible or are not truly on the property line, the property lines are located by a surveyor and the information is overlaid onto an orthophotograph or planimetric map data- base to represent the legal cadastral (property) map. Many municipalities in the United States use high spatial resolu- tion imagery such as this as the source for some of the cadas- tral information andlor as an image back-drop upon which surveyed cadastral and tax information are portrayed.
Detailed building perimeter, area, and height data can be extracted from high spatial resolution (1 0.25- to 0.5-m) stere- oscopic imagery (Jensen et a]., 1996). Such information can then be used to create three-dimensional displays of the ur- ban terrain that we can walk through in a virtual reality en- vironment if desired (Wolff and Yaeger, 1993; Barnell, 1998). For example, Figure 4 depicts (1) a large scale vertical aerial photograph of downtown Columbia, South Carolina, (2) a digital elevation model (DEM) of the same area extracted from the stereoscopic photography depicting the height of every building, and (3) the orthophotograph draped over the DEM creating a virtual reality representation of a major street. Ar- chitects, planners, engineers, and real estate personnel are beginning to use such information for a variety of purposes.
EOSAT Space Imaging (1999), OrbView (1999), and Earthwatch (2000) plan to provide fore-aft stereoscopic im- ages from satellite-based platforms with approximately 0.8- to l-m spatial resolution. Ridley et al. (1998) conducted a feasibility study and found that simulated 1- by 1-m satellite stereoscopic data could "have potential for creating a na- tional 3D building model if the processes were automated, which would produce a much cheaper source of building heights." The accuracy of the building maximum heights (z) ranged between 1.5 and 3 m RMSE. Thus, the use of such im- agery may not obtain the detailed planimetric (perimeter, area) and topographic detail and accuracy (building height and volume) that can be extracted from high spatial resolu- tion stereoscopic aerial photography (5 0.25 to 0.5 m). Re- search is required using real 1- by 1-m stereoscopic data obtained from satellite platforms (Ridley et al., 1998).
Transportation Infrastructure Engineers often use remote sensor data to (1) update trans- portation network maps; (2) evaluate road, railroad, and air- port runway and tarmac condition; (3) study urban traffic patterns at choke points such as tunnels, bridges, shopping malls, and airports; and (4) conduct parking studies (Mintzer, 1983; Haack et al., 1997). One of the more prevalent forms of transportation data are the street centerline spatial data (scSD]. Three decades of practice have proven the value of differentiating between the left and right sides of each street segment and encoding attributes to them such as street names, address ranges, ZIP codes, census and political boundaries, and congressional districts. SCSD provide a good example of
616 M a y 1 9 9 9
Figure 3. Planimetric cadastral information of a single- family residential area extracted photogrammetrically from panchromatic stereoscopic vertical aerial photog- raphy. Building footprints are in black, fence lines with x's in black, driveways in white, shrubs and trees in black, 2-f& contours in continuous black lines, and highway right-of-way in dashed lines.
a national framework spatial data theme by virtue of their extensive current use in facility site selection, census opera- tions, socio-economic planning studies, and legislative redis- tricting (NRC, 1995; FGDC, 1997a).
Road network centerline updating in rapidly developing areas may be performed every 1 to 5 years and, in areas with minimum tree density (or during the leaf-off season), can be accomplished using imagery with a spatial resolution of 1 to 30 m (Lacy, 1992). If more precise road dimensions are re- quired such as the exact center of the road and the width of the road and sidewalks, then a spatial resolution of 5 0.2 to 0.5 m is required (Jensen et al., 1994). Currently, only aerial photography can provide such planimetric information (refer to Figure 3).
Road, railroad, and bridge conditions (cracks, potholes, etc.) are routinely monitored both in situ and using high spa- tial resolution remote sensor data. For example, Figure 5 presents a vertical panchromatic image of railroad and road bridges. Careful inspection of high spatial resolution imagery (I 0.25 to 0.5 m) by a trained analyst can provide significant information about the condition of the road and railroad (Stoeckeler, 1979; Haack et al., 1997).
Traffic count studies of automobiles, airplanes, boats, pe- destrians, and people in groups require very high temporal resolution data ranging from 5 to 10 minutes. Even when
PHOTOGRAMMETRIC ENGINEERING & REMOTE SENSING

Odghd Pachromstk: Aerial P h o b g g b Di&d Elevation Model @EM)
OrtaOpaato Draped Over DEM
CclllPlvTrmmlc&verLoestronModel
Figure 4. (a) Panchromatic aerial photograph of Columbia, South Carolina (original at 1:6,000 scale). (b) Digital elevation model (DEM) derived from a stereopair and portrayed a s a shaded-relief model. (c) An or- thophotograph of the area draped over the DEM and displayed in a three-dimensional perspective projec- tlon. (d) The DEM and a viewshed model were used to identify the optimum building on which to place a cellular phone transceiver.
such timely data are available, it is difficult to resolve a car or boat using even 1- by 1-m data. This requires high spatial resolution imagery from 5 0.25 to 0.5 m. Such information ' can only be acquired using aerial photography, digital cam- eras, or video sensors that are (1) located on the top edges of buildings looking obliquely at the terrain, or (2) placed in aircraft or helicopters and flown repetitively over the study areas. When such information is collected at an optimum time of day, future parking and traffic movement decisions can be made. Parking studies require the same high spatial resolution (I 0.25 to 0.5 m) but slightly lower temporal reso- lution (10 to 60 minutes). Doppler radar has demonstrated some potential for monitoring traffic flow and volume.
UtHity lmructure Urbanlsuburban environments are enormous consumers of electrical power, natural gas, telephone service, and potable water (Haack et al., 1997). In addition, they create great quan- tities of refuse, waste water, and sewage. The removal of storm water &om urban impervious surfaces is also a serious problem (Schultz, 1988). Automated mappinglfacilities man- agement (AMIFM) and geographic information systems (GIS) have been developed to manage extensive right-of-way corri- dors for various utilities, especially pipelines uadkowski et al., 1994; Jensen et al., 1998). The most fundamental task is to update maps to show a general centerline of the utility of interest such as a powerline right-of-way. This is relatively
PHOTOGRAMMETRIC ENGINEERING & REMOTE SENSING \ I 617

Figure 5. High resolution vertical panchromatic imagery of railroad and highway bridges. Road and railroad condition as well as bridge condition can be monitored using such imagery.
applied to the commercial high spatial resolution remote sensor data.
Terrain elevation does not change very rapidly. There- fore, a DEM of an urbanized area need only be acquired once ever 5 to 10 years unless there is significant development and the analyst desires to compare two different date DEMs to determine change in terrain elevation, identify unpermit- ted additions to buildings, or determine changes in building heights.
Soci&conomic Charactedstics Selected socio-economic characteristics may be extracted di- rectly from remote sensor data or by using surrogate informa- tion derived from the imagery. Two of the most important attributes are population estimation and quality-of-life indi- cators.
Most GIS used for socio-economic or environmental planning include a digital elevation model (DEM) (Cowen et al., 1995). The public often forgets that digital elevation models are de- rived primarily from analysis of stereoscopic remote sensor data (Jensen, 1995). It is also possible to extract relatively coarse z-elevation information using SPOT 10- by 10-m data, SPIN-2 data (Lavrov, 1997), and Landsat Thematic Mapper 30- by 30-m data (Gugan and Dowrnan, 1988). Any DEM to be used in an urbanlsuburban application should ideally have z-elevation and x, y coordinates that meet Geospatial Posi- tioning Accuracy Standards (FGDC, 1997b). A sensor that can provide such information at the present time is stereo- scopic large-scale metric aerial photography with a spatial resolution of I 0.25 to 0.5 m. A DEM of downtown Columbia, South Carolina, derived from aerial photography, was previ- ously shown in Figure 4. The DEM data can be modeled to compute slope and aspect statistical surfaces for a variety of applications. It can also be used to identify the optimum lo- cation for placing various utilities as shown in Figure 4d.
Ridley et al. (1998) found that simulated 1- by 1-m stere- oscopic satellite data when processed using standard off-the- shelf DEM generation packages, yielded a z-elevation RMSE ranging from 1.5 to 2 m after editing and showed consider- able potential for creating DEMs for use in national mapping. Digital desktop softcopy photogrammetry is revolutionizing the creation and availability of DEMs (Petrie and Kennie, 1990; Jensen, 1995) and should be of significant value when
I
the imagery must be of sufficient spatial resolution to identify individual structures even through tree cover and whether they are residential, commercial, or industrial buildings; some estimation of the average number of persons per dwell- ing unit must be available; some estimate of the number of homeless, seasonal, and mi- gratory workers is required; and it is assumed that all dwelling units are occupied, and that only n families live in each unit (calibrated using in situ in- vestigation).
Population Estimation Knowing how many people live within a specific geographic area or administrative unit (e.g., city, county, state, country) is very powerful information. In fact, it has been suggested
This is usually performed every 5 to 7 years and re- quires high spatial resolution remotely sensed data (< 0.25 to 5 m). For example, individual dwelling units in a section of Irmo, South Carolina were extracted hom 2.5- by 2.5-m air- craft multispectral data (Cowen et al., 1995). Correlation of the remote sensing derived dwelling unit data with U.S. Bu- reau of the Census dwelling unit data for the 32 census block area yielded an P = 0.81 (correlation coefficient of 0.91). These findings suggest that the new high spatial resolution panchromatic sensors may provide a good source of informa- tion for monitoring the housing stock of a community on a routine basis. This will enable local governments to antici- pate and plan for schools and other services with data that have a much more frequent temporal resolution than does the decennial census. These data will also be of value for real estate, marketing, and other business applications (Lo, 1995). Unfortunately, the dwelling unit approach is not suit-
that the global effects of increased population density on eco- system land-cover conversion and human well-being may be
straightforward if the utility is not buried or obscured by much more sigdicant than those arising from climate change trees and if 1- to 30-m spatial resolution remote sensor data (Skole, 1994). Population estimation can be perfomed at the are available. It is also often necessary to identify Prototype local, regional, and national level based on (1) counts of in- utility (e.g., pipeline) routes (Feldman et al., 1995). Such dividual dwelling units, (2) measurement of urbanized land studies require geographically extensive imagery such as areas (often referred to as settlement size), and (3) estimates SPOT (20 by 20 m) or Landsat 'Ilematic Mapper data (30 by derived from land-uselland-cover classification (Lo, 1995; 30 m) that have relatively large scene dimensions. The ma- Sutton et a]., 1997). jority of the actual and proposed rights-of-way may be ob- Remote sensing techniques may provide population esti- served well on imagery with 1 to 30 m spatial resolution mates that approach the accuracy of traditional census meth- obtained once every 1 to 5 Years. But* when it is necessary to ods if sufficiently accurate in situ data are available to cali- inventory the exact location of transmission tower footpads, brate the remote sensing model. Unfortunately, ground-based utility poles, and manhole covers; the true centerline of the population estimations may be inaccurate (Clayton and Estes, utility; the width of the utility right-of-way; and the dimen- 1979). many instances in developing remote sions of buildings, pumphouses, and substations, then it is sensing methods may be superior to ground-based methods. necessary to have a spatial resolution of from I 0.25 to 0.6 m The most accurate remote sensing method for estimating (~adkowski et al., 1994). Ideally, new facilities are invento- the population of a local area is to count individual dwelling ried every 1 to 2 years. units based on the following assumptions (Forester, 1985;
Lindgren, 1985; Lo, 1986; Lo, 1995; Holz, 1988; Haack et al., Digital Elevation Model (DEMI Creation 19971:
I 618 M a y 1999 PHOTOGRAMMETRIC ENGINEERING & REMOTE SENSING
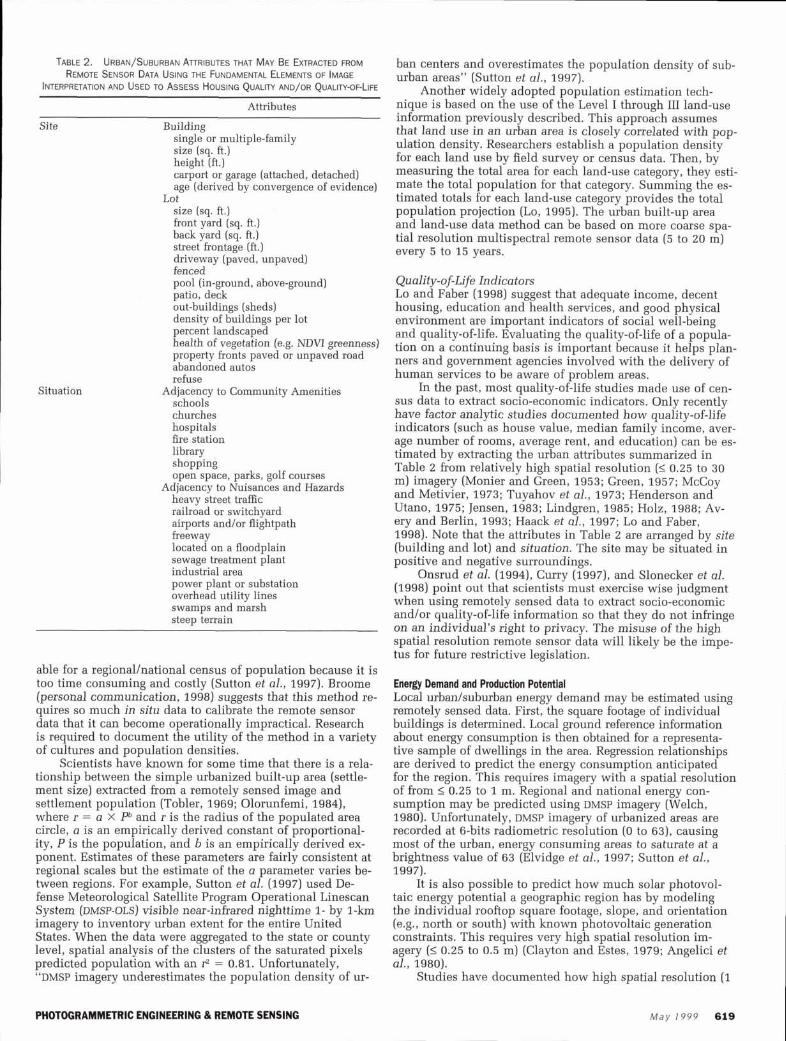
IABLE 2. URBAN/SUBURBAN ATTRIBUTES THAT MAY BE EXTRACTED FROM
REMOTE SENSOR DATA USING THE FUNDAMENTAL ELEMENTS OF IMAGE INTERPRETATION AND USED TO ASSESS HOUSING QUALITY AND/OR QUALITY-OFLIFE
Attributes
Site
Situation
Building single or multiple-family size (sq. ft.) height (ft.) carport or garage (attached, detached) age (derived by convergence of evidence)
Lot size (sq. ft.) front yard (sq. ft.) back yard (sq. ft.) street frontage (ft.) driveway (paved, unpaved) fenced pool (in-ground, above-ground) patio, deck out-buildings (sheds) density of buildings per lot percent landscaped health of vegetation (e.g. NDVI greenness) property fronts paved or unpaved road abandoned autos refuse
Adjacency to Community Amenities schools churches hospitals fire station library shopping open space, parks, golf courses
Adjacency to Nuisances and Hazards heavy street traffic railroad or switchyard airports and/or flightpath freeway located on a floodplain sewage treatment plant industrial area power plant or substation overhead utility lines swamps and marsh steep terrain
able for a regional/national census of population because it is too time consuming and costly (Sutton et a]., 1997). Broome (personal communication, 1998) suggests that this method re- quires so much i n situ data to calibrate the remote sensor data that it can become operationally impractical. Research is required to document the utility of the method in a variety of cultures and population densities.
Scientists have known for some time that there is a rela- tionship between the simple urbanized built-up area (settle- ment size) extracted horn a remotely sensed image and settlement population (Tobler, 1969; Olorunfemi, 1984), where r = a x Pb and r is the radius of the populated area circle, a is an empirically derived constant of proportional- ity, P is the population, and b is an empirically derived ex- ponent. Estimates of these parameters are fairly consistent at regional scales but the estimate of the a parameter varies be- tween regions. For example, Sutton et al. (1997) used De- fense Meteorological Satellite Program Operational Linescan System (DMSP-OLS) visible near-infrared nighttime 1- by 1-km imagery to inventory urban extent for the entire United States. When the data were aggregated to the state or county level, spatial analysis of the clusters of the saturated pixels predicted population with an rZ = 0.81. Unfortunately, "DMSP imagery underestimates the population density of ur-
ban centers and overestimates the population density of sub- urban areas" (Sutton et al., 1997).
Another widely adopted population estimation tech- nique is based on the use of the Level I through I11 land-use information previously described. This approach assumes that land use in an urban area is closely correlated with pop- ulation density. Researchers establish a population density for each land use by field survey or census data. Then, by measuring the total area for each land-use category, they esti- mate the total population for that category. Summing the es- timated totals for each land-use category provides the total population projection (Lo, 1995). The urban built-up area and land-use data method can be based on more coarse spa- tial resolution multispectral remote sensor data (5 to 20 m) every 5 to 15 years.
Quality-of-Life Indicators Lo and Faber (1998) suggest that adequate income, decent housing, education and health services, and good physical environment are important indicators of social well-being and quality-of-life. Evaluating the quality-of-life of a popula- tion on a continuing basis is important because it helps plan- ners and government agencies involved with the delivery of human services to be aware of problem areas.
In the past, most quality-of-life studies made use of cen- sus data to extract socio-economic indicators. Only recently have factor analytic studies documented how quality-of-life indicators (such as house value, median family income, aver- age number of rooms, average rent, and education) can be es- timated by extracting the urban attributes summarized in Table 2 from relatively high spatial resolution (1 0.25 to 30 m) imagery (Monier and Green, 1953; Green, 1957; McCoy and Metivier, 1973; Tuyahov et al., 1973; Henderson and Utano, 1975; Jensen, 1983; Lindgren, 1985; Holz, 1988; Av- ery and Berlin, 1993; Haack et al., 1997; Lo and Faber, 1998). Note that the attributes in Table 2 are arranged by site (building and lot) and situation. The site may be situated in positive and negative surroundings.
Onsrud et al. (1994), Curry (1997), and Slonecker et al. (1998) point out that scientists must exercise wise judgment when using remotely sensed data to extract socio-economic and/or quality-of-life information so that they do not infringe on an individual's right to privacy. The misuse of the high spatial resolution remote sensor data will likely be the impe- tus for future restrictive legislation.
Energy Demand and Production Potentlal Local urbanlsuburban energy demand may be estimated using remotely sensed data. First, the square footage of individual buildings is determined. Local ground reference information about energy consumption is then obtained for a representa- tive sample of dwellings in the area. Regression relationships are derived to predict the energy consumption anticipated for the region. This requires imagery with a spatial resolution of from 1 0.25 to 1 m. Regional and national energy con- sumption may be predicted using DMSP imagery (Welch, 1980). Unfortunately, DMSP imagery of urbanized areas are recorded at 6-bits radiometric resolution (0 to 63), causing most of the urban, energy consuming areas to saturate at a brightness value of 63 (Elvidge et al., 1997; Sutton et al., 1997).
It is also possible to predict how much solar photovol- taic energy potential a geographic region has by modeling the individual rooftop square footage, slope, and orientation (e.g., north or south) with known photovoltaic generation constraints. This requires very high spatial resolution im- agery (1 0.25 to 0.5 m) (Clayton and Estes, 1979; Angelici et a]., 1980).
Studies have documented how high spatial resolution (1
PHOTOGRAMMETRIC ENGINEERING 81 REMOTE SENSING M a y 1 9 9 9 619
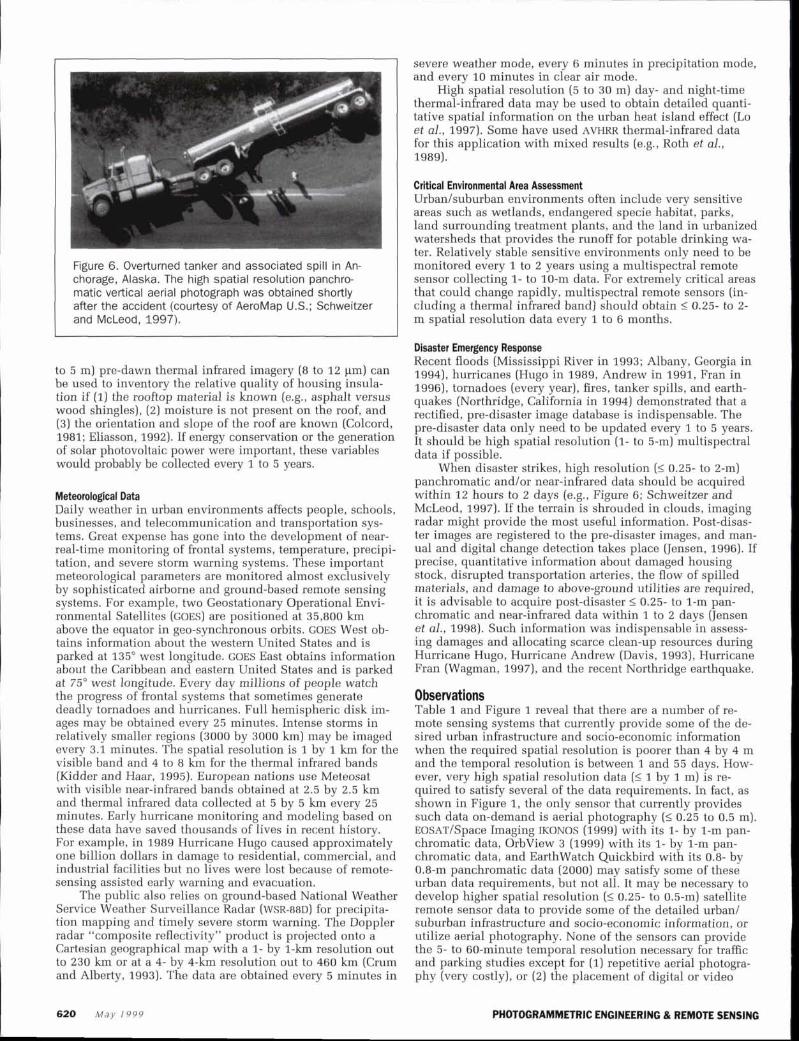
Figure 6. Overturned tanker and associated spill in An- chorage, Alaska. The high spatial resolution panchro- matic vertical aerial photograph was obtained shortly after the accident (courtesy of AeroMap US.; Schweitzer and McLeod, 1997).
to 5 m) pre-dawn thermal infrared imagery (8 to 1 2 km) can be used to inventory the relative quality of housing insula- tion if (1) the rooftop material is known (e.g., asphalt versus wood shingles), (2) moisture is not present on the roof, and (3) the orientation and slope of the roof are known (Colcord, 1981; Eliasson, 1992). If energy conservation or the generation of solar photovoltaic power were important, these variables would probably be collected every 1 to 5 years.
Meteorological Data Daily weather in urban environments affects people, schools, businesses, and telecommunication and transportation sys- tems. Great expense has gone into the development of near- real-time monitoring of frontal systems, temperature, precipi- tation, and severe storm warning systems. These important meteorological parameters are monitored almost exclusively by sophisticated airborne and ground-based remote sensing systems. For example, two Geostationary Operational Envi- ronmental Satellites (GOES) are positioned at 35,800 km above the equator in geo-synchronous orbits. GOES West ob- tains information about the western United States and is parked at 135' west longitude. GOES East obtains information about the Caribbean and eastern United States and is parked at 75" west longitude. Every day millions of people watch the progress of frontal systems that sometimes generate deadly tornadoes and hurricanes. Full hemispheric disk im- ages may be obtained every 25 minutes. Intense storms in relatively smaller regions (3000 by 3000 km) may be imaged every 3.1 minutes. The spatial resolution is 1 by 1 km for the visible band and 4 to 8 krn for the thermal infrared bands (Kidder and Haar, 1995). European nations use Meteosat with visible near-infrared bands obtained at 2.5 by 2.5 km and thermal infrared data collected at 5 by 5 km every 25 minutes. Early hurricane monitoring and modeling based on these data have saved thousands of lives in recent history. For example, in 1989 Hurricane Hugo caused approximately one billion dollars in damage to residential, commercial, and industrial facilities but no lives were lost because of remote- sensing assisted early warning and evacuation.
The public also relies on ground-based National Weather Service Weather Surveillance Radar (WSR-88~) for precipita- tion mapping and timely severe storm warning. The Doppler radar "composite reflectivity" product is projected onto a Cartesian geographical map with a 1- by 1-km resolution out to 230 km or at a 4- by 4-km resolution out to 460 km (Crum and Alberty, 1993). The data are obtained every 5 minutes in
severe weather mode, every 6 minutes in precipitation mode, and every 10 minutes in clear air mode.
High spatial resolution (5 to 30 m) day- and night-time thermal-infrared data may be used to obtain detailed quanti- tative spatial information on the urban heat island effect (Lo et al., 1997). Some have used AVHRR thermal-infrared data for this application with mixed results (e.g., Roth et al., 1989).
Critical Environmental Area Assessment Urbanlsuburban environments often include very sensitive areas such as wetlands, endangered specie habitat, parks, land surrounding treatment plants, and the land in urbanized watersheds that provides the runoff for potable drinking wa- ter. Relatively stable sensitive environments only need to be monitored every 1 to 2 years using a multispectral remote sensor collecting 1- to 10-m data. For extremely critical areas that could change rapidly, multispectral remote sensors (in- cluding a thermal infrared band) should obtain < 0.25- to 2- m spatial resolution data every 1 to 6 months.
Disaster Emergency Response Recent floods (Mississippi River in 1993; Albany, Georgia in 1994), hurricanes (Hugo in 1989, Andrew in 1991, Fran in 1996), tornadoes (every year), fires, tanker spills, and earth- quakes (Northridge, California in 1994) demonstrated that a rectified, pre-disaster image database is indispensable. The pre-disaster data only need to be updated every 1 to 5 years. It should be high spatial resolution (1- to 5-m) multispectral data if possible.
When disaster strikes, high resolution (< 0.25- to 2-m) panchromatic and/or near-infrared data should be acquired within 1 2 hours to 2 days (e.g., Figure 6; Schweitzer and McLeod, 1997). If the terrain is shrouded in clouds, imaging radar might provide the most useful information. Post-disas- ter images are registered to the pre-disaster images, and man- ual and digital change detection takes place (Jensen, 1996). If precise, quantitative information about damaged housing stock, disrupted transportation arteries, the flow of spilled materials, and damage to above-ground utilities are required, it is advisable to acquire post-disaster < 0.25- to 1-m pan- chromatic and near-infrared data within 1 to 2 days (Jensen et al., 1998). Such information was indispensable in assess- ing damages and allocating scarce clean-up resources during Hurricane Hugo, Hurricane Andrew (Davis, 1993), Hurricane Fran (Wagman, 1997), and the recent Northridge earthquake.
Observations Table 1 and Figure 1 reveal that there are a number of re- mote sensing systems that currently provide some of the de- sired urban infrastructure and socio-economic information when the required spatial resolution is poorer than 4 by 4 m and the temporal resolution is between 1 and 55 days. How- ever, very high spatial resolution data (< 1 by 1 m) is re- quired to satisfy several of the data requirements. In fact, as shown in Figure 1, the only sensor that currently provides such data on-demand is aerial photography (5 0.25 to 0.5 m). E O S A T / ~ ~ ~ C ~ Imaging lKONOS (1999) with its 1- by 1-m pan- chromatic data, OrbView 3 (1999) with its 1- by 1-m pan- chromatic data, and Earthwatch Quickbird with its 0.8- by 0.8-m panchromatic data (2000) may satisfy some of these urban data requirements, but not all. It may be necessary to develop higher spatial resolution (< 0.25- to 0.5-m) satellite remote sensor data to provide some of the detailed urban/ suburban infrastructure and socio-economic information, or utilize aerial photography. None of the sensors can provide the 5- to 60-minute temporal resolution necessary for traffic and parking studies except for (1) repetitive aerial photogra- phy (very costly), or (2) the placement of digital or video
620 May 1 9 9 9 PHOTOGRAMMETRE ENGINEERING & REMOTE SENSING

cameras on the top edge of buildings to obtain an oblique view. The GOES satellite constellation (east and west) and the European Meteosat provide sufficient national and regional weather information at reasonable temporal resolution (3 to 25 minutes) and spatial resolutions (1 to 8 km and 2.5 to 5 km, respectively). Ground-based National Weather Service Weather Surveillance Radar provides sufficient spatial reso- lution (1 by lo) and temporal resolution (5 to 10 minutes) for precipitation and intense storm tracking in urban environ- ments.
References American Planning Association, 1998. Land-Based Classification
Standards: Dmft Classification, American Planning Association Research Department, http://www.planning,org/lbcs.
Anderson, J.R., E. Hardy, J. Roach, and R. Witmer, 1976. A Land Use and Land Cover Classification System for Use with Remote Sen- sor Data, USGS Professional Paper #964, Washington, D.C., 28 - P.
Angelici, G.L., N.A. Bryant, R.K. Fretz, and S.Z. Friedman, 1980. Ur- ban Solar Photovoltaics Potential: An Inventory and Modeling Study Applied to the San Fernando Valley Region of Los Ange- les, JPL Report #80-43, Pasadena, California, JPL, 55 p.
Avery, T.E., and G.L. Berlin, 1993. Fundamentals of Remote Sensing and Airphoto Interpretation, Macmillan, New York, pp. 377- 404.
Barnell, B., 1998. ArcView 3D Analyst Used in Virtual Reality Mod- els, ARC News, 20(2):1-3.
Branch, M.C., 1971. City Planning and Aerial Information, Harvard University Press, Cambridge, Massachusetts, 283 p.
Bureau of the Budget, 1987. Standard Industrial Classification Man- ual, Government Printing Office, Washington, D.C.
Chisnell, T.C., and G.E. Cole, 1958. Industrial Components - A Photo Interpretation Key on Industry, Photogmmmetric Engineering, 24:590-602.
Clayton, C., and J.E. Estes, 1979. Distributed Parameter Modeling of Urban Residential Energy Demand, Photogrammetric Engineer- ing & Remote Sensing, 45:106-115.
Colcord, J.E., 1981. Thermal Imagery Energy Surveys, Photogmmmet- ric Engineering b Remote Sensing, 47:237-240.
Cowen, D.J., and J.R. Jensen, 1998. Extraction and Modeling of Ur- ban Attributes Using Remote Sensing Technology, People and Pixels: Linking Remote Sensing and Social Science, National Academy Press, Washington, D.C., pp. 164-188.
Cowen, D.J., J.R. Jensen, G. Bresnahan, D. Ehler, D. Traves, X. Huang, C. Weisner, and H.E. Mackey, 1995. The Design and Im- plementation of an Integrated GIs for Environmental Applica- tions, Photogmmmetric Engineering 6 Remote Sensing, 61:1393- 1404.
C m , T.D., and R.L. Alberty, 1993. The WSR-88D and the WSR-88D Operational Support Facility, Bulletin of the American Meteoro- logical Society, 74(9):1669-1687.
Cullingworth, B., 1997. Planning in the USA: Policies, Issues and Processes, Routledge, London, 280 p.
Curry, M.R., 1997. The Digital Individual and the Private Realm, An- nals of the Association of American Geographers, 87(4):681-699.
Davis, B.A., 1993. Mission Accomplished, NASA Tech Briefs, 17(1): 14-16.
Eliasson, I., 1992. Infrared Themography and Urban Temperature Patterns, International Journal of Remote Sensing, 13:869-879.
Elvidge, C.D., K.E. Baugh, E.A. Kihn, H.W. Kroehl, and E.R. Davis, 1997. Mapping City Lights with Nighttime Data from the DMSP Operational Linescan System, Photogmmmetric Engineering 6. Remote Sensing, 63:727-734.
Feldman, S.C., R.E. Pelletier, E. Walser, J.R. Smoot, and D. Ahl, 1995. A Prototype for Pipeline Routing Using Remotely Sensed Data and Geographic Information System Analysis, Remote Sensing of Environment, 53:123-131.
FGDC, 1997a. Fmmework: Introduction and Guide, Federal Geo- graphic Data Committee, Washington, D.C., 105 p.
PHOTOGRAMMETRIC ENGINEERING & REMOTE SENSING
, 1997b, Dmft Geospatial Positioning Accuracy Standards, Federal Geographic Data Committee, Washington, D.C., 32 p.
Ford, K., 1979. Remote Sensing for Planners, State Univ. of New Jer- sey, Rutgers, 219 p.
Forester, B.C., 1985. An Examination of Some Problems and Solu- tions in Monitoring Urban Areas from Satellite Platforms, Inter- national Journal of Remote Sensing, 6:139-151.
Green, K., D. Kempka, and L. Lackey, 1994. Using Remote Sensing to Detect and Monitor Land-Cover and Land-Use Change, Photo- gmmmetric Engineering b Remote Sensing, 60:331-337.
~ r e e i , N.E., 1957. Aerial ~hotogra~hic Interpretation and Social Structure of the City, Photogmmmetric Engineering, 23:89-96.
Greve, C.W., 1996. Digital Photogmmmetry: An Addendum to the Manual of Photogmmmetry, American Society for Photogramme- try & Remote Sensing, Bethesda, Maryland, 247 p.
Gugan, D.J., and I.J. Dowman, 1988. Topographic Mapping from SPOT Imagery, Photogmmmetric Engineering 6 Remote Sensing, 54:1409-1404.
Haack, B., S. Guptill, R. Holz, S. Jampoler, J. Jensen, and R. Welch, 1997. Chapter 15: Urban Andvsis and Planning, Manual of Pho- tographic ?nterpretation, American Society for Fhotogra&etry & Remote Sensing, Bethesda, Maryland, pp. 517-553.
Henderson, F.M., and J.J. Utano, 1975. Assessing General Urban So- cioeconomic Conditions with Conventional Air Photography, Photogmmmetria, 31:81-89.
Holz, R.K., 1988. Population Estimation of Colonias in the Lower Rio Grande Valley Using Remote Sensing Techniques, paper pre- sented at the Annual Meeting of the Association of American Geographers, Phoenix, Arizona.
Hothem, D., J.M. Irvine, E. Mohr, and K.B. Buckely, 1996. Quantify- ing Image Interpretability for Civil Users, Proceedings, ASPRS/ ACSM Annual Convention, American Society fur Photogramme- try and Remote Sensing, Bethesda, Maryland, pp. 292-298.
Jadkowski, M.A., P. Convery, R.J. Birk, and S. Kuo, 1994. Aerial Im- age Databases for Pipeline Rights-of-way Management, Photo- gmmmetric Engineering 6 Remote Sensing, 60:347-353.
Jensen, J.R. (editor), 1983. Urban/Suburban Land Use Analysis, Man- ual of Remote Sensing, Second Edition (R.N. Colwell, editor), American Society of Photogrammetry, Falls Church, Virginia, pp. 1571-1666.
, 1995. Issues Involving the Creation of Digital Elevation Mod- els and Terrain Corrected Orthoimagery Using Soft-Copy Photo- grammetry, Geocarto International, 10:l-17.
, 1996. Introductory Digital Image Processing: A Remote Sens- ing Perspective, Prentice-Hall, Saddle River, New Jersey, 318 p.
Jensen, J.R., and D.L. Toll, 1983. Detecting Residential Land-Use De- velopment at the Urban Fringe, Photogmmmetric Engineering 6 Remote Sensing, 48:629-643.
Jensen, J.R., and D.C. Cowen, 1997. Remote Sensing of UrbanlSubur- ban Socio-economic Attributes, Proceedings Land Satellite Infor- mation in the Next Decade II, American Society for Photogram- metry & Remote Sensing, Bethesda, Maryland, Compact Disk, 19 P-
Jensen, J.R., D.C. Cowen, J. Halls, S. Narumalani, N. Schmidt, B.A. Davis, and B. Burgess, 1994. Improved Urban Jnfrastructure Mapping and Forecasting for BellSouth Using Remote Sensing and GIs Technology, Photogrammetric Engineering 6 Remote Sensing, 60:339-346.
Jensen, J.R., X. Huang, D. Graves, and R. Hanning, 1996. Cellular Phone Transceiver Site Selection, Raster Imagery in Geogmphic Information Systems (S. Morain and S. Baros, editors], OnWard Press, Santa Fe, New Mexico, pp. 117-125.
Jensen, J.R., J. Halls, and J. Michel, 1998. A Systems Approach to Environmental Sensitivity Index (ESI) Mapping for Oil Spill Contingency Planning and Response, Photogmmmetric Engineer- ing b Remote Sensing, 64(10):1003-1014.
Kidder, S.Q., and T.H.V. Haw, 1995. Satellite Meteorology, Aca- demic Press, New York, pp. 87-144.
Lacy, R., 1992. South Carolina Finds Economical Way to Update Digital Road Data, GIS World, 5:58-60.
Lavrov, V.N., 1997. Space Survey Photocameras for Cartographic Purposes, Proceedings, Fourth International Conference on Re-
M a y 1999 621

mote Sensing for Marine and Coastal Environments, ERIM, Lan- sing, Michigan, 7 p.
~eachteiauer, J.c., 1996. National Imagery Interpretability Rating Scales Overview and Product Description, Proceedinrrs. ASPRS- ACSM Annual Convention, Americ& society for ~hltogramme- try and Remote Sensing, Bethesda, Maryland, 1:262-272.
Leachtenauer, J.C., K. Daniel, and T. Vogl, 1998. Digitizing Satellite Imagery: Quality and Cost Considerations, Photogrammetric En- gineering & Remote Sensing, 64:2%-34.
Leberl, F.W., 1990. Radargrammetric Image Processing, Artech House, Norwood, 595 p.
Light, D.L., 1993. The National Aerial Photography Program as a Ge- ographic Information System Resource, Photogmmmetric Engi- neering 6 Remote Sensing, 59(1):61-65.
-, 1996. Film Cameras or Digital Sensors? The Challenge Ahead for Aerial Imaging, Photogrammetric Engineering b Remote Sensing, 62(3):285-291.
Lindgren, D.T., 1985. Land Use Planning and Remote Sensing, Mar- tinus Nijhoff Inc., Boston, 230 p.
Lo, C.P., 1986. The Human Population, Applied Remote Sensing, Longman, New York, pp. 40-70.
-, 1995. Automated Population and Dwelling Unit Estimation from High-Resolution Satellite Images: A GIS Approach, Interna- tional Journal of Remote Sensing, 16:17-34.
Lo, C.P., and B.J. Faber, 1998. Interpretation of Landsat Thematic Mapper and Census Data for Quality of Life Assessment, Remote Sensing of Environment, in press.
Lo, C.P., D.A. Quattrochi, and J.C. Luvall, 1997. Application of High- resolution Thermal Infrared Remote Sensing and GIS to Assess the Urban Heat Island Effect, International Journal of Remote Sensing, 18(2):287-304.
Logicon, 1995. Multispectml Users Guide, Logicon Geodynamics, Fairfax, Virginia, 102 p.
-, 1997. Multispectml Imagery Reference Guide, Logicon Geo- dynamics, Fairfax, Virginia, 100 p.
McCoy, R.M., and E.D. Metivier, 1973. House Density vs. Socioeco- nomic Conditions, Photogmmmetric Engineering, 39:43-49.
Mintzer, 0. W. (editor), 1983. Engineering Applications, Manual of Remote Sensine. Second Edition [R.N. Colwell. editor). Ameri- can Society of ~hotogrammetry, Falls Church, Virginia, pp. 1955-2109.
Monier, R.B., and N.E. Green, 1953. Preliminary Findings on the De- velopment of Criteria for the Identification of Urban Structures from Aerial Photographs, Annals of the Association of American Geographers, special issue.
Montesano, A.P., 1997. Roadrnap to the Future, Earth Observation Magazine, 6:16-19.
NRC, 1995. A Data Foundation for the National Spatial Data Infra- structure, Mapping Science Committee, National Research Coun- cil, Washington, D.C., 55 p.
Olorunfemi, J.F., 1984. Land Use and Population: A Linking Model, Photogmmmetric Engineering b Remote Sensing, 50:221-22 7.
Onsrud, H.J., J.P. Johnson, and X.R. Lopez, 1994. Protecting Personal Privacy in Using Geographic Information Systems, Photogmm- metric Engineering b Remote Sensing, 60(9):1083-1095.
Petrie, G., and T.J.M. Kennie, 1990. Terrain Modeling in Surveying and Civil Engineering, Whittles Publishing, London, 351 p.
Philipson, W., 1997. Manual of Photographic Interpretation, Ameri- can Society for Photogrammetry & Remote Sensing, Bethesda, Maryland, 830 p.
Pike, J., 1998. Space Policy Project of the Fedemtion of American Scientists, Federation of American Scientists, Washington, D.C., http://www.fas.org/irp/imint/niirs.htm.
Ridley, H.M., P.M. Atkinson, P. Aplin, J. Muller, and I. Dowrnan, 1998. Evaluating the Potential of the Forthcoming Commercial U.S. High-Resolution Satellite Sensor Imagery at the Ordnance Survey, Photogmmmetric Engineering b Remote Sensing, 63(8): 997-1005.
Roth, M., T.R. Oke, and W.J. Emery, 1989. Satellite-derived Urban Heat Islands from Three Coastal Cities and the Utilization of Such Data in Urban Climatology, International Journal of Re- mote Sensing, 10(11):1699-1720.
Schultz, G.A., 1988. Remote Sensing in Hydrology, Journal of Hy- drology, 100:239-265.
Schweitzer, B., and B. McLeod, 1997. Marketing Technology that is Changing at the Speed of Light, Earth Observation Magazine, 6: 22-24.
Skole, D.L., 1994. Data on Global Land-Cover Change: Acquisition, Assessment, and Analysis, Changes in Land Use and Land Cover: A Global Perspective (W.B. Meyer and B.L. Turner, edi- tors), Cambridge University Press, Cambridge, pp. 437472.
Slonecker, E.T., D.M. Shaw, and T.M. Lillesand, 1998. Emerging Le- gal and Ethical Issues in Advanced Remote Sensing Technology, Photogmmmetric Engineering 6 Remote Sensing, 64(6):589-595.
Stone, K.H., 1964. A Guide to the Interpretation and Analysis of Aer- ial Photos, Annals of the Association of American Geographers, 54:318-328.
Stoney, W.E., and J.R. Hughes, 1998. A New Space Race is On! GIS World, 11(3):4446.
Stoeckleler, E.G., 1979. Use of Aerial Color Photography for Pave- ment Evaluation Studies, Highway Research Record, 319:40-57.
Sutton, P., D. Roberts, C. Elvidge, and H. Meij, 1997. A Comparison of Nighttime Satellite Imagery and Population Density for the Continental United States, Photogmmmetric Engineering 6 Re- mote Sensing, 63:1303-1313.
Swerdlow, J.L., 1998. Making Sense of the Millennium, National Geogmphic, 193:2-33.
Tobler, W., 1969. Satellite Confirmation of Settlement Size Coeffi- cients, Area, 1:30-34.
Tuyahov, A.J., C.S. Davies, and R.K. Holz, 1973. Detection of Urban Blight Using Remote Sensing Techniques, Remote Sensing of Earth Resources, 2:213-226.
Urban Renewal Administration Department of Commerce, 1965. Standard Land Use Coding Manual: A. Standard System for Identifying and Coding Land Use Activities, Government Print- ing Office, Washington, D.C.
Wolff, R.S., and L. Yaeger, 1993. Visualization of Natuml Phenom- ena, Springer-Verlag, Santa Clara, 374 p.
Wagman, D., 1997. Fires, Hurricanes Prove No Match for GIS, Earth Observation Magazine, 6:2 7-29.
Warner, W.S., R.W. Graham, and R.E. Read, 1996. Chapter 15: Urban Survey, Small Format Aerial Photogmphy, Wittles Publishing, Scotland, pp. 253-256.
Welch, R., 1980. Monitoring Urban Population and Energy Utiliza- tion Patterns from Satellite Data, Remote Sensing of Environ- ment, 9:l-9.
-, 1982. Spatial Resolution Requirements for Urban Studies. In- ternational Journal of Remote Sensing, 3:139-146.
(Received 03 March 1998; accepted 29 April 1998; revised 13 August 1998)
622 May 1999 PHOTOGRAMMETRIC ENGINEERING & REMOTE SENSING