Embed Size (px)
Citation preview
Remote Sensing of Environment xxx (2015) xxx–xxx
RSE-09531; No of Pages 11
Contents lists available at ScienceDirect
Remote Sensing of Environment
j ourna l homepage: www.e lsev ie r .com/ locate / rse
Active fire detection using Landsat-8/OLI data
Wilfrid Schroeder a,⁎, Patricia Oliva a, Louis Giglio a, Brad Quayle b, Eckehard Lorenz c, Fabiano Morelli d
a Department of Geographical Sciences, University of Maryland, College Park, MD, USAb USDA Forest Service Remote Sensing Applications Center, Salt Lake City, UT, USAc Institute of Optical Sensor Systems, German Aerospace Center, Berlin, Germanyd Brazilian Institute for Space Research, São José dos Campos, Brazil
⁎ Corresponding author at: Department of GeograMaryland, 2181 LeFrak Hall, College Park, MD 20742, USA
E-mail address: [email protected] (W. Schroeder).
http://dx.doi.org/10.1016/j.rse.2015.08.0320034-4257/© 2015 The Authors. Published by Elsevier Inc
Please cite this article as: Schroeder, W., etdx.doi.org/10.1016/j.rse.2015.08.032
a b s t r a c t
a r t i c l e i n f oArticle history:Received 6 April 2015Received in revised form 10 August 2015Accepted 31 August 2015Available online xxxx
The gradual increase in Landsat-class data availability creates newopportunities forfire science andmanagementapplications that require higher-fidelity information about biomass burning, improving upon existing coarserspatial resolution (≥1 km) satellite active fire data sets. Targeting those enhanced capabilities we describe anactive fire detection algorithm for use with Landsat-8 Operational Land Imager (OLI) daytime and nighttimedata. The approach builds on the fire-sensitive short-wave infrared channel 7 complemented by visible andnear-infrared channel 1–6 data (daytime only), while also expanding on the use of multi-temporal analysis toimprove pixel classification results. Despite frequent saturation of OLI's fire-affected pixels, which includes radio-metric artifacts resulting from folding of digital numbers, our initial assessment based on visual image analysisindicated high algorithm fidelity across a wide range of biomass burning scenarios, gas flares and activevolcanoes. Additional field data verification confirmed the sensor's and algorithm's ability to resolve fires ofsignificantly small areas compared to current operational satellite fire products. Commission errors were greatlyreduced with the addition of multi-temporal analysis tests applied to co-located pixels, averaging less than 0.2%globally. Because of its overall quality, Landsat-8/OLI active fire data could become part of a network of emergingearth observation systemsproviding enhanced spatial and temporal coverage of biomass burning at global scales.
© 2015 The Authors. Published by Elsevier Inc. This is an open access article under the CC BY-NC-ND license(http://creativecommons.org/licenses/by-nc-nd/4.0/).
1. Introduction
Each year hundreds of thousands of biomass burning related firesare detected globally using spaceborne remote sensing data (Dwyer,Pinnock, Grégoire, & Pereira, 2000; Giglio, Csiszar, & Justice, 2006;Ichoku, Giglio, Wooster, & Remer, 2008). Satellite-detected thermal-anomalies are predominantly associated with land use practices(maintenance and conversion fires), wildfires ignited by lightning orhuman causes and other natural occurring phenomena or processes(e.g., volcanic activity, etc.). Industrial heat sources can also be detected(Bowman et al., 2009; Schroeder et al., 2008b). Biomass burning effectscan be observed across local to global scales, impacting soil chemistry,surface runoff, land surface heat and energy balances, and air quality,among others (Larsen et al., 2009; Liu, Randerson, Lindfors, & Chapin,2005; Wiedinmyer et al., 2006). Negative ecological effects may resultfrom biomass burning in non-fire-adapted vegetation or as a conse-quence of altered fire regimes (e.g., encroachment of invasive speciesand changes to stand structure), whereas positive effects are typically
phical Sciences, University of.
. This is an open access article under
al., Active fire detection usin
observed in fire-adapted biomes that benefit from nutrient cycling andseeding (Freeman et al., 2007; Higgins et al., 2007; Oliveras et al.,2012). In areas such as the western United States, southern Australia,and the Iberian Peninsula, large wildfires occurring along the wildland-urban interface pose risks to both life and property and are cause ofmajor socioeconomic concern (Mell, Manzello, Maranghides, Butry, &Rehm, 2010). Management efforts associated with those events typicallyinvolve large investments in fuel treatments, community response plan-ning, active firemapping and suppression, and post-fire stabilization andrestoration (Schoennagel, Nelson, Theobald, Carnwath, & Chapman,2009).
For more than a decade, satellite remote-sensing active fire datahave been extensively used to inform fire management systems(Davies, Ilavajhala, Wong, & Justice, 2009). Similarly, numerous air-quality and carbon emissions mapping methodologies have benefitedfrom point source information provided by satellite active fire detectionand characterization data sets (Ichoku & Kaufman, 2005; Kaiser et al.,2012; van der Werf et al., 2010; Vermote et al., 2009). Other related ac-tive fire data applications include assessment of fire-affected areas andseeding of burned area algorithms (Giglio, Loboda, Roy, Quayle, &Justice, 2009; Hantson, Padilla, Corti, & Chuvieco, 2013; Loboda, O'Neal& Csizar 2007; Kasischke, Hewson, Stocks, van der Werf, & Randerson,2003; Oliva & Schroeder, 2015), fire growth and spread rate analyses
the CC BY-NC-ND license (http://creativecommons.org/licenses/by-nc-nd/4.0/).
g Landsat-8/OLI data, Remote Sensing of Environment (2015), http://
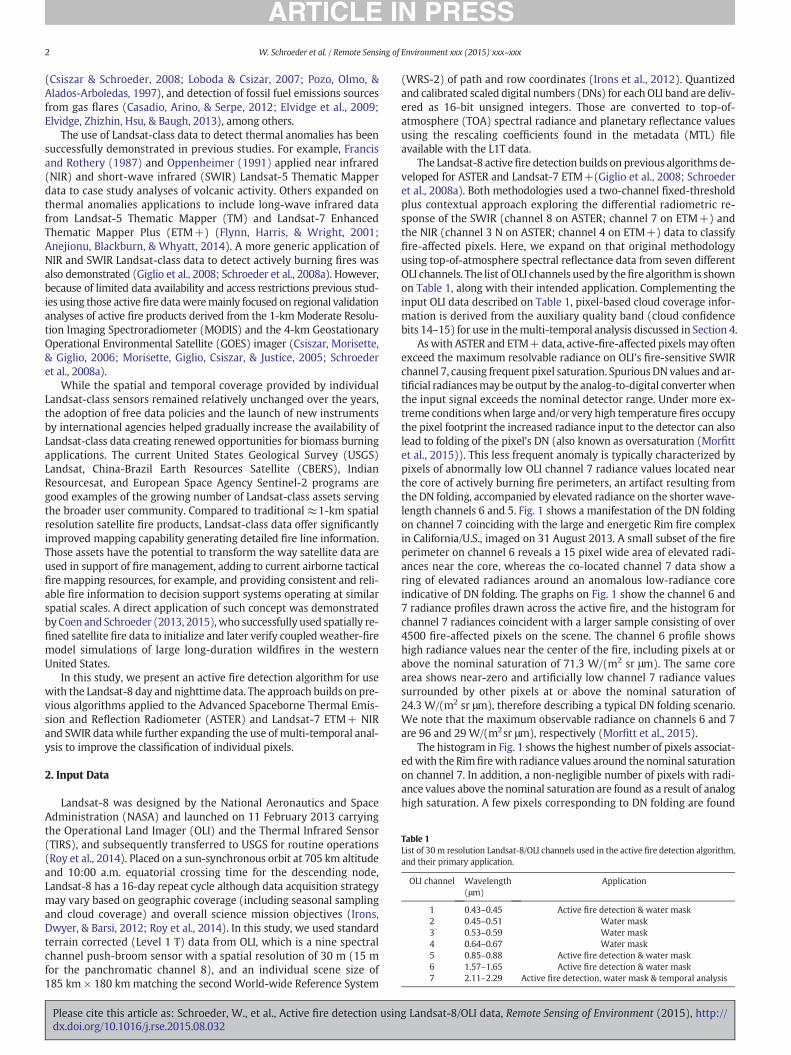
Table 1List of 30m resolution Landsat-8/OLI channels used in the active fire detection algorithm,and their primary application.
OLI channel Wavelength(μm)
Application
1 0.43–0.45 Active fire detection & water mask2 0.45–0.51 Water mask3 0.53–0.59 Water mask4 0.64–0.67 Water mask5 0.85–0.88 Active fire detection & water mask6 1.57–1.65 Active fire detection & water mask7 2.11–2.29 Active fire detection, water mask & temporal analysis
2 W. Schroeder et al. / Remote Sensing of Environment xxx (2015) xxx–xxx
(Csiszar & Schroeder, 2008; Loboda & Csizar, 2007; Pozo, Olmo, &Alados-Arboledas, 1997), and detection of fossil fuel emissions sourcesfrom gas flares (Casadio, Arino, & Serpe, 2012; Elvidge et al., 2009;Elvidge, Zhizhin, Hsu, & Baugh, 2013), among others.
The use of Landsat-class data to detect thermal anomalies has beensuccessfully demonstrated in previous studies. For example, Francisand Rothery (1987) and Oppenheimer (1991) applied near infrared(NIR) and short-wave infrared (SWIR) Landsat-5 Thematic Mapperdata to case study analyses of volcanic activity. Others expanded onthermal anomalies applications to include long-wave infrared datafrom Landsat-5 Thematic Mapper (TM) and Landsat-7 EnhancedThematic Mapper Plus (ETM+) (Flynn, Harris, & Wright, 2001;Anejionu, Blackburn, & Whyatt, 2014). A more generic application ofNIR and SWIR Landsat-class data to detect actively burning fires wasalso demonstrated (Giglio et al., 2008; Schroeder et al., 2008a). However,because of limited data availability and access restrictions previous stud-ies using those active fire dataweremainly focused on regional validationanalyses of active fire products derived from the 1-kmModerate Resolu-tion Imaging Spectroradiometer (MODIS) and the 4-km GeostationaryOperational Environmental Satellite (GOES) imager (Csiszar, Morisette,& Giglio, 2006; Morisette, Giglio, Csiszar, & Justice, 2005; Schroederet al., 2008a).
While the spatial and temporal coverage provided by individualLandsat-class sensors remained relatively unchanged over the years,the adoption of free data policies and the launch of new instrumentsby international agencies helped gradually increase the availability ofLandsat-class data creating renewed opportunities for biomass burningapplications. The current United States Geological Survey (USGS)Landsat, China-Brazil Earth Resources Satellite (CBERS), IndianResourcesat, and European Space Agency Sentinel-2 programs aregood examples of the growing number of Landsat-class assets servingthe broader user community. Compared to traditional ≈1-km spatialresolution satellite fire products, Landsat-class data offer significantlyimproved mapping capability generating detailed fire line information.Those assets have the potential to transform the way satellite data areused in support of fire management, adding to current airborne tacticalfire mapping resources, for example, and providing consistent and reli-able fire information to decision support systems operating at similarspatial scales. A direct application of such concept was demonstratedbyCoen and Schroeder (2013, 2015), who successfully used spatially re-fined satellite fire data to initialize and later verify coupled weather-firemodel simulations of large long-duration wildfires in the westernUnited States.
In this study, we present an active fire detection algorithm for usewith the Landsat-8 day and nighttime data. The approach builds on pre-vious algorithms applied to the Advanced Spaceborne Thermal Emis-sion and Reflection Radiometer (ASTER) and Landsat-7 ETM+ NIRand SWIR data while further expanding the use of multi-temporal anal-ysis to improve the classification of individual pixels.
2. Input Data
Landsat-8 was designed by the National Aeronautics and SpaceAdministration (NASA) and launched on 11 February 2013 carryingthe Operational Land Imager (OLI) and the Thermal Infrared Sensor(TIRS), and subsequently transferred to USGS for routine operations(Roy et al., 2014). Placed on a sun-synchronous orbit at 705 km altitudeand 10:00 a.m. equatorial crossing time for the descending node,Landsat-8 has a 16-day repeat cycle although data acquisition strategymay vary based on geographic coverage (including seasonal samplingand cloud coverage) and overall science mission objectives (Irons,Dwyer, & Barsi, 2012; Roy et al., 2014). In this study, we used standardterrain corrected (Level 1 T) data from OLI, which is a nine spectralchannel push-broom sensor with a spatial resolution of 30 m (15 mfor the panchromatic channel 8), and an individual scene size of185 km × 180 kmmatching the second World-wide Reference System
Please cite this article as: Schroeder, W., et al., Active fire detection usindx.doi.org/10.1016/j.rse.2015.08.032
(WRS-2) of path and row coordinates (Irons et al., 2012). Quantizedand calibrated scaled digital numbers (DNs) for each OLI band are deliv-ered as 16-bit unsigned integers. Those are converted to top-of-atmosphere (TOA) spectral radiance and planetary reflectance valuesusing the rescaling coefficients found in the metadata (MTL) fileavailable with the L1T data.
The Landsat-8 activefire detection builds on previous algorithmsde-veloped for ASTER and Landsat-7 ETM+(Giglio et al., 2008; Schroederet al., 2008a). Both methodologies used a two-channel fixed-thresholdplus contextual approach exploring the differential radiometric re-sponse of the SWIR (channel 8 on ASTER; channel 7 on ETM+) andthe NIR (channel 3 N on ASTER; channel 4 on ETM+) data to classifyfire-affected pixels. Here, we expand on that original methodologyusing top-of-atmosphere spectral reflectance data from seven differentOLI channels. The list of OLI channels usedby thefire algorithm is shownon Table 1, along with their intended application. Complementing theinput OLI data described on Table 1, pixel-based cloud coverage infor-mation is derived from the auxiliary quality band (cloud confidencebits 14–15) for use in themulti-temporal analysis discussed in Section 4.
As with ASTER and ETM+data, active-fire-affected pixelsmay oftenexceed the maximum resolvable radiance on OLI's fire-sensitive SWIRchannel 7, causing frequent pixel saturation. Spurious DN values and ar-tificial radiancesmay be output by the analog-to-digital converterwhenthe input signal exceeds the nominal detector range. Under more ex-treme conditionswhen large and/or very high temperature fires occupythe pixel footprint the increased radiance input to the detector can alsolead to folding of the pixel's DN (also known as oversaturation (Morfittet al., 2015)). This less frequent anomaly is typically characterized bypixels of abnormally low OLI channel 7 radiance values located nearthe core of actively burning fire perimeters, an artifact resulting fromthe DN folding, accompanied by elevated radiance on the shorter wave-length channels 6 and 5. Fig. 1 shows a manifestation of the DN foldingon channel 7 coinciding with the large and energetic Rim fire complexin California/U.S., imaged on 31 August 2013. A small subset of the fireperimeter on channel 6 reveals a 15 pixel wide area of elevated radi-ances near the core, whereas the co-located channel 7 data show aring of elevated radiances around an anomalous low-radiance coreindicative of DN folding. The graphs on Fig. 1 show the channel 6 and7 radiance profiles drawn across the active fire, and the histogram forchannel 7 radiances coincident with a larger sample consisting of over4500 fire-affected pixels on the scene. The channel 6 profile showshigh radiance values near the center of the fire, including pixels at orabove the nominal saturation of 71.3 W/(m2 sr μm). The same corearea shows near-zero and artificially low channel 7 radiance valuessurrounded by other pixels at or above the nominal saturation of24.3 W/(m2 sr μm), therefore describing a typical DN folding scenario.We note that the maximum observable radiance on channels 6 and 7are 96 and 29 W/(m2sr μm), respectively (Morfitt et al., 2015).
The histogram in Fig. 1 shows the highest number of pixels associat-edwith the Rimfirewith radiance values around the nominal saturationon channel 7. In addition, a non-negligible number of pixels with radi-ance values above the nominal saturation are found as a result of analoghigh saturation. A few pixels corresponding to DN folding are found
g Landsat-8/OLI data, Remote Sensing of Environment (2015), http://

Fig. 1. Landsat-8/OLI channel 6 (top-left) and 7 (top-center) image subsets acquired on 31August 2013 over the Rimfire in California/U.S (37.760°N119. 965°W; path/row43/34). The lowradiancefire core on channel 7 is indicative ofDN folding. The radiance profiles (bottom-left, bottom-right) correspond to thehorizontal line across each subset. The spurious drop in chan-nel 7 radiance is the result of DN folding; the same pixels show saturated radiances on channel 6. The histogram describing channel 7 radiances for all 4500 fire-affected pixels (marked inred) in the top-right image subset is shown on the bottom-right panel. The peak in the radiance distribution coincides with the nominal saturation radiance (24.3 W/(m2srμm)). Pixelsexceeding the nominal saturation are representative of analog high saturation. A small number of pixels describing DN folding can be found near the low end of the radiance range. Thesmall yellowbox in the top-right panel indicates the area subject toDN folding. (For interpretation of the references to color in this figure legend, the reader is referred to thewebversion ofthis article.)
3W. Schroeder et al. / Remote Sensing of Environment xxx (2015) xxx–xxx
near the low end of the radiance range on channel 7. While this partic-ular case describes characteristics associated with significant fire inten-sity for a major wildfire event, folding of OLI channel 7 DN can also beobserved over some large gas flares.
3. Active fire algorithm
The Landsat-8 active fire detection algorithm is divided into day andnighttime modules. Both detection modules are driven by the fire-sensitive SWIR channel 7 data, exploiting the emissive component offires in the 2.2 μm spectral window. During the daytime orbits the
Fig. 2. Geographic distribution of primary Landsat-8/OLI Level 1 T scenes u
Please cite this article as: Schroeder, W., et al., Active fire detection usindx.doi.org/10.1016/j.rse.2015.08.032
emissive fire component is mixed with the background, which is dom-inated by the reflected solar component. In order to separate those, weuse the NIR channel 5 data that are mostly unresponsive to fire-affectedpixels, though highly correlated to the SWIR channel data over fire-freesurfaces (Giglio et al., 2008). During night orbits the reflected solar com-ponent is absent from the scene, making the SWIR band particularly re-sponsive to the emitted radiance from active fires in an otherwise dullbackground. In both day and nighttime data, the radiometric signatureof active fires produces a SWIR radiance or reflectance anomaly whencompared to thebackground, therebymimicking the concept of thermalanomaly detection using mid-to-thermal infrared channels.
sed for training and validation of the active fire detection algorithm.
g Landsat-8/OLI data, Remote Sensing of Environment (2015), http://
4 W. Schroeder et al. / Remote Sensing of Environment xxx (2015) xxx–xxx
Fig. 2 shows the distribution of Landsat-8 scenes used to train andlater validate the fire algorithm output. Scene selection allowed sam-pling of a wide range of fire and observation conditions. Co-locatedscenes indicate areas where multi-temporal data acquisitions wereobtained, with training and validation data analyzed separately. Thetraining data were used to calibrate the algorithm and were basedprimarily on histogram analysis of single channel and dual-channel(e.g., band ratios and differencing) data supported by detailed super-vised pixel classification information. The latter was performed byexpert image analysts and corroborated by high spatial resolutionimagery (e.g., aerial photography and commercial satellite imageryavailable in Google Earth) and other remotely sensed fire products.These supporting data were used to validate fire activity identified bythe detection algorithm.
3.1. Daytime detection
The daytime algorithm uses input data from all seven OLI channelslisted in Table 1. The first test in thedaytimemodule is designed to iden-tify potentially unambiguous active fire pixels. It builds on the ETM+active fire algorithm (Schroeder et al., 2008a) while accommodatingsmall differences in OLI spectral channels, and is based on the followingcondition:
R75N2:5 AND ρ7−ρ5N0:3 AND ρ7N0:5f g ð1Þ
where ρi is the reflectance on channel i, and Rij is the ratio betweenchannel i and j reflectances (i.e.,ρi/ρj).
As described in Section 2, highly energetic and extensive fires canlead to folding of the DN on channel 7 thereby characterizing anothercondition of potentially unambiguous active fire pixel. Those unique oc-currences are flagged using:
ρ6N0:8 AND ρ1b0:2 AND ρ5N0:4 OR ρ7b0:1ð Þf g: ð2Þ
Complementing the identification of unambiguous fire pixels, thethresholds in test (1) are relaxed and other candidate fire pixels are se-lected for further analyses based on the following criteria:
R75N1:8 AND ρ7−ρ5N0:17f g: ð3Þ
All pixels satisfying test (3)must thenmeet the following set offixedthreshold and contextual tests in order to be classified as potential fire-affected pixels:
R75NR75 ̅þ max 3σR75 ;0:8� � ð4Þ
AND
ρ7Nρ7 ̅þ max 3σρ7;0:08
� � ð5Þ
AND
R76N1:6 ð6Þ
whereRij ̅ andσRij(ρ7 ̅ andσρ7
) are themean and standard deviationcalculated for the band ratio (channel 7 reflectance) using valid back-ground pixels from a 61 × 61 window centered on the candidatepixel. Valid pixels are defined as those showing channel 7 reflectancegreater than zero, excluding water and unambiguous fire pixels.Water pixels are classified based on spectral profiling using reflectancedata from all seven input channels. Two distinct tests are applied inorder to map oceans and inland water bodies according to:
ρ4Nρ5 AND ρ5Nρ6 AND ρ6Nρ7 AND ρ1−ρ7b0:2f g ð7Þ
Please cite this article as: Schroeder, W., et al., Active fire detection usindx.doi.org/10.1016/j.rse.2015.08.032
AND
f ρ3Nρ2ð Þ ð8Þ
OR
ρ1Nρ2 AND ρ2Nρ3 AND ρ3Nρ4ð Þg: ð9Þ
Tests (7 & 8) capture shallow and/or sediment-rich waters(e.g., Amazon rivermouth)whereas tests (7 & 9) are useful formappingdeep and/or dark water bodies. This water-masking scheme resulted inamore liberal classification compared to the available water confidencebits in the L1T quality band, allowingmorewater pixels to be flagged al-beit with some errors of commission. For example, tests (7 & 9) mayconfuse water bodies and cloud shadows and thereby affect the validbackground statistics, although such classification errors had no notice-able effect on the fire algorithm performance.
3.2. Nighttime detection
The absence of the reflected solar component from the nighttimescenes makes the classification of fire-affected pixels significantly lesschallenging. Here we use a single fixed-threshold test based on theSWIR channel 7 radiance data and similar to Giglio et al. (2008):
L7N1 W= m2 � sr � μm� � ð10Þ
Where L7 is the channel 7 radiance. We did not encounter evidenceof DN folding in the nighttime scenes analyzed.We recognize, however,that our assessmentwas limited by the reduced availability of nighttimescene acquisitions. Additional tests using channel 6 radiance data maybe required to properly handle DN folding in those data.
4. Multi-temporal analysis
The Level 1T OLI data have a geolocation error requirement of 12 m(Irons et al., 2012), greatly improving the co-location of surface featuresobserved on images acquired over multiple dates. Building on the en-hanced geolocation data, we designed a simple procedure to help refinethe fire algorithm output using co-located data derived from previousimages acquired no more than 176 days apart. This temporal constrainwas applied in order to minimize the effects of seasonal variationsthat could potentially alter the land surface conditions, while balancingcloud-free data availability.
The approach is based on direct verification of previously processedactive fire data for spatially-coincident and temporally-persistent firepixels. This simple test is based on the assumption that typical biomassburning fuels within a 30 m ground footprint are completely consumedwithinminutes, hours, or a fewdays of continuousflaming and/or smol-dering combustion. Therefore pixels classified as potential fire-affectedareas by the detection algorithm that overlap with one or more previ-ously detected fire pixels are assigned a persistent source class indicativeof temporally persisting detection. Such classification was found usefulto flag gas flares and other stationary urban heat sources (e.g., steelmills). Consequently, it can be used to differentiate between openvegetation fires and other types of combustion or heat sources. Addi-tionally, this test may flag potential daytime commission errors (falsealarms) associated with radiometrically bright urban features (e.g., hotand reflective factory rooftops) and other unique structures such assolar farms/photovoltaic stations, etc. We note that charcoal pits andrepeated piling of biomass for burning in designated areas may also beflagged as persistent sources as a result of this test.
Pixels output by the daytime fire algorithm without a co-locateddetection in the previous 176 days are further inspected to check forthe occurrence of high channel 7 reflectances persisting over time, anindication of potential false alarm. We used channel 7 for this test due
g Landsat-8/OLI data, Remote Sensing of Environment (2015), http://
5W. Schroeder et al. / Remote Sensing of Environment xxx (2015) xxx–xxx
to its strengths in separating vegetated and non-vegetated (e.g., baresoil) surfaces, and reduced contamination by smoke (Asner & Lobell,2000; Kaufman et al., 1997). The test assigns a bright surface class tothose pixels with ρ7;t N0:2, which describes the mean channel 7 reflec-tance calculated using t co-located cloud-free pixels in the previous176 days. This additional test is designed to flag pixels in areas dominat-ed by urban environment or exposed soils that, under specific illumina-tion conditions, can mimic the biomass-burning signature causing afalse alarm. Those targets may also be found in association with pixelsadjacent to persistent urban detections, where the increased distanceto the heat/high reflectivity source results in less frequentmanifestationof reflectance anomalies.
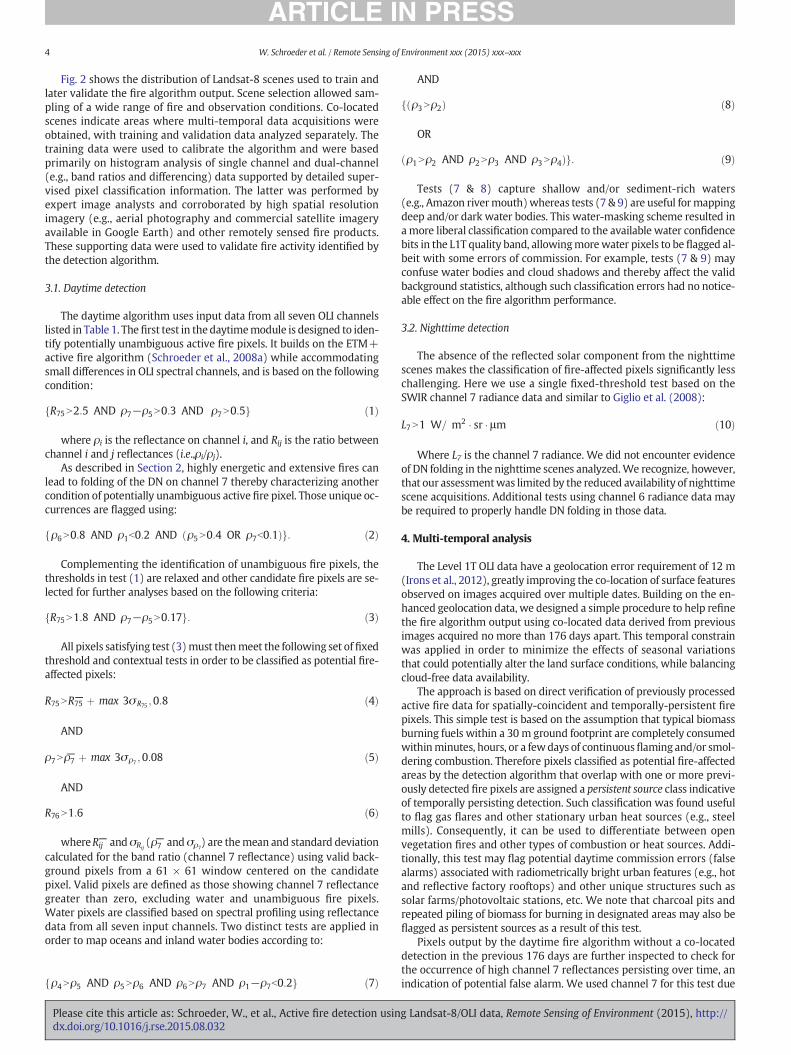
The application of the multi-temporal analysis component is dem-onstrated in Fig. 3, which shows an OLI image subset over easternChina (path/row 119/41). Potential false alarms associated with radio-metrically bright urban structures can be seen on the fire algorithmoutput. Detailed visual inspection of those locations revealed factoriesand other facilities consisting of large reflective rooftops and heat ex-hausts. Application of the complementary multi-temporal analysistests to those pixels resulted in successful re-classification of all pixellocations, setting them apart from actual biomass burning activity inneighboring rural areas.
5. Theoretical fire detection envelope
Satellite fire data users are fundamentally interested in the resolvingpower of new algorithms, in other words, what minimum fire size canbe typically detected? Effective quantification of satellite fire detectionperformance using ground truth data can be challenging due to lack ofadequate reference data and, most importantly, because of the highcosts involved. Alternatively, theoretical calculation of detection curvesas a function of fire size and temperature provides useful information toassess individual algorithms, and to compare between different fireproducts.
Here we calculated the fire algorithm's day and nighttime detectioncurves separately. The daytime fire detection curve calculation built on
Fig. 3. Subset of 07 August 2014 Landsat-8/OLI image of eastern China (path/row 119/41). Greshows pixels output by the fire algorithm; right panel shows the correspondingmulti-tempora(For interpretation of the references to color in this figure legend, the reader is referred to the
Please cite this article as: Schroeder, W., et al., Active fire detection usindx.doi.org/10.1016/j.rse.2015.08.032
the approach of Schroeder, Oliva, Giglio, and Csiszar (2014), whoassessed the performance of the Suomi National Polar-orbiting Partner-ship Visible Infrared ImagingRadiometer Suite (S-NPP/VIIRS) 375-mac-tive fire detection algorithm using actual data. We selected 12 differentOLI images acquired globally, each representing a distinct geographicarea at times coincidingwith their respective active fire seasons. Fire ac-tivity varied among individual scenes, ranging from as few as 79 pixels(Northern Territory/Australia) to a maximum of 6561 pixels (CentralSiberian Plateau/Russia). For each scene, a total of 25 pixels were select-ed across the entire domain. Pixel selection included areas adjacent toactive fires (simulating an extended fire line), clouds and water bodies,subject to smoke plumes, and across awide range of vegetated and non-vegetated areas (randomly sampled). Fires were then simulated onthose individual pixels by incorporating fire-emitted radiance to OLI'sprimary channels 5, 6, and 7. Simulated pixel radiances were convertedback to scaled DN, and then to reflectance using the correspondingMTLfile parameters. Atmospheric attenuation effects were estimated using aradiative transfer code (MODTRAN®) running on atmospheric profilesderived from the National Oceanic and Atmospheric Administration(NOAA) Global Forecast System (GFS) model analysis data for eachscene selected. Fire effective areas were varied between 1 and 150 m2
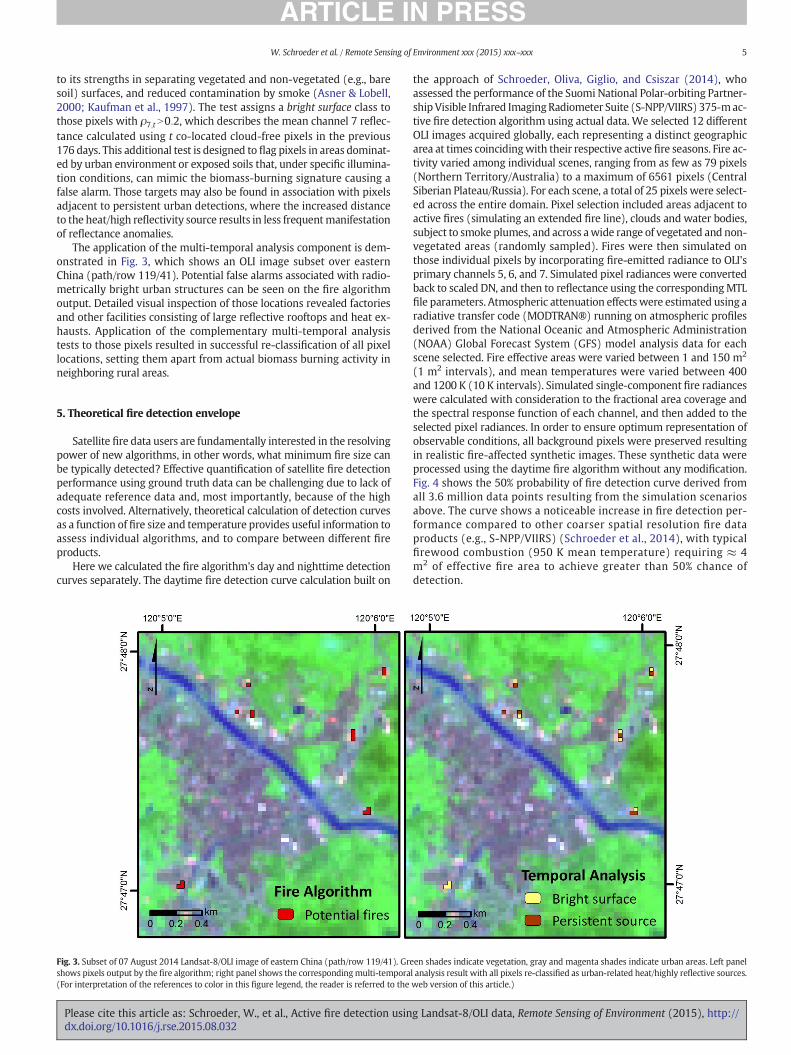
(1 m2 intervals), and mean temperatures were varied between 400and 1200 K (10 K intervals). Simulated single-component fire radianceswere calculated with consideration to the fractional area coverage andthe spectral response function of each channel, and then added to theselected pixel radiances. In order to ensure optimum representation ofobservable conditions, all background pixels were preserved resultingin realistic fire-affected synthetic images. These synthetic data wereprocessed using the daytime fire algorithm without any modification.Fig. 4 shows the 50% probability of fire detection curve derived fromall 3.6 million data points resulting from the simulation scenariosabove. The curve shows a noticeable increase in fire detection per-formance compared to other coarser spatial resolution fire dataproducts (e.g., S-NPP/VIIRS) (Schroeder et al., 2014), with typicalfirewood combustion (950 K mean temperature) requiring ≈ 4m2 of effective fire area to achieve greater than 50% chance ofdetection.
en shades indicate vegetation, gray and magenta shades indicate urban areas. Left panell analysis result with all pixels re-classified as urban-related heat/highly reflective sources.web version of this article.)
g Landsat-8/OLI data, Remote Sensing of Environment (2015), http://
Fig. 4. Theoretical probability offire detection calculated for the Landsat-8 algorithm. Day-time (D) curve describes the 50% probability of detection (solid line), bounded by 10%(bottom dotted line) and 90% (top dotted line) probability curves. The nighttime(N) curve describes the fire area and temperature combination resulting in OLI channel7 radiance greater than 1 W/(m2srμm).
6 W. Schroeder et al. / Remote Sensing of Environment xxx (2015) xxx–xxx
Our assessment of the nighttime probability of detection curve wasbased on a simplistic approach involving direct calculation of fire-emitted radiances from the same set of fire effective area and meantemperatures described above. We assumed a near-zero and invariantnighttime background radiance, which leaves the simulated fire-emitted radiance as the only potential source influencing the resultingpixel radiance. Similar to the daytime simulations, atmospheric attenu-ation effects were estimated using MODTRAN® assuming a U.S. stan-dard atmospheric profile. Fig. 4 shows the night curve describing thefire area and temperature combination leading to a channel 7 radianceof 1 W/(m2 sr μm), which would potentially allow for the fire pixeldetection. Compared to the daytime curve, nighttime data provideenhanced response to smaller fires of similar temperature favored bythe exclusion of the reflected solar component. For example, the sametypical firewood combustion burning at ≈950 K may be detectedwhen effective fire areas as small as 1 m2 are observed.
The data simulations above did not account for the occurrence of op-tically thin or thick clouds and smoke, or the pixel's spatial responsefunction. Therefore they describe a best-case scenario of fire detection,which may be subject to partial or complete degradation dependingon the prevailing observation conditions.
6. Algorithm Assessment
Initial algorithm assessment was based on visual inspection of theoutput fire pixel coordinates using publicly available data includinghigh spatial resolution imagery (e.g., aerial photography, high resolu-tion commercial satellite imagery in Google Earth). The fidelity of thefire detection data was qualitatively assessed by expert image analystsover a wide range of fire conditions, including large/unambiguous andwell-documented biomass burning (e.g., boreal fires in Canada, wildfiresinwesternU.S.), variable size landmanagementfires (e.g., grasslandfiresinAfrica, conversionfires in the Amazon, agriculturalfires in India), smallpoint sources associatedwith knowngasflare locations (e.g., gas frackingstations inNorthDakota/U.S., and oilfields in themiddle-east), and otherverifiable thermal anomalies such as active volcanoes.
The Landsat-8 fire algorithm performed well across the wide rangeof conditions described above. Fig. 5 shows the daytime fire detectionsproduced for the 2014 King fire in California/U.S., corroborated bysame-day fire detections derived from 1-km Terra and Aqua MODISThermal Anomalies (MOD14/MYD14), and 750 m and 375-m S-NPP/VIIRS active fire data (Csiszar et al., 2014; Giglio, Descloitres, Justice, &Kaufman, 2003; Schroeder et al., 2014). Those satellite images were ac-quired sequentially, averaging 1-h separation between consecutive over-passes. Overall, the different products showed good correspondence
Please cite this article as: Schroeder, W., et al., Active fire detection usindx.doi.org/10.1016/j.rse.2015.08.032
both in terms of fire front location and extent. Notably though,Landsat-8 fire pixels provided a significantly more detailed mapping ofthe flaming front describing areas of continuous activity on both eastandwestflanks of thefire, plus isolated heat islands inside the perimeter.The formation of an optically thick pyrocumulus cloud at the northernsection (leading edge) of the fire perimeter had variable effects on thefire products as it evolved throughout the day. Other areas dominatedby relatively dry smoke showed no noticeable effect on the OLI SWIRreflectances and the corresponding fire detection performance (Supple-mentary material).
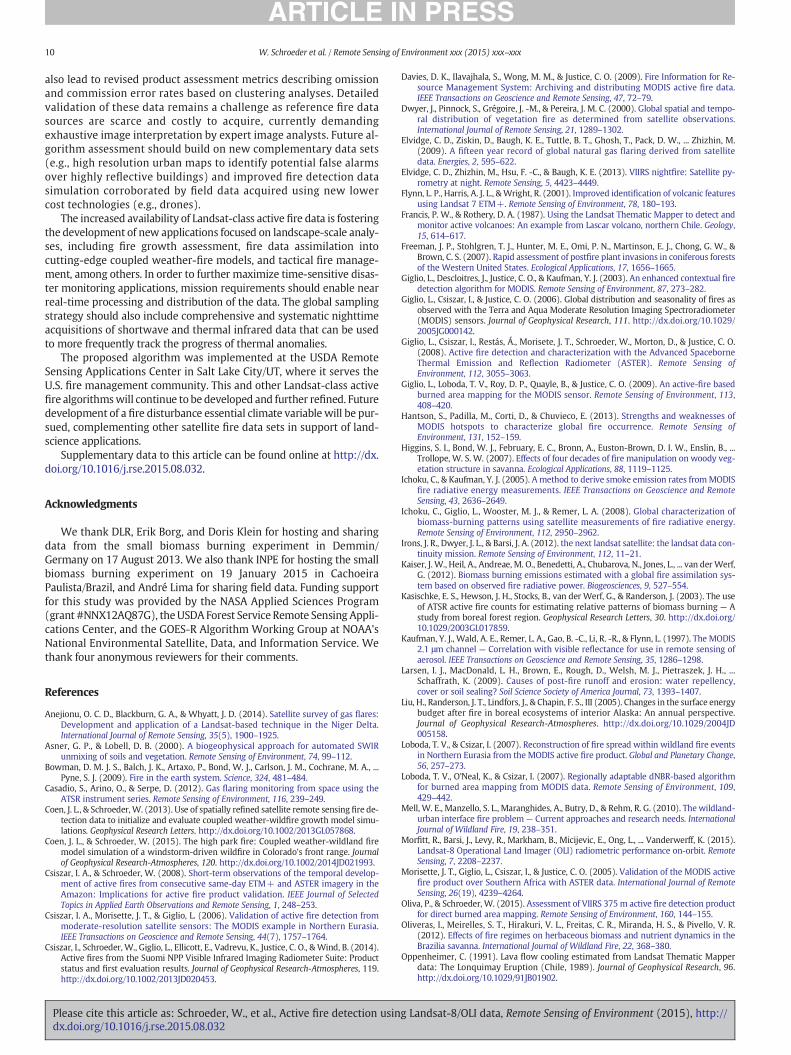
Quantitative daytime commission error rates of the algorithm wereestimated for 13 different locations showing very distinct levels of fireactivity (Table 2). Processing of individual scenes included the mainfire algorithm and the complementary multi-temporal analysis proce-dure described above. The number of usable scenes included in the tem-poral analysis was dependent on cloud coverage. Argentina and northIndia were particularly affected by cloud obscuration, with less thanfive of the eleven possible scenes acquired in the previous 176 daysshowing cloud-free data. Despite the smaller number of scenes usedin the multi-temporal analysis the algorithm was able to correctlyclassify active fires, persistent thermal sources, and bright pixels withzero or negligible commission error rate.
Six regions of markedly different fire characteristics showed a largenumber (N 1000) of pixels detected, namely South Africa, Australia,Brazil, Mexico, north India and Iraq. In South Africa and Australia, de-tected pixels described large wildfires on each scene. Forest conversionand pasturemaintenance fireswere found in Brazil, whereas agricultur-al fires dominated the scenes in Mexico and north India. The scene inIraq overlapped with oil fields containing numerous gas flare stations.
Application of the multi-temporal analysis tests to the locationsabove showing high land use related biomass burning activity andwild-fires resulted in almost no change in pixel classification. The relativelyfew cases of pixel re-classification were associated with surface coalmines (Africa), and with urban structures and scarce vegetation pixelsin other areas. In comparison, application of themulti-temporal analysistests to the scene in Iraq produced significant changes resulting insuccessful re-assignment of all gas flare pixels to the persistent sourceclass. Commission errors were negligible in all six regions.
The scene in China coincided with urbanized areas characterized bylarge factories with highly reflective rooftops. The fire algorithm outputindicated 179 pixels of potential fire activity. Of those, 153 were re-classified by the temporal analysis tests into either persistent source(50%) or bright surface (50%). Of the remaining pixels (26), nine werealso coincident with other factories and urban structures indicative ofpotential false alarms resulting in the highest relative false alarm rateof 34.6%. Indonesiawas the region showing the second highest commis-sion error rate. In that case, 65 pixels were output by the fire algorithmand only three were subsequently re-classified by the temporal analysistests. Of the 62 remaining pixels, 10 pixels were co-located with anindustrial park and therefore considered potential false alarms. Pixelsassociatedwith potential false alarms consisted predominantly of singledetections (52%) and small clusters of two adjacent detections (32%).The largest single cluster associated with potential false alarmshowed six contiguous pixels overlapping a large industrial complexin Indonesia. Overall, global daytime commission error rate wasequivalent to 0.2%.
Complementing the daytime fire algorithm assessment, Fig. 6 showsthe fire detections produced for the nighttime OLI image (path/row127/217 ascending node) acquired on 04 February 2014 over part ofNorth Dakota/U.S. Numerous gas fracking sites are evident in the highresolution image of that area, all characterized by small land clearings.By zooming into individual sites, we could co-locate all fire pixel detec-tions with discernable gas flare stacks on the reference imagery. Withthe exception of one undetected location with a channel 7 radiance of0.55 W/(m2 sr μm), other fracking sites in the image subset showedno discernible heat signatures from the background. We assumed the
g Landsat-8/OLI data, Remote Sensing of Environment (2015), http://
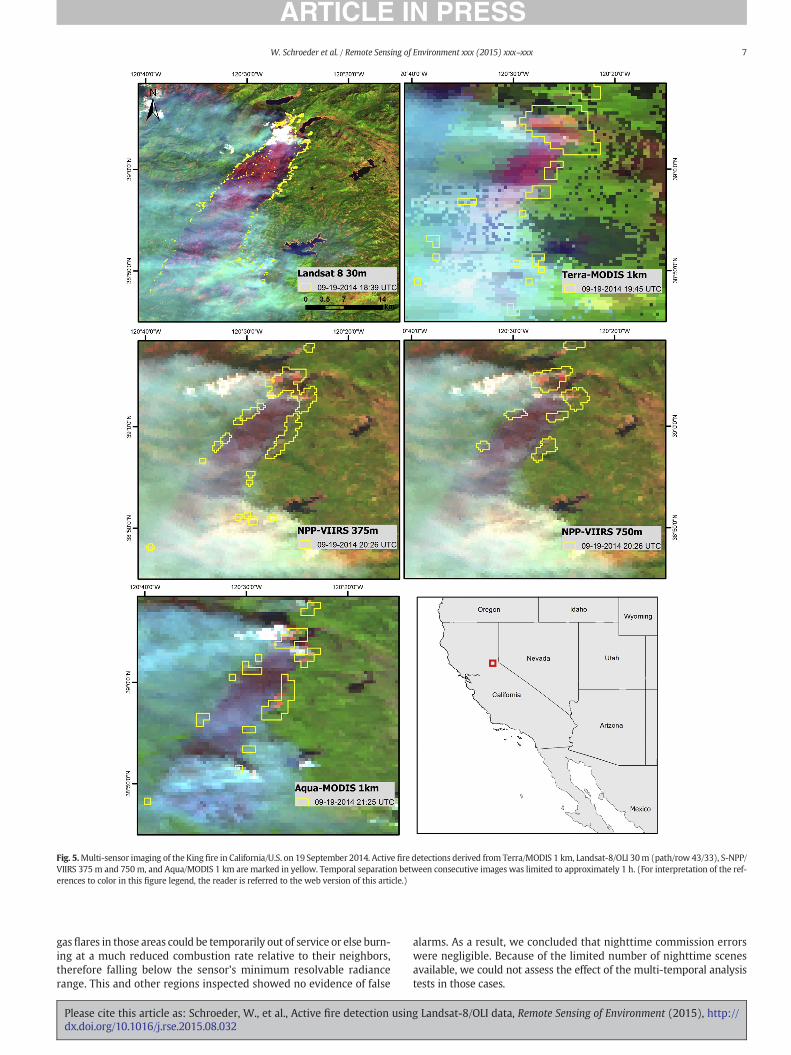
Fig. 5.Multi-sensor imaging of the King fire in California/U.S. on 19 September 2014. Active fire detections derived from Terra/MODIS 1 km, Landsat-8/OLI 30m (path/row 43/33), S-NPP/VIIRS 375 m and 750 m, and Aqua/MODIS 1 km are marked in yellow. Temporal separation between consecutive images was limited to approximately 1 h. (For interpretation of the ref-erences to color in this figure legend, the reader is referred to the web version of this article.)
7W. Schroeder et al. / Remote Sensing of Environment xxx (2015) xxx–xxx
gasflares in those areas could be temporarily out of service or else burn-ing at a much reduced combustion rate relative to their neighbors,therefore falling below the sensor's minimum resolvable radiancerange. This and other regions inspected showed no evidence of false
Please cite this article as: Schroeder, W., et al., Active fire detection usindx.doi.org/10.1016/j.rse.2015.08.032
alarms. As a result, we concluded that nighttime commission errorswere negligible. Because of the limited number of nighttime scenesavailable, we could not assess the effect of the multi-temporal analysistests in those cases.
g Landsat-8/OLI data, Remote Sensing of Environment (2015), http://
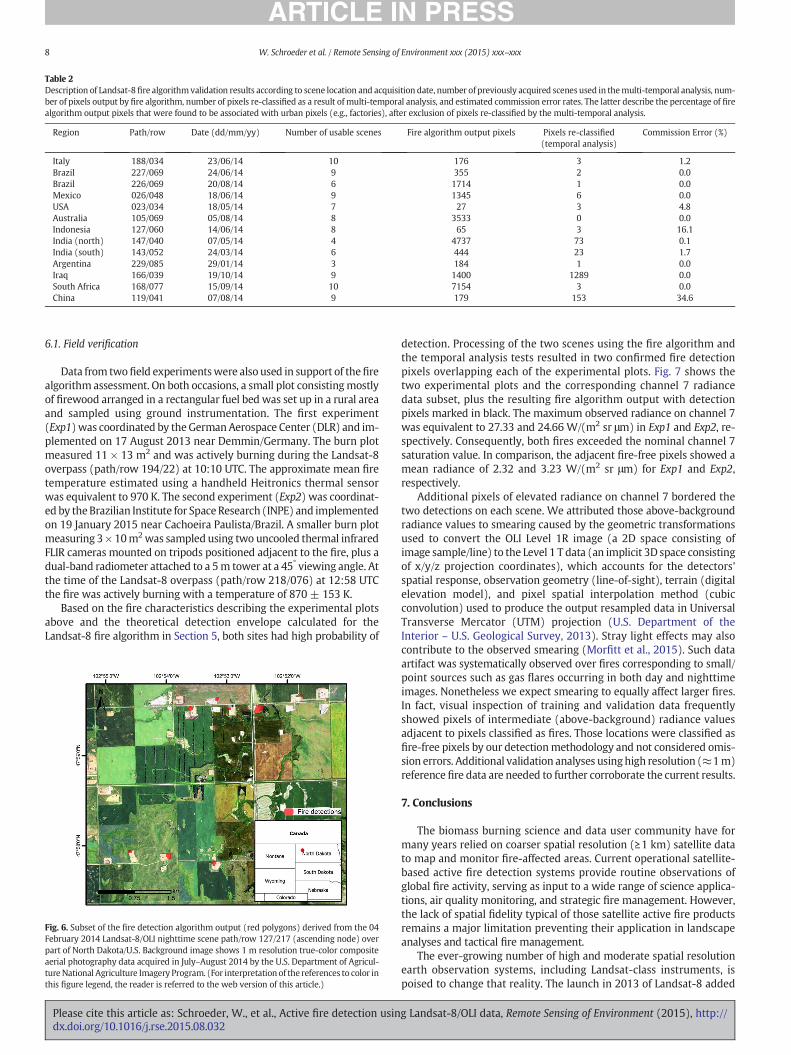
Table 2Description of Landsat-8fire algorithmvalidation results according to scene location and acquisition date, number of previously acquired scenes used in themulti-temporal analysis, num-ber of pixels output by fire algorithm, number of pixels re-classified as a result of multi-temporal analysis, and estimated commission error rates. The latter describe the percentage of firealgorithm output pixels that were found to be associated with urban pixels (e.g., factories), after exclusion of pixels re-classified by the multi-temporal analysis.
Region Path/row Date (dd/mm/yy) Number of usable scenes Fire algorithm output pixels Pixels re-classified(temporal analysis)
Commission Error (%)
Italy 188/034 23/06/14 10 176 3 1.2Brazil 227/069 24/06/14 9 355 2 0.0Brazil 226/069 20/08/14 6 1714 1 0.0Mexico 026/048 18/06/14 9 1345 6 0.0USA 023/034 18/05/14 7 27 3 4.8Australia 105/069 05/08/14 8 3533 0 0.0Indonesia 127/060 14/06/14 8 65 3 16.1India (north) 147/040 07/05/14 4 4737 73 0.1India (south) 143/052 24/03/14 6 444 23 1.7Argentina 229/085 29/01/14 3 184 1 0.0Iraq 166/039 19/10/14 9 1400 1289 0.0South Africa 168/077 15/09/14 10 7154 3 0.0China 119/041 07/08/14 9 179 153 34.6
8 W. Schroeder et al. / Remote Sensing of Environment xxx (2015) xxx–xxx
6.1. Field verification
Data from twofield experimentswere also used in support of thefirealgorithm assessment. On both occasions, a small plot consistingmostlyof firewood arranged in a rectangular fuel bed was set up in a rural areaand sampled using ground instrumentation. The first experiment(Exp1)was coordinated by theGermanAerospace Center (DLR) and im-plemented on 17 August 2013 near Demmin/Germany. The burn plotmeasured 11 × 13 m2 and was actively burning during the Landsat-8overpass (path/row 194/22) at 10:10 UTC. The approximate mean firetemperature estimated using a handheld Heitronics thermal sensorwas equivalent to 970 K. The second experiment (Exp2) was coordinat-ed by theBrazilian Institute for SpaceResearch (INPE) and implementedon 19 January 2015 near Cachoeira Paulista/Brazil. A smaller burn plotmeasuring 3 × 10m2was sampled using two uncooled thermal infraredFLIR cameras mounted on tripods positioned adjacent to the fire, plus adual-band radiometer attached to a 5m tower at a 45° viewing angle. Atthe time of the Landsat-8 overpass (path/row 218/076) at 12:58 UTCthe fire was actively burning with a temperature of 870 ± 153 K.
Based on the fire characteristics describing the experimental plotsabove and the theoretical detection envelope calculated for theLandsat-8 fire algorithm in Section 5, both sites had high probability of
Fig. 6. Subset of the fire detection algorithm output (red polygons) derived from the 04February 2014 Landsat-8/OLI nighttime scene path/row 127/217 (ascending node) overpart of North Dakota/U.S. Background image shows 1 m resolution true-color compositeaerial photography data acquired in July–August 2014 by the U.S. Department of Agricul-ture National Agriculture Imagery Program. (For interpretation of the references to color inthis figure legend, the reader is referred to the web version of this article.)
Please cite this article as: Schroeder, W., et al., Active fire detection usindx.doi.org/10.1016/j.rse.2015.08.032
detection. Processing of the two scenes using the fire algorithm andthe temporal analysis tests resulted in two confirmed fire detectionpixels overlapping each of the experimental plots. Fig. 7 shows thetwo experimental plots and the corresponding channel 7 radiancedata subset, plus the resulting fire algorithm output with detectionpixels marked in black. The maximum observed radiance on channel 7was equivalent to 27.33 and 24.66 W/(m2 sr μm) in Exp1 and Exp2, re-spectively. Consequently, both fires exceeded the nominal channel 7saturation value. In comparison, the adjacent fire-free pixels showed amean radiance of 2.32 and 3.23 W/(m2 sr μm) for Exp1 and Exp2,respectively.
Additional pixels of elevated radiance on channel 7 bordered thetwo detections on each scene. We attributed those above-backgroundradiance values to smearing caused by the geometric transformationsused to convert the OLI Level 1R image (a 2D space consisting ofimage sample/line) to the Level 1 T data (an implicit 3D space consistingof x/y/z projection coordinates), which accounts for the detectors'spatial response, observation geometry (line-of-sight), terrain (digitalelevation model), and pixel spatial interpolation method (cubicconvolution) used to produce the output resampled data in UniversalTransverse Mercator (UTM) projection (U.S. Department of theInterior – U.S. Geological Survey, 2013). Stray light effects may alsocontribute to the observed smearing (Morfitt et al., 2015). Such dataartifact was systematically observed over fires corresponding to small/point sources such as gas flares occurring in both day and nighttimeimages. Nonetheless we expect smearing to equally affect larger fires.In fact, visual inspection of training and validation data frequentlyshowed pixels of intermediate (above-background) radiance valuesadjacent to pixels classified as fires. Those locations were classified asfire-free pixels by our detectionmethodology and not considered omis-sion errors. Additional validation analyses usinghigh resolution (≈1m)reference fire data are needed to further corroborate the current results.
7. Conclusions
The biomass burning science and data user community have formany years relied on coarser spatial resolution (≥1 km) satellite datato map and monitor fire-affected areas. Current operational satellite-based active fire detection systems provide routine observations ofglobal fire activity, serving as input to a wide range of science applica-tions, air quality monitoring, and strategic fire management. However,the lack of spatial fidelity typical of those satellite active fire productsremains a major limitation preventing their application in landscapeanalyses and tactical fire management.
The ever-growing number of high and moderate spatial resolutionearth observation systems, including Landsat-class instruments, ispoised to change that reality. The launch in 2013 of Landsat-8 added
g Landsat-8/OLI data, Remote Sensing of Environment (2015), http://

Fig. 7. Experimental fires used in support of Landsat-8 fire algorithm verification. The two rows show photos of the sites (left panels), and the OLI channel 7 image subset of the areawithfire pixelsmarked in black (right panels). Toppanels describe the 11× 13m2 plot nearDemmin/Germany (53.9276°N 13.0587°E) on 17 August 2013; bottompanels describe the 3× 10m2
plot near Cachoeira Paulista/Brazil (22.6868°S 44.9844°W) on 19 January 2015. (For interpretation of the references to color in thisfigure legend, the reader is referred to theweb version ofthis article.)
9W. Schroeder et al. / Remote Sensing of Environment xxx (2015) xxx–xxx
to the existing network of science-quality moderate spatial resolutionsensors; the ongoing planning and designing of the follow up Landsat-9 system could further extend the Landsat time series into the nextdecade. Most importantly, the comparatively recent shift towards anopen data policy helped catapult the use of Landsat data among variousscience applications, including biomass burning. Complemented byother missions of similar scope (e.g., ESA/Sentinel-2), these emergingorbital systems have the potential to transform the way satellite dataare used in support offire science andmanagement applications. Collec-tively, the integration of all available Landsat-class instruments in thenear future could provide satellite-based spatially refined fire detectiondata at a temporal resolution frequent enough to support operationaltactical fire management, adding to fire incident teams' limited arrayof spatially-explicit fire perimeter information.
Building on these new capabilities, we presented a new active firealgorithm using Landsat-8/OLI day and nighttime input data. Themeth-odology expands on previous algorithms proposed for ASTER andLandsat-7/ETM+, incorporating additional visible and near-infraredchannel data and a multi-temporal analysis scheme. Detailed analysesof the input OLI data indicated frequent saturation of fire-affected pixelson the fire-sensitive SWIR channel 7, and to a lesser extent of the NIRchannel 6 data. Under more extreme conditions involving large orhigh intensity fires, channel 7 saturationwas greatly exceeded resultingin radiometric artifacts associated with the folding of the pixel's digital
Please cite this article as: Schroeder, W., et al., Active fire detection usindx.doi.org/10.1016/j.rse.2015.08.032
number. In addition, visual inspection of the data corroborated by fieldverification indicated potential smearing of the fire-emitted radianceacross adjacent pixels. We attributed the smearing effect to the resam-pling procedure involved in the production of the Level 1 T data files,and to residual stray light effects.
Despite those unique input data features, our assessment of the out-put fire classification data indicated good overall quality across a widerange of fire conditions observed in both day and nighttime imagery.Small and large-size biomass burning fires were successfully resolved,along with gas flares and active volcanoes. The high quality of theLevel 1 T geolocation data provided improved co-location of pixelsacquired onmultiple dates enabling the post-processing of the fire algo-rithm output for persistent heat anomalies, and separation of potentialfalse alarms. Overall commission errors were low, averaging 0.2%globally. Theoretical calculation of fire detection envelopes suggestedsignificant improvement in performance compared to existing coarserspatial resolution fire products. Field verification data corroboratedour theoretical assessment.
The spatially-refined active fire detection data provided by Landsat-class sensors create new opportunities and challenges for the user andscience communities. Thanks to the improved fire line resolving capa-bilities, pixel-based analyses could be replaced by cluster-based applica-tion of the data where contiguous pixels are labeled accordingly andused to describe individual fire events. Such data application could
g Landsat-8/OLI data, Remote Sensing of Environment (2015), http://
10 W. Schroeder et al. / Remote Sensing of Environment xxx (2015) xxx–xxx
also lead to revised product assessment metrics describing omissionand commission error rates based on clustering analyses. Detailedvalidation of these data remains a challenge as reference fire datasources are scarce and costly to acquire, currently demandingexhaustive image interpretation by expert image analysts. Future al-gorithm assessment should build on new complementary data sets(e.g., high resolution urban maps to identify potential false alarmsover highly reflective buildings) and improved fire detection datasimulation corroborated by field data acquired using new lowercost technologies (e.g., drones).
The increased availability of Landsat-class active fire data is fosteringthe development of new applications focused on landscape-scale analy-ses, including fire growth assessment, fire data assimilation intocutting-edge coupled weather-fire models, and tactical fire manage-ment, among others. In order to further maximize time-sensitive disas-ter monitoring applications, mission requirements should enable nearreal-time processing and distribution of the data. The global samplingstrategy should also include comprehensive and systematic nighttimeacquisitions of shortwave and thermal infrared data that can be usedto more frequently track the progress of thermal anomalies.
The proposed algorithm was implemented at the USDA RemoteSensing Applications Center in Salt Lake City/UT, where it serves theU.S. fire management community. This and other Landsat-class activefire algorithmswill continue to be developed and further refined. Futuredevelopment of a fire disturbance essential climate variable will be pur-sued, complementing other satellite fire data sets in support of land-science applications.
Supplementary data to this article can be found online at http://dx.doi.org/10.1016/j.rse.2015.08.032.
Acknowledgments
We thank DLR, Erik Borg, and Doris Klein for hosting and sharingdata from the small biomass burning experiment in Demmin/Germany on 17 August 2013. We also thank INPE for hosting the smallbiomass burning experiment on 19 January 2015 in CachoeiraPaulista/Brazil, and André Lima for sharing field data. Funding supportfor this study was provided by the NASA Applied Sciences Program(grant #NNX12AQ87G), theUSDA Forest Service Remote Sensing Appli-cations Center, and the GOES-R Algorithm Working Group at NOAA'sNational Environmental Satellite, Data, and Information Service. Wethank four anonymous reviewers for their comments.
References
Anejionu, O. C. D., Blackburn, G. A., & Whyatt, J. D. (2014). Satellite survey of gas flares:Development and application of a Landsat-based technique in the Niger Delta.International Journal of Remote Sensing, 35(5), 1900–1925.
Asner, G. P., & Lobell, D. B. (2000). A biogeophysical approach for automated SWIRunmixing of soils and vegetation. Remote Sensing of Environment, 74, 99–112.
Bowman, D. M. J. S., Balch, J. K., Artaxo, P., Bond, W. J., Carlson, J. M., Cochrane, M. A., ...Pyne, S. J. (2009). Fire in the earth system. Science, 324, 481–484.
Casadio, S., Arino, O., & Serpe, D. (2012). Gas flaring monitoring from space using theATSR instrument series. Remote Sensing of Environment, 116, 239–249.
Coen, J. L., & Schroeder,W. (2013). Use of spatially refined satellite remote sensing fire de-tection data to initialize and evaluate coupled weather-wildfire growth model simu-lations. Geophysical Research Letters. http://dx.doi.org/10.1002/2013GL057868.
Coen, J. L., & Schroeder, W. (2015). The high park fire: Coupled weather-wildland firemodel simulation of a windstorm-driven wildfire in Colorado's front range. Journalof Geophysical Research-Atmospheres, 120. http://dx.doi.org/10.1002/2014JD021993.
Csiszar, I. A., & Schroeder, W. (2008). Short-term observations of the temporal develop-ment of active fires from consecutive same-day ETM+ and ASTER imagery in theAmazon: Implications for active fire product validation. IEEE Journal of SelectedTopics in Applied Earth Observations and Remote Sensing, 1, 248–253.
Csiszar, I. A., Morisette, J. T., & Giglio, L. (2006). Validation of active fire detection frommoderate-resolution satellite sensors: The MODIS example in Northern Eurasia.IEEE Transactions on Geoscience and Remote Sensing, 44(7), 1757–1764.
Csiszar, I., Schroeder, W., Giglio, L., Ellicott, E., Vadrevu, K., Justice, C. O., &Wind, B. (2014).Active fires from the Suomi NPP Visible Infrared Imaging Radiometer Suite: Productstatus and first evaluation results. Journal of Geophysical Research-Atmospheres, 119.http://dx.doi.org/10.1002/2013JD020453.
Please cite this article as: Schroeder, W., et al., Active fire detection usindx.doi.org/10.1016/j.rse.2015.08.032
Davies, D. K., Ilavajhala, S., Wong, M. M., & Justice, C. O. (2009). Fire Information for Re-source Management System: Archiving and distributing MODIS active fire data.IEEE Transactions on Geoscience and Remote Sensing, 47, 72–79.
Dwyer, J., Pinnock, S., Grégoire, J. -M., & Pereira, J. M. C. (2000). Global spatial and tempo-ral distribution of vegetation fire as determined from satellite observations.International Journal of Remote Sensing, 21, 1289–1302.
Elvidge, C. D., Ziskin, D., Baugh, K. E., Tuttle, B. T., Ghosh, T., Pack, D. W., ... Zhizhin, M.(2009). A fifteen year record of global natural gas flaring derived from satellitedata. Energies, 2, 595–622.
Elvidge, C. D., Zhizhin, M., Hsu, F. -C., & Baugh, K. E. (2013). VIIRS nightfire: Satellite py-rometry at night. Remote Sensing, 5, 4423–4449.
Flynn, L. P., Harris, A. J. L., &Wright, R. (2001). Improved identification of volcanic featuresusing Landsat 7 ETM+. Remote Sensing of Environment, 78, 180–193.
Francis, P. W., & Rothery, D. A. (1987). Using the Landsat Thematic Mapper to detect andmonitor active volcanoes: An example from Lascar volcano, northern Chile. Geology,15, 614–617.
Freeman, J. P., Stohlgren, T. J., Hunter, M. E., Omi, P. N., Martinson, E. J., Chong, G. W., &Brown, C. S. (2007). Rapid assessment of postfire plant invasions in coniferous forestsof the Western United States. Ecological Applications, 17, 1656–1665.
Giglio, L., Descloitres, J., Justice, C. O., & Kaufman, Y. J. (2003). An enhanced contextual firedetection algorithm for MODIS. Remote Sensing of Environment, 87, 273–282.
Giglio, L., Csiszar, I., & Justice, C. O. (2006). Global distribution and seasonality of fires asobserved with the Terra and Aqua Moderate Resolution Imaging Spectroradiometer(MODIS) sensors. Journal of Geophysical Research, 111. http://dx.doi.org/10.1029/2005JG000142.
Giglio, L., Csiszar, I., Restás, Á., Morisete, J. T., Schroeder, W., Morton, D., & Justice, C. O.(2008). Active fire detection and characterization with the Advanced SpaceborneThermal Emission and Reflection Radiometer (ASTER). Remote Sensing ofEnvironment, 112, 3055–3063.
Giglio, L., Loboda, T. V., Roy, D. P., Quayle, B., & Justice, C. O. (2009). An active-fire basedburned area mapping for the MODIS sensor. Remote Sensing of Environment, 113,408–420.
Hantson, S., Padilla, M., Corti, D., & Chuvieco, E. (2013). Strengths and weaknesses ofMODIS hotspots to characterize global fire occurrence. Remote Sensing ofEnvironment, 131, 152–159.
Higgins, S. I., Bond, W. J., February, E. C., Bronn, A., Euston-Brown, D. I. W., Enslin, B., ...Trollope, W. S. W. (2007). Effects of four decades of fire manipulation on woody veg-etation structure in savanna. Ecological Applications, 88, 1119–1125.
Ichoku, C., & Kaufman, Y. J. (2005). A method to derive smoke emission rates fromMODISfire radiative energy measurements. IEEE Transactions on Geoscience and RemoteSensing, 43, 2636–2649.
Ichoku, C., Giglio, L., Wooster, M. J., & Remer, L. A. (2008). Global characterization ofbiomass-burning patterns using satellite measurements of fire radiative energy.Remote Sensing of Environment, 112, 2950–2962.
Irons, J. R., Dwyer, J. L., & Barsi, J. A. (2012). the next landsat satellite: the landsat data con-tinuity mission. Remote Sensing of Environment, 112, 11–21.
Kaiser, J. W., Heil, A., Andreae, M. O., Benedetti, A., Chubarova, N., Jones, L., ... van derWerf,G. (2012). Biomass burning emissions estimated with a global fire assimilation sys-tem based on observed fire radiative power. Biogeosciences, 9, 527–554.
Kasischke, E. S., Hewson, J. H., Stocks, B., van der Werf, G., & Randerson, J. (2003). The useof ATSR active fire counts for estimating relative patterns of biomass burning — Astudy from boreal forest region. Geophysical Research Letters, 30. http://dx.doi.org/10.1029/2003GL017859.
Kaufman, Y. J., Wald, A. E., Remer, L. A., Gao, B. -C., Li, R. -R., & Flynn, L. (1997). The MODIS2.1 μm channel — Correlation with visible reflectance for use in remote sensing ofaerosol. IEEE Transactions on Geoscience and Remote Sensing, 35, 1286–1298.
Larsen, I. J., MacDonald, L. H., Brown, E., Rough, D., Welsh, M. J., Pietraszek, J. H., ...Schaffrath, K. (2009). Causes of post-fire runoff and erosion: water repellency,cover or soil sealing? Soil Science Society of America Journal, 73, 1393–1407.
Liu, H., Randerson, J. T., Lindfors, J., & Chapin, F. S., III (2005). Changes in the surface energybudget after fire in boreal ecosystems of interior Alaska: An annual perspective.Journal of Geophysical Research-Atmospheres. http://dx.doi.org/10.1029/2004JD005158.
Loboda, T. V., & Csizar, I. (2007). Reconstruction of fire spread within wildland fire eventsin Northern Eurasia from the MODIS active fire product. Global and Planetary Change,56, 257–273.
Loboda, T. V., O'Neal, K., & Csizar, I. (2007). Regionally adaptable dNBR-based algorithmfor burned area mapping from MODIS data. Remote Sensing of Environment, 109,429–442.
Mell, W. E., Manzello, S. L., Maranghides, A., Butry, D., & Rehm, R. G. (2010). The wildland-urban interface fire problem — Current approaches and research needs. InternationalJournal of Wildland Fire, 19, 238–351.
Morfitt, R., Barsi, J., Levy, R., Markham, B., Micijevic, E., Ong, L., ... Vanderwerff, K. (2015).Landsat-8 Operational Land Imager (OLI) radiometric performance on-orbit. RemoteSensing, 7, 2208–2237.
Morisette, J. T., Giglio, L., Csiszar, I., & Justice, C. O. (2005). Validation of the MODIS activefire product over Southern Africa with ASTER data. International Journal of RemoteSensing, 26(19), 4239–4264.
Oliva, P., & Schroeder, W. (2015). Assessment of VIIRS 375m active fire detection productfor direct burned area mapping. Remote Sensing of Environment, 160, 144–155.
Oliveras, I., Meirelles, S. T., Hirakuri, V. L., Freitas, C. R., Miranda, H. S., & Pivello, V. R.(2012). Effects of fire regimes on herbaceous biomass and nutrient dynamics in theBrazilia savanna. International Journal of Wildland Fire, 22, 368–380.
Oppenheimer, C. (1991). Lava flow cooling estimated from Landsat Thematic Mapperdata: The Lonquimay Eruption (Chile, 1989). Journal of Geophysical Research, 96.http://dx.doi.org/10.1029/91JB01902.
g Landsat-8/OLI data, Remote Sensing of Environment (2015), http://

11W. Schroeder et al. / Remote Sensing of Environment xxx (2015) xxx–xxx
Pozo, D., Olmo, F. J., & Alados-Arboledas, L. (1997). Fire detection and growth monitoringusing a multitemporal technique on AVHRR mid-infrared and thermal channels.Remote Sensing of Environment, 60, 111–120.
Roy, D., Wulder, M. A., Loveland, T. R., Woodcock, C. E., Allen, R. G., Anderson, M. C., ... Zhu,Z. (2014). Landsat-8: Science and product vision for terrestrial global change re-search. Remote Sensing of Environment, 145, 154–172.
Schoennagel, T., Nelson, C. R., Theobald, D. M., Carnwath, G. C., & Chapman, T. B. (2009).Implementation of National Fire Plan treatments near the wildland-urban interfacein the western United States. Proceedings of the National Academy of Sciences, 106,10706–10711.
Schroeder, W., Prins, E., Giglio, L., Csiszar, I., Schmidt, C., Morisette, J., & Morton, D.(2008a). Validation of GOES and MODIS active fire detection products using ASTERand ETM+ data. Remote Sensing of Environment, 112, 2711–2726.
Schroeder, W., Ruminski, M., Csiszar, I., Giglio, L., Prins, E., Schmidt, C., & Morisette, J.(2008b). Validation analyses of an operational fire monitoring product: The hazardmapping system. International Journal of Remote Sensing, 29, 6059–6066.
Schroeder, W., Oliva, P., Giglio, L., & Csiszar, I. (2014). The new VIIRS 375 m active fire de-tection data product: Algorithm description and initial assessment. Remote Sensing ofEnvironment, 143, 85–96.
Please cite this article as: Schroeder, W., et al., Active fire detection usindx.doi.org/10.1016/j.rse.2015.08.032
U.S. Department of the Interior –U.S. Geological Survey (2013). LDCM CAL/VAL AlgorithmDescription Document, version 3.0. Digital document available at: http://landsat.usgs.gov/documents/LDCM_CVT_ADD.pdf (last accessed 22 June 2015)
Van der Werf, G. R., Randerson, J. T., Giglio, L., Collatz, G. J., Mu, M., Kasibhatla, P. S., ... vanLeeuwen, T. T. (2010). Global fire emissions and the contribution of deforestation, sa-vanna, forest, agricultural, and peat fires (1997–2009). Atmospheric Chemistry andPhysics, 10, 11707–11735.
Vermote, E., Ellicott, E., Dubovik, O., Lapyonok, T., Chin, M., Giglio, L., & Roberts, G. J.(2009). An approach to estimate global biomass burning emissions of organic andblack carbon from MODIS fire radiative power. Journal of Geophysical Research, 114.http://dx.doi.org/10.1029/2008JD011188.
Wiedinmyer, C., Quayle, B., Geron, C., Belote, A., McKenzie, D., Zhang, X., ... Wynne, K. K.(2006). Estimating emissions from fires in North America for air quality modeling.Atmospheric Environment, 40, 3419–3432.
g Landsat-8/OLI data, Remote Sensing of Environment (2015), http://