Embed Size (px)
Citation preview
May 19-22, 2015
GEO-Latin American & Caribbean Water Cycle Capacity Building Workshop Cartagena, Colombia
1
Climate Variability, Hydrology, and Flooding
Remote Sensing Observations for Flood Modeling

May 19-22, 2015
GEO-Latin American & Caribbean Water Cycle Capacity Building Workshop Cartagena, Colombia
2
Objective
Learn to access NASA remote sensing and modeling data for input to hydrology/flood models

May 19-22, 2015
GEO-Latin American & Caribbean Water Cycle Capacity Building Workshop Cartagena, Colombia
3
Outline
▪ Review of Hydrological Parameters Relevant to
Flood Modeling ▪ Weather Data for Hydrology Modeling ▪ Terrain Data for Hydrology Modeling

4
Review of Hydrological Parameters Relevant to Flood Modeling

❑ Rainfall TRMM ❑ Weather Data: Temperature, Winds, Humidity MERRA ❑ Soil Moisture GLDAS/TMI/SMAP ❑ Terrain Shuttle Radar Topography Mission ❑ Land Cover Terra/Aqua MODIS
NASA Satellites and Atmosphere-land Models Provide Data for Inputs to Hydrology Models
Information and Access of These Data was Covered in Session-2 5

❑ Rainfall TRMM ❑ Weather Data: Surface Temperature, MERRA ❑ Winds, Humidity ❑ Soil Moisture GLDAS/TMI/SMAP ❑ Terrain Shuttle Radar Topography Mission
❑ Land Cover Terra/Aqua MODIS
NASA Satellites and Atmosphere-land Models Provide Data for Inputs to Hydrology Models
This Session will focus on MERRA and SRTM Data and Access
6

7
Weather Data for Hydrology Modeling

Modern Era Retrospective-analysis for Research and Applications (MERRA) http://gmao.gsfc.nasa.gov/merra
What is Reanalysis?
▪ A technique to produce multiple climate variables with a value
added merger of many types of observations with the latest Earth systems models
▪ Past observations of basic meteorological data such as
temperature, wind speed, and pressure are analyzed and interpolated onto model grids
▪ 3-D forecasting model is initialized and constrained with the observations. The model simulations provide many climate variables which are not observed, for example moisture flux
▪ The model simulations also provide more frequent (hourly, 6-
hourly) outputs than observations
8

MERRA Blends the vast quantities of observational data with output data of the Goddard Earth Observing System (GEOS) model [1979-present]
Current satellite coverage assimilated in MERRA
As the observing system improves, modeling uncertainties decrease
9

Observations Used in MERRA Reanalysis
• Technologies change; Instrument life cycle
From: Michael Bosilovich, NASA-GSFC-GMAO
MERRA focuses on historical analyses on a broad range of weather and climate time scales (hours to years) and places the NASA satellite observations in a climate context
10

MERRA Weather Data for Hydrology Modeling
Parameters (Latitude-longitude-Height/Pressure Levels)* Temperature East-West and North-South Wind Components Specific Humidity and Relative Humidity Spatial Resolution: 1.25°x1.25° and 42 vertical levels Spatial Coverage: Global Temporal Resolution: Hourly, Monthly Temporal Coverage: 1979-Present
11

MERRA Data Access Data can be downloaded from http://mirador.gsfc.nasa.gov by a keyword search. Also, can search by time and location/region
12

13
Terrain Data for Hydrology Modeling
From Shuttle Radar Topography Mission (SRTM)
USGS
Acknowledgement: Cynthia Schmidt (NASA-ARSET), Lindsey Harriman (USGS), Kelly Lemig (USGS)

Sources of NASA Terrain Data
Radar: Shuttle Radar Topography Mission (SRTM) Radiometer: Terra Advanced Spaceborne Thermal Emission
and Reflection Radiometer (ASTER) Useful for Mapping
Hazardous terrain Calculating
Slope and aspect Catchment area Forest canopy height
Modeling Runoff Stream networks Landslides
Courtesy: Cynthia Schmidt (NASA-ARSET), Lindsey Harriman (USGS), Kelly Lemig (USGS) 14

Shuttle Radar Topography Mission (SRTM) Version 3.0 (SRTM Plus)
https://lpdaac.usgs.gov/products/measures_products_table
USGS 15

What is SRTM?
• NASA mission completed in February 2000 • Consisted of 176 orbits around Earth in 11 days • Acquired Digital Elevation Model (DEM) of all land
between 60oN and 56oS latitude, about 80% of Earth’s total land mass
16
http://www2.jpl.nasa.gov/srtm/

NASA SRTM Version 3.0 (SRTM Plus) ▪ Created by the Jet Propulsion Laboratory (JPL) as part of
the NASA MEaSUREs program ▪ Principal Investigator: Michael Kobrick, JPL ▪ Eliminated voids in the SRTM data by filling with ASTER
GDEM2, USGS GMTED2010, or USGS National Elevation Dataset (NED)
▪ Collected at 1 arc second and resampled to 3 arc seconds
▪ November 2013: US & Territories 1 arc sec and Global 3 arc sec
▪ October 2014: Africa 1 arc second
http://srtm.usgs.gov/data/interferometry.php
17

NASA SRTM v3 Characteristics
Tile size 1o by 1o
Pixel size 1 arc second (~30 meters) or 3 arc seconds (~90 meters)
Geographic coordinates
Geographic latitude and longitude
Output format DEMS: .HGT, 16-bit signed integer, in units of vertical meters Number: .NUM
Geoid reference WGS84/EGM96 Special DN values N/A - No voids in v3 Coverage 60oN to 56oS latitude
U.S. and Territories Africa
18
New version released in 2014 has high resolution

NASA SRTM v3 Products
19

Sampling Methods: Global 3 arc second data
SRTMGL3
Averaged data -Lower resolution (~112 meters) -Less noise
Sampled data -Higher resolution (~100 meters) -More noise
SRTMGL3S
20

SRTM Data Use Case
Onwuteaka, J., 2014, GIS Modeling of Flooding Exposure in Nigerian Coastal Areas from Sea Level Rise, Journal of Environment and Earth Science v. 4, no. 12, p. 81-94.
Sea Level Rise
Scenarios (m)
Affected Local
Government Areas
1 10 2 12 3 12 4 13 5 13
13 22
21

How to Access NASA SRTM v3
• Reverb: http://reverb.echo.nasa.gov/reverb
• GDEx: http://gdex.cr.usgs.gov/gdex/
• Data Pool and DAAC2Disk: https://lpdaac.usgs.gov/data_access/data_pool
• More information: SRTM v3 User Guide
https://lpdaac.usgs.gov/sites/default/files/public/measures/docs/NASA_SRTM_V3.pdf
22

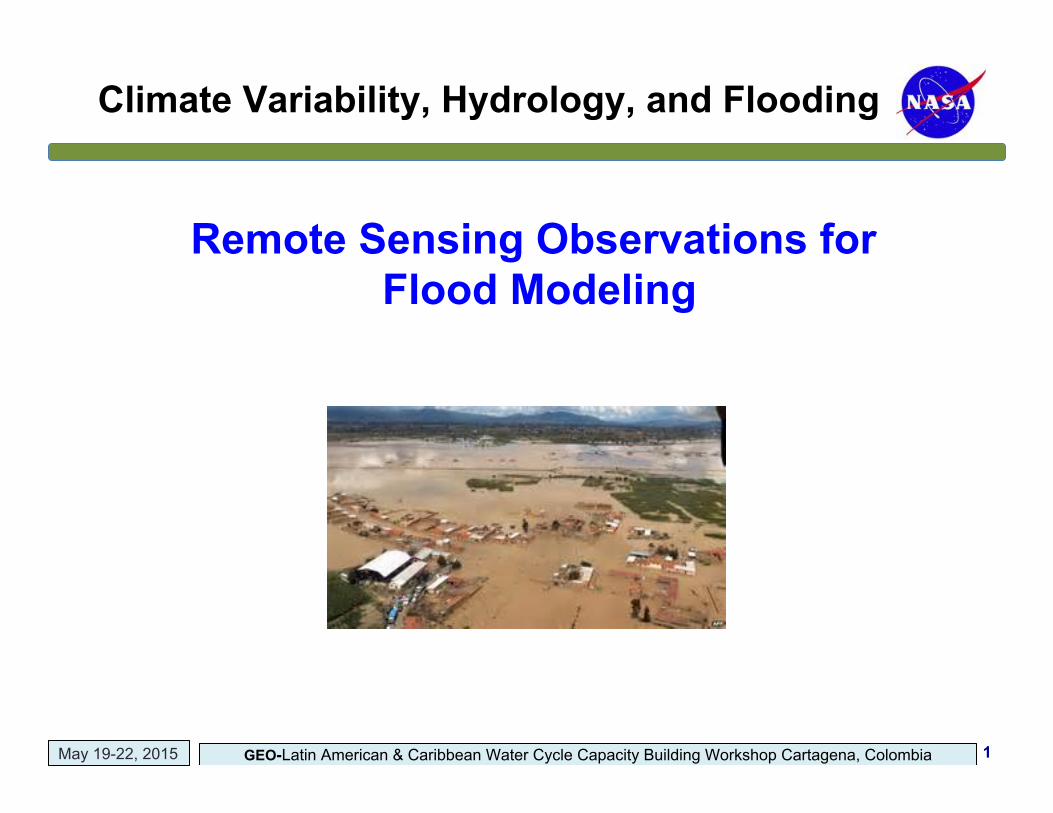
Global Data Explorer (GDEX) http://gdex.cr.usgs.gov/gdex/
• Funded through NASA ROSES 2005 ACCESS Program
• A collaboration between the LP DAAC and George Mason University's Center for Spatial Information Science and Systems
• A seamless data viewer providing access to multiple sources of digital elevation data sets
• Users can subset and download data by area of interest
in multiple formats and projections
23
GDEx
24
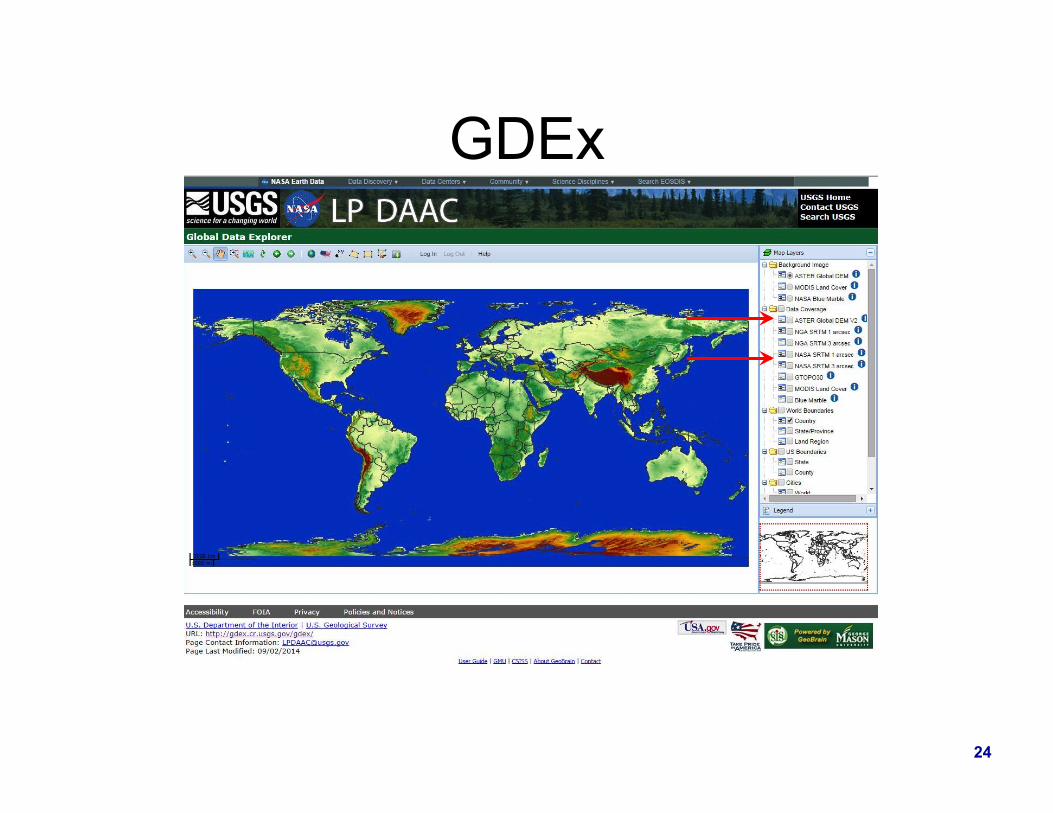
GDEx Features and Functions
▪ NASA ECHO/Reverb user account required to download data ▪ Product documentation and User Guide ▪ Square or polygonal area of interest ▪ Pre-defined areas of interest (state, county) ▪ Advanced, on-the-fly processing
▪ Mosaic tiles coverage clipped to area of interest ▪ Reformat to GeoTIFF, ArcASCII, or JPEG ▪ universal transverse Mercator (UTM) or LAT/LON projection
▪ Preview data before download
25

GDEx Tile Limits
Product Tile mosaic limit ASTER GDEM 20
NASA SRTM 1 arcsec 36 NASA SRTM 3 arcsec 50
26

27
Summary
Quan%ty Source Access
Rainfall TRMM TMPA GPM IMERG (In 2016)
Giovanni (Also TMPA Near-real-
Time data from IRI Climate Data Library)
Weather Parameters
(Temperature, Humidity, Winds)
MERRA Mirador
Soil Moisture GLDAS SMAP (In 2016)
Mirador, Giovanni NSIDC
Land Cover Terra and Aqua/MODIS Reverb
Terrain SRTM Reverb, GDEx
Data for Hydrology Model Inputs

28
Overview of TRMM-based Flood Monitoring Tools
Next: