Embed Size (px)
Citation preview
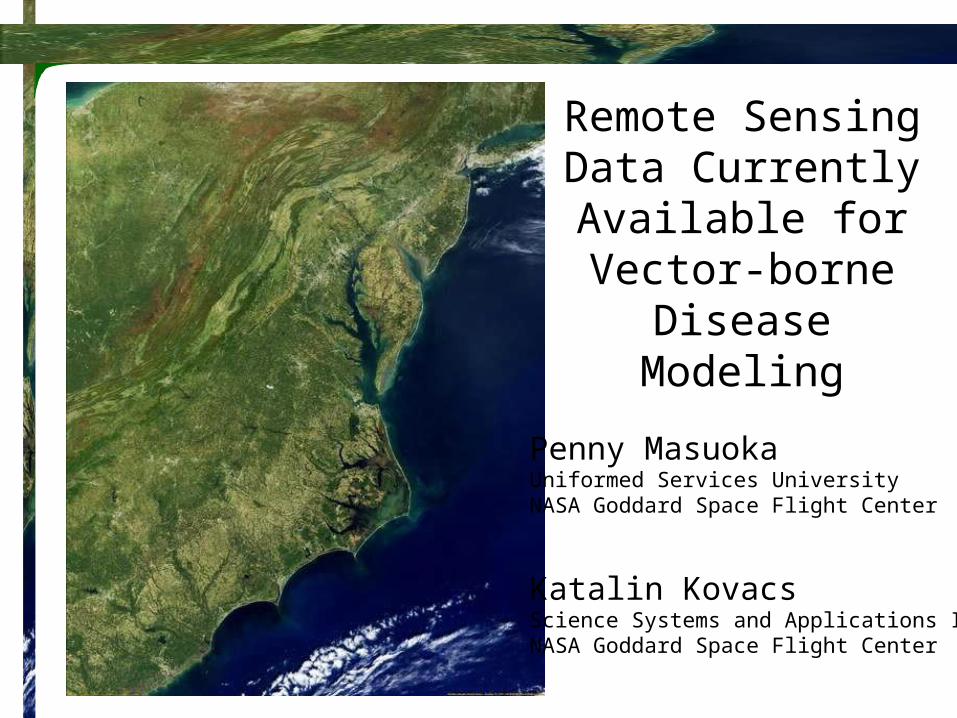
Remote Sensing Data Currently Available for Vector-borne
Disease Modeling
Penny MasuokaUniformed Services UniversityNASA Goddard Space Flight Center
Katalin KovacsScience Systems and Applications Inc.NASA Goddard Space Flight Center
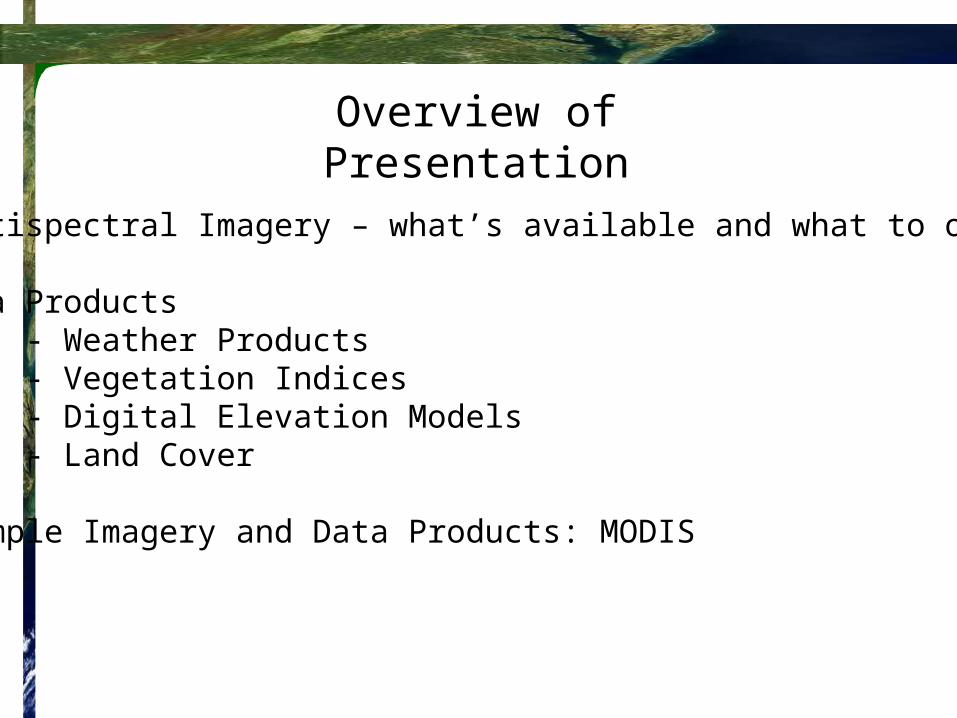
Overview of Presentation
Multispectral Imagery – what’s available and what to order
Data Products- Weather Products- Vegetation Indices- Digital Elevation Models- Land Cover
Example Imagery and Data Products: MODIS
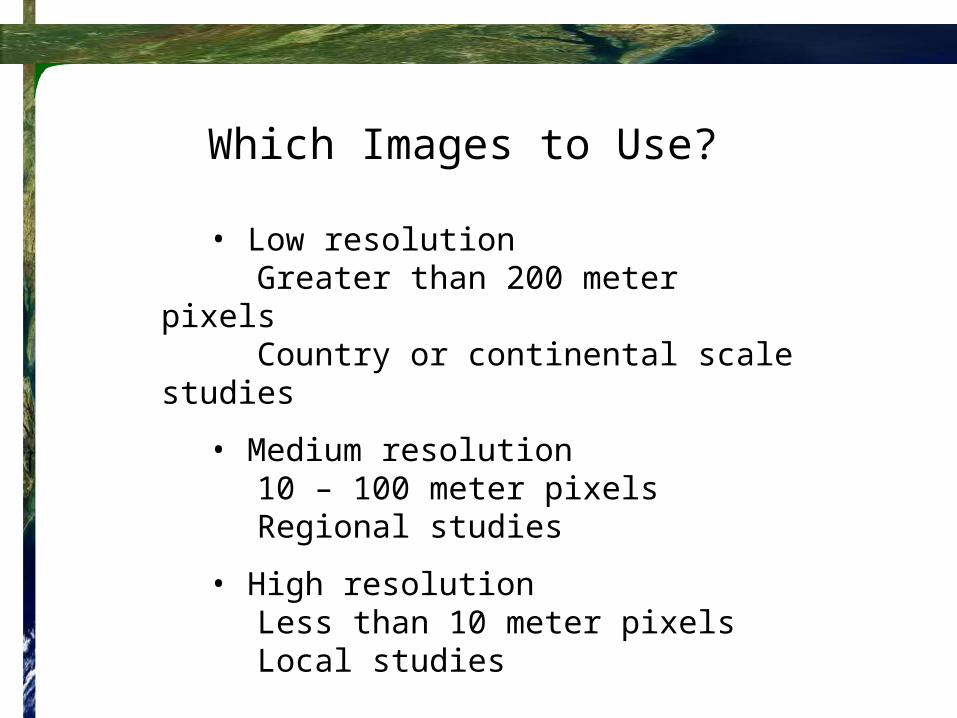
• Low resolutionGreater than 200 meter pixelsCountry or continental scale studies
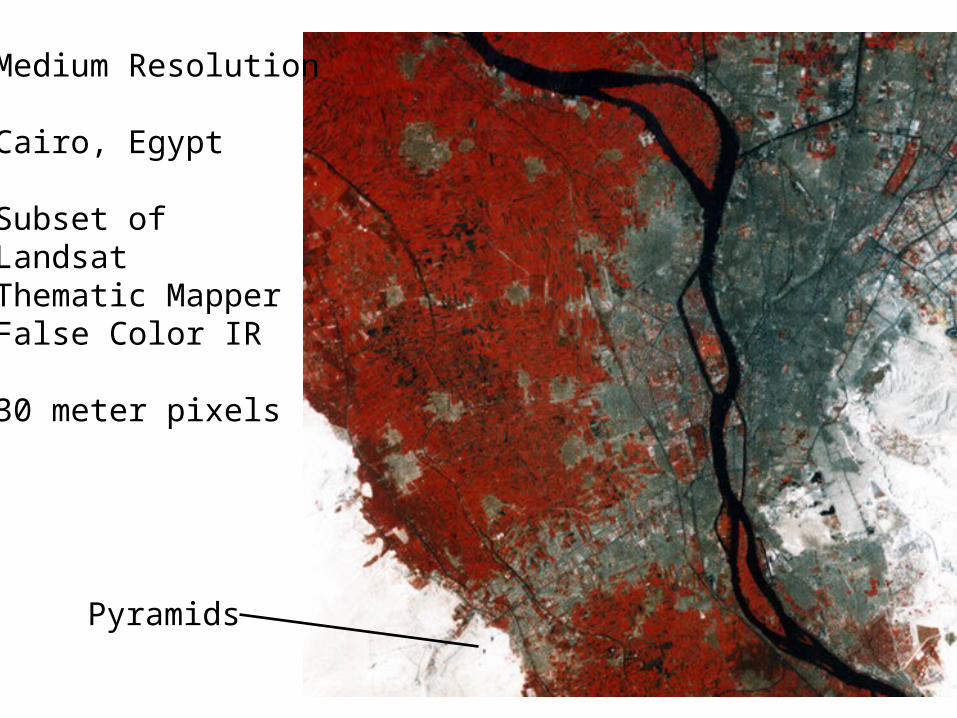
• Medium resolution10 – 100 meter pixelsRegional studies
• High resolutionLess than 10 meter pixelsLocal studies
Which Images to Use?
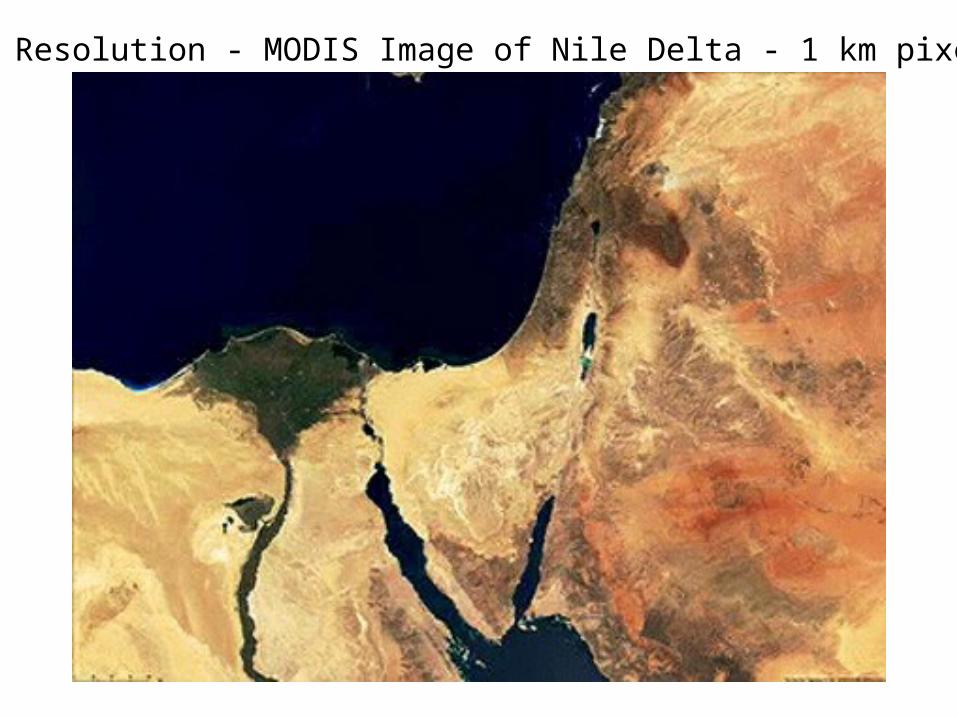
Low Resolution - MODIS Image of Nile Delta - 1 km pixels
Pyramids
Medium Resolution
Cairo, Egypt
Subset ofLandsat Thematic MapperFalse Color IR
30 meter pixels
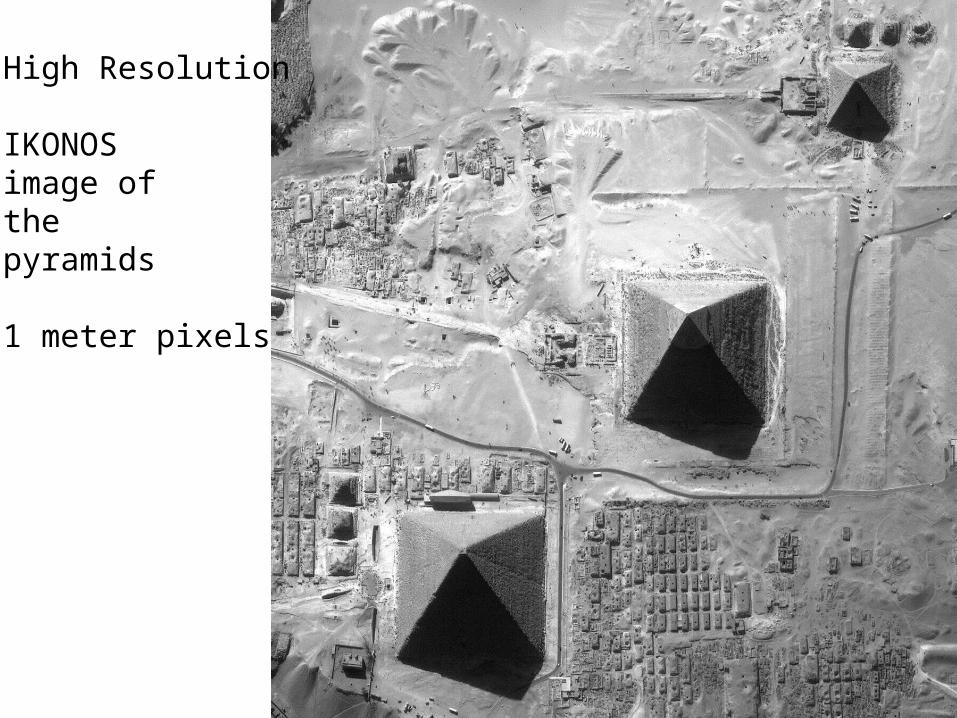
High Resolution
IKONOS image of the pyramids
1 meter pixels
The Resolution Trade Off
As spatial resolution increases:
• Spectral resolution (number of bands) decreases
• File size increases
• Cost increases
Lesson: Use the lowest resolution data that will get the job done.
How do you decide which resolution?
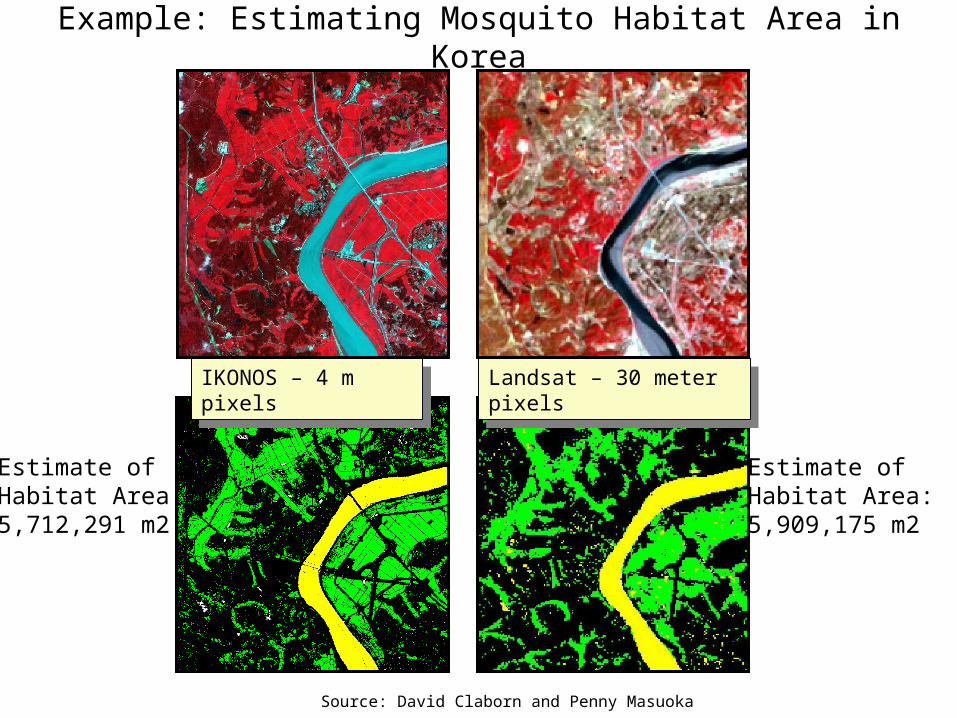
Example: Estimating Mosquito Habitat Area in Korea
Landsat – 30 meter pixelsLandsat – 30 meter pixelsIKONOS – 4 m pixelsIKONOS – 4 m pixels
Estimate of Habitat Area:5,712,291 m2
Estimate of Habitat Area:5,909,175 m2
Source: David Claborn and Penny Masuoka
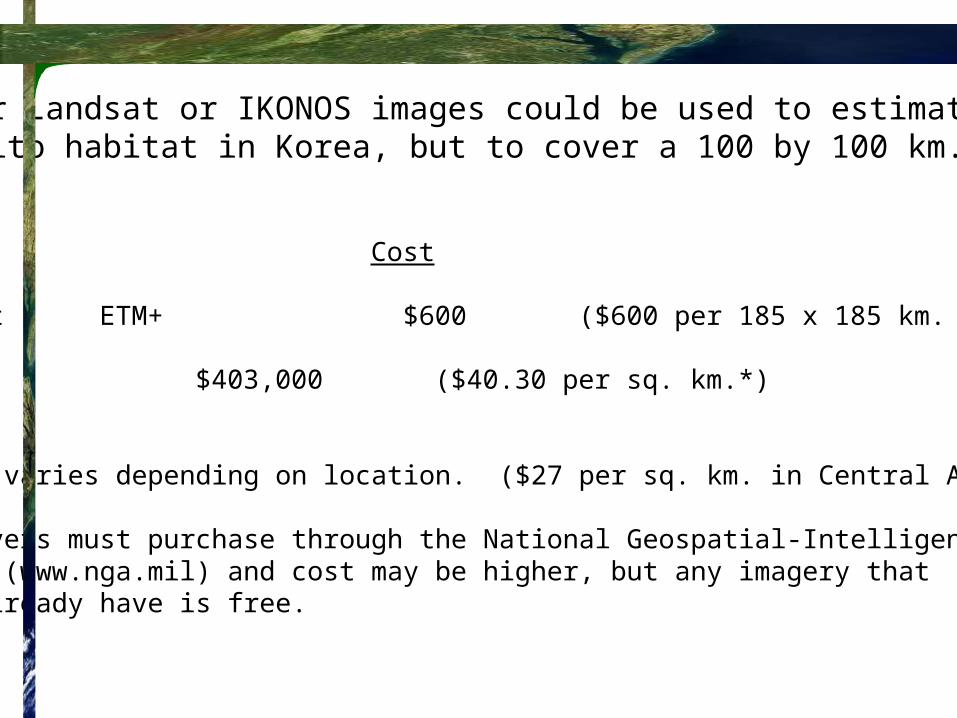
Either Landsat or IKONOS images could be used to estimatemosquito habitat in Korea, but to cover a 100 by 100 km. area:
Sensor Cost
Landsat ETM+ $600 ($600 per 185 x 185 km. scene)
IKONOS $403,000 ($40.30 per sq. km.*)
*Price varies depending on location. ($27 per sq. km. in Central America)
DoD buyers must purchase through the National Geospatial-IntelligenceAgency (www.nga.mil) and cost may be higher, but any imagery that they already have is free.
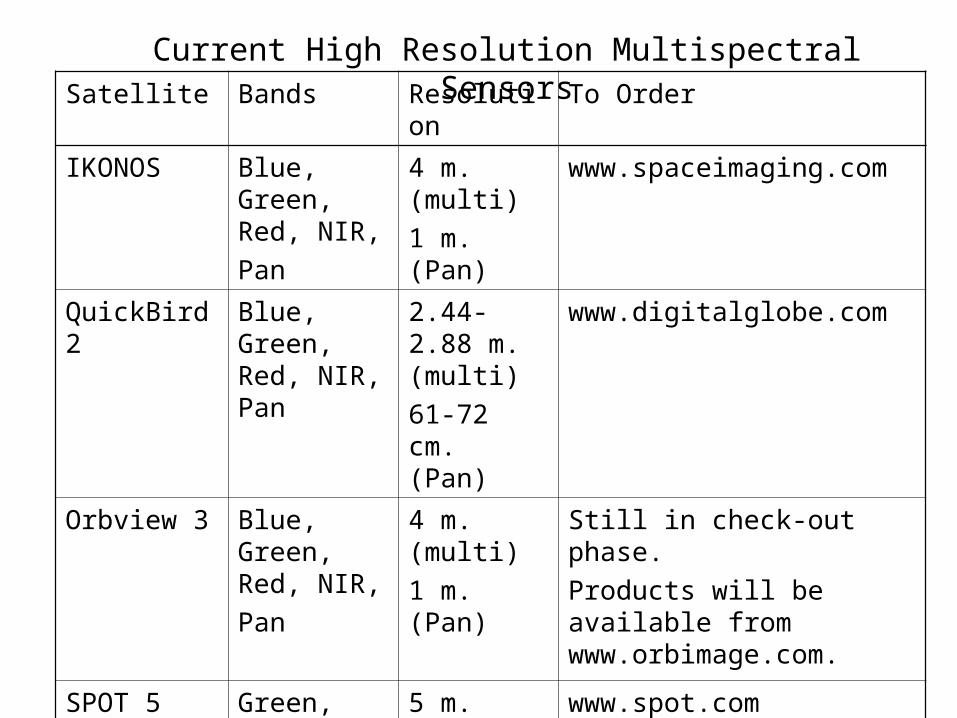
Current High Resolution Multispectral SensorsSatellite Bands Resolution To Order
IKONOS Blue, Green, Red, NIR,
Pan
4 m. (multi)
1 m. (Pan)
www.spaceimaging.com
QuickBird 2 Blue, Green, Red, NIR, Pan
2.44-2.88 m. (multi)
61-72 cm. (Pan)
www.digitalglobe.com
Orbview 3 Blue, Green, Red, NIR,
Pan
4 m. (multi)
1 m. (Pan)
Still in check-out phase.
Products will be available from www.orbimage.com.
SPOT 5
HRV-IR
Green, Red, NIR, MIR
5 m. (pan)
10 m (multi)
20 m (MIR)
www.spot.com
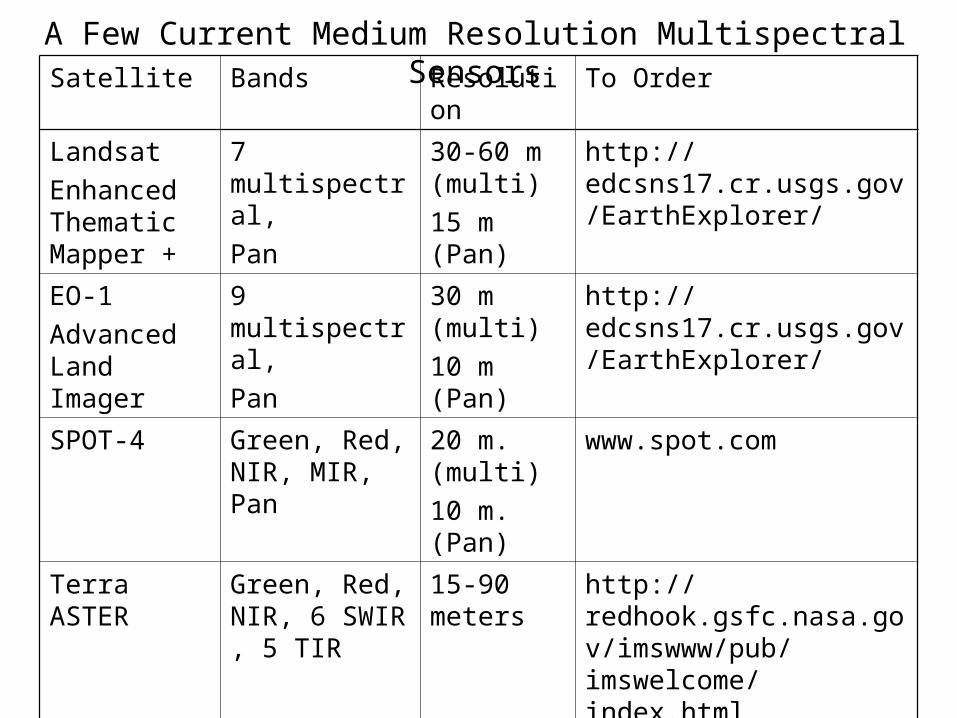
A Few Current Medium Resolution Multispectral SensorsSatellite Bands Resolution To Order
Landsat
Enhanced Thematic Mapper +
7 multispectral,
Pan
30-60 m (multi)
15 m (Pan)
http://edcsns17.cr.usgs.gov/EarthExplorer/
EO-1
Advanced Land Imager
9 multispectral,
Pan
30 m (multi)
10 m (Pan)
http://edcsns17.cr.usgs.gov/EarthExplorer/
SPOT-4 Green, Red, NIR, MIR, Pan
20 m. (multi)
10 m. (Pan)
www.spot.com
Terra ASTER Green, Red, NIR, 6 SWIR , 5 TIR
15-90 meters
http://redhook.gsfc.nasa.gov/imswww/pub/imswelcome/index.html
IRS-P6 LISS3
Green, Red, NIR, MIR
24 meters http://www.spaceimaging.com/products/irs/index.htm
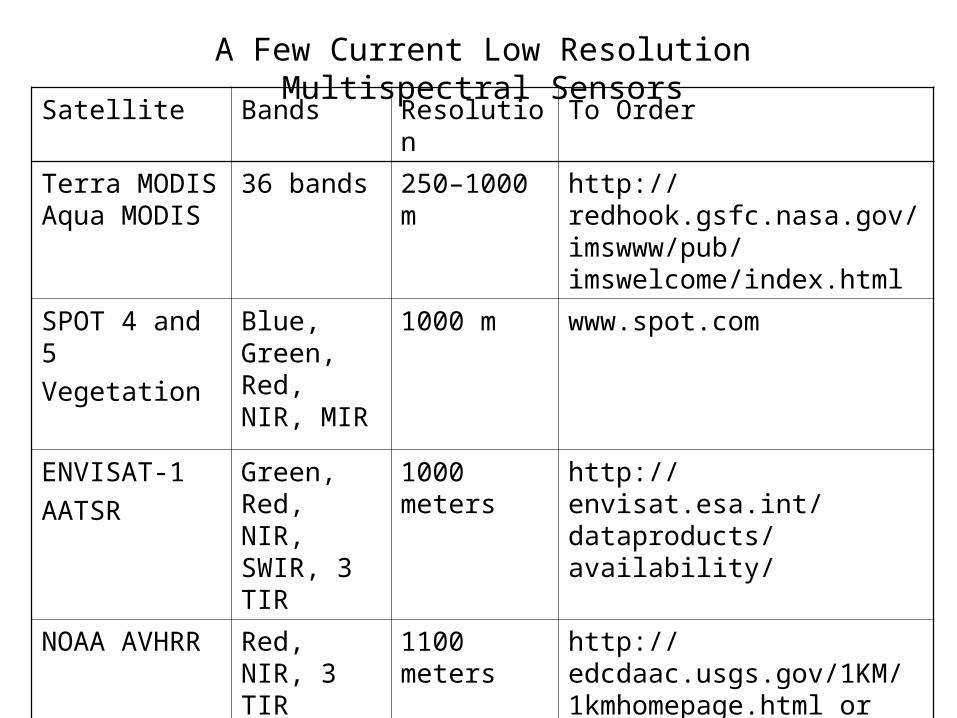
A Few Current Low Resolution Multispectral Sensors
Satellite Bands Resolution To Order
Terra MODIS Aqua MODIS
36 bands 250–1000 m http://redhook.gsfc.nasa.gov/imswww/pub/imswelcome/index.html
SPOT 4 and 5
Vegetation
Blue, Green, Red, NIR, MIR
1000 m www.spot.com
ENVISAT-1
AATSR
Green, Red, NIR, SWIR, 3 TIR
1000 meters http://envisat.esa.int/dataproducts/availability/
NOAA AVHRR Red, NIR, 3 TIR
1100 meters http://edcdaac.usgs.gov/1KM/1kmhomepage.html or http://edcsns17.cr.usgs.gov/EarthExplorer/
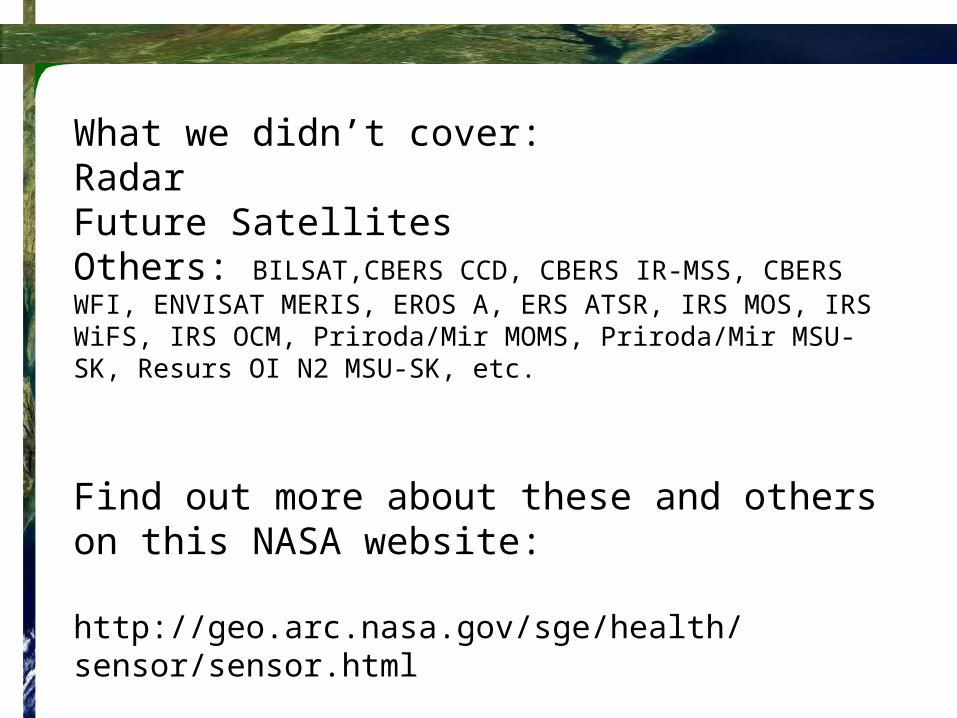
What we didn’t cover:RadarFuture SatellitesOthers: BILSAT,CBERS CCD, CBERS IR-MSS, CBERS WFI, ENVISAT MERIS, EROS A, ERS ATSR, IRS MOS, IRS WiFS, IRS OCM, Priroda/Mir MOMS, Priroda/Mir MSU-SK, Resurs OI N2 MSU-SK, etc.
Find out more about these and others on this NASA website:
http://geo.arc.nasa.gov/sge/health/sensor/sensor.html
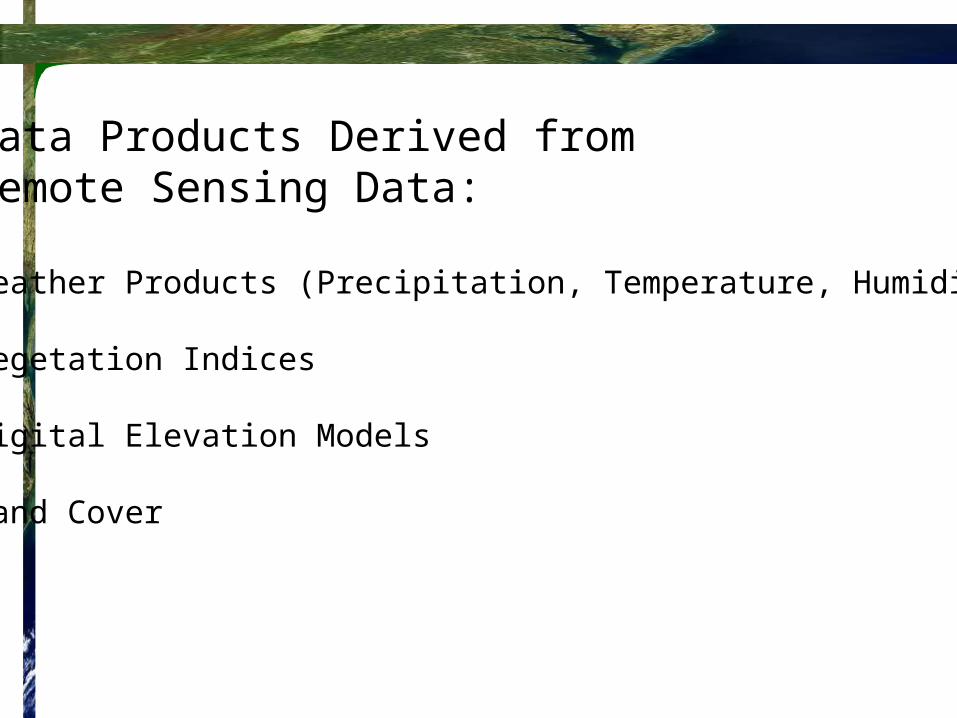
Data Products Derived from Remote Sensing Data:
Weather Products (Precipitation, Temperature, Humidity)
Vegetation Indices
Digital Elevation Models
Land Cover
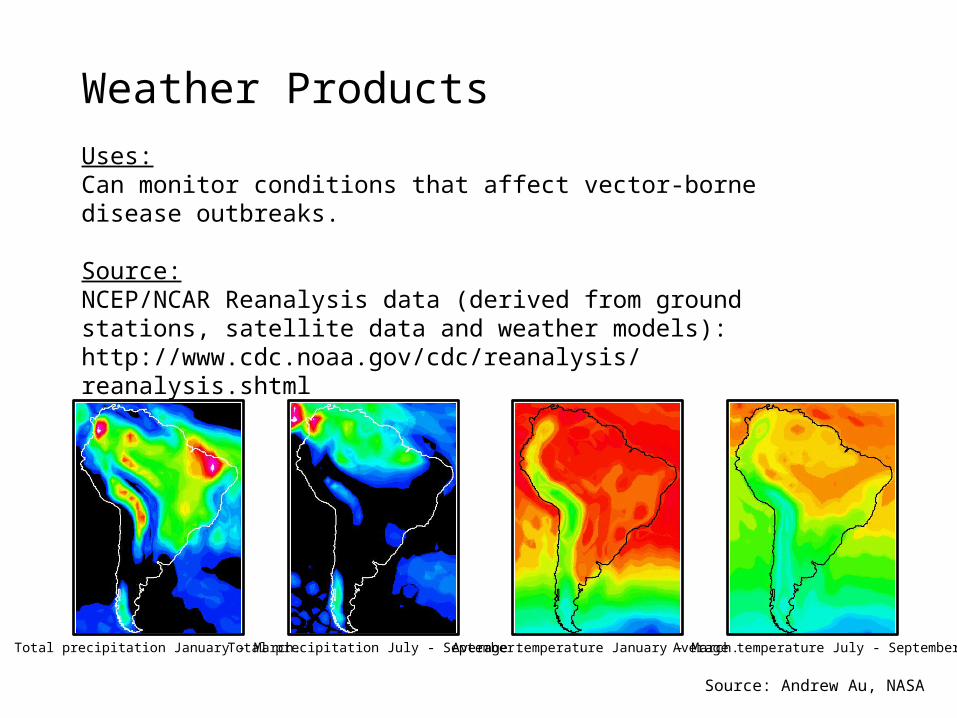
Weather Products
Uses: Can monitor conditions that affect vector-borne disease outbreaks.
Source:NCEP/NCAR Reanalysis data (derived from ground stations, satellite data and weather models):http://www.cdc.noaa.gov/cdc/reanalysis/reanalysis.shtml
Total precipitation January - March. Total precipitation July - September. Average temperature January - March. Average temperature July - September.
Source: Andrew Au, NASA
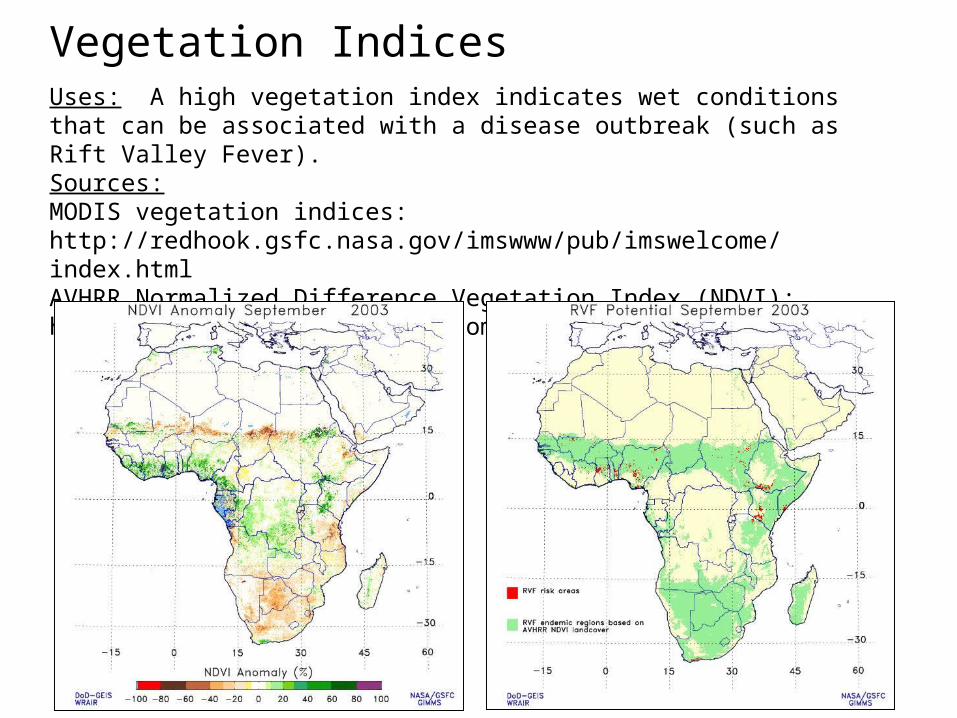
Vegetation IndicesUses: A high vegetation index indicates wet conditions that can be associated with a disease outbreak (such as Rift Valley Fever). Sources:MODIS vegetation indices:http://redhook.gsfc.nasa.gov/imswww/pub/imswelcome/index.htmlAVHRR Normalized Difference Vegetation Index (NDVI):http://edcdaac.usgs.gov/1KM/comp10d.html
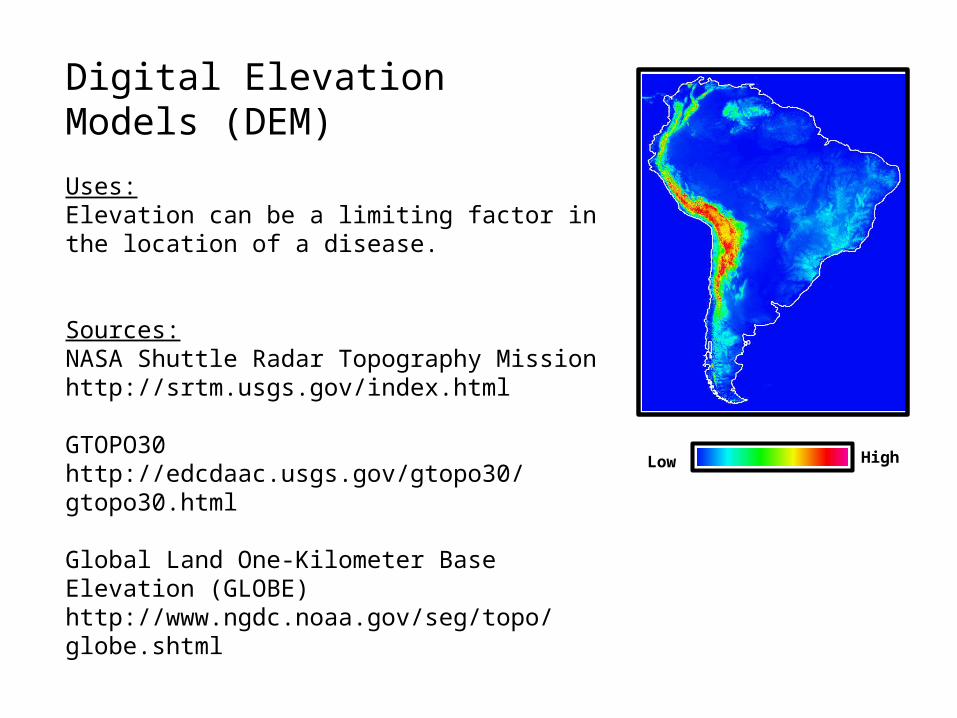
Digital Elevation Models (DEM)
Uses:Elevation can be a limiting factor in the location of a disease.
Sources:NASA Shuttle Radar Topography Missionhttp://srtm.usgs.gov/index.html
GTOPO30http://edcdaac.usgs.gov/gtopo30/gtopo30.html
Global Land One-Kilometer Base Elevation (GLOBE)http://www.ngdc.noaa.gov/seg/topo/globe.shtml
Low High
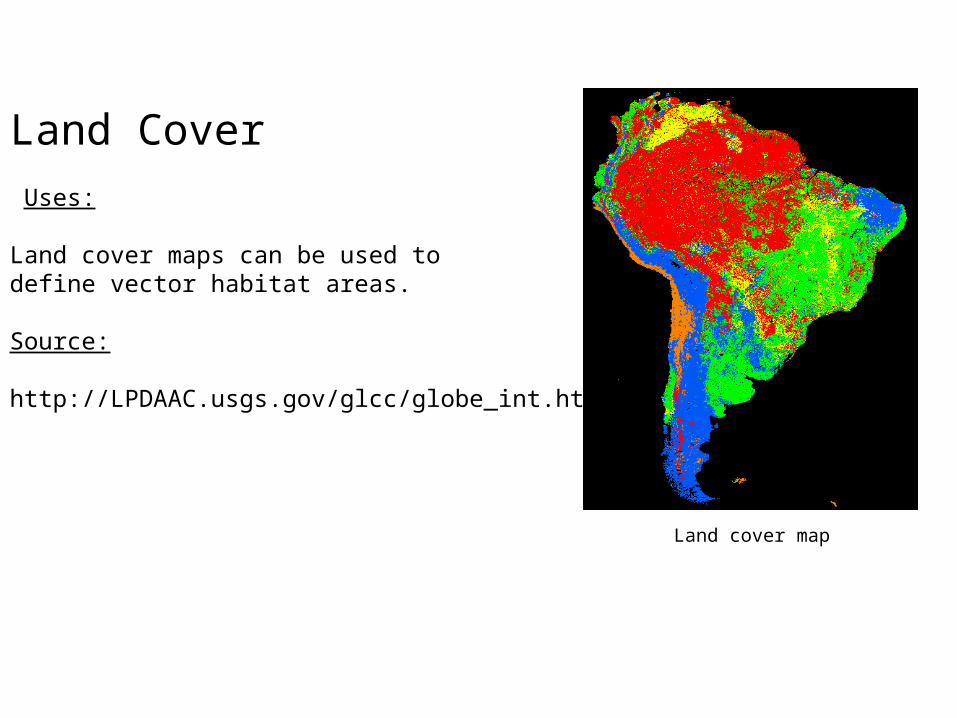
Land Cover
Uses:
Land cover maps can be used to define vector habitat areas.
Source:
http://LPDAAC.usgs.gov/glcc/globe_int.html
Land cover map
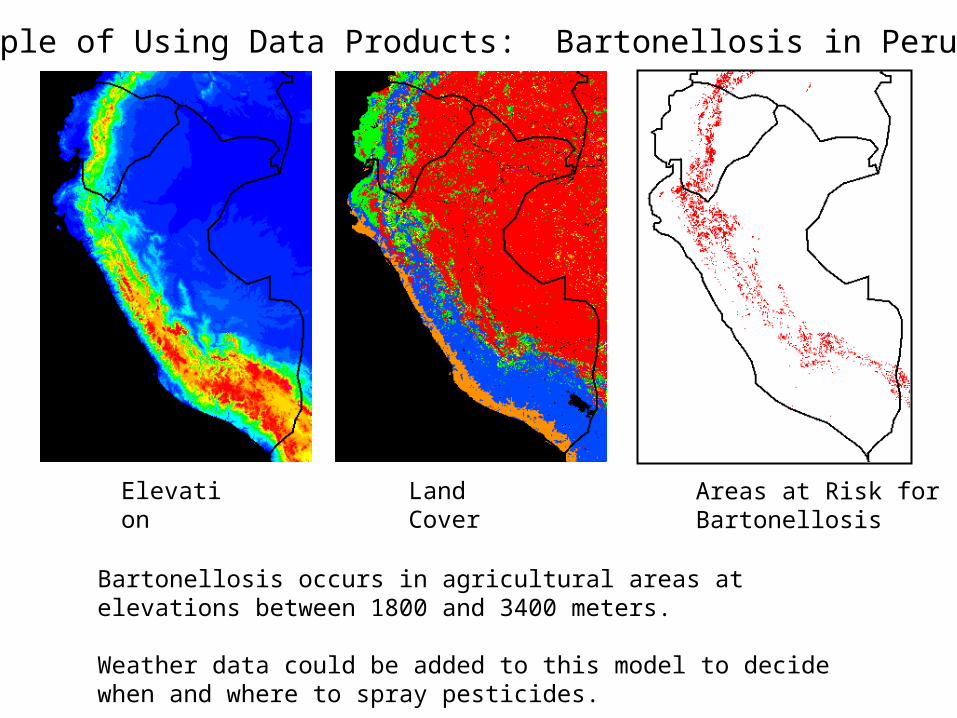
Bartonellosis occurs in agricultural areas at elevations between 1800 and 3400 meters.
Weather data could be added to this model to decide when and where to spray pesticides.
Elevation Land Cover Areas at Risk for Bartonellosis
Example of Using Data Products: Bartonellosis in Peru
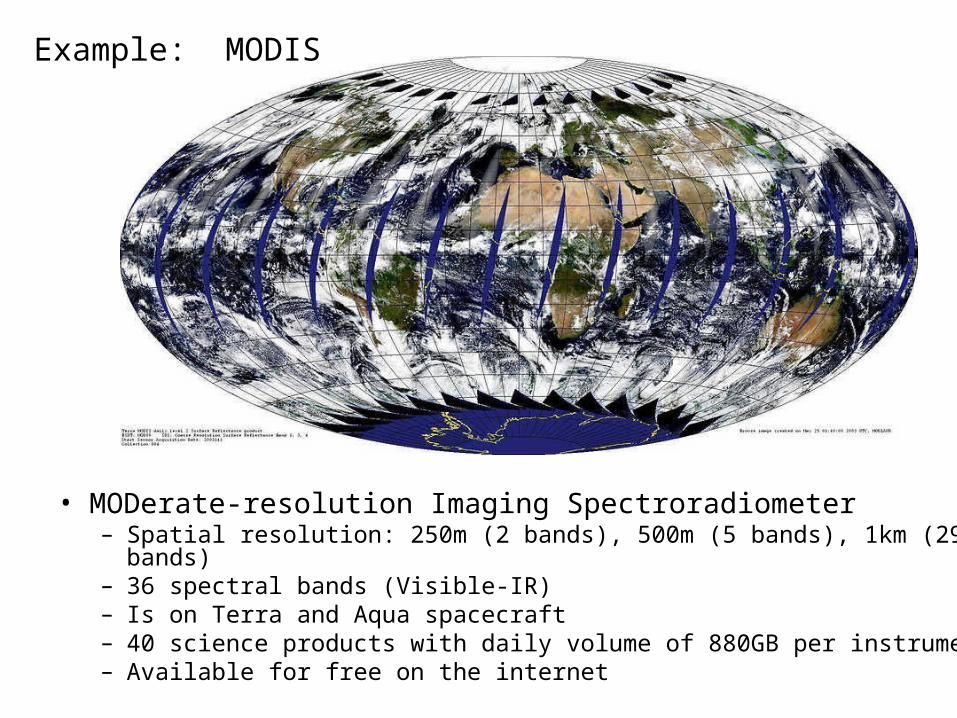
• MODerate-resolution Imaging Spectroradiometer – Spatial resolution: 250m (2 bands), 500m (5 bands), 1km (29 bands)– 36 spectral bands (Visible-IR)– Is on Terra and Aqua spacecraft– 40 science products with daily volume of 880GB per instrument– Available for free on the internet
Example: MODIS
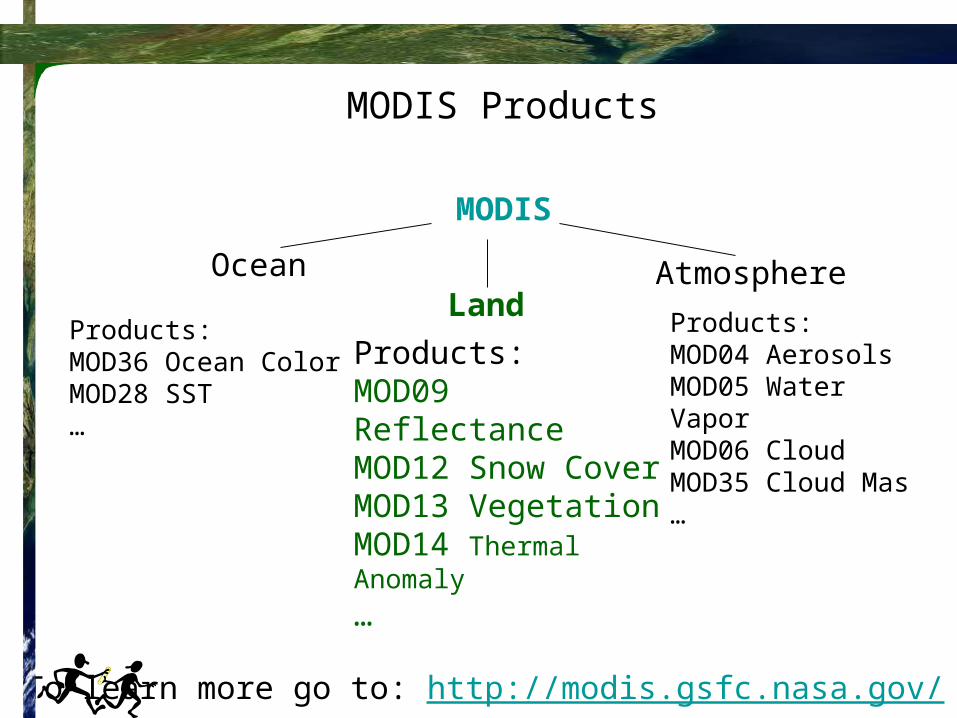
MODIS Products
MODIS
OceanLand
Atmosphere
Products:MOD36 Ocean ColorMOD28 SST…
Products:MOD04 AerosolsMOD05 Water VaporMOD06 CloudMOD35 Cloud Mas…
Products:MOD09 ReflectanceMOD12 Snow CoverMOD13 VegetationMOD14 Thermal Anomaly
…
To learn more go to: http://modis.gsfc.nasa.gov/
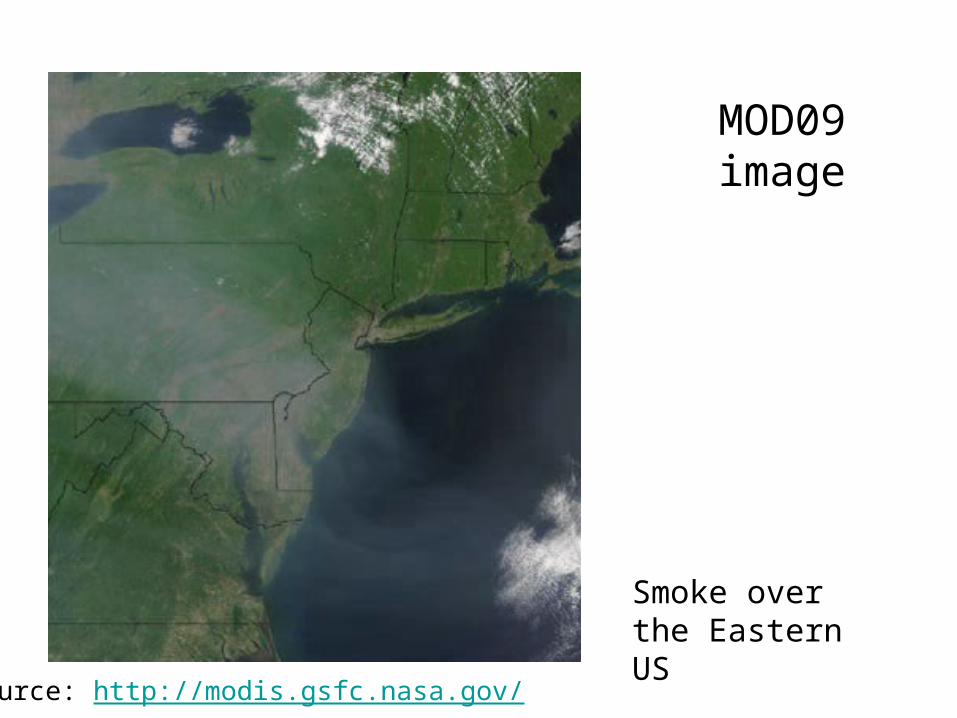
MOD09 image
Smoke over the Eastern US
Source: http://modis.gsfc.nasa.gov/
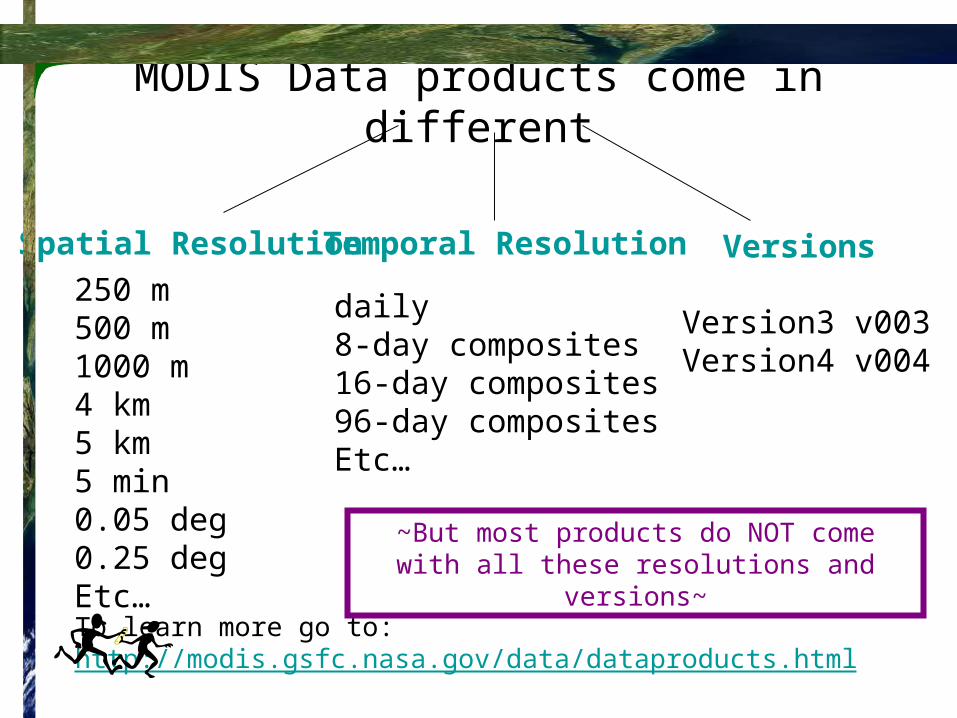
MODIS Data products come in different
Spatial Resolution
250 m500 m1000 m4 km5 km5 min0.05 deg0.25 degEtc…
Temporal Resolution Versions
daily8-day composites16-day composites96-day compositesEtc…
Version3 v003Version4 v004
To learn more go to: http://modis.gsfc.nasa.gov/data/dataproducts.html
~But most products do NOT come with all these resolutions and versions~
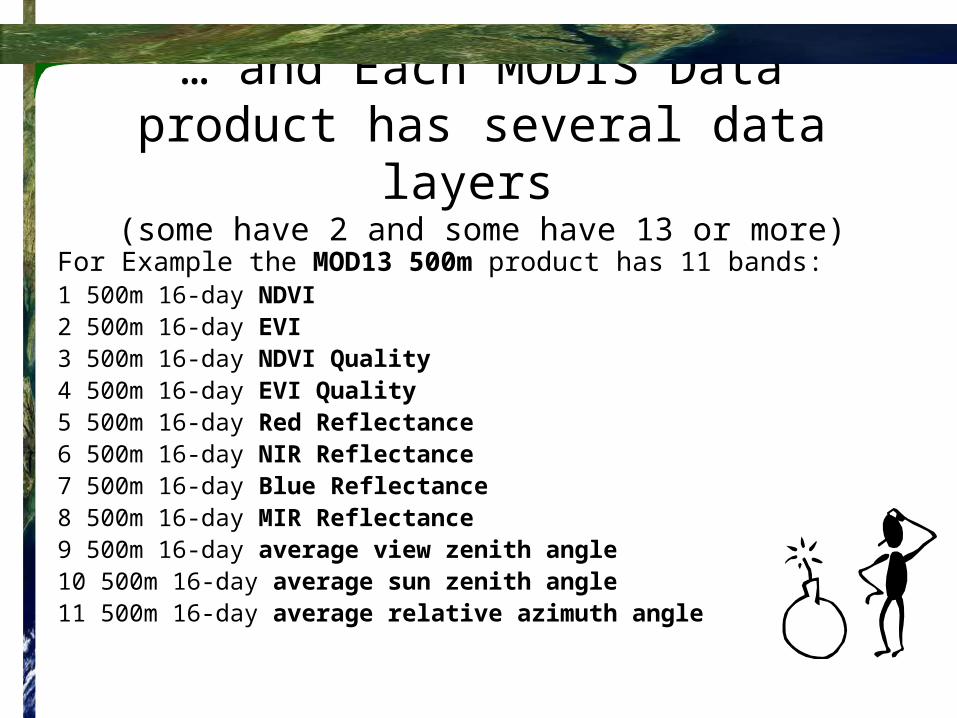
… and Each MODIS Data product has several data layers
(some have 2 and some have 13 or more)
For Example the MOD13 500m product has 11 bands:1 500m 16-day NDVI2 500m 16-day EVI3 500m 16-day NDVI Quality4 500m 16-day EVI Quality5 500m 16-day Red Reflectance6 500m 16-day NIR Reflectance7 500m 16-day Blue Reflectance8 500m 16-day MIR Reflectance9 500m 16-day average view zenith angle10 500m 16-day average sun zenith angle11 500m 16-day average relative azimuth angle
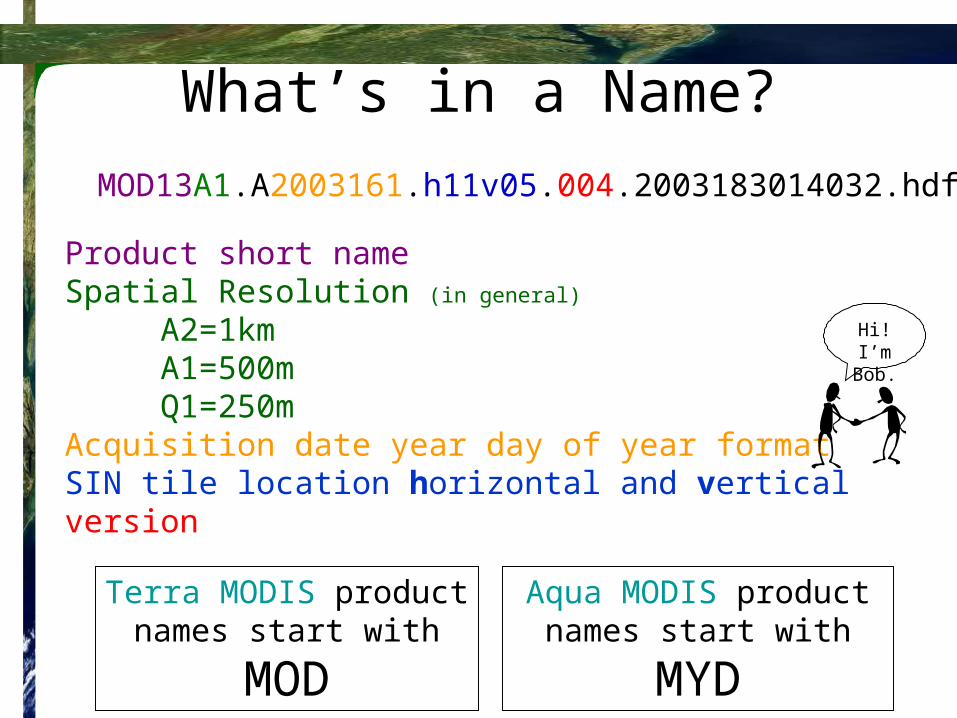
What’s in a Name?
MOD13A1.A2003161.h11v05.004.2003183014032.hdf
Product short nameSpatial Resolution (in general)
A2=1kmA1=500mQ1=250m
Acquisition date year day of year formatSIN tile location horizontal and verticalversion
Hi! I’m Bob.
Terra MODIS product
names start with MODAqua MODIS product
names start with MYD
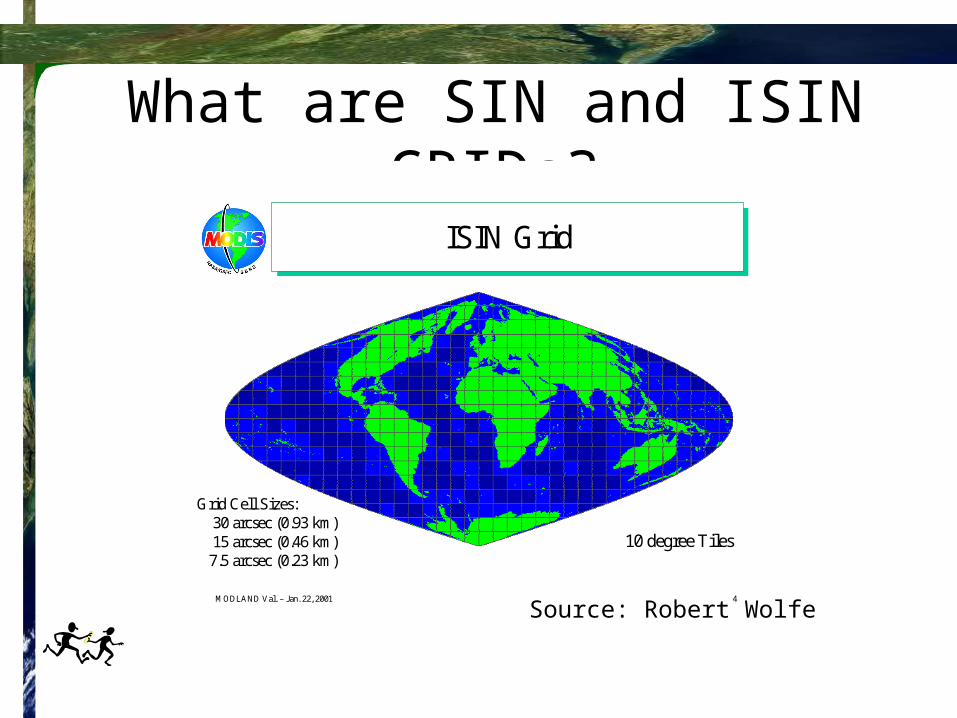
What are SIN and ISIN GRIDs?
MODLAND Val. – Jan. 22, 2001 4
ISIN GridISIN Grid
10 degree Tiles
Grid Cell Sizes:30 arcsec (0.93 km)15 arcsec (0.46 km)7.5 arcsec (0.23 km)
Source: Robert Wolfe
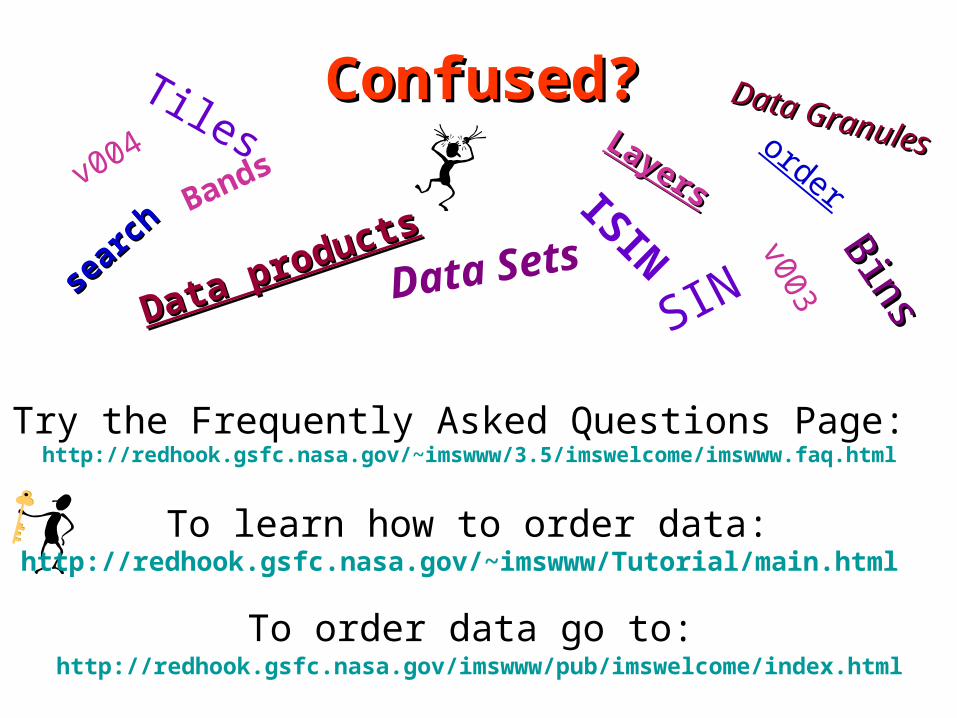
To order data go to:http://redhook.gsfc.nasa.gov/imswww/pub/imswelcome/index.html
To learn how to order data:http://redhook.gsfc.nasa.gov/~imswww/Tutorial/main.html
Confused?Confused?
Data products
Data products
Data Sets
Data Granules
Data Granules
Tiles
SIN
ISIN BinsBins
Try the Frequently Asked Questions Page: http://redhook.gsfc.nasa.gov/~imswww/3.5/imswelcome/imswww.faq.html
Layers
LayersBandsv003
v004
sear
ch
sear
ch
order
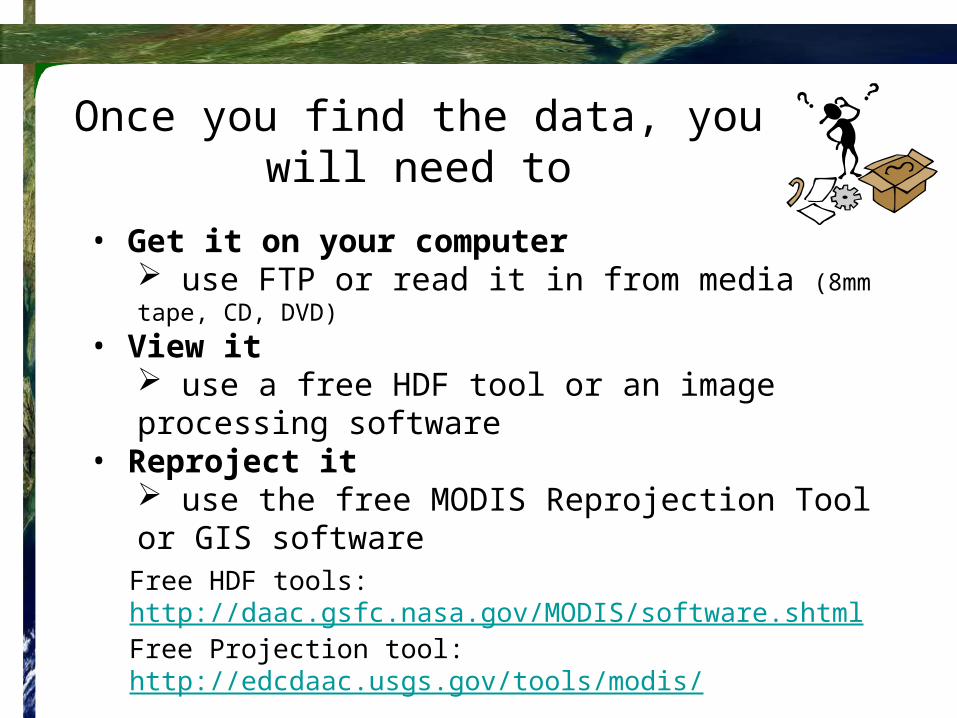
Once you find the data, you will need to
Free HDF tools: http://daac.gsfc.nasa.gov/MODIS/software.shtmlFree Projection tool: http://edcdaac.usgs.gov/tools/modis/
• Get it on your computer use FTP or read it in from media (8mm tape, CD, DVD)
• View it use a free HDF tool or an image processing software
• Reproject it use the free MODIS Reprojection Tool or GIS software
At this point you may be saying:
Help!!!I don’t know how to process
remote sensing data!
NASA may be able to help…
Example Customized MODIS Products for Federal Agencies: MODIS Rapid Response System
History– Summer 2000, MODIS images used by US Forest Service in
fighting fires in Montana/Idaho– 2001 Rapid Response system produced automated, near real
time MODIS images for monitoring fires and other natural hazards – Products are posted on the web within 3-6 hours from acquisition
http://rapidfire.sci.gsfc.nasa.gov
Applications and Customers– US Forest Service - active fire locations– USDA Foreign Agricultural Service – monitoring crop stress and
drought– Department of Defense – mission planning/monitoring weather
and dust in Afghanistan and Iraq– Environmental Protection Agency – monitoring hazardous
material sites, Iraq war (smoke)
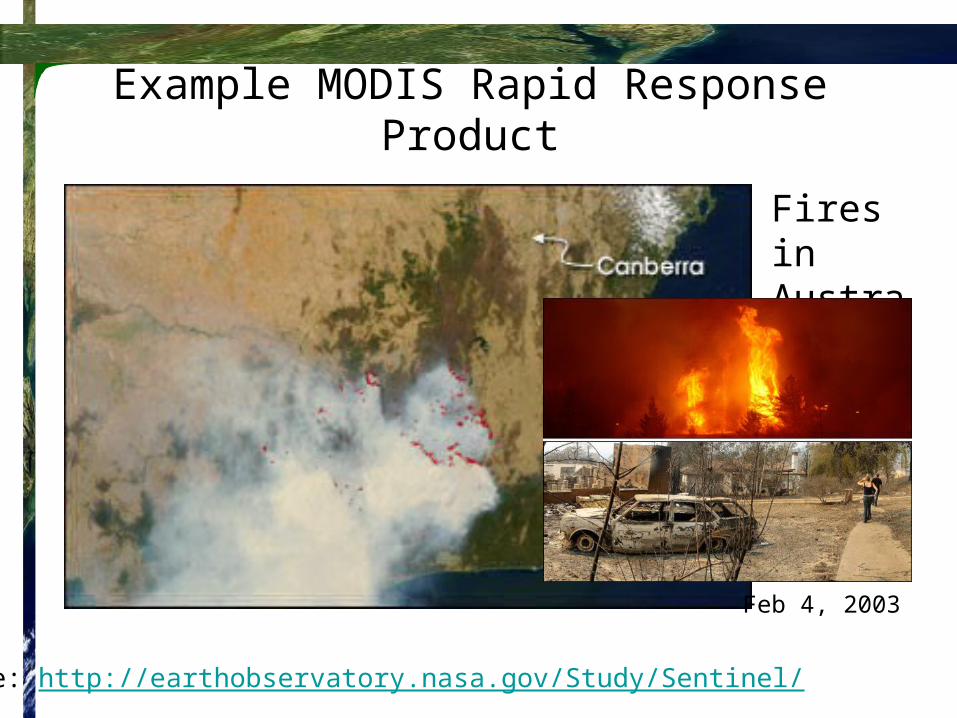
Example MODIS Rapid Response Product
Fires in Australia
Source: http://earthobservatory.nasa.gov/Study/Sentinel/
Feb 4, 2003
Discussion
There are many remote sensing images and products currently available.
Use of the images/products requires a great deal of expertise.
Partnerships between remote sensing scientists, modelers, entomologists, etc. will be necessary to create effective decision support systems for disease prevention.
Thanks to the following people for helpful suggestions on this talk:
Robert Venezia
Timi Vann
Brian Zeichner
Richard Wells