Embed Size (px)
Citation preview

Remote Learning in the times of COVID-19: Insights from Rural India 1
Remote learning in the times of
COVID-19INSIGHTS FROM RURAL INDIA
Mayank Bhushan, Pratibha Joshi, and Sudhanshu Sharma, Central Square Foundation
Remote Learning in the times of COVID-19: Insights from Rural India 2

Remote Learning in the times of COVID-19: Insights from Rural India 3
In this study, we explore a largedataset from a phone-based survey of rural households in six Indian states to evaluate their readiness for remote learning.
Executive Summary 4
Key Findings 5
Introduction 6
Data Overview 7
Findings 11
Conclusion 33

Remote Learning in the times of COVID-19: Insights from Rural India 4
Executive SummaryThe COVID-19 pandemic resulted in school closures in India and around the globe. Estimates suggest that worldwide, over 1.2 billion children are currently out of their classrooms. As a result, education has changed dramatically, with the distinctive rise of remote learning. Central and state governments in India, as well as private schools, have devised and implemented various response programs involving remote learning.
Access to digital infrastructure is necessary for remote learning. Despite significant improvements in smartphone and internet penetration in India in recent years, equitable access to remote learning remains a challenge. The present report uses data1 from 38,507 students of 183 Satya Bharti Schools operating in the rural areas of six Indian states to understand the dynamics of remote learning during the COVID-19 pandemic.
1 We are grateful to Bharti Foundation for sharing the data from their large-scale phone survey of Satya Bharti School students. We are thankful to Mamta Saikia, Binu Nair, Antony Nellissery, and Amit Taneja of the Bharti Foundation for their insights. The authors would also like to thank Jayshree Oza, Gouri Gupta, Shruti Gogia, Rhea Handa, Tania Goklany, and all colleagues at CSF, for their inputs and comments. All errors are our own.

Low-tech and easy-to-adopt solutions are likely to play
an important role in remote
learning in rural India
Key findings of our study sample
The average number of hours
of phone access was almost equal for boys and girls
across states in our sample
A high school student has access to a phone
for 30 minutes more than a pre-primary student
A secondary school student and a senior secondary
school student get an additional 1 hour, 16 minutes, and 2 hours of phone access, respectively, compared
to a pre-primary school student
A child in a rural household spends an additional 1 hour and 16 minutes on the phone if she/he is attending
classes on both WhatsApp and phone calls, compared to
a child without any access to a remote learning device
We found no difference in daily time spent on the phone
between boys and girls
Less than a quarter of all households in
our sample owned a radio, but television
penetration was higher and, therefore,
could be a useful medium to advance remote learning
On average, 78% of the sample households had
at least one WhatsApp-enabled phone and
were in sync with the ASER findings
In the household, fathers were more likely to have a WhatsApp-enabled phone than
mothers. This was true for all six states in
our study
Children tended to get more screen time when
the mother had a phone in a household rather
than only the father having a phone.
Device ownership mattered
78%
When a father has a WhatsApp-enabled phone, it increases the child’s phone access by 24 minutes
(compared to a father without a phone). The same increase in phone access is observed when a mother has a WhatsApp-enabled phone, compared to
a mother not having a phone at all
Desktop availability in the household increases the
amount of phone screen time for the child by 54 minutes. Whereas, having a tablet results in 1 hour, 26 minutes of additional phone access for the child,
compared to not having any computing devices
(desktop/ laptop/ tablet) at home.

Remote Learning in the times of COVID-19: Insights from Rural India 6
IntroductionAs COVID-19 has disrupted education worldwide, governments and organizations are exploring remote learning and education technology models to provide children with access to learning and mitigate learning loss. School closures around the world have made remote learning the de-facto mode of education. It has also brought to the fore the issue of equitable access to EdTech, because without equitable access, the benefits of EdTech might accrue only to those with the means to take advantage of it.
Access is sine qua non for leveraging EdTech. Hence, remote learning solutions are only meaningful for those with access to a radio, TV or a digital device (mobile, tablet, laptop) along with a stable and consistent internet connection for online learning. Access to digital infrastructure is a challenge in rural India. A study by KPMG-ICEA2, reveals that smartphone penetration in rural India rose from 9% in 2015 to 25% in 2018.
However, there is great variation in smartphone penetration between states, as well as between rural and urban areas in those states. Mobile-internet penetration in rural India remains as low as 18% according to a report3 by the Internet and Mobile Association of India (IAMAI). Widespread access to phones, as well as the internet, will be required before rural areas can take full advantage of EdTech in schools.
In this study, we explore a large dataset from a phone-based survey of rural households in six Indian states to evaluate their readiness for remote learning.
Specifically, we examine who gets access to a device and for how long, and we also study the associated factors. A broader objective of this study is to bring data from rural India to inform the debate on equitable access to technology for rural households.
2 Contribution of Smart Phones to Digital Governance in India3 Mobile internet penetration in rural India is just 18%: report

The data for this study comes from a phone-based survey of households whose children attend the Satya Bharti Schools, a flagship program of the Bharti Foundation. This program focuses on the holistic development of children with an active involvement of the community and parents. A phone-based survey was conducted in June 2020, with parents of 38,507 students from 183 schools spread across six states (see Figure 1).
DataOverview
Phone-based survey of parents of 38,507 students from 183 Satya Bharti schools spread across six states in India

Remote Learning in the times of COVID-19: Insights from Rural India 8
Of the 183 Satya Bharti schools, 148 schools are primary schools4, 30 are elementary schools5 and five are senior secondary schools6. These schools are spread over three districts in Punjab, five districts in Haryana, two each in Rajasthan and Uttar Pradesh, and one district each in Tamil Nadu andWest Bengal. Given these characteristics of the sample, it is important to note that the data from the surveys conducted by the Satya Bharti schools is not representative at the state level.
Haryana
Schools
Schools
Students Per School
Students Per School
Elementary
Punjab
Primary
Rajasthan
Sr. Secondary
Tamil Nadu Uttar Pradesh West Bengal
200
300
1000
100
500
0
0
Figure 1: Number of schools and students surveyed per school by state
Figure 2: Number of schools and students surveyed per school type
38
30
151
280
86
148
231
166
28
5
229
1,105
9
209
12 10
254
151
States
School Types
The surveys were conducted by the teachers of Satya Bharti schools using a centrally designedtemplate. The respondents were predominantly rural women. The aim of the survey was to understand access to technology in rural households in light of the home-based education program implemented in response to school closures due to the COVID-19 pandemic.
Source: Authors’ calculations using Bharti Foundation data
4 Primary schools have grades from pre-primary to Grade 55 Elementary schools have grades from pre-primary to Grade 86 Senior secondary schools have grades from pre-primary to Grade 12

Remote Learning in the times of COVID-19: Insights from Rural India 9
Table 1 shows that senior secondary schools also had more students who were surveyed per school in every grade compared to both primary and elementary schools.
As per the sample, data was collected only from primary schools in Haryana, Tamil Nadu, Uttar Pradesh and West Bengal. Data from Rajasthan was collected from primary as well as elementary schools. The data from Punjab came from five senior secondary schools, in additionto primary and elementary schools.
Class\School Type
Pre-primary
Class 1
Class 2
Class 3
Class 4
Class 5
Class 6
Class 7
Class 8
Class 9
Class 10
Class 11
Class 12
Grand Total
Elementary
24
29
33
45
31
31
31
30
26
0
0
0
0
280
Primary
27
30
31
32
28
19
0
0
0
0
0
0
0
167
Sr.Secondary
57
58
57
57
55
57
135
138
141
136
93
84
39
1,107
Table 17: Students per class by school type
As shown in Figure 2, senior secondary schools with a large number of students per school (1,105) were surveyed. This was in part due to the fact that senior secondary schools have more grades (than primary and elementary schools) and, therefore, more students overall.
7 A class can have multiple sections
Source: Authors’ calculations using Bharti Foundation data

Remote Learning in the times of COVID-19: Insights from Rural India 10
Schools
Boys %
Students Per School
Girls %
Pre Primary
Class 1
Class 2
Class 3
Class 4
Class 5
Class 6
Class 7
Class 8
Class 9
Class 10
Class 11
Class 12
1,000
800
600
400
200
0
70
60
50
40
30
20
10
0
Figure 3: Number of schools and students surveyed per school by state and school type
Figure 4: Percentage of surveyed boys and girls by grade
38 205
61
151246
155
1,105
School Types
PunjabHaryana Rajasthan Tamil Nadu Uttar Pradesh West Bengal
ElementaryPrimarySenior Secondary
10 18 9 12 10
346
164 209254
151
The number of boys and girls surveyed were roughly the same in each grade. Major differences can be seen in Grades 10, 11 and 12, which had 55%, 62% and 58% girls, respectively.
4851 50 48 50 50 5250 52 50 50 48 49 52 52
4945
3842
48 48 48 5155
6258
Source: Authors’ calculations using Bharti Foundation data
Source: Authors’ calculations using Bharti Foundation data

Findings
Remote Learning in the times of COVID-19: Insights from Rural India 12
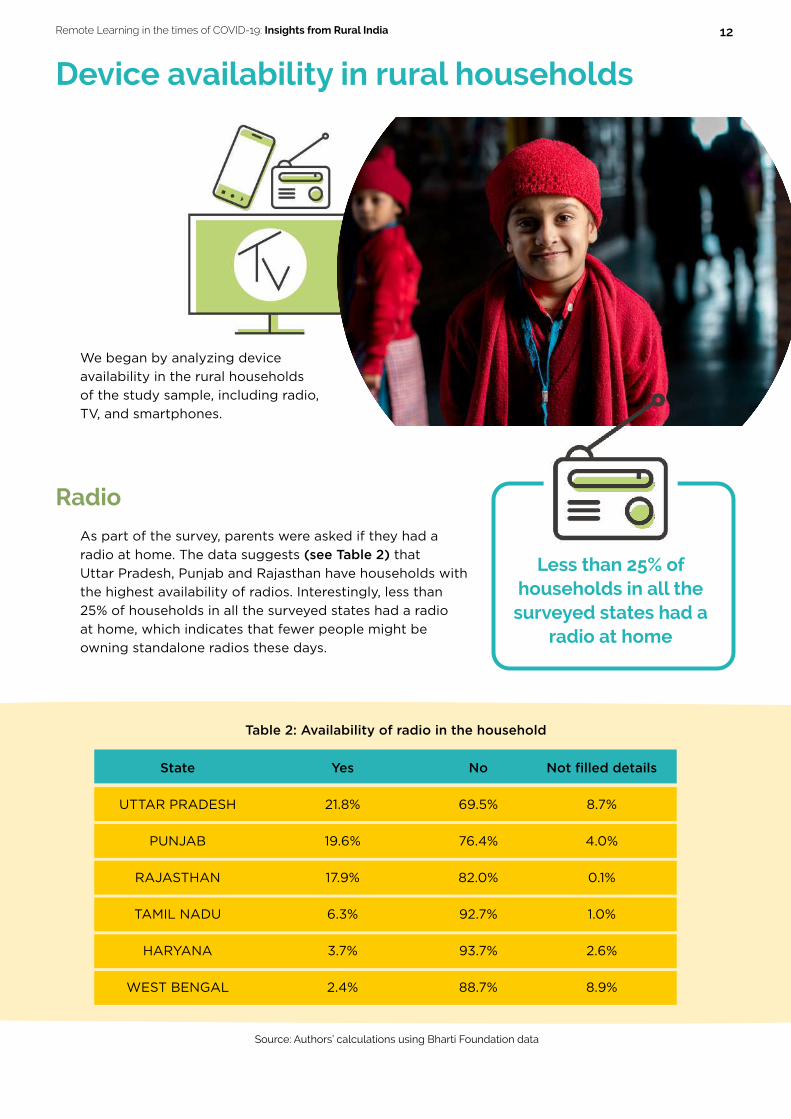
As part of the survey, parents were asked if they had a radio at home. The data suggests (see Table 2) thatUttar Pradesh, Punjab and Rajasthan have households with the highest availability of radios. Interestingly, less than 25% of households in all the surveyed states had a radioat home, which indicates that fewer people might be owning standalone radios these days.
We began by analyzing device availability in the rural householdsof the study sample, including radio, TV, and smartphones.
Radio
Device availability in rural households
State
UTTAR PRADESH
PUNJAB
RAJASTHAN
TAMIL NADU
HARYANA
WEST BENGAL
Yes
21.8%
19.6%
17.9%
6.3%
3.7%
2.4%
No
69.5%
76.4%
82.0%
92.7%
93.7%
88.7%
Not filled details
8.7%
4.0%
0.1%
1.0%
2.6%
8.9%
Table 2: Availability of radio in the household
Less than 25% of households in all the
surveyed states had a radio at home
Source: Authors’ calculations using Bharti Foundation data

Remote Learning in the times of COVID-19: Insights from Rural India 13
State
TAMIL NADU
HARYANA
PUNJAB
WEST BENGAL
UTTAR PRADESH
RAJASTHAN
Gender
Boy
Girl
TV available
97.1%
88.8%
86.7%
54.1%
40.1%
34.7%
TV available
74.2%
73.5%
TV not available
2.0%
8.4%
8.8%
33.0%
51.1%
65.2%
TV not available
21.7%
22.6%
Not filled details
0.9%
2.8%
4.5%
12.9%
8.8%
0.1%
Not filled details
4.1%
3.9%
Table 3: Availability of television in the household
Table 4: Access to television in the household by gender
There is no disparity in availability of local cable or DTH at home when there is a girl in the household, compared to when there is a boy in the household (see Table 4).
No disparity in availability of
local cable or DTH
Parents were asked if they were cable/ pay TV subscribers. If yes, they were asked to specify the type of TV connection they had at home. In states like Punjab, Haryana and Tamil Nadu (see Table 3), more than 80% of the households either had a local cable connection or a DTH connection. In these states, distance learning can be made available at least by broadcasting educational television programs. In contrast, a large percentage of households in Uttar Pradesh (51.1%) and Rajasthan (65.2%) did not possess a television.
Television
In Punjab, Haryana and Tamil Nadu, more than 80% of the households
had a TV and cable connection. But a large %age in Uttar Pradesh and Rajasthan did not
possess a TV.
Source: Authors’ calculations using Bharti Foundation data
Source: Authors’ calculations using Bharti Foundation data

Remote Learning in the times of COVID-19: Insights from Rural India 14
State
HARYANA
PUNJAB
RAJASTHAN
TAMIL NADU
UTTAR PRADESH
WEST BENGAL
Desktop
0.1%
0.9%
0.2%
0.1%
0.0%
0.1%
Laptop
0.2%
0.5%
0.3%
0.2%
0.5%
0.0%
Tablet
0.0%
0.1%
0.0%
0.0%
0.0%
0.0%
None of the above
99.7%
98.5%
99.5%
99.7%
99.5%
99.9%
Table 5: Access to desktops/ laptops/ tablets in the household
Access to devices like laptops, desktops and tablets is really low in the six survey states (see Table 5) as more than 99% of households do not have access to them. This finding is not surprising, given that the cost of these devic-es is quite high for the average income levels of rural households.
Desktops/ Laptops/ Tablets
More than 99% of households do not have
access to Desktops/ Laptops/ Tablets
Source: Authors’ calculations using Bharti Foundation data
Remote Learning in the times of COVID-19: Insights from Rural India 15
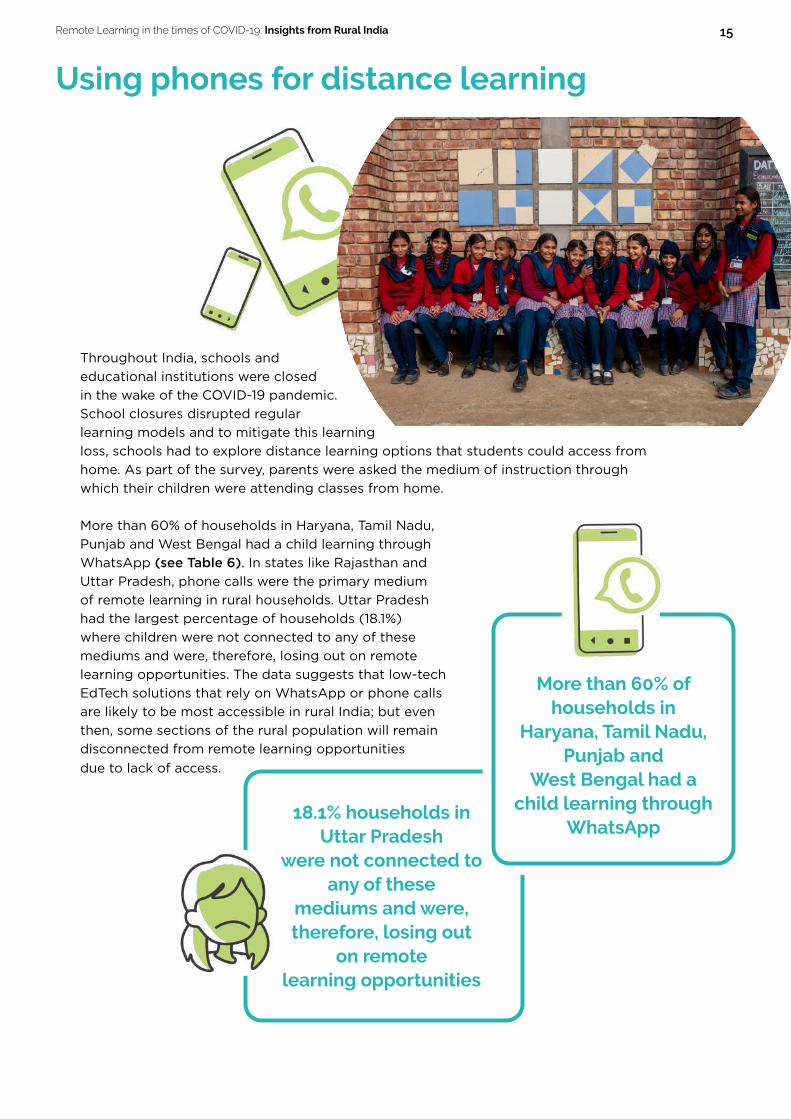
Throughout India, schools and educational institutions were closed in the wake of the COVID-19 pandemic. School closures disrupted regular learning models and to mitigate this learning loss, schools had to explore distance learning options that students could access from home. As part of the survey, parents were asked the medium of instruction through which their children were attending classes from home.
More than 60% of households in Haryana, Tamil Nadu, Punjab and West Bengal had a child learning through WhatsApp (see Table 6). In states like Rajasthan and Uttar Pradesh, phone calls were the primary medium of remote learning in rural households. Uttar Pradesh had the largest percentage of households (18.1%) where children were not connected to any of these mediums and were, therefore, losing out on remote learning opportunities. The data suggests that low-tech EdTech solutions that rely on WhatsApp or phone calls are likely to be most accessible in rural India; but even then, some sections of the rural population will remain disconnected from remote learning opportunities due to lack of access.
Using phones for distance learning
More than 60% of households in
Haryana, Tamil Nadu, Punjab and
West Bengal had a child learning through
WhatsApp18.1% households in
Uttar Pradesh were not connected to
any of these mediums and were, therefore, losing out
on remote learning opportunities

Remote Learning in the times of COVID-19: Insights from Rural India 16
HARYANA
PUNJAB
TAMIL NADU
WEST BENGAL
RAJASTHAN
UTTAR PRADESH
Overall
88%
85%
80%
67%
65%
38%
78%
12%
15%
20%
33%
35%
62%
22%
Table 7: Availability of a WhatsApp-enabled phone in the household
Table 6: Mode of accessing remote learning
For most states, these figures are in line with the ASER 20208 report, which finds WhatsApp to be the most common medium through which learning activities and materials were received.
The survey captures information on the availability and type of phones owned by fathers, mothers or other relatives in the household. We found that at least one household member (father/ mother/ other relative) from more than half the surveyed households in Haryana, Punjab, Tamil Nadu, West Bengal and Rajasthan had a WhatsApp-enabled phone9 (see Table 7). However, only 38% of households surveyed in Uttar Pradesh had access to a WhatsApp-enabled phone.
Phone availability
State
HARYANA
TAMIL NADU
PUNJAB
WEST BENGAL
RAJASTHAN
UTTAR PRADESH
88.0%
69.1%
65.7%
65.0%
31.3%
29.3%
Phone Calls
8.7%
28.1%
10.2%
25.0%
43.1%
44.3%
WhatsApp+Phone Calls
0.2%
0.5%
20.1%
0.3%
21.7%
8.3%
Not Connected
3.1%
2.3%
4.0%
9.7%
3.9%
18.1%
More than half the surveyed households
had a WhatsApp-enabled phone
At least one household member has a
WhatsApp-enabled phone
No household member has a WhatsApp-enabled
phoneState
Source: Authors’ calculations using Bharti Foundation data
Source: Authors’ calculations using Bharti Foundation data
8 Annual Status of Education Report (Rural) 2020 Wave 19 A WhatsApp-enabled phone is any phone that can run the WhatsApp application

Remote Learning in the times of COVID-19: Insights from Rural India 17
According to the ASER (Rural) 2020 Wave 1 Report10 released in October last year, more than 60% of enrolled school children live in families with at least one smartphone. This proportion has seen a drastic increase over the last two years, going from 36.5% to 61.8% among enrolled school children. Estimates from our sample suggest that, on an average, 78% of rural households had at least one WhatsApp-enabled phone and were in sync with the ASER findings.
Our analysis of device availability in rural households has implications for the designing of EdTech programs, especially for optimal technology deployment. On an average, radio availability in rural households remains quite low. With improvements in income levels, it is likely that rural households have upgraded from radio to television over time. This is corroborated by higher levels of TV availability in rural households than radio sets. Devices like computers and tablets are mostly unavailable in rural households. However, the availability of smartphones is much higher, perhaps because of their relative affordability. Overall, on the basis of device availability, television and smartphone-based EdTech solutions are likely to be most accessible for childrenin rural India.
More than 60% of enrolled school
children live in families with at least one
smartphone
This has seen a drastic increase over the last two years, going from 36.5% to 61.8% among
enrolled school children
- ASER (Rural) 2020 Report
36.5%
61.8%
10 Annual Status of Education Report (Rural) 2020 Wave 1

Remote Learning in the times of COVID-19: Insights from Rural India 18
4G seems to be the most prevalent mode of connectivity for rural households. In Punjab, around three-fourths of the surveyed households used a 4G network connection (see Table 8). Broadband has almost no users in these states, except for Tamil Nadu, where 11.7% of the households had a broadband connection. It should be noted, however, that respondents may not always know the type of connectivity on their phones.
Of the total households where at least one family member (father/ mother/ other relative) had a WhatsApp-enabled phone, approximately 80% were connected via a 4G phone (see Table 9). This was followed by 3G, which was used by 12% of the households surveyed.
Connectivity
In Punjab, around three-fourths of the
surveyed households used a 4G network
connection
Table 8: Mode of connectivity for rural households
State
PUNJAB
HARYANA
WEST BENGAL
TAMIL NADU
RAJASTHAN
UTTAR PRADESH
4G
75.6%
71.3%
65.6%
43.0%
39.5%
39.0%
3G
9.5%
14.5%
0.4%
17.6%
13.8%
0.0%
2G
7.8%
10.0%
16.9%
20.8%
16.5%
3.5%
Broadband
0.3%
0.8%
0.0%
11.6%
0.0%
0.0%
Not filled details
6.8%
3.4%
17.1%
7.0%
30.2%
57.5%
Source: Authors’ calculations using Bharti Foundation data

Remote Learning in the times of COVID-19: Insights from Rural India 19
PUNJAB
HARYANA
TAMIL NADU
RAJASTHAN
UTTAR PRADESH
WEST BENGAL
226
216
205
196
195
190
Table 9: Mode of connectivity in households with at least one WhatsApp-enabled phone
Table 10: Average monthly mobile recharge amount of households
Punjab led the surveyed states in terms of average monthly mobile phone recharge amount, with households spending approximately INR 226 on average per month (see Table 10). Punjab was followed by Haryana and Tamil Nadu, whose rural households also spent more than INR 200 per month on mobile recharge (INR 216 and INR 205, respectively). Households in Uttar Pradesh, Rajasthan and West Bengal spent less than INR 200 per month on mobile phone recharge.
Household type
No household member has a WhatsApp -enabled phone
At least one of father/mother/ relative has a WhatsApp -enabled phone
Broadband
1.2%
0.7%
4G
9.3%
79.7%
3G
3.9%
12.1%
2G
24.2%
6.2%
Not filled details
61.5%
1.2%
Punjab led states with avg monthly phone
recharge amount, with households spending ~INR 226/ month on
an average
State Average Monthly Recharge Amount (INR)
Monthly recharge
Source: Authors’ calculations using Bharti Foundation data
Source: Authors’ calculations using Bharti Foundation data

Remote Learning in the times of COVID-19: Insights from Rural India 20
A child’s access to a phone could depend upon a host of factors beyond mere availability of phones and types of connectivity in the household. Who owned the phone—the mother or father—and the type of phone owned, could all have a bearing on a child’s access and usage of the mobile device. Some of these factors are discussed in detail below:
Phone ownership in rural households
Barring Uttar Pradesh, the fathers were found
to own a WhatsApp-enabled phone in more
than 50% of the households
This number was highest in Haryana, where
the fathers in ~81% of the households had a
WhatsApp-enabled phone
In Uttar Pradesh, the fathers in only 33.3% of the households had a
WhatsApp-enabled phone
With the exception of Uttar Pradesh, among the households surveyed across the six states, the fathers were found to own a WhatsApp-enabled phone in more than 50% of the households (see Table 11). This number was highest in Haryana, where the fathers in ~81% of the households had a WhatsApp-enabled phone. In Uttar Pradesh, the fathers in only 33.3% of the households had a WhatsApp-enabled phone.
Father’s phone

Remote Learning in the times of COVID-19: Insights from Rural India 21
Table 11: Father’s phone ownership by phone type
Table 12: Mother’s phone ownership by phone type
The mothers were found to have a WhatsApp-enabled phone in 50% of the households in Tamil Nadu, followed by 30.3% in Punjab (see Table 12). In all other states, less than 20% of the households had mothers with a WhatsApp-enabled phone, i.e., ~17% in Rajasthan, ~11% in Haryana and West Bengal, and 2.5% in Uttar Pradesh.
Mother’s phone
State
HARYANA
PUNJAB
TAMIL NADU
RAJASTHAN
WEST BENGAL
UTTAR PRADESH
State
TAMIL NADU
PUNJAB
RAJASTHAN
HARYANA
WEST BENGAL
UTTAR PRADESH
WhatsApp-enabled Phone
80.5%
67.5%
62.9%
59.1%
55.9%
33.3%
WhatsApp-enabled Phone
50.0%
30.3%
16.9%
10.8%
10.6%
2.5%
Basic Phone
14.7%
21.5%
29.4%
35.9%
27.7%
46.8%
Basic Phone
37.3%
24.5%
39.5%
17.6%
22.5%
8.4%
Phone Not Available
4.8%
11.0%
7.7%
5.0%
16.4%
19.9%
Phone Not Available
12.7%
45.2%
43.6%
71.6%
66.9%
89.1%
The mothers were found to have a WhatsApp-
enabled phone in 50% of the households in Tamil Nadu, followed by 30.3%
in Punjab
Source: Authors’ calculations using Bharti Foundation data
Source: Authors’ calculations using Bharti Foundation data

Remote Learning in the times of COVID-19: Insights from Rural India 22
Analyzing the distribution of the types of phones owned by the fathers and mothers from our sample states suggest that: (i) availability of phones for both fathers and mothers varies significantly across the states, and (ii) fathers are more likely to own a smartphone than the mothers, even in states with high smartphone penetration.
At-home learning is playing a critical role during the COVID-19 pandemic and is likely to play an important role in the future. State governments are introducing various initiatives to encourage digital learning; for example, tablet or smartphone distribution programs have been announced by the governments of Delhi, Haryana, Punjab, and West Bengal. Device ownership at the household level can have important implications for program designing, targeting and implementation of these initiatives. In this context, Tables 7 and 8 provide indicative data on phone ownership in rural India, which can be helpful for policy design.

Remote Learning in the times of COVID-19: Insights from Rural India 23
Parents from the survey households were asked for how much time their phones were available to their children. Their responses were captured in terms of the number of hours. In this section, we look at how the number of hours the phone is available to a child differs across states, by mother’s and father’s phone type and by the child’s gender.
Number of hours of phone access for rural children
Students in West Bengal had access to their household phone for an average of five hours (see Table 13). Punjab and Haryana came a distant second with children getting 2 hours and 18 minutes of phone access per day. According to the survey results, children in Tamil Nadu and Rajasthan had the least amount of phone access per day (1 hour and 18 minutes). Moreover, the average number of phone hours was almost equal for boys and girls across states in our sample study.
By State
The average number of phone hours was
almost equal for boys and girls across states
in our sample study
WEST BENGAL
PUNJAB
HARYANA
UTTAR PRADESH
TAMIL NADU
RAJASTHAN
4.9
2.3
2.2
1.7
1.3
1.3
5.0
2.2
2.2
1.7
1.3
1.3
4.9
2.4
2.2
1.6
1.3
1.3
Average no. of hours phone is available
with childOverall
Average no. of hours phone is available
with childBoys
Average no. of hours phone is available
with childGirls
State
Table 13: Average time spent on the phone by children
Source: Authors’ calculations using Bharti Foundation data

Remote Learning in the times of COVID-19: Insights from Rural India 24
Another way we look at this data is by comparing it across the combinations of phone types owned by mothers and fathers. We divide the data set into four combinations:(i) only mothers had WhatsApp-enabled phoned, (ii) both parents had WhatsApp-enabled phones, (iii) only fathers had WhatsApp-enabled phones, and (iv) none of the parents had WhatApp-enabled phones (see Table 14).
We find that the phone is available with the child for the most number of hours (2 hours and 42 minutes) when only the mother has a WhatsApp-enabled phone. This is followed by a household situation where both parents have a WhatsApp-enabled phone.
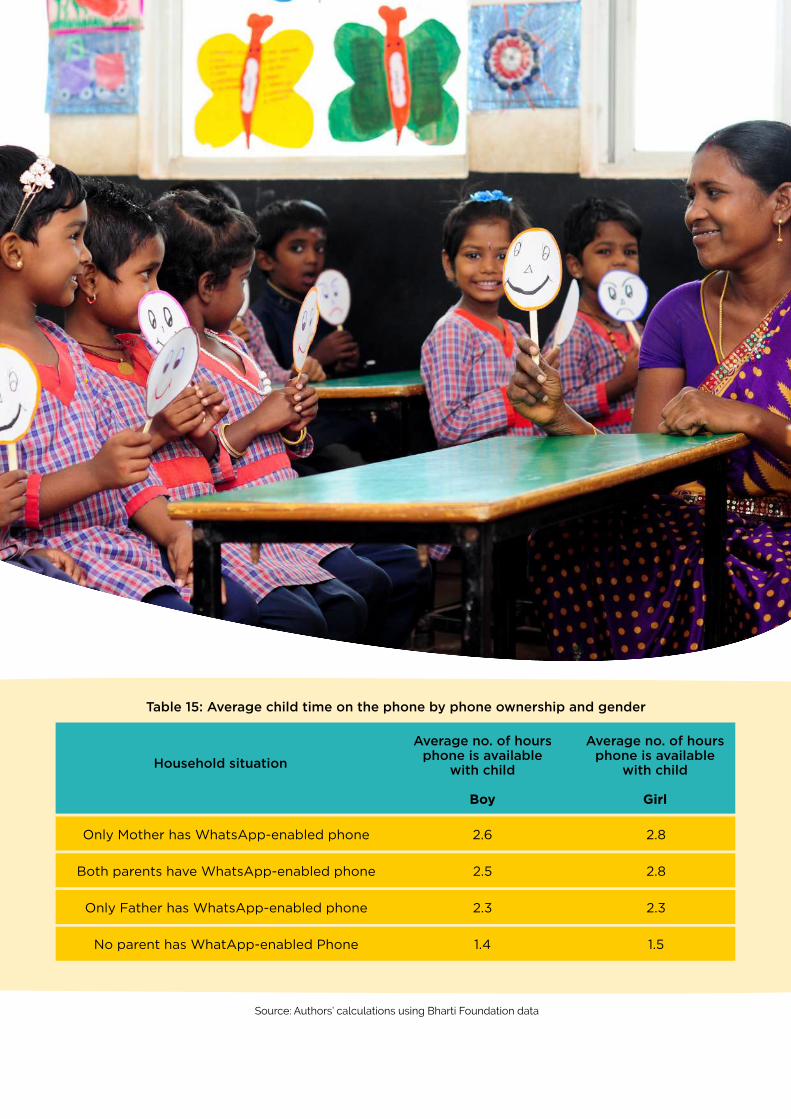
We find the same trends when we compare this against the gender of the child (see Table 15), although a girl child gets 12 additional minutes of phone access compared to a boy when only the mother in the household has a WhatsApp-enabled phone. For both boys and girls, phone access (in number of hours) is longer when only the mother has a WhatsApp-enabled phone compared to a household where only the father has a WhatsApp-enabled phone.
By ownership of father and/or mother
Phone is available with the child for the most
number of hours (2 hours and 42 minutes) when only the mother
has a WhatsApp-enabled phone
For both boys and girls, phone access (in number of hours) is
longer when only the mother has a WhatsApp-
enabled phone compared to a household where only the father has a WhatsApp-enabled phone.
Only Mother has WhatsApp-enabled phone
Both parents have WhatsApp-enabled phone
Only Father has WhatsApp-enabled phone
No parent has WhatApp-enabled Phone
2.7
2.6
2.3
1.4
2,996
5,905
18,990
10,616
Average no. of hours phone is available
with childNumber of householdsHousehold situation
Table 14: Average child time on the phone by phone ownership
Source: Authors’ calculations using Bharti Foundation data
Remote Learning in the times of COVID-19: Insights from Rural India 25
Only Mother has WhatsApp-enabled phone
Both parents have WhatsApp-enabled phone
Only Father has WhatsApp-enabled phone
No parent has WhatApp-enabled Phone
2.6
2.5
2.3
1.4
2.8
2.8
2.3
1.5
Average no. of hours phone is available
with child
Boy
Average no. of hours phone is available
with child
Girl
Household situation
Table 15: Average child time on the phone by phone ownership and gender
Source: Authors’ calculations using Bharti Foundation data

Remote Learning in the times of COVID-19: Insights from Rural India 26
To examine the relationship between how long children have access to a phone and their household attributes, we used the survey data to estimate a multiple regression model:
Yi=a+b1X1i+b2X2i+....+bkXki
The dependent variable, Yi, is the number of hours a day spent on the phone by a child. The household attributes we used for this regression were the student’s gender, caste, type of phone used by father, mother and relative, medium of attending classes, grade, type of internet connectivity and monthly recharge amount.
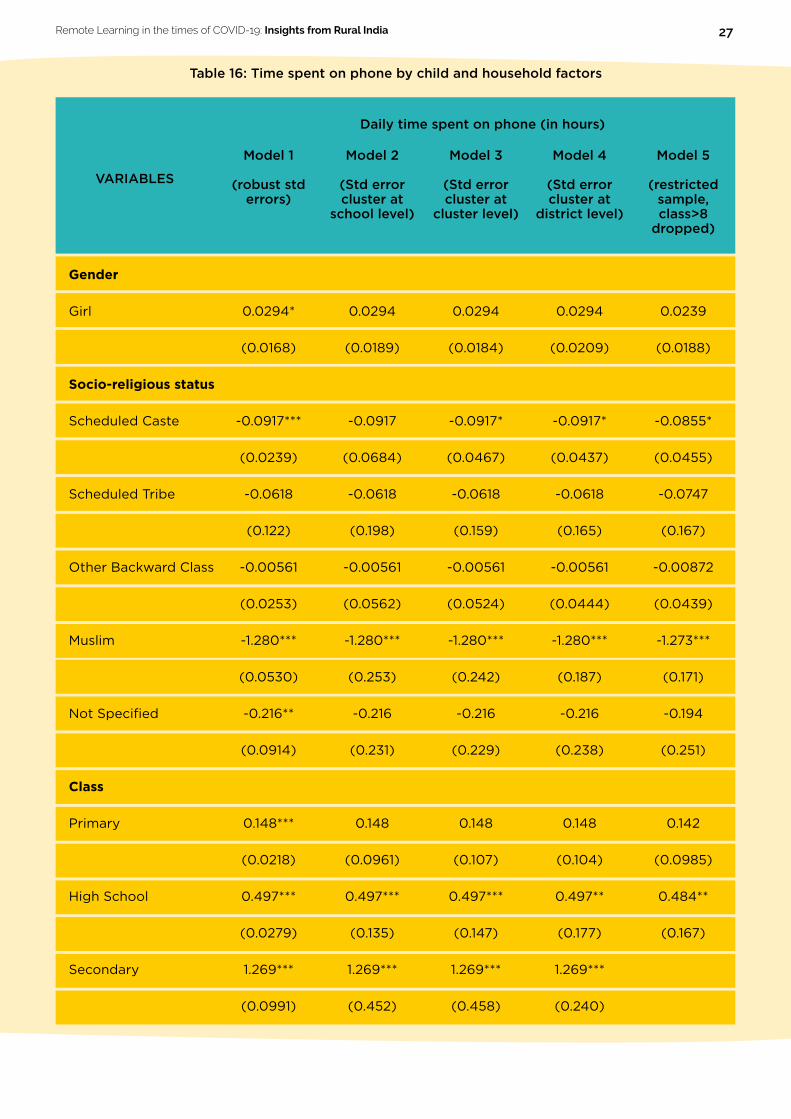
Table 16 presents the results of the regression. Models 1– 4 differ in the way the standard errors are handled. Our preferred model is Model 3 where standard errors are clustered at the cluster level11. Model 5 is run on a restricted sample of households where the child attends Grade 8 or lower. The estimates are robust across specifications.
We find that the grade in which the child is studying is positively correlated with the number of hours she/he gets to spend on the phone. A child in high school has a phone available to him/her for 30 minutes longer than a child in the pre-primary section. In addition, a child in secondary or senior secondary school gets an additional 1 hour, 16 minutes, and 2 hours of phone access, respectively, than a child in pre-primary school. These results are statistically significant. Interestingly, phone usage by a child seems equitable in our sample: there are no statistically significant differences between the daily usage of phones between boys and girls, or between different caste groups.
Table 16 also shows that a child in a rural household spends an additional 1 hour and 16 minutes on the phone if she/he is attending classes on both WhatsApp and phone calls compared to a child who is not connected, i.e., not accessing remote learning. The regression shows that when a father has a WhatsApp-enabled phone, it increases his child’s phone access by 24 minutes, compared to a child whose father does not have a phone. The same increase in phone access is observed when a mother has a WhatsApp-enabled phone compared to a child whose mother does not have a phone.
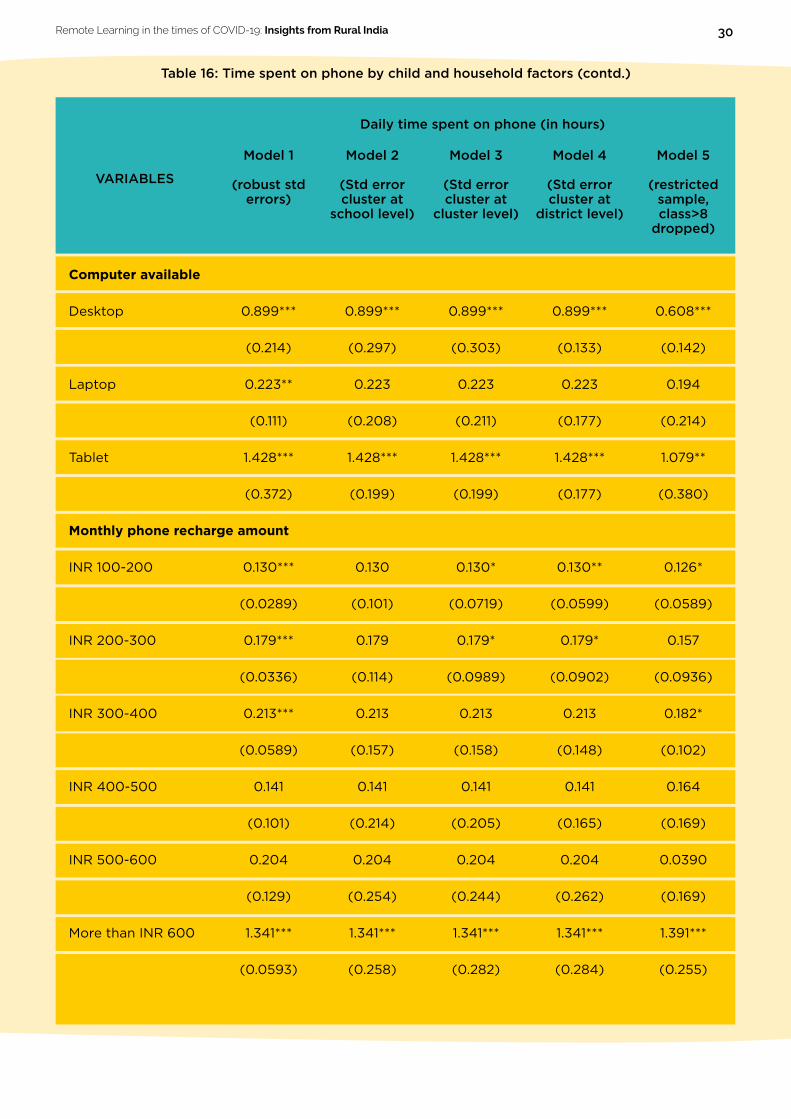
Availability of desktops and tablets has a significantly positive effect on a child’s phone access. Desktop availability in the household increases the amount of phone screen time for the child by 54 minutes, whereas having a tablet results in 1 hour and 26 minutes of additional phone access for the child, compared to households with no computing devices (desktop/ laptop/ tablet).
Regression
11 Schools in the same cluster are likely to be subject to similar implementation of educational policies
Remote Learning in the times of COVID-19: Insights from Rural India 27
Gender
Girl
Socio-religious status
Scheduled Caste
Scheduled Tribe
Other Backward Class
Muslim
Not Specified
Class
Primary
High School
Secondary
0.0294*
(0.0168)
-0.0917***
(0.0239)
-0.0618
(0.122)
-0.00561
(0.0253)
-1.280***
(0.0530)
-0.216**
(0.0914)
0.148***
(0.0218)
0.497***
(0.0279)
1.269***
(0.0991)
0.0294
(0.0189)
-0.0917
(0.0684)
-0.0618
(0.198)
-0.00561
(0.0562)
-1.280***
(0.253)
-0.216
(0.231)
0.148
(0.0961)
0.497***
(0.135)
1.269***
(0.452)
0.0294
(0.0184)
-0.0917*
(0.0467)
-0.0618
(0.159)
-0.00561
(0.0524)
-1.280***
(0.242)
-0.216
(0.229)
0.148
(0.107)
0.497***
(0.147)
1.269***
(0.458)
0.0294
(0.0209)
-0.0917*
(0.0437)
-0.0618
(0.165)
-0.00561
(0.0444)
-1.280***
(0.187)
-0.216
(0.238)
0.148
(0.104)
0.497**
(0.177)
1.269***
(0.240)
0.0239
(0.0188)
-0.0855*
(0.0455)
-0.0747
(0.167)
-0.00872
(0.0439)
-1.273***
(0.171)
-0.194
(0.251)
0.142
(0.0985)
0.484**
(0.167)
Model 1
(robust std errors)
Model 2
(Std error cluster at
school level)
Model 3
(Std error cluster at
cluster level)
Model 4
(Std error cluster at
district level)
Model 5
(restricted sample, class>8
dropped)
VARIABLES
Table 16: Time spent on phone by child and household factors
Daily time spent on phone (in hours)

Remote Learning in the times of COVID-19: Insights from Rural India 28
Senior Secondary
School type
Primary
Senior
Medium for distance learning
Phone calls
WhatsApp and
Phone calls
Connectivity
2G
3G
4G
2.003***
(0.154)
-0.194***
(0.0206)
1.113***
(0.0391)
1.130***
(0.0547)
1.134***
(0.0608)
1.270***
(0.0625)
0.0394
(0.0325)
0.247***
(0.0282)
-0.261***
2.003***
(0.628)
-0.194*
(0.113)
1.113***
(0.214)
1.130***
(0.228)
1.134***
(0.244)
1.270***
(0.252)
0.0394
(0.115)
0.247**
(0.0972)
-0.261
2.003***
(0.636)
-0.194
(0.129)
1.113***
(0.220)
1.130***
(0.377)
1.134***
(0.375)
1.270***
(0.382)
0.0394
(0.122)
0.247**
(0.0924)
-0.261
2.003***
(0.472)
-0.194
(0.129)
1.113***
(0.147)
1.130**
(0.417)
1.134**
(0.434)
1.270**
(0.430)
0.0394
(0.114)
0.247***
(0.0672)
-0.261
-0.191
(0.135)
1.135***
(0.152)
1.183**
(0.440)
1.229**
(0.460)
1.280**
(0.451)
0.0974
(0.106)
0.260***
(0.0684)
-0.225
Model 1
(robust std errors)
Model 2
(Std error cluster at
school level)
Model 3
(Std error cluster at
cluster level)
Model 4
(Std error cluster at
district level)
Model 5
(restricted sample, class>8
dropped)
VARIABLES
Daily time spent on phone (in hours)
Table 16: Time spent on phone by child and household factors (contd.)

Remote Learning in the times of COVID-19: Insights from Rural India 29
Broadband
Father’s phone type
Basic phone
WhatsApp-enabled ph.
Mother’s phone type
Basic phone
WhatsApp-enabled ph.
Relative’s phone type
Basic phone
WhatsApp-enabled ph.
Phone not available
(0.0571)
0.202***
(0.0644)
0.247***
(0.0442)
0.396***
(0.0441)
0.0265
(0.0201)
0.396***
(0.0264)
0.174***
(0.0531)
0.0713***
(0.0266)
-0.0706*
(0.0401)
(0.177)
0.202
(0.334)
0.247*
(0.133)
0.396***
(0.151)
0.0265
(0.100)
0.396***
(0.101)
0.174
(0.127)
0.0713
(0.0852)
-0.0706
(0.145)
(0.180)
0.202
(0.351)
0.247***
(0.0522)
0.396***
(0.0754)
0.0265
(0.0675)
0.396***
(0.0702)
0.174
(0.109)
0.0713
(0.0772)
-0.0706
(0.171)
(0.170)
0.202
(0.377)
0.247***
(0.0519)
0.396***
(0.0789)
0.0265
(0.0899)
0.396***
(0.115)
0.174
(0.109)
0.0713
(0.0896)
-0.0706
(0.164)
(0.156)
0.265
(0.395)
0.242***
(0.0560)
0.341***
(0.0682)
0.0314
(0.0730)
0.391***
(0.110)
0.172
(0.106)
0.0808
(0.0914)
-0.135
(0.143)
Model 1
(robust std errors)
Model 2
(Std error cluster at
school level)
Model 3
(Std error cluster at
cluster level)
Model 4
(Std error cluster at
district level)
Model 5
(restricted sample, class>8
dropped)
VARIABLES
Daily time spent on phone (in hours)
Table 16: Time spent on phone by child and household factors (contd.)
Remote Learning in the times of COVID-19: Insights from Rural India 30
Computer available
Desktop
Laptop
Tablet
Monthly phone recharge amount
INR 100-200
INR 200-300
INR 300-400
INR 400-500
INR 500-600
More than INR 600
0.899***
(0.214)
0.223**
(0.111)
1.428***
(0.372)
0.130***
(0.0289)
0.179***
(0.0336)
0.213***
(0.0589)
0.141
(0.101)
0.204
(0.129)
1.341***
(0.0593)
0.899***
(0.297)
0.223
(0.208)
1.428***
(0.199)
0.130
(0.101)
0.179
(0.114)
0.213
(0.157)
0.141
(0.214)
0.204
(0.254)
1.341***
(0.258)
0.899***
(0.303)
0.223
(0.211)
1.428***
(0.199)
0.130*
(0.0719)
0.179*
(0.0989)
0.213
(0.158)
0.141
(0.205)
0.204
(0.244)
1.341***
(0.282)
0.899***
(0.133)
0.223
(0.177)
1.428***
(0.177)
0.130**
(0.0599)
0.179*
(0.0902)
0.213
(0.148)
0.141
(0.165)
0.204
(0.262)
1.341***
(0.284)
0.608***
(0.142)
0.194
(0.214)
1.079**
(0.380)
0.126*
(0.0589)
0.157
(0.0936)
0.182*
(0.102)
0.164
(0.169)
0.0390
(0.169)
1.391***
(0.255)
Model 1
(robust std errors)
Model 2
(Std error cluster at
school level)
Model 3
(Std error cluster at
cluster level)
Model 4
(Std error cluster at
district level)
Model 5
(restricted sample, class>8
dropped)
VARIABLES
Daily time spent on phone (in hours)
Table 16: Time spent on phone by child and household factors (contd.)

Remote Learning in the times of COVID-19: Insights from Rural India 31
Data Not available
State
Rajasthan
Haryana
Uttar Pradesh
Tamil Nadu
West Bengal
Radio availability
Yes
Not specified
TV subscription
Local cable
-0.451***
(0.0660)
-0.484***
(0.0255)
0.567***
(0.0247)
0.554***
(0.0303)
-0.294***
(0.0298)
3.399***
(0.115)
0.234***
(0.0211)
-1.967***
(0.218)
-0.116***
(0.0391)
-0.451
(0.339)
-0.484***
(0.117)
0.567***
(0.132)
0.554**
(0.217)
-0.294**
(0.145)
3.399***
(1.183)
0.234***
(0.0892)
-1.967
(1.386)
-0.116
(0.244)
-0.451
(0.423)
-0.484***
(0.136)
0.567***
(0.171)
0.554**
(0.253)
-0.294**
(0.123)
3.399***
(0.0867)
0.234**
(0.0971)
-1.967
(1.663)
-0.116
(0.294)
-0.451
(0.441)
-0.484***
(0.0995)
0.567***
(0.121)
0.554***
(0.0985)
-0.294**
(0.131)
3.399***
(0.0806)
0.234*
(0.115)
-1.967
(1.810)
-0.116
(0.313)
-0.509
(0.456)
-0.487***
(0.102)
0.579***
(0.108)
0.539***
(0.0964)
-0.298**
(0.131)
3.367***
(0.0717)
0.312**
(0.109)
-2.190
(2.002)
-0.150
(0.322)
Model 1
(robust std errors)
Model 2
(Std error cluster at
school level)
Model 3
(Std error cluster at
cluster level)
Model 4
(Std error cluster at
district level)
Model 5
(restricted sample, class>8
dropped)
VARIABLES
Daily time spent on phone (in hours)
Table 16: Time spent on phone by child and household factors (contd.)

Remote Learning in the times of COVID-19: Insights from Rural India 32
DTH
Not specified
Constant
Observations
R-squared
-0.132***
(0.0265)
1.519***
(0.249)
0.00226
(0.0687)
38,507
0.327
-0.132
(0.141)
1.519
(1.538)
0.00226
(0.259)
38,507
0.327
-0.132
(0.165)
1.519
(1.677)
0.00226
(0.345)
38,507
0.327
-0.132
(0.172)
1.519
(1.807)
0.00226
(0.415)
38,507
0.327
-0.173
(0.180)
1.854
(2.012)
-0.0188
(0.436)
36,748
0.313
Model 1
(robust std errors)
Model 2
(Std error cluster at
school level)
Model 3
(Std error cluster at
cluster level)
Model 4
(Std error cluster at
district level)
Model 5
(restricted sample, class>8
dropped)
VARIABLES
Daily time spent on phone (in hours)
Table 16: Time spent on phone by child and household factors (contd.)
Robust standard errors in parentheses. Boy is the reference category for Gender. General is the reference category for Caste. Pre-primary is the reference category for Class. Elementary school is the reference category for School type. Not connected is the reference category for Medium of distance learning. Not connected is the reference category for connectivity. Phone not available is the reference category for Father’s and Mother’s phone type. Not using relative’s phone is the reference category for Relative’s phone type. None is the reference category for Computer availability. Rupees 0-100 per month is the reference category for monthly phone recharge amount. Punjab is the reference category for State. Radio not available is the reference category for Radio Availability. TV not available is the reference category for TV Subscription.
*** p<0.01, ** p<0.05, * p<0.1
Source: Authors’ calculations using Bharti Foundation data

The COVID-19 pandemic has brought renewed focus on EdTech. Prolonged school closures due to the pandemic can have lasting impact on the learning levels of young students. To mitigate potential loss of learning, Central and state governments, as well as private schools have devised and implemented variousresponse programs that involve remote learning.
Conclusion
Access to digital infrastructure is a necessary condition for remote learning

Remote Learning in the times of COVID-19: Insights from Rural India 34
Access to digital infrastructure is a necessary condition for remote learning. In fact, the type of remote learning solutions that can be deployed is dependent on the quality of access, i.e., type of device and internet access. Despite significant improvements in smartphone and internet penetration in recent years, equitable access to EdTech remains a challenge. While the trends in digital access to and usage of EdTech in urban India are well understood, the same is not the case for rural India. Through this descriptive study, we document the readiness of rural households in six Indian states for remote learning in the context of COVID-19 induced school closures. Our findings suggest that although the availability of electronic devices like TV and radio varies across states, access to smartphones is consistently high for most states (with the exception of Uttar Pradesh). Children and their parents connect with teachers and learning material primarily through phone calls or through WhatsApp. This suggests that low-tech and easy-to-adopt solutions are likely to play an important role in remote learning for children in rural India.
While our findings are indicative of the promise held by remote learning for rural India, it is pertinent to note that they emerge from a specific context—Satya Bharti Schools in 14 districts spread across six states in India—and cannot be generalized.

Remote Learning in the times of COVID-19: Insights from Rural India 35
All images used in this report are archive images from pre-COVID times, courtesy of Bharti Foundation.

Remote Learning in the times of COVID-19: Insights from Rural India 36
Remote Learning in the times of COVID-19: Insights from Rural India