Embed Size (px)
Citation preview
Abstract
Wirgau, Scott. Remote Observation and Control of a Shake Table Experiment (Under the
direction of Dr. Abhinav Gupta and Dr. Vernon Matzen).
Laboratory experiences, i.e. visualization of material covered in class and hands-on
use of equipment, are especially advantageous to engineering classes such as structural
mechanics. Unfortunately it is sometimes difficult for on-campus students to be taken to a
lab setting and impossible for those who are off campus due to work, disabilities, or other
complexities and taking class through distance education. This project describes a shake
table experiment that is being converted to a distance-learning environment. This will
include remote access, control, and protection from misuse. An aspect of the project that
differentiates it from simple remote viewing of a lecture or experiment is the need to
control the experiment and to protect against the possibility of damage occurring to this
particular setup if left unmonitored. This last point necessitates the inclusion of sufficient
safety protocols. The environment must allow remote controlling of the system, multi-user
viewing, data saving, and download capabilities. The technology selected for use in this
project is the LabVIEW programming environment in conjunction with its real time
counterpart, LabVIEW RT. By using this language, practical and intuitive control panels
coupled with easy to follow data flow block diagrams are made possible. The LabVIEW
code likewise handles the data acquisition. The information sent and received through the
DAQ card is processed by LabVIEW RT code embedded in the real time processor. The
information is then sent to a host computer for saving, visualization, and distribution to
remote clients. This visualization includes an oscilloscope for displaying the accelerations
from both the table and the structure residing on the table. Further visualization is given
by way of a video camera. The code must be made safe from unauthorized usage in
addition to allowing for the university network to remain protected. This research outlines
in detail the setup required and programs needed to implement such a system and presents
the information in a manner that can be helpful regardless of the programming language
chosen.
Remote Control and Observation of a Shake Table Experiment
by
Scott Wirgau
A thesis submitted to the Graduate Faculty of North Carolina State University
in partial fulfillment of the requirements for the Degree of
Master of Science
CIVIL ENGINEERING
Raleigh, NC 2003
APPROVED BY:
_________________________________ Co-Chair of Advisory Committee
Abhinav Gupta
_________________________________ Co-Chair of Advisory Committee
Vernon Matzen
________________________________ John Baugh

ii
Biography
Scott Wirgau was born on August 10, 1979 in Schenectady NY and grew up in Clifton
Park, NY where he received his High School diploma from Shenendehowa High School.
He continued his education by studying Civil Engineering with a concentration in
structures at North Carolina State University and earned a BS in Civil Engineering as well
as a minor in Computer Science in May 2001. He extended his knowledge in structures by
enrolling in the Masters program at North Carolina State University and by studying
structural dynamics and applications of distance learning through LabVIEW and the
internet. He completed his MS degree in Structural Engineering in May 2003.
iii
Acknowledgements
I would like to thank Dr. Abhinav Gupta for his continuous support throughout the course
of this research. I would also like to thank Dr. Vernon Matzen for his advice and
encouragement in this project. Without their support and that of the staff and students of
the Center for Nuclear Power Plant Structures, Equipment, and Piping including: Bonnie
Diaz, Byounghoan Choi, Prakash Kripakaran, Rakesh Saigal, and Kevin Wilkins my work
would have been a much greater burden. I would like to thank Dr. John Baugh for being
on my committee and for consultation on the computer science portions of this research as
well. The Department of Civil Engineering and North Carolina State University must also
be acknowledged for their support of this research.
I must also extend my gratitude to my parents, Kim and Elaine, and brother Joe, for
their ever-present encouragement.
Finally, I would like to extend my thanks to my fellow students who helped me
through my courses: Dustin Creech, Todd Garrison, Mark Gustafson, Jay Harris, Joel
Howard, Brian Lanier, Kirk Stanford, and Randall Wilson.

iv
Table of Contents
List of Figures v 1 Introduction ....................................................................................... 1 1.1 Introduction ................................................................................ 2 1.2 Objective ................................................................................... 3 1.3 Organization ................................................................................ 5 References .......................................................................................... 6 2 Remote Observation and Control of a Shake Table Experiment – Journal Article ................................................................................................ 7 Abstract .............................................................................................. 8 2.1 Introduction ............................................................................... 9 2.2 Shake Table Experiment ............................................................ 11 2.3 Preliminary Lab Setup ................................................................ 14 2.4 Real-Time Control ..................................................................... 16 2.5 Waveform Generation VI ........................................................... 18 2.6 Data Collection, Display, and Storage VI ................................... 24 2.7 Handshaking VI ......................................................................... 31 2.8 Error Handling ........................................................................... 32 2.9 Web Accessibility and Remote Observation ................................ 35 2.10 Parallel Loops and Remote Front Panels .................................... 37 2.11 Conclusions ............................................................................... 38 Acknowledgements ............................................................................ 39 References .......................................................................................... 40 Appendix – Hardware ......................................................................... 42 3 Summary and Conclusions .................................................................. 43 3.1 Summary ................................................................................... 44 3.2 Conclusions ............................................................................... 46 3.3 Future Work .............................................................................. 47 Appendix .................................................................................................. 49 Appendix – Administrator and Remote User Manual ................................ 70
v
List of Figures Page Part II 1. Shake table setup .......................................................................... 12 2. Experimental setup with real-time hardware .................................. 17 3. Flowchart for the waveform generation V ..................................... 18 4. Pseudo-code for waveform generation and handling the GUI ........ 20 5. Alternatives for waveform generation.............................................. 22 6. Execution times for waveforms created on RT-Board and
Host-PC ....................................................................................... 22 7. Pseudo-code for the waveform generation VI on RT-Board .......... 23 8. Flowchart for data display and storage VI ..................................... 25 9. Pseudo-code for data storage ........................................................ 27 10. Pseudo-code for data display ........................................................ 28 11. Variation of Total execution time with timebase ............................ 30 12. Variation of Total execution time with frame size .......................... 31 13. Flowchart for handshaking VI functionality ................................... 32 Appendix A1. HTML code used to produce the remotely accessible webpage ..... 50 A2. LabVIEW Front Panel for the waveform generation code ............. 51 A3. LabVIEW Front Panel for the data collection, display, and
storage VI .................................................................................... 52 A4. LabVIEW Front Panel for the handshaking VI .............................. 53 A5. LabVIEW Block Diagram for the waveform generation VI
residing on the host-PC ................................................................. 54 A6. LabVIEW Block Diagram for the waveform generation VI
residing on the RT-board .............................................................. 55 A7. LabVIEW Block Diagram for the data collection, display, and
saving VI residing on the host-PC ................................................. 56 A8. LabVIEW Block Diagram for the data collection, display, and
saving VI residing on the RT-board .............................................. 57 A9. LabVIEW Block Diagram for the handshaking VI residing on the
host-PC ........................................................................................ 58 A10. LabVIEW Block Diagram for the handshaking VI residing on the
RT-board ...................................................................................... 58 A11. LabVIEW Block Diagram for 2 Channel Oscilloscope VI that is
located within the LabVIEW 6.1 examples section and used as a template for the data collection, display, and saving VI ................. 59
A12. LabVIEW Block Diagram for the SubVI used for DAQ within the 2 Channel Oscilloscope VI shown in Fig. A11 ............................... 60
vi
A13. LabVIEW Block Diagram for the SubVI used for DAQ within the data collection, display, and saving VI ........................................... 61
A14. LabVIEW Block Diagram for the SubVI used for updating the display graph within the data collection, display, and saving VI ..... 62
A15. LabVIEW Block Diagram for the SubVI used for creating a file path within the data collection, display, and saving VI ................... 62
A16. LabVIEW Block Diagram for a typical SubVI used for transferring data through a LabVIEW TCP/IP connection (a Boolean is transferred here) ...................................................... 63
A17. LabVIEW Block Diagram for the SubVI used for receiving data through a LabVIEW TCP/IP connection ....................................... 63
A18. VI Hierarchy for the waveform generation VI residing on the host-PC ........................................................................................ 64
A19. VI Hierarchy for the waveform generation VI residing on the RT-board ...................................................................................... 65
A20. VI Hierarchy for the data collection, display, and saving VI residing on the host-PC ................................................................. 66
A21. VI Hierarchy for the data collection, display, and saving VI residing on the RT-board .............................................................. 67
A22. VI Hierarchy for the handshaking VI residing on the host-PC ........ 68 A23. VI Hierarchy for the handshaking VI residing on the RT-board ..... 69
1
Part I
Introduction
2
1.1 Introduction
With present advances in communication technologies and an expanding vision towards
remote controlling and observation of machinery, considerable interest has been generated
towards the creation of remote laboratory experiments. These remote experiments,
especially within the structural engineering field, can lead to the development of
collaboratories. The NSF sponsored National Earthquake Engineering Simulator (NEES)
program has emphasized creating a collaboratory environment allowing remote access to
various earthquake simulation equipment (www.neesgrid.org).
In addition to research collaboratories, such advancements in remote laboratory
control and observation can be used in promoting and expanding distance education
programs. A laboratory experiment properly converted to a remote setup can offer hands-
on experience in controlling and observing each step of the experiment. Such educational
experience involving both theory and hands-on participation is being increasingly
emphasized by educators (Corradini et al. 2001). A remote setup would not only bring
access to those away from campus, but could allow more on-campus students an access to
the experiment as well. There are many difficulties in providing each student the
opportunity for first-hand laboratory use. Often, such opportunities are denied and
replaced by simulation. Although simulations can compliment many lectures, they cannot
substitute the experience gained through interaction with actual laboratory
experimentation. As discussed in Corradini et al. (2001), a remotely controlled
experimental facility can provide opportunities to conduct live experiments off-site thereby
3
reducing the experiment cost per user and making valuable resources available to many
more users.
Through an increase in interest by individual universities, research has led to
successful remotely controlled experimental setups for both in-class teaching and distance
learning (Yorkovich and Passino 1996, Poindexter and Heck 1999, Ko et al. 2000). Smith
et al. (2000) implemented a web-based tutorial and tele-operation system for earthquake
engineering education at Southern Illinois University whereas Shor and Bhandari (1998)
developed a distance learning application for remotely controlling laboratory experiments
at Oregon State University. As outlined by researchers in the NEES program, adaptation
and implementation of these preliminary studies in the development of Civil Engineering
related research collaboratories has been limited due to practical difficulties that relate to
user-friendly technology, logistics, safety, security, copyright, and cost associated with
research related large-scale testing (www.neesgrid.org).
1.2 Objective
The objective of this research is to convert a forced vibration shake table experiment into a
remotely accessible experiment. To create such an environment, the following concerns
must be met:

4
• A suitable programming language for coding is required. The chosen
programming language must create code that protects the hardware from misuse
while allowing for modularity for future enhancements.
• Proper shaking table controls are needed for the remote user. A GUI allowing
for manipulation of waveform type, waveform time-length, frequency, and
amplitude, must be developed. Proper limits must be placed on each of these
inputs.
• Proper data collection and display must be achieved. A graphical display must
be created that allows viewing of the data curves and cursor manipulation for
finding exact values along each curve.
• The user must have the option to save data. This data must be in a spreadsheet
compatible format.
• Hardware must be protected from damage and misuse. Sufficient authorization
protocols must be used to prevent unauthorized access to the experiment and to the
network. Feedback and input limits must also be used to prevent hardware damage.

5
1.3 Organization
This thesis consists of three parts as well as two appendices. Part I gives the introduction,
objective and organization of this research.
The second part consists of a manuscript that is presently being developed for
submission to and possible publication in a technical journal. This manuscript describes
the programming language used and gives detailed information regarding each
programming module that was developed for implementation of the remotely accessible
shake table experiment. Security issues and alternative programming methods are also
addressed.
The third section of this report summarizes the research followed in this project.
Conclusions are given based on this summary and the specific information given within the
body of this thesis. A section on future work and possible extensions of this research
follow the conclusions.
Lastly, two appendices are present. The first appendix shows the LabVIEW code
used to implement this research. This is given in the form of block diagrams and front
panels for each of the 3 major VI’s discussed. A hierarchy showing the subVI architecture
for each of these programs is offered as well. The final appendix reproduces an
administrator and remote user manual for proper use of this remotely controlled
experiment.

6
References
Corradini, M. L., Ippoliti, G., Leo, T. and Longhi, S. (2001) “An internet based laboratory
for control education,” in Proceedings of the 40th IEEE conference on Decision and
Control, Orlando, FL, December 2001.
Ko, C. C., Chen, B. M., Ramakrishnan, V., Chen, R., Hu, S. Y., and Zhuang, Y. (2000) “A
large scale web-based virtual oscilloscope laboratory experiment,” IEEE Sci. Educ.
Journal, vol. 9, no. 2, pp. 69-76.
Poindexter, S. E. and Heck, B. S. (1999) “Using the web in your courses: What can you
do? What should you do?,” IEEE Control System, vol.9, no.1, pp. 83-92.
Shor, M. and Bhandari, A. (1998) “Access to an instructional control laboratory
experiment through the world wide web,: in Proceedings of 1998 American
Control Conference, Philadelphia, PA, pp. 1319-1325.
Smith S. R., Husted, C. W., Smith, S. and Cross, B. (2000) “A web-based tutorial and tele-
operation system for earthquake engineering education,” Proceedings of 30th
ASEE/IEEE Frontiers in Education Conference, Kansas City, MO, October 18-21.
Yorkovich, S. and Passino, K. M. (1996) “An intelligent control laboratory course, in
Proceedings of the 13th IFAC World Congress, San Francisco, CA, paper no. 4c-03.
http://www.neesgrid.org “NEES Community Requirements Workshop Final Report.”
Technical Report NEESgrid-2001-03.
7
Part II
Remote Observation and Control of a Shake Table
Experiment
Planned for submission to a technical Journal

8
Remote Observation and Control of a Shake Table Experiment
Scott Wirgau, Abhinav Gupta, and Vernon Matzen
Graduate Student, North Carolina State University/Assistant Professor of
Civil Engineering, North Carolina State University/Professor of Civil Engineering and Director, Center for
Nuclear Power Plant Structures, Equipment and Piping, North Carolina State University
Abstract
This paper describes a shake table experiment that is being converted for remote access
including control, observation, and protection from misuse. Protection against the
possibility of damage to surrounding hardware necessitated the inclusion of sufficient
safety protocols. The environment produced by this research allows remote controlling of
the system, multi-user viewing, data storage, and download capabilities. The technology
selected for programming this application is LabVIEW as well as its real time counterpart,
LabVIEW RT. Practical and intuitive control panels coupled with easy to follow data flow
block diagrams are made possible by using LabVIEW, which is also capable of handling
the data acquisition. The setup in this project connects an administrator controlled host
computer to a real-time board that controls the DAQ through a TCP/IP connection. The
information sent and received through the DAQ card is processed by LabVIEW-RT code
embedded upon the real time board. The information is then sent back to the host
computer for saving, visualization, and distribution to remote clients. This visualization

9
includes an oscilloscope displaying the accelerations from both the table and the structure
residing on the table. Further visualization is made possible by way of a real-time video
stream.
2.1 Introduction
Recent developments in information technology have generated considerable interest in the
field of internet-enabled remote observation and control of laboratory experiments. In the
area of structural engineering, such a capability can facilitate the development of research
collaborations among organizations that are geographically distributed. Under the NSF
sponsored Network for Earthquake Engineering Simulation (NEES) program, a significant
emphasis has been placed on the development of internet-enabled remote collaboratories.
In the face of continuously evolving distance education programs, more and more
educators recognize the importance of a complete educational experience involving theory
as well as hands-on experiments (Corradini et al. 2001). Even for on-campus students, the
possibility of experimental training can be unrealized due to economic constraints in
developing a large number of experimental set-ups for simultaneous use in a laboratory
environment. Simulations (virtual experiment) are often used to integrate classroom lecture
with some kind of hands-on experience (Oliphant and Oliver 1999). However as pointed
out by Bohus et al. (1996), “There will always be an important place of simulation
systems, but they cannot completely substitute for experience with actual systems.” For
instance, simulations do not provide any insight into calibration of measuring instruments
such as pressure gages and LVDT’s or into behavioral uncertainties. As discussed in
Corradini et al. (2001), a remotely controlled experimental facility can provide
10
opportunities to conduct live experiments off-site thereby reducing the experiment cost per
user and making valuable resources available to many more users. Key issues are the use
of the internet as a communication infrastructure between the user and the equipment,
which may be in geographically different locations as well as the adaptation of these
experiments to be remotely controlled.
Several researchers in the area of control engineering have successfully developed
remotely controlled experimental setups for both the in-class teaching and distance
learning (Yorkovich and Passino 1996, Poindexter and Heck 1999, Ko et al. 2000). Among
these, Smith et al. (2000) implemented a web-based tutorial and tele-operation system for
earthquake engineering education at Southern Illinois University whereas Shor and
Bhandari (1998) developed a distance learning application for remotely controlling
laboratory experiments at Oregon State University. As outlined by researchers in the NEES
program, adaptation and implementation of these preliminary studies in the development
of Civil Engineering related research collaboratories has been limited due to practical
difficulties that relate to modularity, user-friendly technology, logistics, safety, security,
copyright, and cost associated with research related large-scale testing (www.neesgrid.org).
This paper describes the work conducted in converting a shake table laboratory
experiment to a distance learning environment. This includes remote access, control,
observation, protection from misuse, and safe shut down. The proposed implementation
requires the adaptation of existing experiments, a modification of existing interface
computer programs, and development of new interfaces. An aspect of the project that
differentiates it from simple remote viewing of a lecture or experiment is the ability to
control the experiment and to protect against the possibility of damage occurring to this
11
particular setup if left unmonitored. The latter necessitates the inclusion of sufficient safety
protocols. The environment must allow multi-user viewing, data saving, and download
capabilities.
2.2 Shake Table Experiment
The shake table considered in this study is typically used for teaching purposes at the
undergraduate and graduate levels. It is a 12” x 34” one-dimensional table with a 50 lb
electromagnetic shaker. In the undergraduate curriculum, Junior-level students use this
experiment as part of a 1 credit-hour laboratory course on structural behavior
measurements. The particular experiment focuses on evaluating the natural frequency and
damping ratio for a single story shear building having wide but thin Aluminum columns
and a heavy steel girder. The shear building is bolted to the top of the shake table. A
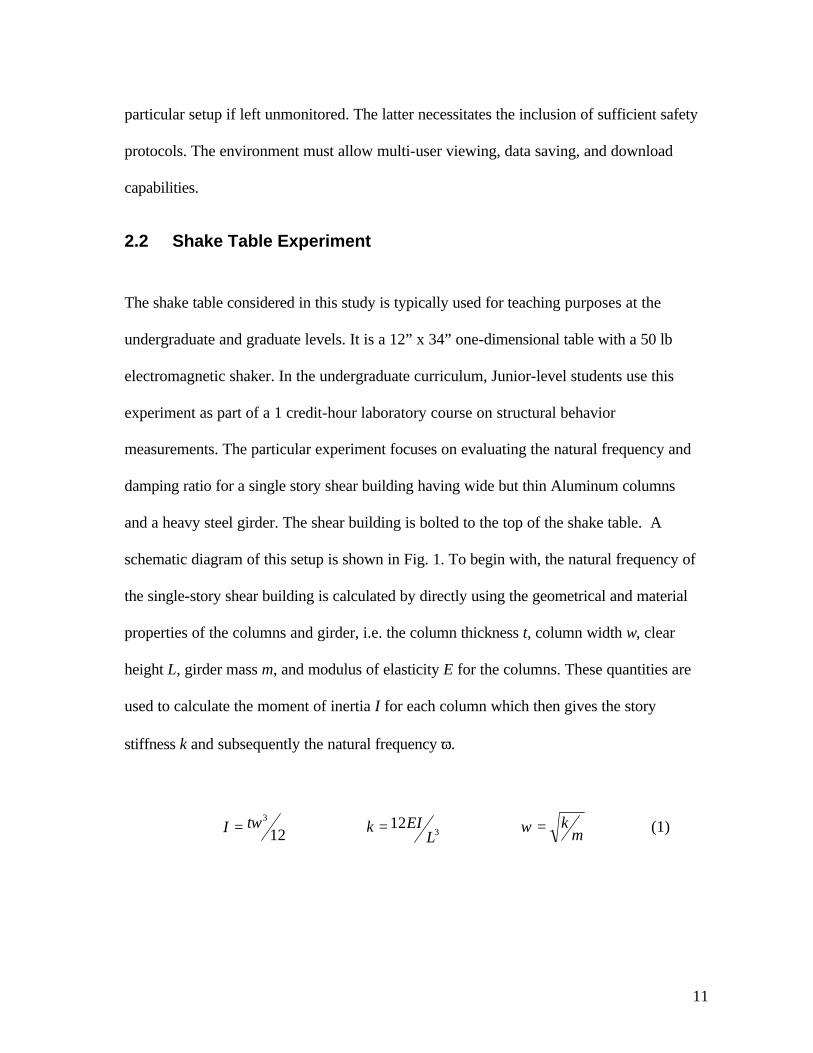
schematic diagram of this setup is shown in Fig. 1. To begin with, the natural frequency of
the single-story shear building is calculated by directly using the geometrical and material
properties of the columns and girder, i.e. the column thickness t, column width w, clear
height L, girder mass m, and modulus of elasticity E for the columns. These quantities are
used to calculate the moment of inertia I for each column which then gives the story
stiffness k and subsequently the natural frequency ω.
123twI = 3
12L
EIk = mk=ω (1)

12
Next, a forced vibration test is conducted in which a harmonic excitation is used
and the frequency of excitation varied in steps from a value that is much lower than, to a
value that is much higher than the natural frequency of the shear building. For each input
frequency, the table is excited for a duration that is sufficient enough to dissipate the
transient motion thereby resulting in a steady state motion. Accelerometers are used to
measure time varying accelerations of the shake table as well as the girder. The ratio of
amplitudes corresponding to the two records is then used to evaluate the dynamic
magnification factor for the particular frequency ratio – the ratio of excitation frequency
and the natural frequency of the shear building. The dynamic magnification factors
calculated for a range of frequency ratios that include frequencies below, close to, and
above resonance regions are then used to evaluate the natural frequency and damping ratio
of the shear building in accordance with the formulations given in a typical dynamics
textbook (Meriam et al. 2002).
Figure 1 – Shake table setup

13
At the graduate level, the forced vibration test is used to compare the theoretical
solutions of the second-order-differential equation of motion with the experimental data for
different excitation types such as harmonic, square wave, saw-toothed, etc. Also, two and
three story shear buildings are used to illustrate the concept of multiple modes and phase
difference between the motions of various floors. Finally, a strobe light is also used to
illustrate the concept of mode shapes by exciting the structure at a natural frequency and
tuning the strobe light frequency so that it is close to, but slightly different from, this
natural frequency. The structure then appears to be moving very slowly in the
corresponding mode shape.
It should be noted that the shear building models used in the experiments
mentioned above are constructed using thin but wide aluminum columns. These columns
are susceptible to fatigue failure which can occur rather quickly if the shear building is
excited either for long durations at low amplitude or for short duration at high amplitudes
in the resonance or near-resonance regions. Also, the shake table and the electromagnetic
shaker can suffer damage if excited at very high amplitudes. Therefore, several safety
features are necessary for remotely accessing and controlling the shake table. Some of
these safeguards are needed for protection against misuse whereas others are needed to
safely shutdown the experiment when the electronic communication between the
experimental hardware and the controlling computer is disrupted. For example, a
disruption of communication might occur due to a failure of the operating system (such as
Windows) on the computer being used either for controlling the shake table or by the
remote user.
14
2.3 Preliminary Lab Setup
A simple way to implement and conduct this experiment, as was the case prior to the work
being presented in this paper, is to generate the input waveforms and control the shake
table by using a function generator connected to the electromagnetic shaker as shown in
Fig.1. The output from the accelerometers is then routed through a power supply and data
acquisition system (DAQ) on to an oscilloscope for display and data collection. In the
proposed work, it is necessary to use software that can communicate with DAQ for not
only data collection and display but also for generating the input waveforms to enable
remote control. In addition to the present laboratory requirements, the software will also
provide feedback from the shake table. Interfaces are needed to facilitate communication
over the internet, as well.
LabVIEW (Travis 2000, Wells and Travis 1997) is one such software that can
handle the demands for acquisition, control, display, and communication. LabVIEW is a
powerful tool that has a number of built-in capabilities for internet-enabled
instrumentation. LabVIEW is capable of accomplishing almost all of the tasks that more
traditional programming languages such as C or Java, have been used for. LabVIEW is
compatible across each of the major operating system platforms including Windows,
Macintosh, UNIX, and real-time systems. A built-in compiler is also present within the
LabVIEW platform that allows optimal compilation of the code. These compiled
programs deliver execution speeds comparable to compiled C code (National Instruments -
a), a feature that is desirable due to the need for reducing feedback time. LabVIEW differs
from these traditional languages in that it is a graphical language designed specifically for
15
measurement and automation applications. No lines of text-based code are written when
programming with LabVIEW’s graphical (“g”) language. Instead, pre-built objects are
manipulated to produce user interfaces for the application. System functionality is
specified through the assembly of a block diagram using logic networks and the built-in
tools. Strong integration with various measurement devices and built-in measurement
analysis is an added advantage (National Instruments -b). LabVIEW can also be used in
conjunction with programs written in other languages such as Java or C that may be
needed as interfaces for improving user friendliness in enabling the remote access,
observation, and control of a particular experiment. The graphical panels developed within
LabVIEW primarily for user interfaces are referred to as front panels whereas the complete
block diagram based code is referred to as Virtual Instruments, VI’s.
In its simplest form, a LabVIEW based setup would consist of an administrator
controlled host computer with Windows operating the LabVIEW, which communicates
directly with DAQ. Such an implementation would require two VI’s within LabVIEW, one
for the controlling the table by generating and sending the input waveform and the other
for performing oscilloscope functions to display and collect the acceleration data. Each
interface is discussed in detail later. In an implementation of this type, however, a
disruption of electronic communication between the host-PC and DAQ such as that due to
the failure of the operating system can leave the experiment unmonitored and susceptible
to damage. Safeguards against such situations can be accomplished by using the hardware
and software for real-time control. The host-PC can also be used directly to provide a web
access to the remote user. Alternatively, network security can be enhanced by using a
separate server together with the host computer within a client-server environment. The
16
server would provide a gateway for the remote user and allow the host-PC to be hidden
from the remote user. The implementation for the remote access will be discussed later. In
the next few sections we discuss the various aspects of this study that are needed for
successfully conducting this experiment from the host-PC as well as for protection against
unsafe operation. To begin with, we discuss the implementation of real-time control.
2.4 Real-time Control
For ease of implementation, the control software may be executed directly on the host-PC
for conducting the experiment. However, it is undesirable to do so primarily for
incorporating safeguards to ensure safe shut downs and protection from misuse. In order to
achieve a safe shut down, it is critical that the real-time control software and the operating
system such as Windows are assigned independent processors and memories that are
dedicated to each task. Else, unavailability of resources on a single processor and shared
memory due to an operating system crash will prevent the real-time software from
executing a safe shutdown. Even under normal operating conditions, the various operating
system processes can reduce the feedback time for controlling the shake table when a
single processor and shared memory are used for executing both the tasks. Standardized
hardware containing real-time control boards with a dedicated processor and independent
memory are available for implementing such a solution. Such a board provides the
capability of embedding LabVIEW programs into them for real-time control (National
Instruments -c). Consequently, the communication with DAQ must be performed through
the real-time board. The Appendix describes the particular hardware used in this study and
states that the DAQ controller is also located on the same card, i.e., the same processor is
17
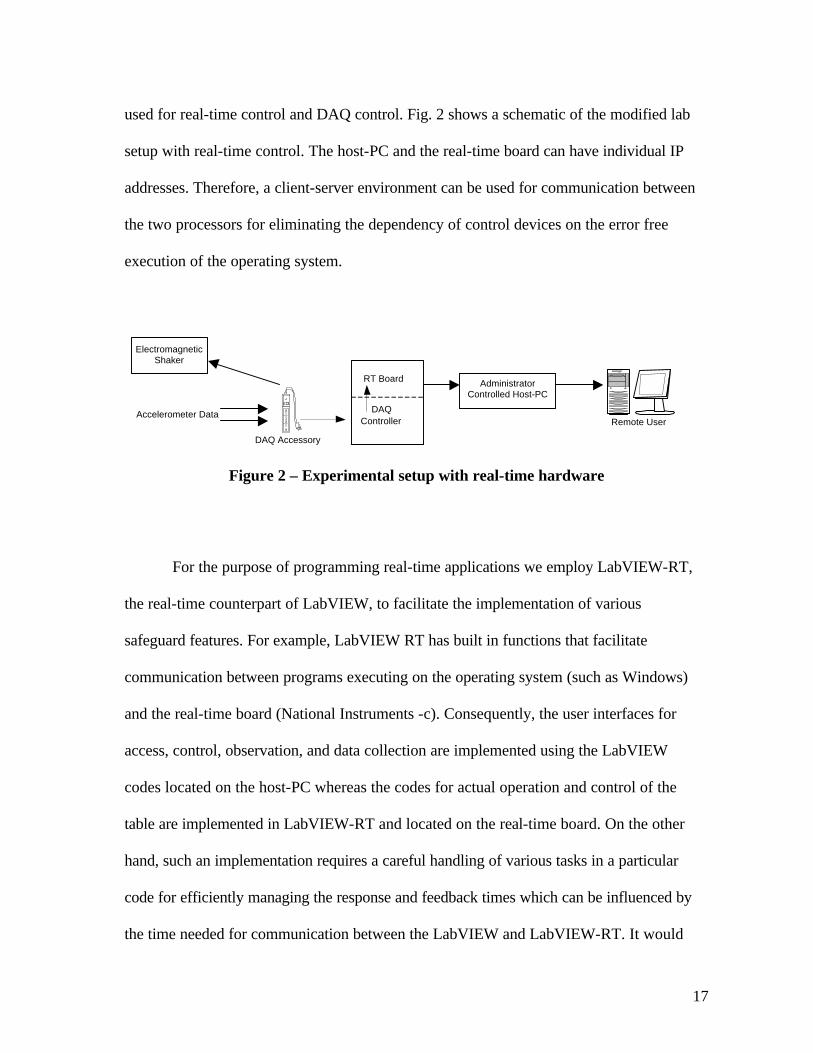
used for real-time control and DAQ control. Fig. 2 shows a schematic of the modified lab
setup with real-time control. The host-PC and the real-time board can have individual IP
addresses. Therefore, a client-server environment can be used for communication between
the two processors for eliminating the dependency of control devices on the error free
execution of the operating system.
RT Board
DAQ Accessory
Remote UserDAQ
Controller
AdministratorControlled Host-PC
ElectromagneticShaker
Accelerometer Data
Figure 2 – Experimental setup with real-time hardware
For the purpose of programming real-time applications we employ LabVIEW-RT,
the real-time counterpart of LabVIEW, to facilitate the implementation of various
safeguard features. For example, LabVIEW RT has built in functions that facilitate
communication between programs executing on the operating system (such as Windows)
and the real-time board (National Instruments -c). Consequently, the user interfaces for
access, control, observation, and data collection are implemented using the LabVIEW
codes located on the host-PC whereas the codes for actual operation and control of the
table are implemented in LabVIEW-RT and located on the real-time board. On the other
hand, such an implementation requires a careful handling of various tasks in a particular
code for efficiently managing the response and feedback times which can be influenced by
the time needed for communication between the LabVIEW and LabVIEW-RT. It would
18
also require development and implementation of another VI for monitoring the progress of
successful communication between the two processors and for ordering a safe shutdown
when the communication breaks down due to reasons such as an operating system crash.
Next, we discuss the details of the three VIs discussed above, i.e. LabVIEW and
LabVIEW-RT programs for (a) controlling the table by generating and sending the input
wave form, (b) performing oscilloscope functions for data display and storage, and (c)
monitoring communication between LabVIEW and LabVIEW-RT and ensuring a safe
shutdown.
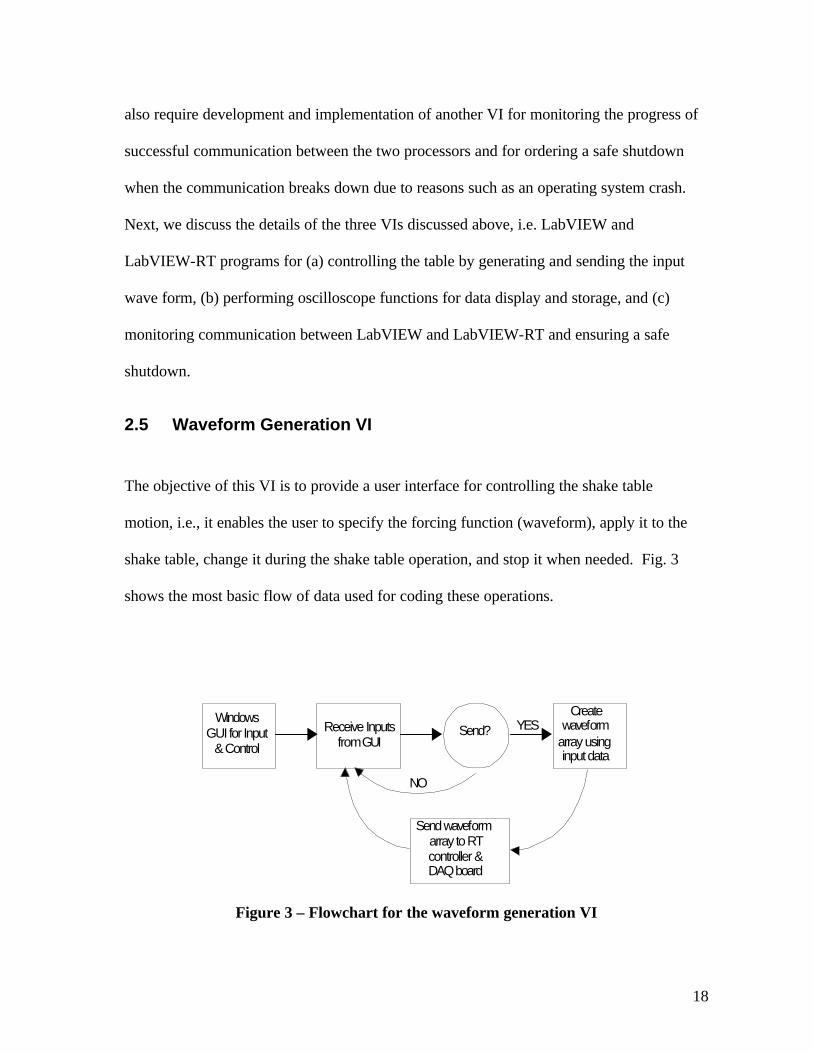
2.5 Waveform Generation VI
The objective of this VI is to provide a user interface for controlling the shake table
motion, i.e., it enables the user to specify the forcing function (waveform), apply it to the
shake table, change it during the shake table operation, and stop it when needed. Fig. 3
shows the most basic flow of data used for coding these operations.
Receive Inputsfrom GUI
Createwaveform
array usinginput data
Send waveform array to RTcontroller &DAQ board
Send? YES
NO
WindowsGUI for Input
& Control
Figure 3 – Flowchart for the waveform generation VI
19
This code can be broadly divided into two sub-programs; one for creating a graphical user
interface that would enable interactive user inputs and the other to generate the digital
values of the specified forcing function. Clearly, the sub-program for graphical user
interface needs to be developed within a structure residing on the host computer. It
requests the user to select a particular type of forcing function among four choices that
include sinusoidal, square, saw-toothed, and triangular. The user then specifies the
amplitude, frequency, duration, and sampling rate of the forcing function. Each input is
given in the form of digital controls. Controls exist for sending the data and for stopping
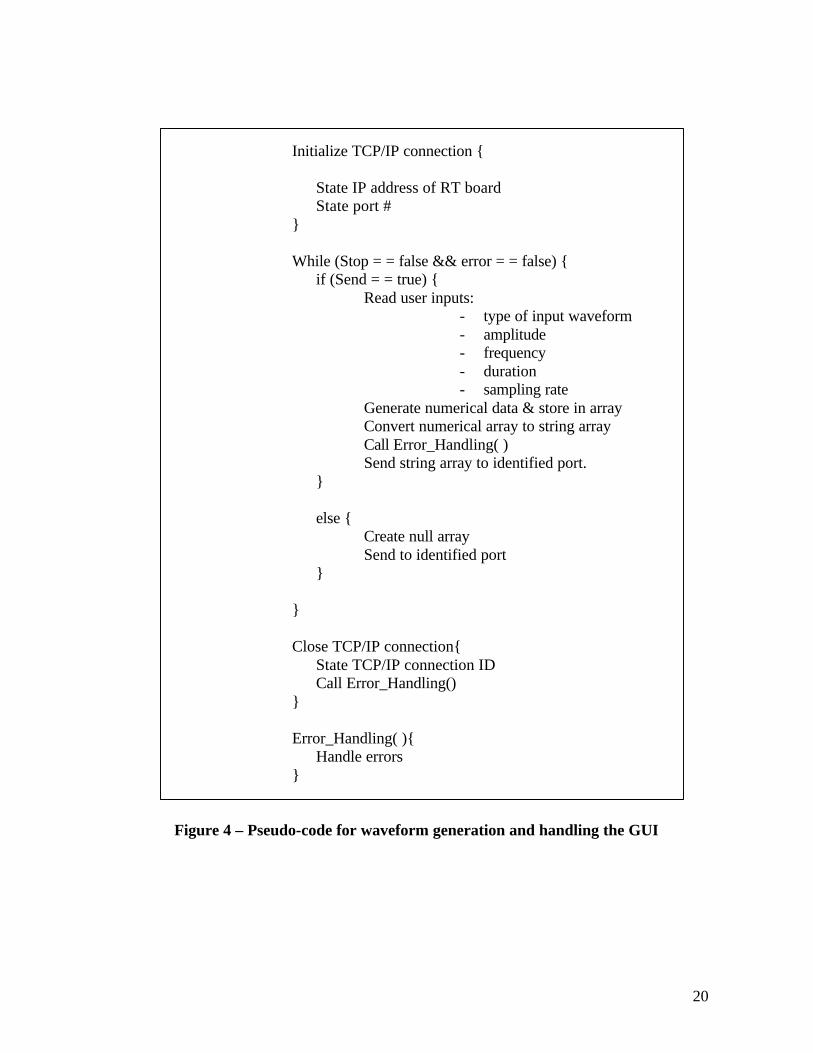
execution of the code. Fig. 4 outlines the pseudo-code implemented in LabVIEW on the
host-PC. As seen in the pseudo-code, the first step lies in initializing the TCP/IP
connection. The TCP/IP connection is established by naming the IP address and the Port
number for creating a connection and for sending the information to the particular Port.
These correspond to those for the Real-time board. Next, the user inputs are read,
numerical data for the particular waveform generated, error checks conducted, and the data
sent to the RT board. The numerical data consists of three quantities, an initial value for
the time, a time step, and an array of numerical voltage values representing the
acceleration. Note that the numerical data is converted into a string for communication
over the TCP/IP connection. Once the user sends a stop signal or if an error is encountered,
this process is aborted and the TCP/IP connection to the RT board is closed.
20
Initialize TCP/IP connection {
State IP address of RT board State port # } While (Stop = = false && error = = false) { if (Send = = true) { Read user inputs:
- type of input waveform - amplitude - frequency - duration - sampling rate
Generate numerical data & store in array Convert numerical array to string array Call Error_Handling( ) Send string array to identified port. } else { Create null array
Send to identified port }
} Close TCP/IP connection{
State TCP/IP connection ID Call Error_Handling() } Error_Handling( ){
Handle errors }
Figure 4 – Pseudo-code for waveform generation and handling the GUI

21
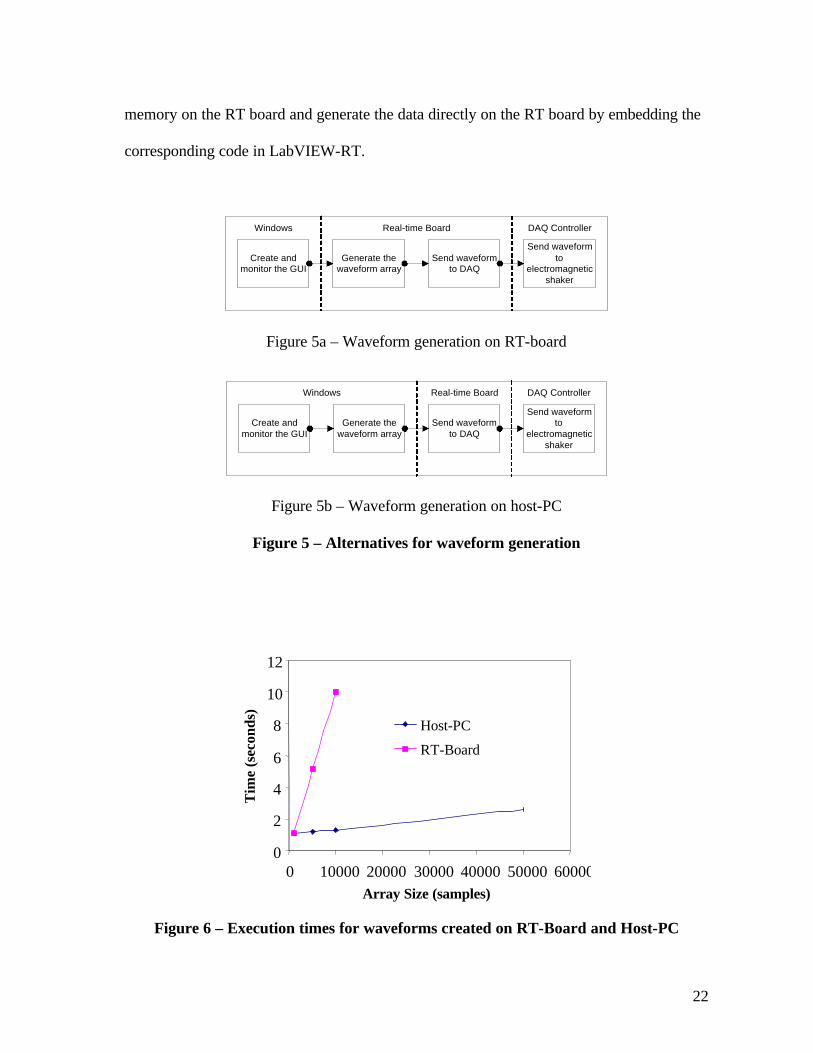
The code that creates the numerical data for the forcing function can be
implemented in two ways, as shown in Fig.5. In one, the digital values are generated
directly inside the LabVIEW code on the host-PC and stored in an array. This array is then
passed on to the real-time board through a TCP/IP connection. The RT-board then routs it
to the DAQ controller. The pseudo-code discussed earlier and shown in Fig. 4 is consistent
with this implementation. It may be argued, however, that this implementation is less
desirable due to excessive communication time that may be needed especially as the size of
array increases. Consequently, an alternative implementation may be adopted wherein the
user inputs and not the array are directly sent to the RT-board where they are used to
generate the numerical array using a code implemented in LabVIEW-RT. In this
implementation, the Windows processor also performs fewer operations. However, we
found that the former implementation in which the data is generated on the host-PC and
then transferred to the RT-board over TCP/IP connection through an array is faster in our
case. Therefore, we have selected this implementation in our study. Fig. 6 shows the
variation in the ratio of time delays due to the two implementations discussed above with
the size of array containing digital values. The results in the figure supports generation of
the array on the host-PC. This is so because of the relatively small size of the data being
generated for which the data transfer is relatively fast. As pointed out in Appendix I, the
resources available on the RT board in terms of processor speed and the memory size are
also relatively much smaller. Therefore, the tasks needed in generating digital values for
forcing function takes much more time leading to the observed inefficiency. In situations
where data size is large, it may be more efficient to use a high-speed processor and
22
memory on the RT board and generate the data directly on the RT board by embedding the
corresponding code in LabVIEW-RT.
Create andmonitor the GUI
Generate thewaveform array
Send waveformto DAQ
Send waveformto
electromagneticshaker
Windows Real-time Board DAQ Controller
Figure 5a – Waveform generation on RT-board
Create andmonitor the GUI
Generate thewaveform array
Send waveformto DAQ
Send waveformto
electromagneticshaker
Windows Real-time Board DAQ Controller
Figure 5b – Waveform generation on host-PC
Figure 5 – Alternatives for waveform generation
Figure 6 – Execution times for waveforms created on RT-Board and Host-PC
0
2
4
6
8
10
12
0 10000 20000 30000 40000 50000 60000Array Size (samples)
Tim
e (s
econ
ds)
Host-PC
RT-Board
23
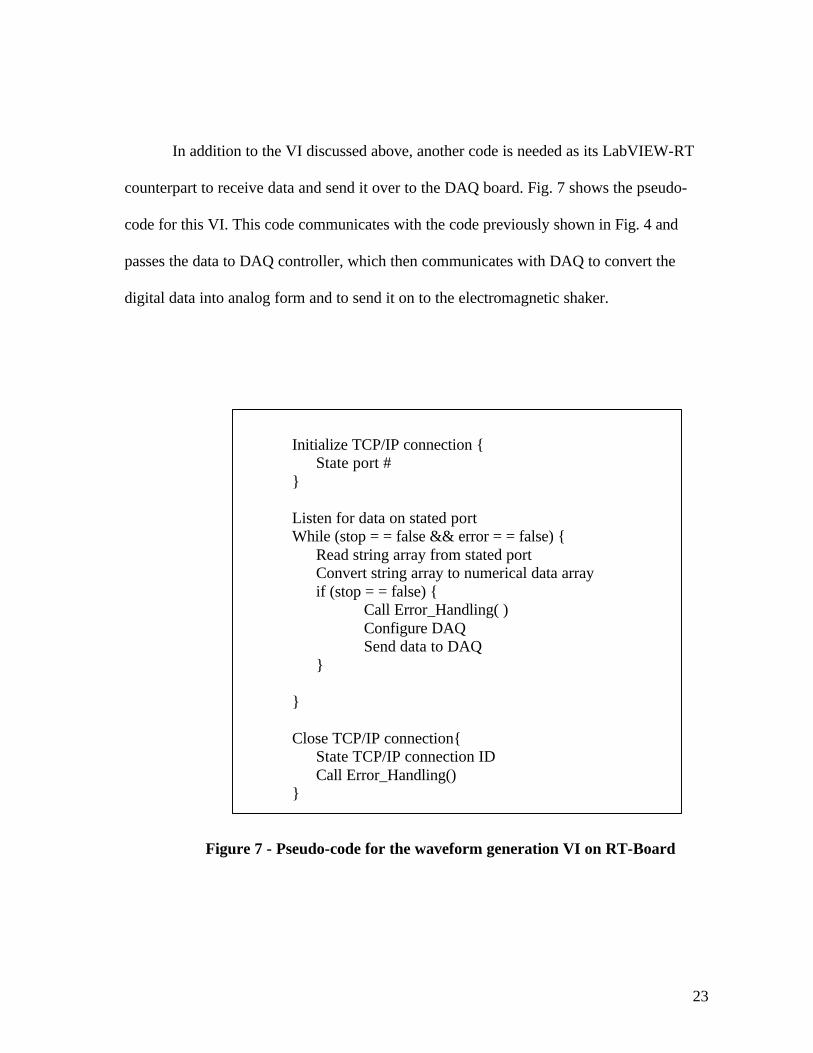
In addition to the VI discussed above, another code is needed as its LabVIEW-RT
counterpart to receive data and send it over to the DAQ board. Fig. 7 shows the pseudo-
code for this VI. This code communicates with the code previously shown in Fig. 4 and
passes the data to DAQ controller, which then communicates with DAQ to convert the
digital data into analog form and to send it on to the electromagnetic shaker.
Initialize TCP/IP connection { State port # } Listen for data on stated port While (stop = = false && error = = false) { Read string array from stated port
Convert string array to numerical data array if (stop = = false) {
Call Error_Handling( ) Configure DAQ Send data to DAQ } } Close TCP/IP connection{
State TCP/IP connection ID Call Error_Handling() }
Figure 7 - Pseudo-code for the waveform generation VI on RT-Board
24
As shown in Figs. 4 and 7, data transfer must occur as strings in order for the
TCP/IP connection to work properly. To do so, subVIs are used to typecast and
concatenate non-string data as string and vice versa. Concatenation is needed to handle
arrays or any other cluster of data before typecasting them into a single string. Typecasting
data back into numeric form once the transfer is complete requires that the information on
string length be sent in addition to the string itself. Separation of array elements from a
single string also requires that the data typecasting and the byte size for each element be
identical (defined as constant) on both the sub-VIs, i.e. sub-VI located on the host-PC and
its counterpart on RT-board.
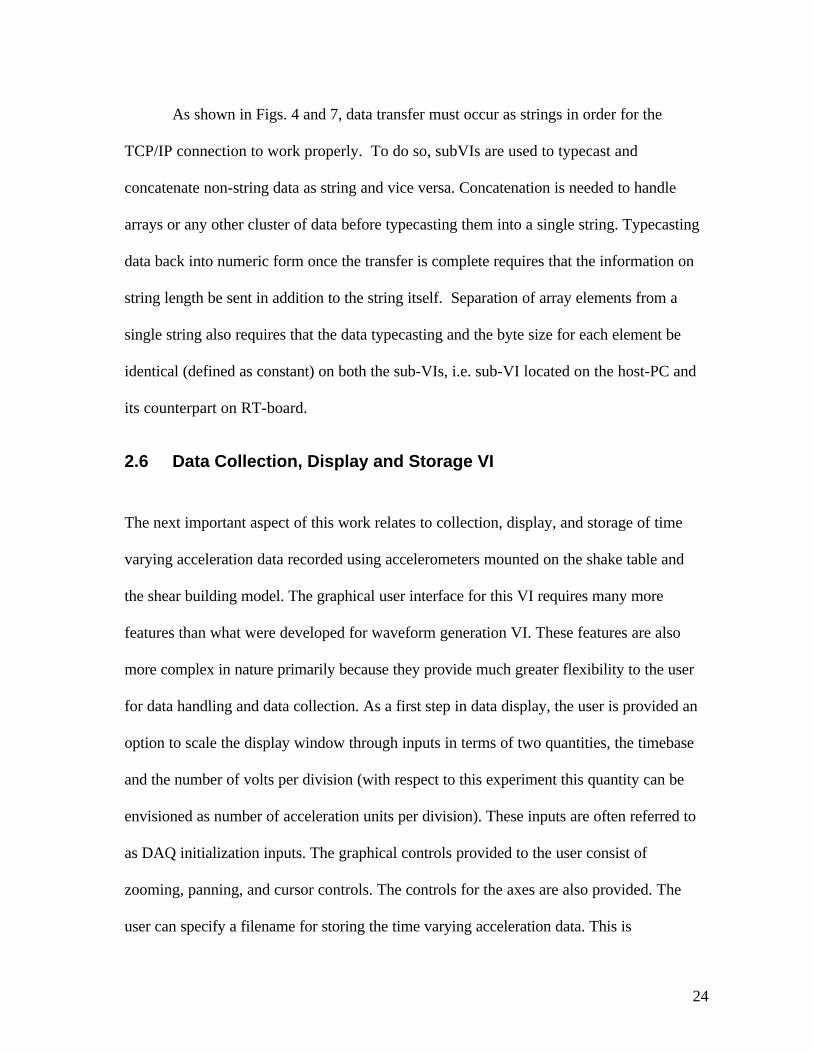
2.6 Data Collection, Display and Storage VI
The next important aspect of this work relates to collection, display, and storage of time
varying acceleration data recorded using accelerometers mounted on the shake table and
the shear building model. The graphical user interface for this VI requires many more
features than what were developed for waveform generation VI. These features are also
more complex in nature primarily because they provide much greater flexibility to the user
for data handling and data collection. As a first step in data display, the user is provided an
option to scale the display window through inputs in terms of two quantities, the timebase
and the number of volts per division (with respect to this experiment this quantity can be
envisioned as number of acceleration units per division). These inputs are often referred to
as DAQ initialization inputs. The graphical controls provided to the user consist of
zooming, panning, and cursor controls. The controls for the axes are also provided. The
user can specify a filename for storing the time varying acceleration data. This is
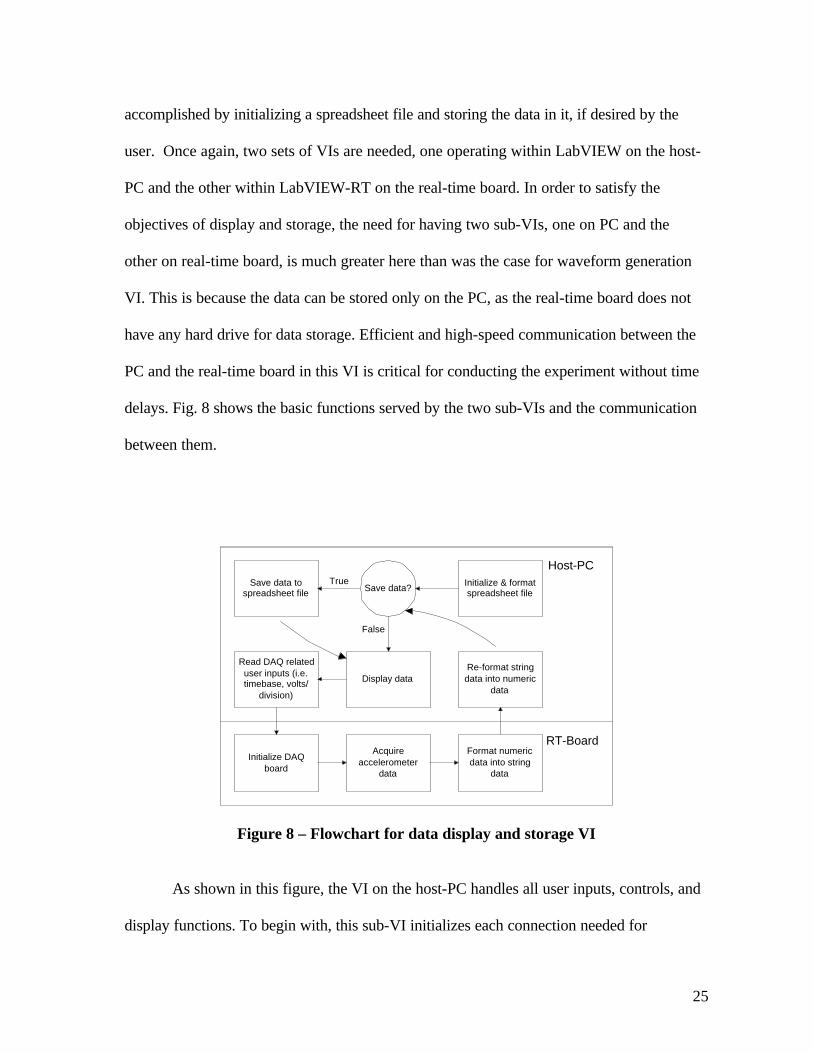
25
accomplished by initializing a spreadsheet file and storing the data in it, if desired by the
user. Once again, two sets of VIs are needed, one operating within LabVIEW on the host-
PC and the other within LabVIEW-RT on the real-time board. In order to satisfy the
objectives of display and storage, the need for having two sub-VIs, one on PC and the
other on real-time board, is much greater here than was the case for waveform generation
VI. This is because the data can be stored only on the PC, as the real-time board does not
have any hard drive for data storage. Efficient and high-speed communication between the
PC and the real-time board in this VI is critical for conducting the experiment without time
delays. Fig. 8 shows the basic functions served by the two sub-VIs and the communication
between them.
Save data tospreadsheet file
Initialize & formatspreadsheet file
Read DAQ relateduser inputs (i.e.timebase, volts/
division)
Display dataRe-format stringdata into numeric
data
Save data?
Initialize DAQboard
Acquireaccelerometer
data
Format numericdata into string
data
True
False
Host-PC
RT-Board
Figure 8 – Flowchart for data display and storage VI
As shown in this figure, the VI on the host-PC handles all user inputs, controls, and
display functions. To begin with, this sub-VI initializes each connection needed for

26
communicating with the real-time processor and establishes file I/O. In doing so, a
spreadsheet file is initialized in a tab-delineated format for data storage. The TCP/IP
connection is initialized in the same manner as was the case for waveform generation VI,
i.e. by the IP address of the real-time board and by a port number. User inputs that pertain
to the data acquisition are read and sent over the TCP/IP connection. These inputs include
the volts per division used for each accelerometer channel displayed as well as a timebase
for the acquisition. After the data has been acquired by the real-time board and sent to
host-PC as string data, it is re-converted into the numeric type. A separate array is
included for each of the accelerometer channels as well as an error cluster that would be
null if no error exists.
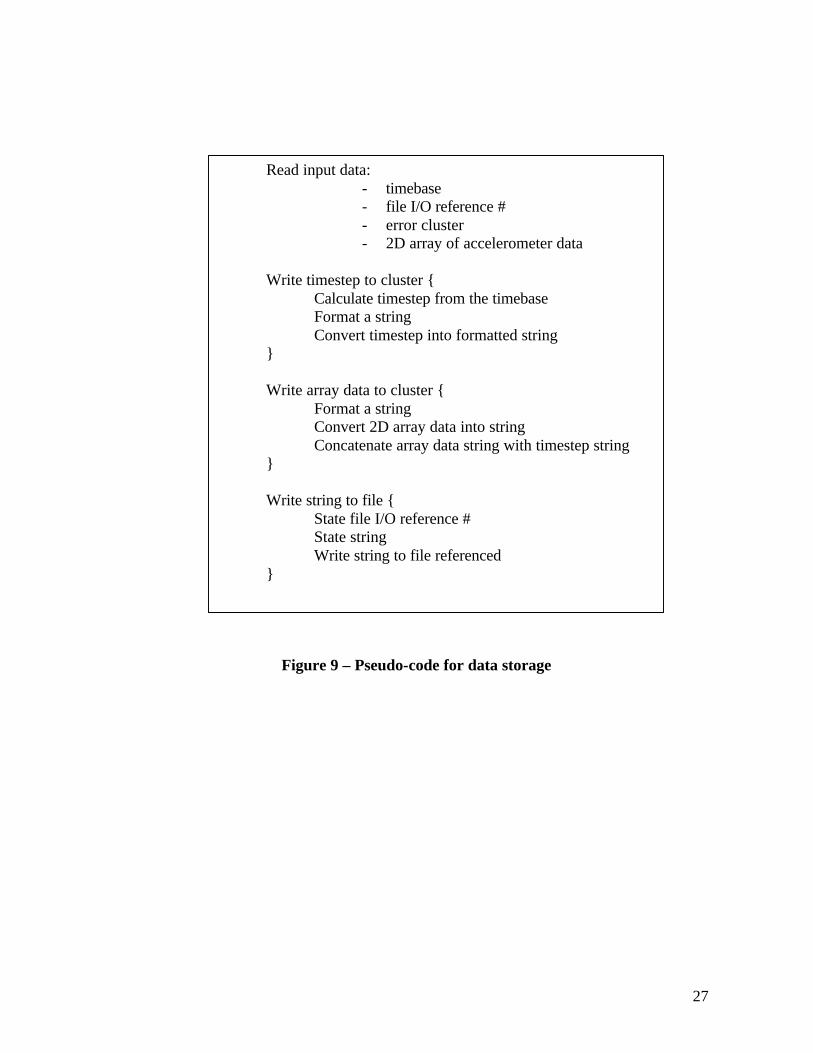
If the user requests data storage, the sub-VI on the host-PC enters a case structure
that handles the writing of the array data to the spreadsheet that was initialized earlier. Fig.
9 shows the pseudo-code used for this purpose. The data is then sent for on-screen display.
The actual block diagram code that sends the data to the graphical display is outlined by
the pseudo-code in Fig. 10. This process repeats itself until the user indicates otherwise.
Indication of a stop flag by the user closes the TCP/IP connection and file I/O. It then
handles the errors, if any.
27
Figure 9 – Pseudo-code for data storage
Read input data: - timebase - file I/O reference # - error cluster - 2D array of accelerometer data
Write timestep to cluster { Calculate timestep from the timebase Format a string Convert timestep into formatted string } Write array data to cluster { Format a string Convert 2D array data into string Concatenate array data string with timestep string } Write string to file { State file I/O reference # State string Write string to file referenced }

28
Figure 10 – Pseudo-code for data display
The sub-VI on the real-time board also handles DAQ. To begin with, it initializes
the DAQ using three inputs namely timebase, frame size, and the number of volts per
division. As explained above, it receives the user specified DAQ initialization data from
the data display VI on host-PC and sends it to an acquisition sub-VI for determining the
appropriate number of scans and scan rate for the analog input. These values, therefore,
govern the speed at which the data acquisition occurs as well as the quality of display for
the output acceleration curves. The “timebase” refers to the number of milliseconds
represented by each individual division on the x-axis of display. Consequently, increasing
the timebase increases the duration (the number of seconds) of data that is displayed on the
screen at any given time. “Frame size” is the number of scans made by DAQ for acquiring
Read input data: - volts/division for both accelerometers - 2D array of accelerometer data - timeout data - error data
if ((Acquire On || Acquire Once == true) && (timeout ==
false)) { Update graph { Apply volts/division to graph Send accelerometer data to screen } }
29
data in each feedback loop. The frame size affects not only the number of data points
collected in each DAQ loop but also the size of data displayed on the screen. For example,
if the x-axis is showing 500 frames of data and the timebase is set to 20 ms/div then there
are 1000 ms or 1 second of data displayed. The third input parameter is “volts per
division.” Its value denotes the number of volts represented by each division on the y-axis.
Like timebase, volts per division determines the actual voltage values corresponding to the
data displayed on the screen. If the y-axis value of a particular point of interest on the
display graph is equal to 5 and the volts per division is set at 500 mV/div then the actual
voltage of the point is 2500 mV or 2.5 V.
In summary, these three values affect the scaling of display. While the axes can
also be scaled by the user through graphical controls, the time and volts represented by
each division remains constant and equal to the values specified by the user through
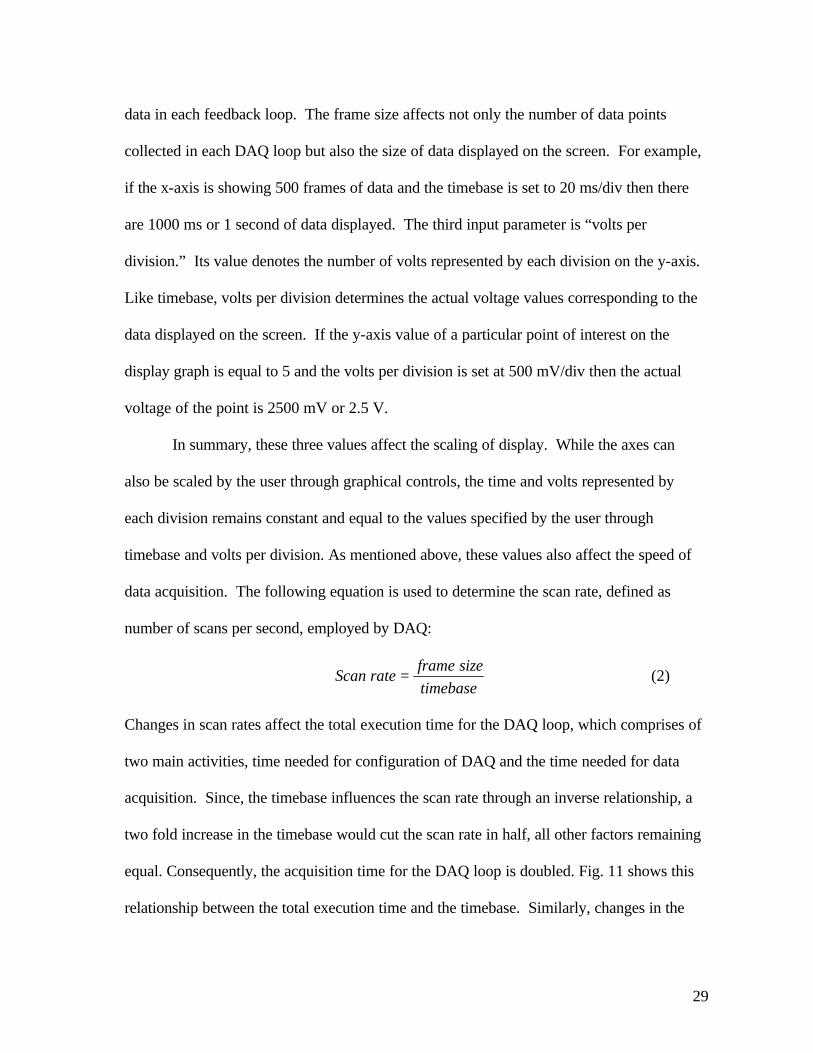
timebase and volts per division. As mentioned above, these values also affect the speed of
data acquisition. The following equation is used to determine the scan rate, defined as
number of scans per second, employed by DAQ:
timebase
sizeframerateScan = (2)
Changes in scan rates affect the total execution time for the DAQ loop, which comprises of
two main activities, time needed for configuration of DAQ and the time needed for data
acquisition. Since, the timebase influences the scan rate through an inverse relationship, a
two fold increase in the timebase would cut the scan rate in half, all other factors remaining
equal. Consequently, the acquisition time for the DAQ loop is doubled. Fig. 11 shows this
relationship between the total execution time and the timebase. Similarly, changes in the
30
frame size also change the scan rate directly. If the frame size is doubled so will the scan
rate. However, a change in the frame size also changes the number of points collected by
DAQ. A higher scan rate allows for more data points to be collected within an allotted time
period. Therefore, a two-fold increase in the frame size will result in a two-fold increase in
not only the acquisition time but will also double the number of points collected. For this
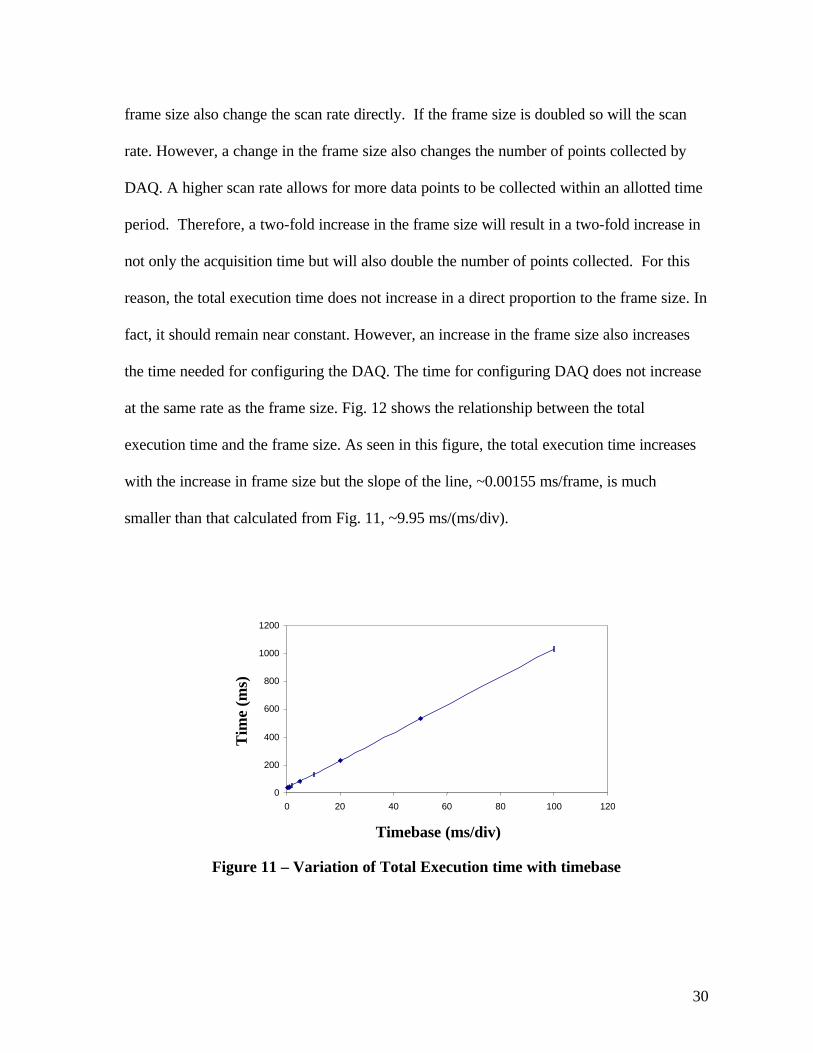
reason, the total execution time does not increase in a direct proportion to the frame size. In
fact, it should remain near constant. However, an increase in the frame size also increases
the time needed for configuring the DAQ. The time for configuring DAQ does not increase
at the same rate as the frame size. Fig. 12 shows the relationship between the total
execution time and the frame size. As seen in this figure, the total execution time increases
with the increase in frame size but the slope of the line, ~0.00155 ms/frame, is much
smaller than that calculated from Fig. 11, ~9.95 ms/(ms/div).
Figure 11 – Variation of Total Execution time with timebase
0
200
400
600
800
1000
1200
0 20 40 60 80 100 120
Timebase (ms/div)
Tim
e (m
s)

31
Figure 12 – Variation of Total Execution time with frame size
2.7 Handshaking VI
As mentioned earlier, another VI is needed for monitoring any disruption of electronic
communication that may occur between the host-PC and the RT-board. This VI is based on
employing the concept of “handshaking.” As shown in Fig. 13, it consists of a sub-VI on
host-PC that continually sends a signal to the real-time board. The sub-VI on the RT-board
listens for this signal. If the signal is received, it continues monitoring. If the stop signal is
received, the code exits and closes the TCP/IP connection. Any other programs running on
the real-time board are allowed to continue execution. However, it would not receive any
signal if a disruption of electronic communication occurs between the two. If no valid
signal is transferred from the host machine, the code stops execution of each LabVIEW-RT
program running on the real-time board. It is important to note that this code is only
checking for a proper connection between the PC and real-time processors. Therefore,
0
50
100
150
200
250
300
350
0 10000 20000 30000 40000 50000 60000
Frame Size (frames)
Tim
e (m
s)

32
there is no dependence on the VI’s handling the shake table operation and display. The
intended purpose is to allow the handshaking code to be modular in nature and execute
with other codes using both the PC and real-time processors. The feature that allows the
program to be stopped, without shutting down each of the LabVIEW-RT programs
executing on the real-time board, provides an added flexibility to the administrator for
manually switching off each program that is executing on the real-time board without
having to reboot LabVIEW-RT.
Windows 2000Operating System
sends signal
“OK”Signal
Received?
True
Shut downall LabVIEWcode on theReal-time
board
False
Stophandshaking
code only
“Stop”Signal
Received?
True
False
Figure 13 - Flowchart for functionality of handshaking VI
2.8 Error Handling
In this section, we discuss the error handling procedures that were mentioned in the
previous sections and the corresponding pseudo codes. Several different types of errors are
checked and handled accordingly by each VI developed in this study. These include: (a)
errors created by improper hard coding for the hardware used, (b) software related errors,
Host-PC Sends signal
33
and (c) errors due to violation of safeguards against misuse. Please note that each element
in the error handling is critical for ensuring a safe shut down of the experiment and avoid
any software or hardware related damage. If an error occurs, it is added to an error cluster
by specifying the error number as well as the name of sub-VI where the error is detected.
All the errors are considered collectively as a cluster and passed as an input into each VI or
sub-VI. Existence of an error in the input cluster, indicated by a non-null value, ensures
that the particular VI or sub-VI is not executed thereby avoiding any unwarranted
operations. Instead, the data and the error cluster are passed on to the next process. Once
the error cluster reaches the sub-VI for error handling, the experiment is shut down and an
error message is sent for display to the user. A description of the particular error can then
be obtained from within the LabVIEW software by using the error number and help drop-
down menu.
Hardware errors can occur due to incorrect device numbers, insufficient memory,
and insufficient disk space. Device numbers can be incorrect if the devices are not
connected appropriately. While LabVIEW handles several different errors by default,
those pertinent to this study include TCP/IP and timeout related errors, errors generated
through analog input and output, and file I/O errors. As discussed in previous sections,
each of the three primary VI’s developed in this study requires data communication
between the host-PC and the RT-board through TCP/IP connections. Therefore, each VI
should be able to not only identify the incorrect TCP/IP addresses or port numbers but also
make sure that the connection is not timed out. Hardware errors can also occur if the DAQ
device number is incorrect or if the device has not been properly configured. Among the
software errors, an error free execution of this setup requires a LabVIEW-compatible

34
driver associated with the DAQ device. Also, the buffer overflows should be checked.
Buffer overflows may occur while sending and receiving information from DAQ. The VI
developed for data storage handles file I/O errors such as those due to incorrect file-paths
specified by the user.
In addition to the hardware and software errors, misuse or mishandling of
experiment can cause errors if the safeguard checks built into the code are violated. As
discussed earlier, these checks are needed for limiting the quantities that relate to both the
input into the shake table as well as to the output acceleration data. The limits are set by
the administrator based on a particular experiment being conducted. With respect to the
user specified input through the waveform generation VI, the administrator can specify
permissible values or a range for the amplitude, frequency, time duration, and scan-rate
controls. If the user inputs values that lie outside the administrator specified range, the
inputs are forced to the nearest values specified by the administrator. The user is prevented
from specifying large duration excitation waveforms to prevent fatigue related damage in
the shear building specimen. This safeguard limit associated with the duration of excitation
is also helpful in safe operation if the electronic communication with the remote user (and
not the host-PC) is disrupted due to a failure of internet connection or a failure of operating
system on his machine. In such a scenario, the experiment is simply brought to a halt after
the initial run of a specified duration. It simply waits for the next input. The remote user
can restart his computer or reestablish the internet connection without requiring the
administrator to restart the LabVIEW on host-PC.
Limits on output accelerations recorded on the shear building specimen and the
shake table are used in conjunction with the feedback associated with the data display VI.
35
Each array of data received from the shake table and structure has its maximum value
compared with an administrator specified value. If the maximum value is exceeded,
LabVIEW stops execution and the experiment is shut down in a safe manner. The purpose
is to prevent excitation of the shake table at large amplitude when the excitation frequency
is in resonance or near resonance with the frequency of structure.
2.9 Web Accessibility and Remote Observation
It is important to note that the particular scheme described above and implemented on the
host-PC is targeted towards simplifying the implementation for remote access, observation,
and control. Web accessibility requires that each VI that is available to the remote users
must also reside on the web server. As stated earlier, web hosting can be achieved either
directly through the host-PC or by using an additional server. Use of an additional machine
is more desirable due to increased safety and reduced load on the host-PC. However, it
requires additional resources and may also face issues related to the use of LabVIEW
specific plug-ins as discussed below. To facilitate the objective of this initial exploratory
work and to maintain the simplicity of implementation, we directly used the host-PC as the
web server. Consequently, no additional work is needed in order to make the two VIs, one
for the waveform generation and the other for data display and storage, available to the
remote user for I/O. LabVIEW has a built-in web server that was used in this
implementation. It allows remote access to a static list of valid IP addresses that is
specified by the administrator. It also allows specific IP addresses to be completely
blocked and allows different types of access to different IP addresses, i.e. access for only
remote observation or access for control in addition to observation.
36
While it is desired to have multiple users with access for simultaneously observing
the experiment, it is undesirable to have multiple users with simultaneous access to control
the experiment. This can be accomplished by employing the queue features. Once a user
has been granted the control, any new user is allowed to view the GUI’s but must wait in a
queue to gain control rights to the GUI’s. The administrator can remove control access to
a particular user or block a user from viewing it at any time.
Each VI that is served over the web must be configured as a “visible VI” within the
LabVIEW code. A control time limit for each individual VI is set as well. If this time
limit expires, which starts upon a user gaining control of the experiment, the user loses
control to the next person waiting in the queue. The purpose is to facilitate scheduling and
ensuring that a single person does not hold control for a large amount of time or leave
without relinquishing control. Once the VI’s are configured by declaring them as visible
VI’s and the associated time limits are incorporated, the LabVIEW front panels (GUI) for
each visible VI can be embedded into the html code. These configuration changes provide
additional security by allowing only the GUI to be accessible to the remote user. The
actual code behind the front panel and safeguard limits are inaccessible to the remote user.
With the setup described in this study, remote users must have web browsers that
allow viewing of LabVIEW front panels. This functionality can be added to a web
browser by downloading a shareware run-time engine referred to as LabVIEW-Player
(National Instruments -d).
Remote observation is facilitated by incorporating a video stream of the experiment
in addition to the control and display GUI’s. With the inclusion of video in the html code,
the user has the ability to see the physical motion of the table and the structure in addition
37
to the control and data display offered through the VI’s. Presently, Microsoft Netmeeting
software is embedded for video streaming. Like LabVIEW-Player, this is also a share-
ware available from Microsoft.
2.10 Parallel Loops and Remote Front Panels
While a complete description of the proposed implementation has been provided so far, we
would also like to discuss two additional implementations that may be viewed as
alternatives to the proposed scheme. These are referred to as parallel loops and remote
front panels. Parallel loops is a programming structure available within LabVIEW that can
be used to reduce the number of VIs. Each of the three primary VIs, which have been
developed in this study, is implemented as a pair, i.e. as a VI on the host-PC and its
counterpart on the RT-board. All together, they represent three pairs (six individual
LabVIEW programs) that can be condensed into a single pair by pursuing parallel loop
structure. This pair would consist of only one VI for conducting all the LabVIEW
operations on the host-PC and the other VI for conducting them on the RT-board. Such an
implementation would improve the startup and shutdown procedures. Also, a single VI
would need to be configured as a visible-VI for remote access, observation, and control.
However, the modularity of the proposed implementation will be lost by using a parallel
loop structure. Loss of modularity will severely restrict the portability of this
implementation to other experiments in future. Modularity also facilitates the
implementation of the error handling procedure. Further, it is likely that a single loop
within a parallel loop structure can consume most of the available resources on a device
thereby slowing down the feedback and even jeopardizing the safe shutdowns.
38
Use of remote front panels (National Instruments -e) is another LabVIEW option
that would eliminate the need of running separate VIs on the host-PC and the related data
communication with the RT-board over TCP/IP. In this option, all the VIs can be
implemented directly on the RT-board and served to the PC as remote front panels. The PC
would then simply provide web-hosting services. However, this implementation would
require not only a capability for web-serving built into the RT-board but also a hard disk
for data storage on it. These requirements make this option cost-intensive. Therefore, we
did not considerate and cannot comment on additional issues related to appropriate error
handling and safe shutdowns.
2.11 Conclusions
This paper describes an implementation for converting a forced vibration shake table
experiment to enable remote access, observation, control, and data collection. The
proposed implementation is based on utilizing the capabilities of LabVIEW programming
environment. The modular implementation presented here has the flexibility for
application to other experiments with only minor modifications. This study targets a key
objective that is focused on development of an implementation which can protect the
equipment damage from not only misuse but also unmonitored operation that may occur
due to system or network failures. Damage free operation and shutdown is ensured by
employing a real-time counterpart of LabVIEW that is located on a real-time board.
Among various implementations possible, it is found that data communication over
TCP/IP is the best-suited alternatives for maintaining modularity as well as for
safeguarding against possible damage. A separate handshaking module is developed to

39
check continuity of communication between the real-time board and the host computer. It
enables safe shutdowns when electronic communication is disrupted due to system or
network failures. Provision is made for allowing administrator specified limits on the input
and output data to safeguard against misuse. While multi-user viewing is permitted, control
is granted to only a single remote user. Presently, the web access is allowed by using a
static list of pre-existing IP addresses.
Acknowledgements
This research was partially supported by the Center for Nuclear Power Plant Structures,
equipment and Piping at North Carolina State University, the department of Civil
Engineering at North Carolina State University, and North Carolina State University.
Resources for the Center come from the dues paid by member organizations and from the
College of Civil Engineering in the University.

40
References
1. Bohus, C. L., Crowl., A., Aktan, B. and Shor, M. H. (1996) “Running control
engineering experiments over the internet, in Proceedings of the 13th IFAC World
Congress, San Francisco, CA, paper no. 4c-03.
2. Corradini, M. L., Ippoliti, G., Leo, T. and Longhi, S. (2001) “An internet based
laboratory for control education,” in Proceedings of the 40th IEEE conference on
Decision and Control, Orlando, FL, December 2001.
3. Ko, C. C., Chen, B. M., Ramakrishnan, V., Chen, R., Hu, S. Y., and Zhuang, Y. (2000)
“A large scale web-based virtual oscilloscope laboratory experiment,” IEEE Sci.
Educ. Journal, vol. 9, no. 2, pp. 69-76.
4. Meriam, J. L., Kraige, L. G., and Palm III, W. J. (2002) “Engineering Mechanics,
Dynamics.” Fifth Edition. John Wiley & Sons.
5. Oliphant, J. and Oliver, A.W. (1999) “Computer-aided learning program for teaching
effective stress to undergraduates” Geotechnical and Geological Engineering, v17,
n2, Kluwer Academic Publishers Dordrecht Netherlands, pp 85-97.
6. Poindexter, S. E. and Heck, B. S. (1999) “Using the web in your courses: What can you
do? What should you do?,” IEEE Control System, vol.9, no.1, pp. 83-92.
7. Shor, M. and Bhandari, A. (1998) “Access to an instructional control laboratory
experiment through the world wide web,: in Proceedings of 1998 American
Control Conference, Philadelphia, PA, pp. 1319-1325.
41
8. Smith S. R., Husted, C. W., Smith, S. and Cross, B. (2000) “A web-based tutorial and
tele-operation system for earthquake engineering education,” Proceedings of 30th
ASEE/IEEE Frontiers in Education Conference, Kansas City, MO, October 18-21.
9. Travis, J. (2000) "Internet Applications in LabVIEW," Prentice-Hall.
10. Wells, L., and Travis, J. (1997) "LabVIEW For Everyone," Prentice Hall.
11. Yorkovich, S. and Passino, K. M. (1996) “An intelligent control laboratory course, in
Proceedings of the 13th IFAC World Congress, San Francisco, CA, paper no. 4c-03.
12. http://www.neesgrid.org “NEES Community Requirements Workshop Final Report.”
Technical Report NEESgrid-2001-03.
13. National Instruments -a. http://volt.ni.com/niwc/common.jsp?page=labview_what
“What is LabVIEW?”
14. National Instruments -b. http://sine.ni.com/apps/we/nioc.vp?cid=1381&lang=US “NI
LabVIEW”
15. National Instruments -c. http://sine.ni.com/apps/we/nioc.vp?cid=2381&lang=US
“LabVIEW Real-Time”
16. National Instruments -d.
http://digital.ni.com/demo.nsf/websearch/00583509E7D612BD86256AEF0072C73
3?OpenDocument&node=1381_US “Download the Free LabVIEW Run-Time
Engine”
17. National Instruments -e. http://sine.ni.com/apps/we/nioc.vp?cid=11017&lang=US
“LabVIEW Remote Panels”
42
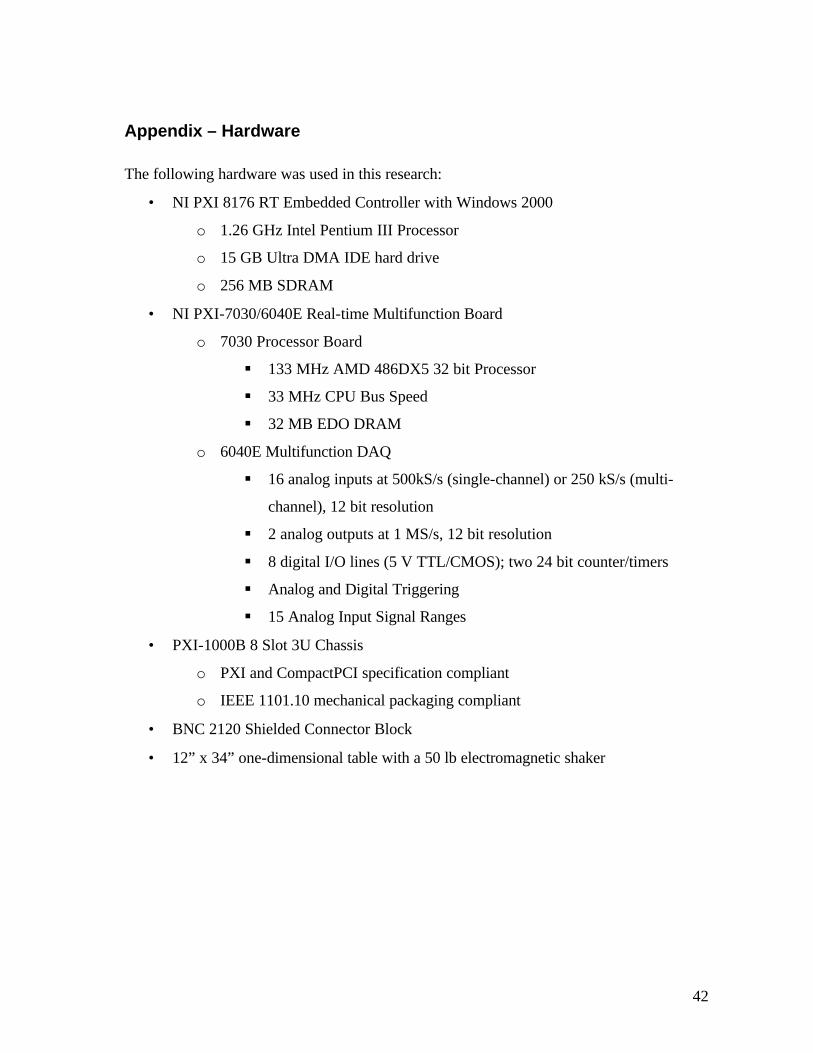
Appendix – Hardware
The following hardware was used in this research:
• NI PXI 8176 RT Embedded Controller with Windows 2000
o 1.26 GHz Intel Pentium III Processor
o 15 GB Ultra DMA IDE hard drive
o 256 MB SDRAM
• NI PXI-7030/6040E Real-time Multifunction Board
o 7030 Processor Board
§ 133 MHz AMD 486DX5 32 bit Processor
§ 33 MHz CPU Bus Speed
§ 32 MB EDO DRAM
o 6040E Multifunction DAQ
§ 16 analog inputs at 500kS/s (single-channel) or 250 kS/s (multi-
channel), 12 bit resolution
§ 2 analog outputs at 1 MS/s, 12 bit resolution
§ 8 digital I/O lines (5 V TTL/CMOS); two 24 bit counter/timers
§ Analog and Digital Triggering
§ 15 Analog Input Signal Ranges
• PXI-1000B 8 Slot 3U Chassis
o PXI and CompactPCI specification compliant
o IEEE 1101.10 mechanical packaging compliant
• BNC 2120 Shielded Connector Block
• 12” x 34” one-dimensional table with a 50 lb electromagnetic shaker
43
Part III
Summary and Conclusions

44
3.1 Summary
In converting a forced vibration shake table test into a remotely accessible laboratory the
most basic setup was observed. This setup had a function generator attached to an
electromagnetic shaker used for creating the forcing function and an oscilloscope
connected to accelerometers monitoring the table motion and structure motion. The
oscilloscope received and displayed the acceleration data. With this data the natural
frequency and damping ratio of the structure residing on the shaker could be calculated.
Any remote application would need to allow the user control of the forcing function
generation as well as display all data needed to find the natural frequency and damping
ratio.
LabVIEW was chosen as the programming language to implement a solution that
met each of the needs of control and display. This was a natural choice due to the built in
DAQ functions of LabVIEW and the ease of creating intuitive GUI’s. Adding real-time
control gave additional stability against operating system problems by using a dedicated
processor and memory to carry out each VI embedded into the real-time hardware.
Once LabVIEW was chosen, multiple programming options were made available
for a remote solution. Hardware and software limitations led to the final implementation.
Parallel loops offered the most compact and easily administrable choice. However,
communication between the Windows and real-time board were difficult to manage.
Ensuring proper hardware sharing between each loop was likewise a problem. A shared
memory connection between the real-time and Windows architectures was another possible
solution. This caused clutter in the code and a decrease in modularity of the code in
45
general. Memory management and array transfer was also a concern. Placement of the
waveform generation portion of the code on the real-time board was a third option. This
decreased I/O but required the more limited resources on the real-time board to handle
more processing which led to a slow down of the system.
By eliminating the previous options, a solution utilizing three VI’s using TCP/IP
communication was developed to allow control over and create the forcing waveform,
display and save acceleration data, and monitor the host-PC to RT-board connection. The
waveform generation VI establishes user control over frequency, amplitude, waveform
type, and time-length as well as creates the waveform from this user data and sends it to
DAQ analog output. The data collection, display, and saving VI collects data from DAQ
analog input and displays the data on a scope graph with cursors and scales that can be
altered by the user. This data can also be saved in tab-delineated format to a user specified
file. The third VI, handshaking function, monitors the connection between the Windows
and real-time systems and properly stops LabVIEW execution on the real-time board if the
connection is interrupted.
With this option implemented, serving the necessary VI GUI’s to the web was an
issue of using the built-in LabVIEW server. This required configuration of browser access
and visible VI’s. This also required the user to download a LabVIEW-Player. In addition
to the visible VI’s, video streaming was added to give a more complete understanding of
the setup to the remote user. Presently, we have employed only a simple web-cam for
video streaming. A high-end camera that can provide a high frequency frame rate can
provide an ability to serve the purpose of a strobe light, i.e. video frames when displayed

46
only at a user specified frequency will allow illustration of the concept of mode shapes, as
was discussed earlier. However, this has not been addressed in the present study.
3.2 Conclusions
The following conclusions are based on the procedure followed in this research and
summarized in the preceding section:
• The work shown in this research outlines an implementation for converting a
forced vibration shake table experiment to enable remote access, observation,
control, and data collection.
• The LabVIEW programming environment allows each control, collection, display,
and saving concern to be met.
• The modular implementation developed in this research has the flexibility for
application to other experiments with only minor modifications.
• This setup protects the system from misuse and unmonitored operation.
• The use of LabVIEW RT and a real-time board ensures damage free operation and
safe shutdown.
• TCP/IP connections for communication of data between the host-PC and RT-board
were found to be the best connection type for this application.
• A separate handshaking module is used to check for continuity in communication
between the real-time board and host PC and enables safe shutdown during a
system failure.
• The administrator is given access to change specified input limits to safeguard
against misuse.
47
• Multi-user viewing is permitted but control is granted to a single remote user at one
time.
• Web access is limited to computers existing on a static list of IP addresses to
protect from unauthorized access.
3.3 Future Work
• Addition of software capable of manipulating the frame rates of the video stream.
This will allow the user to see a strobe light effect that will easily show the
different vibration modes of the structure by tuning the frame rate with the
structure’s natural frequency.
• Adding a static testing phase. This will allow for a second approach to finding the
natural frequency. The use of a robot arm controlled by LabVIEW code similar to
the VI’s developed in this research is being explored. This arm would be able to
apply a known load or displacement to the shake table and hold it in this position.
• Adding a free vibration phase. The robot arm described above would be able to
release the structure from its at-rest position. The resulting free vibration response
could be used to obtain damping and frequency information from the structure.
• Increasing internet security by way of a more complete authentification process
including both a static list of IP addresses and password protections.
• Conversion of other structural experiments to remotely accessible experiments
through study of the research completed in this project.
• Develop more sophisticated constraint functions for the administrator to use to
prevent misuse. Such functions might monitor the cumulative usage factors for a

48
structure. This information could also be used to determine when columns on the
shear building should be changed.
49
Appendix
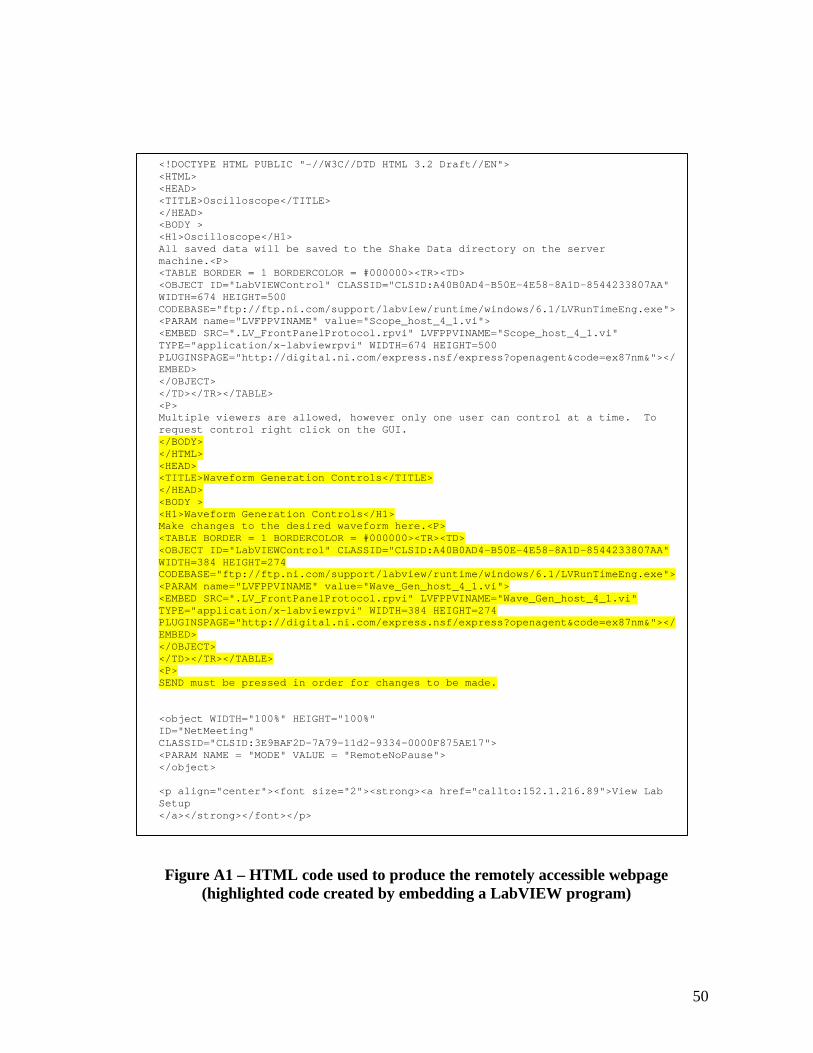
50
Figure A1 – HTML code used to produce the remotely accessible webpage (highlighted code created by embedding a LabVIEW program)
<!DOCTYPE HTML PUBLIC "-//W3C//DTD HTML 3.2 Draft//EN"> <HTML> <HEAD> <TITLE>Oscilloscope</TITLE> </HEAD> <BODY > <H1>Oscilloscope</H1> All saved data will be saved to the Shake Data directory on the server machine.<P> <TABLE BORDER = 1 BORDERCOLOR = #000000><TR><TD> <OBJECT ID="LabVIEWControl" CLASSID="CLSID:A40B0AD4-B50E-4E58-8A1D-8544233807AA" WIDTH=674 HEIGHT=500 CODEBASE="ftp://ftp.ni.com/support/labview/runtime/windows/6.1/LVRunTimeEng.exe"> <PARAM name="LVFPPVINAME" value="Scope_host_4_1.vi"> <EMBED SRC=".LV_FrontPanelProtocol.rpvi" LVFPPVINAME="Scope_host_4_1.vi" TYPE="application/x-labviewrpvi" WIDTH=674 HEIGHT=500 PLUGINSPAGE="http://digital.ni.com/express.nsf/express?openagent&code=ex87nm&"></EMBED> </OBJECT> </TD></TR></TABLE> <P> Multiple viewers are allowed, however only one user can control at a time. To request control right click on the GUI. </BODY> </HTML> <HEAD> <TITLE>Waveform Generation Controls</TITLE> </HEAD> <BODY > <H1>Waveform Generation Controls</H1> Make changes to the desired waveform here.<P> <TABLE BORDER = 1 BORDERCOLOR = #000000><TR><TD> <OBJECT ID="LabVIEWControl" CLASSID="CLSID:A40B0AD4-B50E-4E58-8A1D-8544233807AA" WIDTH=384 HEIGHT=274 CODEBASE="ftp://ftp.ni.com/support/labview/runtime/windows/6.1/LVRunTimeEng.exe"> <PARAM name="LVFPPVINAME" value="Wave_Gen_host_4_1.vi"> <EMBED SRC=".LV_FrontPanelProtocol.rpvi" LVFPPVINAME="Wave_Gen_host_4_1.vi" TYPE="application/x-labviewrpvi" WIDTH=384 HEIGHT=274 PLUGINSPAGE="http://digital.ni.com/express.nsf/express?openagent&code=ex87nm&"></EMBED> </OBJECT> </TD></TR></TABLE> <P> SEND must be pressed in order for changes to be made. <object WIDTH="100%" HEIGHT="100%" ID="NetMeeting" CLASSID="CLSID:3E9BAF2D-7A79-11d2-9334-0000F875AE17"> <PARAM NAME = "MODE" VALUE = "RemoteNoPause"> </object> <p align="center"><font size="2"><strong><a href="callto:152.1.216.89">View Lab Setup </a></strong></font></p>

51
Figure A2 – LabVIEW Front Panel for the waveform generation VI
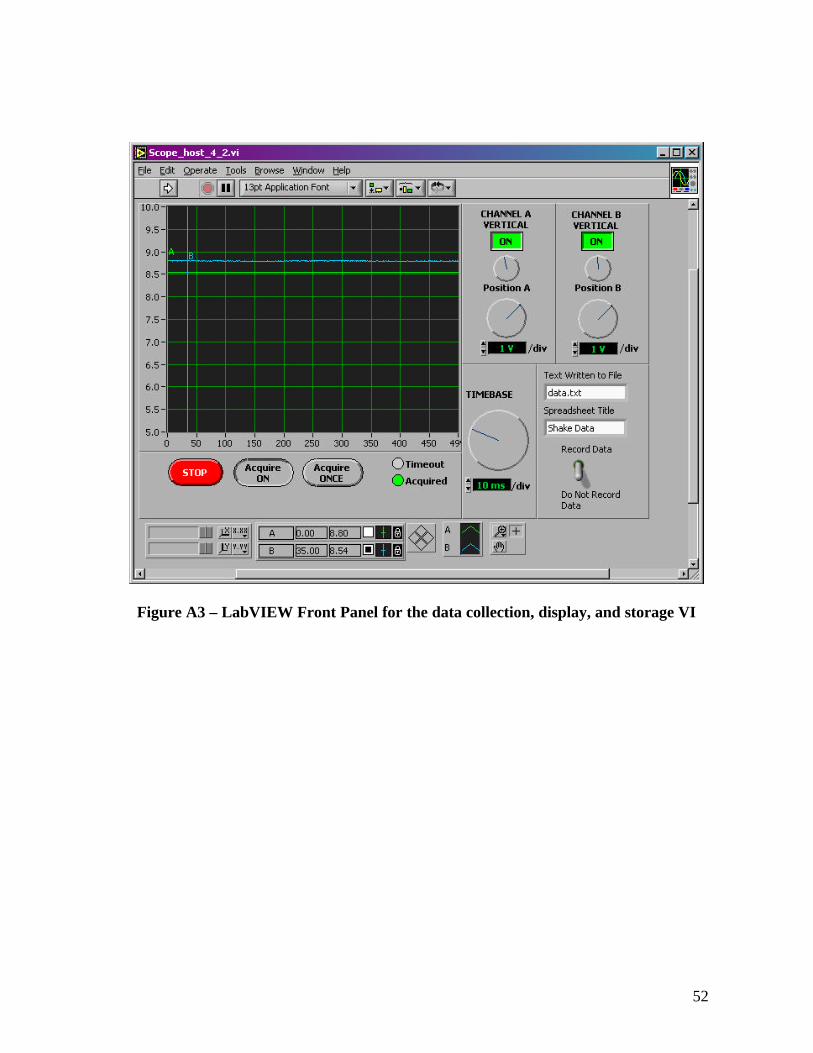
52
Figure A3 – LabVIEW Front Panel for the data collection, display, and storage VI
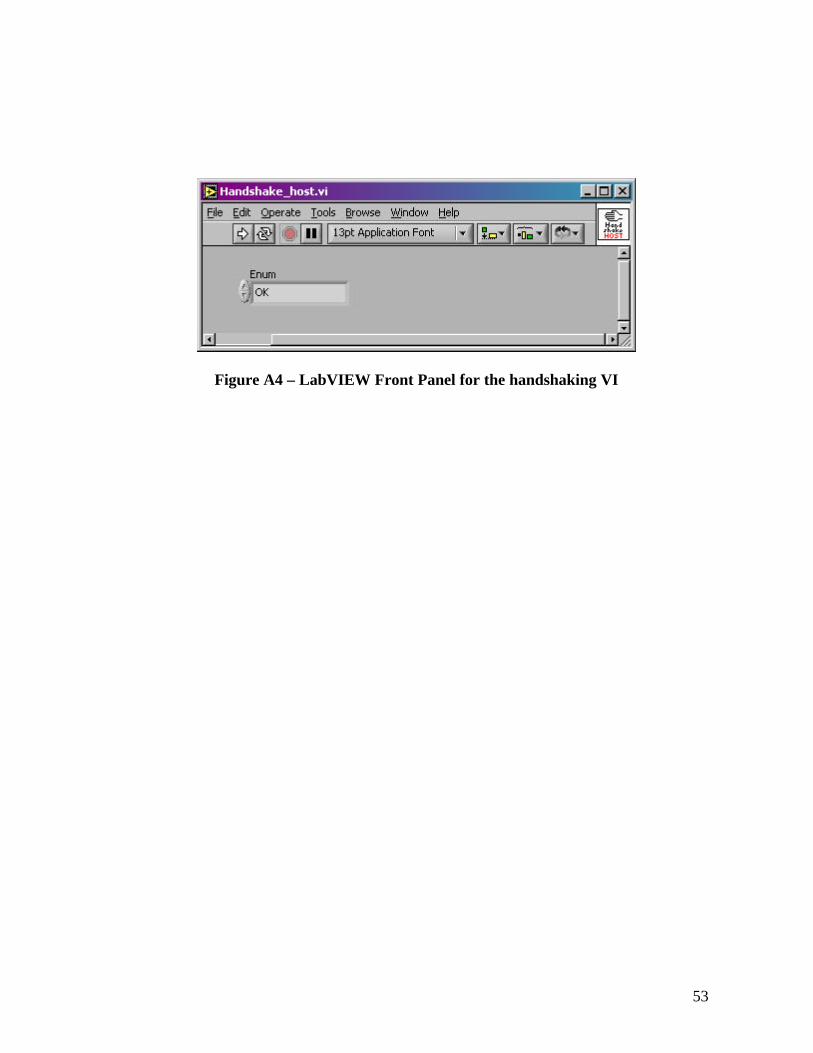
53
Figure A4 – LabVIEW Front Panel for the handshaking VI
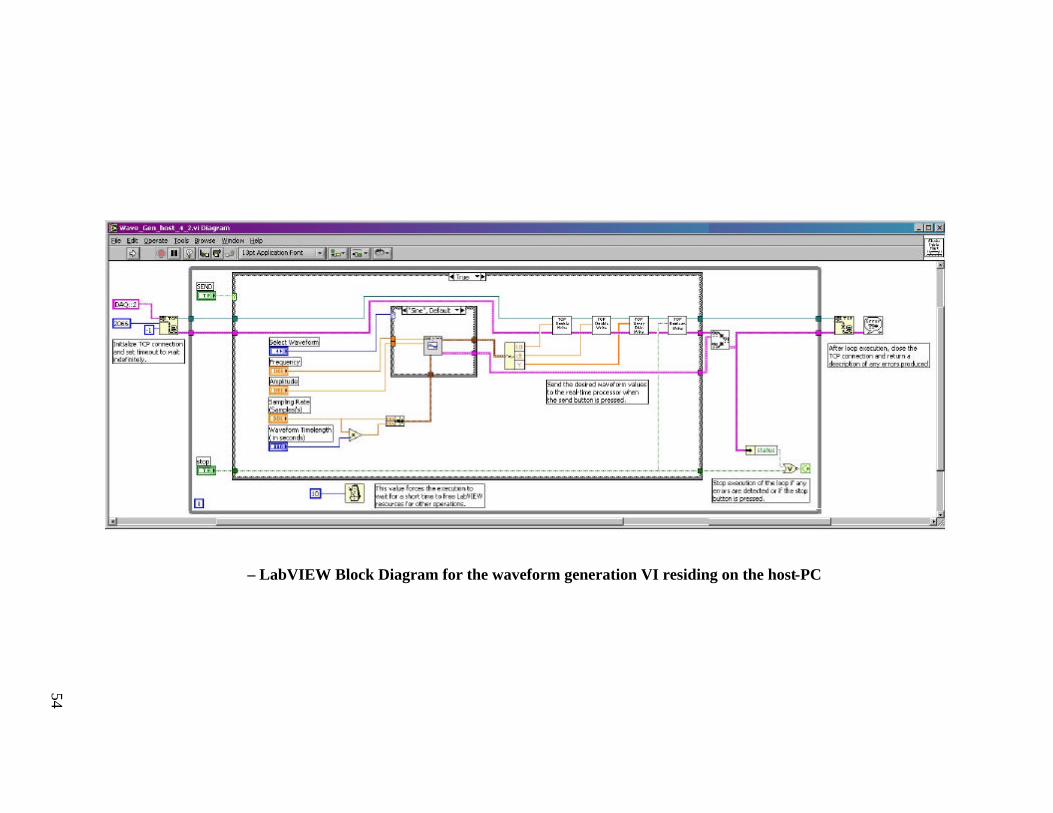
54
– LabVIEW Block Diagram for the waveform generation VI residing on the host-PC
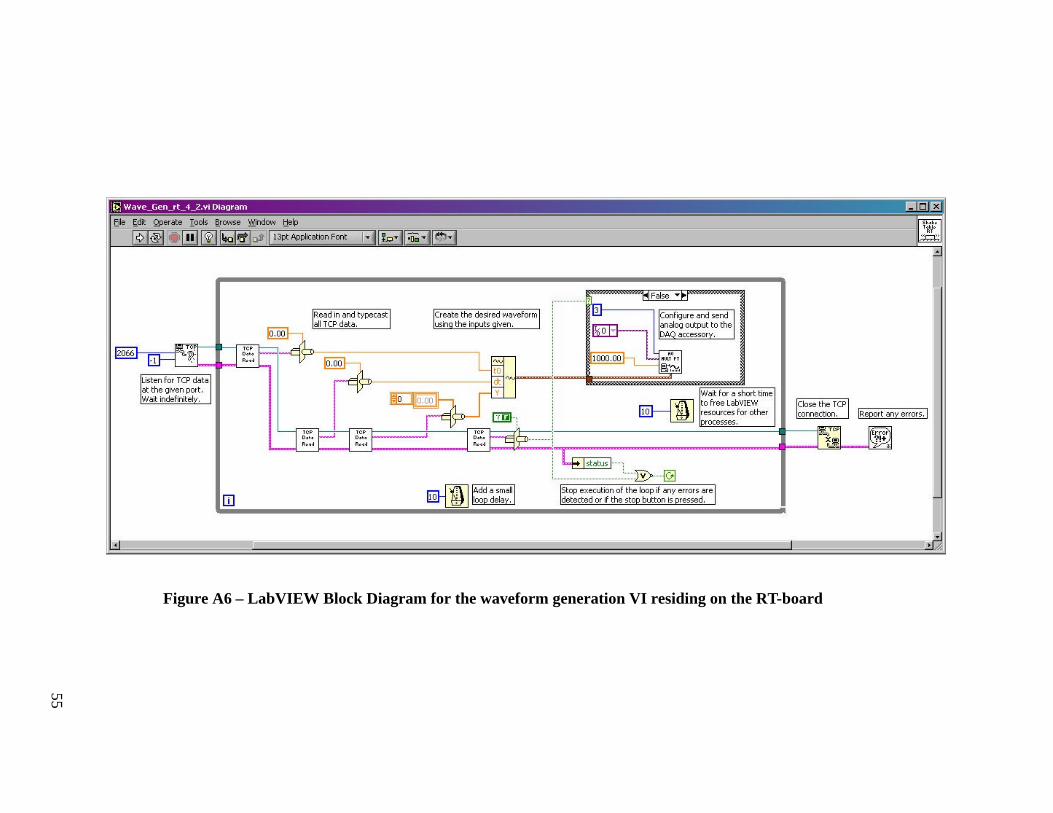
55
Figure A6 – LabVIEW Block Diagram for the waveform generation VI residing on the RT-board

56
Figure A7 – LabVIEW Block Diagram for the data collection, display, and saving VI residing on the host-PC

57
– LabVIEW Block Diagram for the data collection, display, and saving VI residing on the RT-board
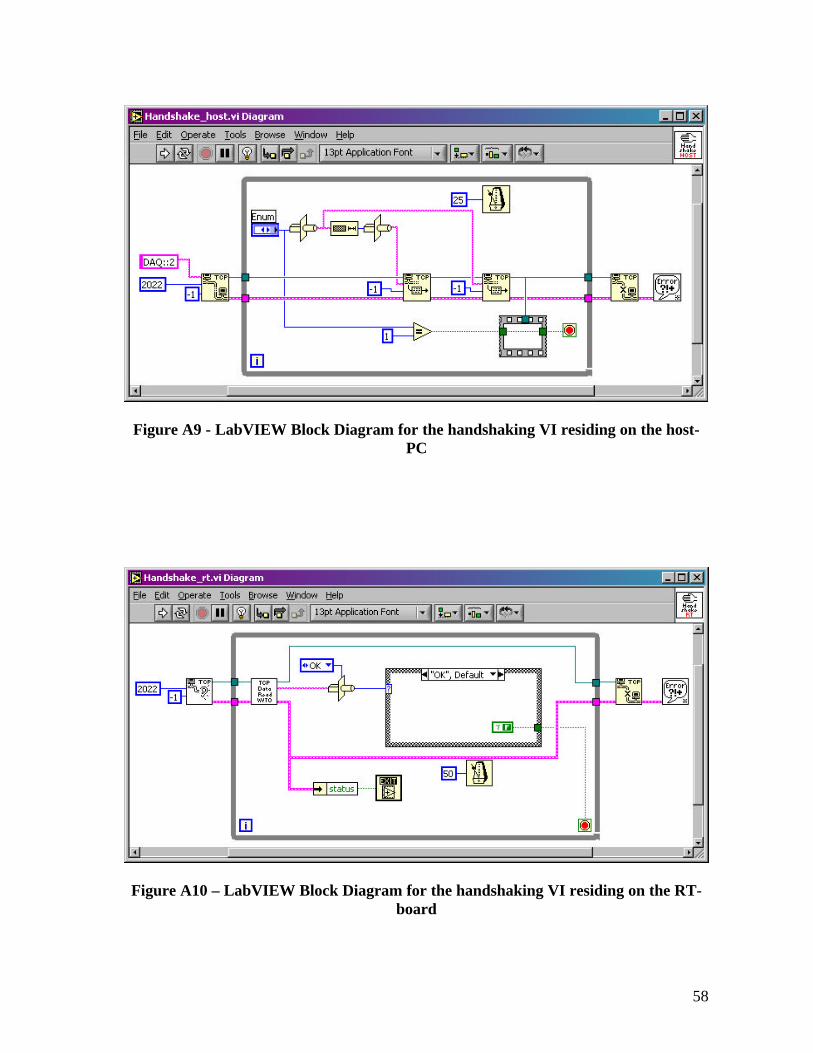
58
Figure A9 - LabVIEW Block Diagram for the handshaking VI residing on the host-PC
Figure A10 – LabVIEW Block Diagram for the handshaking VI residing on the RT-board
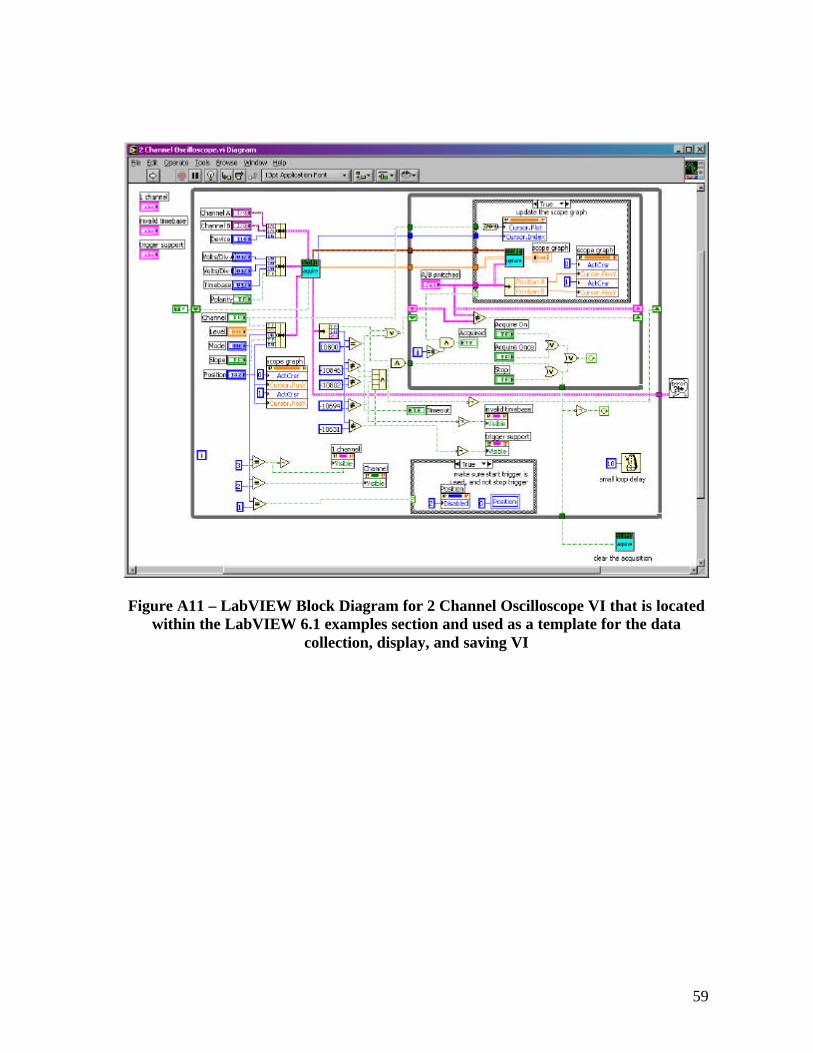
59
Figure A11 – LabVIEW Block Diagram for 2 Channel Oscilloscope VI that is located within the LabVIEW 6.1 examples section and used as a template for the data
collection, display, and saving VI
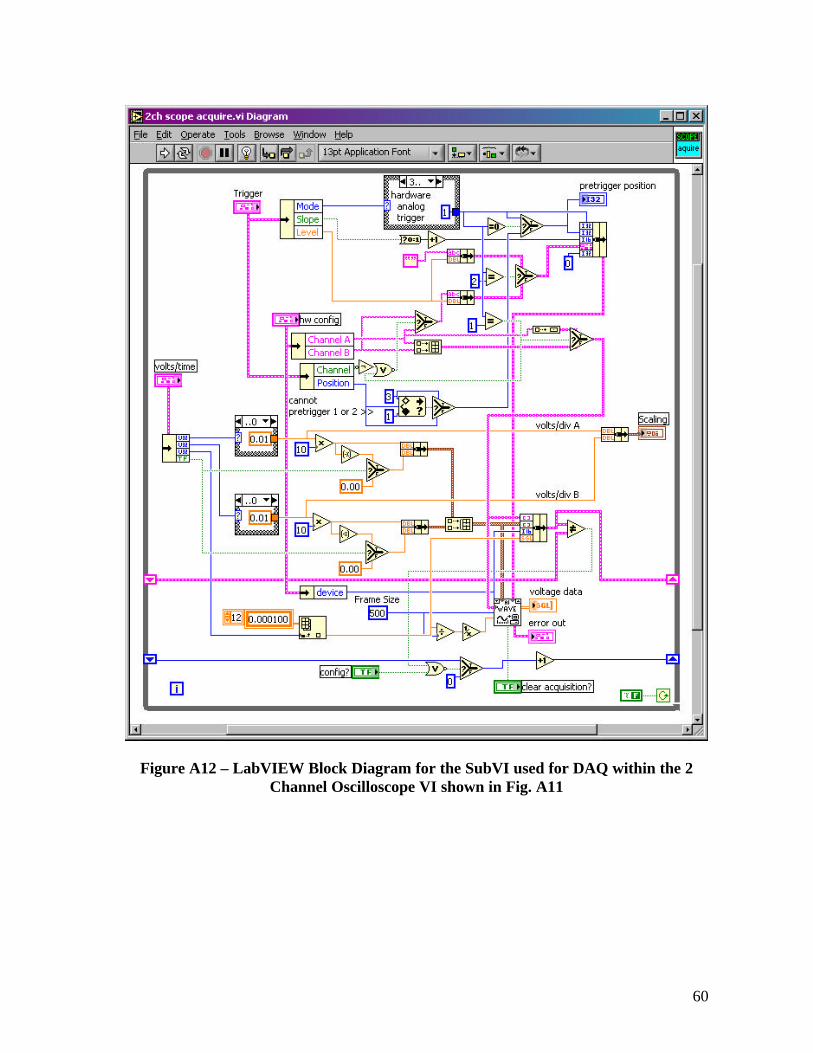
60
Figure A12 – LabVIEW Block Diagram for the SubVI used for DAQ within the 2 Channel Oscilloscope VI shown in Fig. A11

61
Figure A13 – LabVIEW Block Diagram for the SubVI used for DAQ within the data collection, display, and saving VI

62
Figure A14 - LabVIEW Block Diagram for the SubVI used for updating the display graph within the data collection, display, and saving VI
Figure A15 - LabVIEW Block Diagram for the SubVI used for creating a file path within the data collection, display, and saving VI
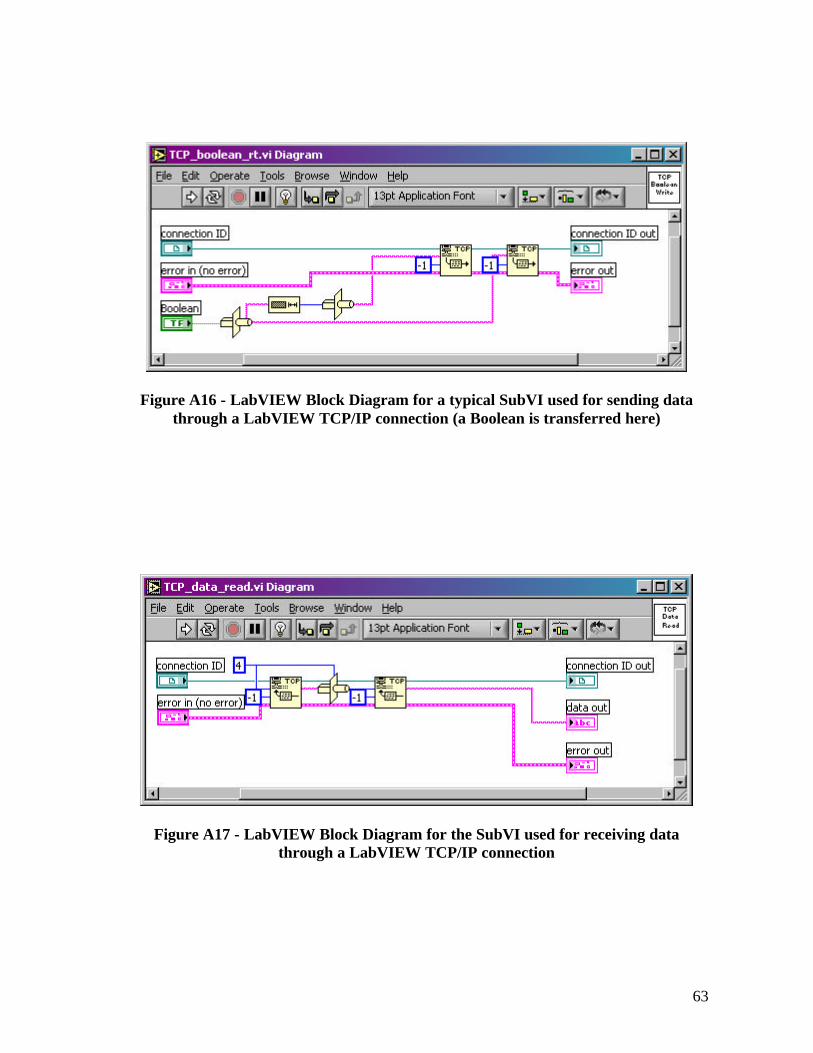
63
Figure A16 - LabVIEW Block Diagram for a typical SubVI used for sending data through a LabVIEW TCP/IP connection (a Boolean is transferred here)
Figure A17 - LabVIEW Block Diagram for the SubVI used for receiving data through a LabVIEW TCP/IP connection
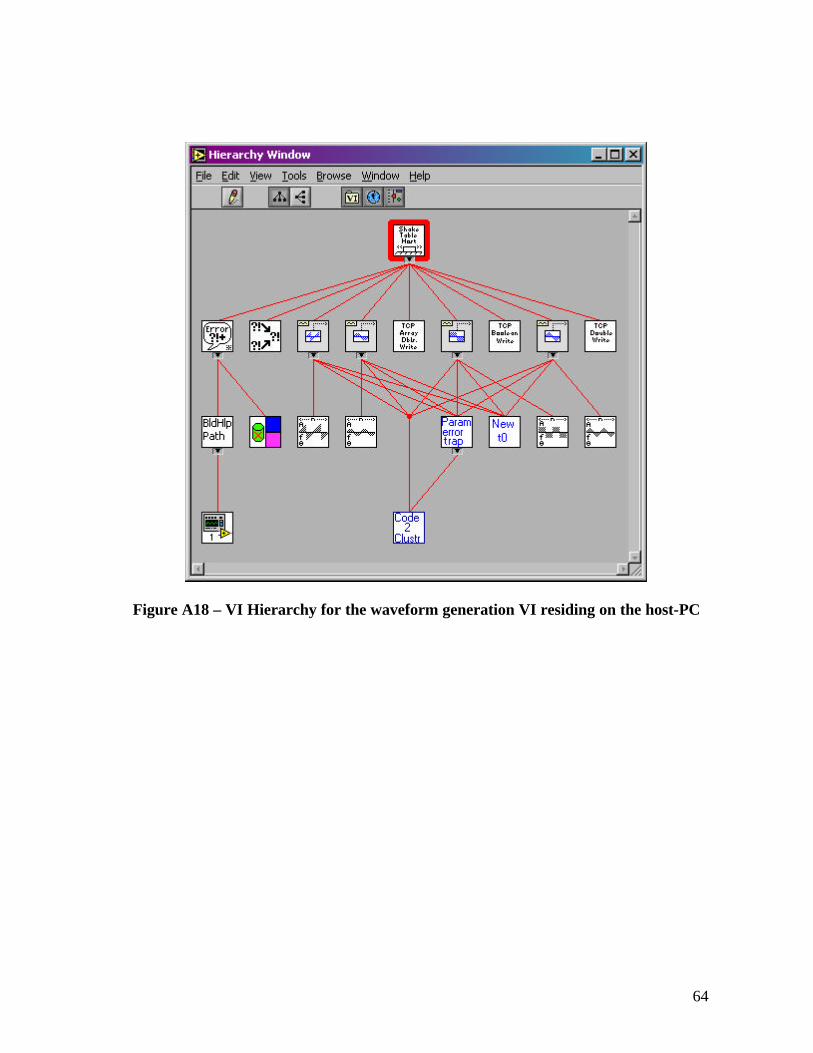
64
Figure A18 – VI Hierarchy for the waveform generation VI residing on the host-PC
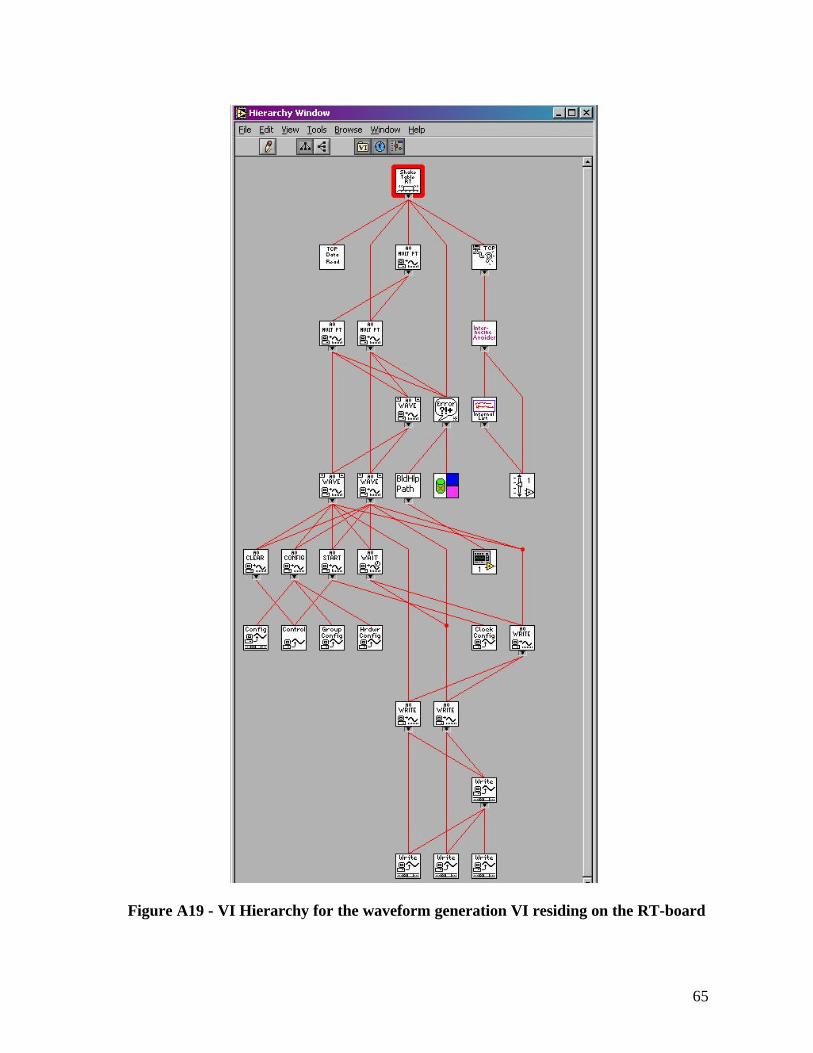
65
Figure A19 - VI Hierarchy for the waveform generation VI residing on the RT-board
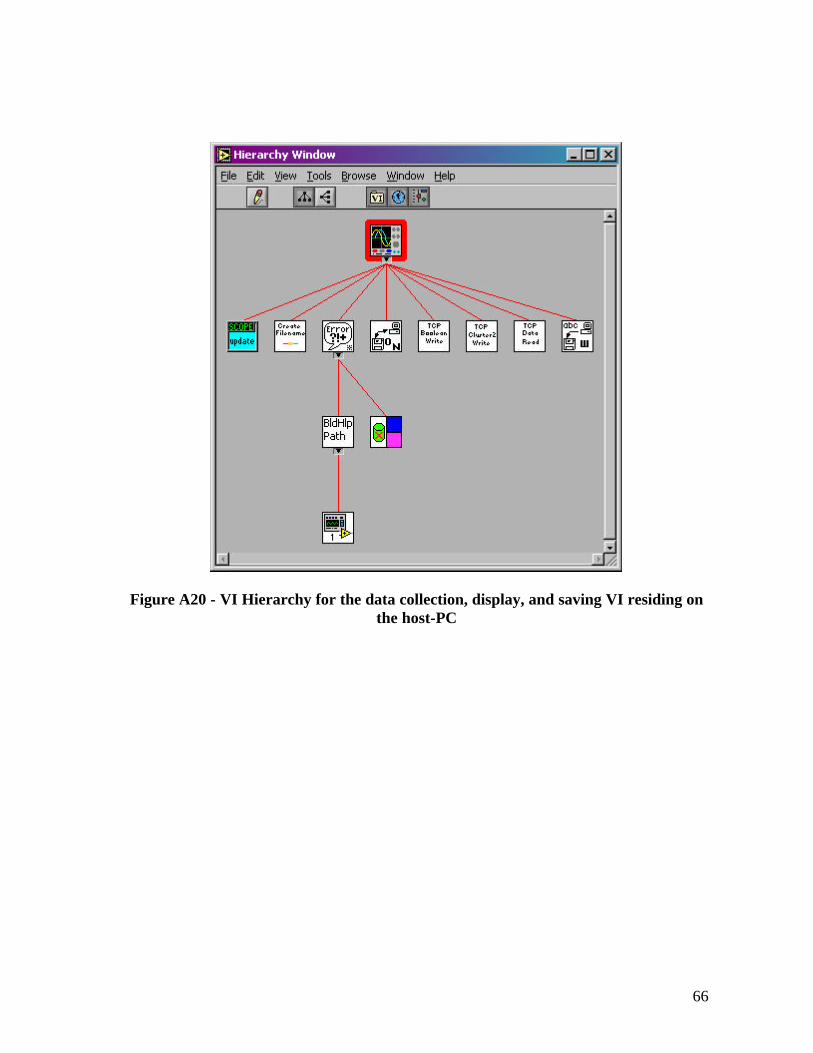
66
Figure A20 - VI Hierarchy for the data collection, display, and saving VI residing on the host-PC
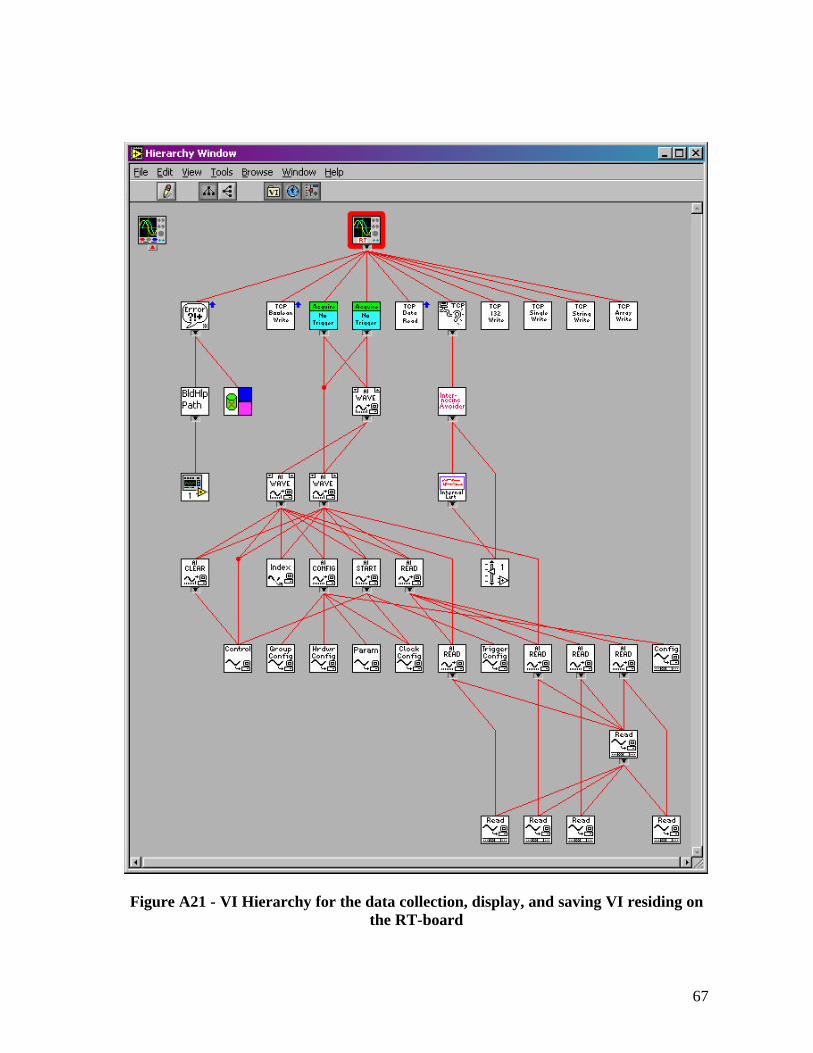
67
Figure A21 - VI Hierarchy for the data collection, display, and saving VI residing on the RT-board
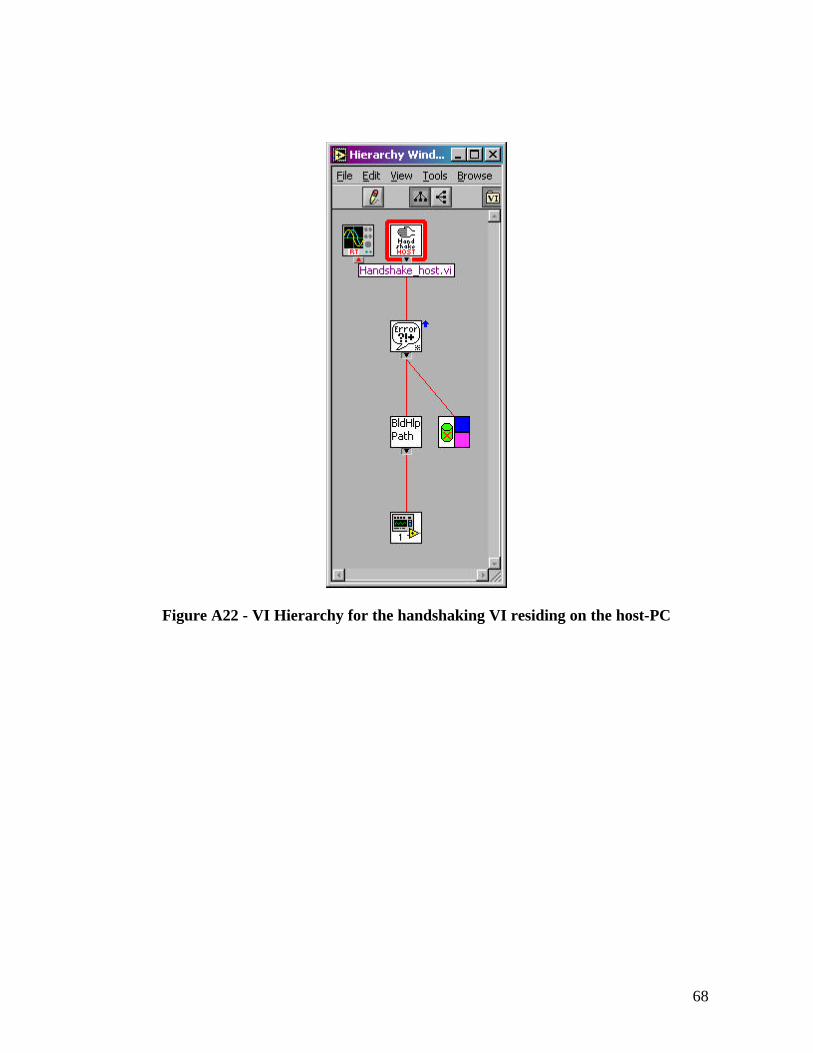
68
Figure A22 - VI Hierarchy for the handshaking VI residing on the host-PC

69
Figure A23- VI Hierarchy for the handshaking VI residing on the RT-board

70
Appendix
Administrator and Remote User Manual
71
User’s Manual
Remotely Controlled Shake Table Experiment
Scott Wirgau
Graduate Research Assistant
Abhinav Gupta
Assistant Professor
Vernon Matzen
Professor
June 2003
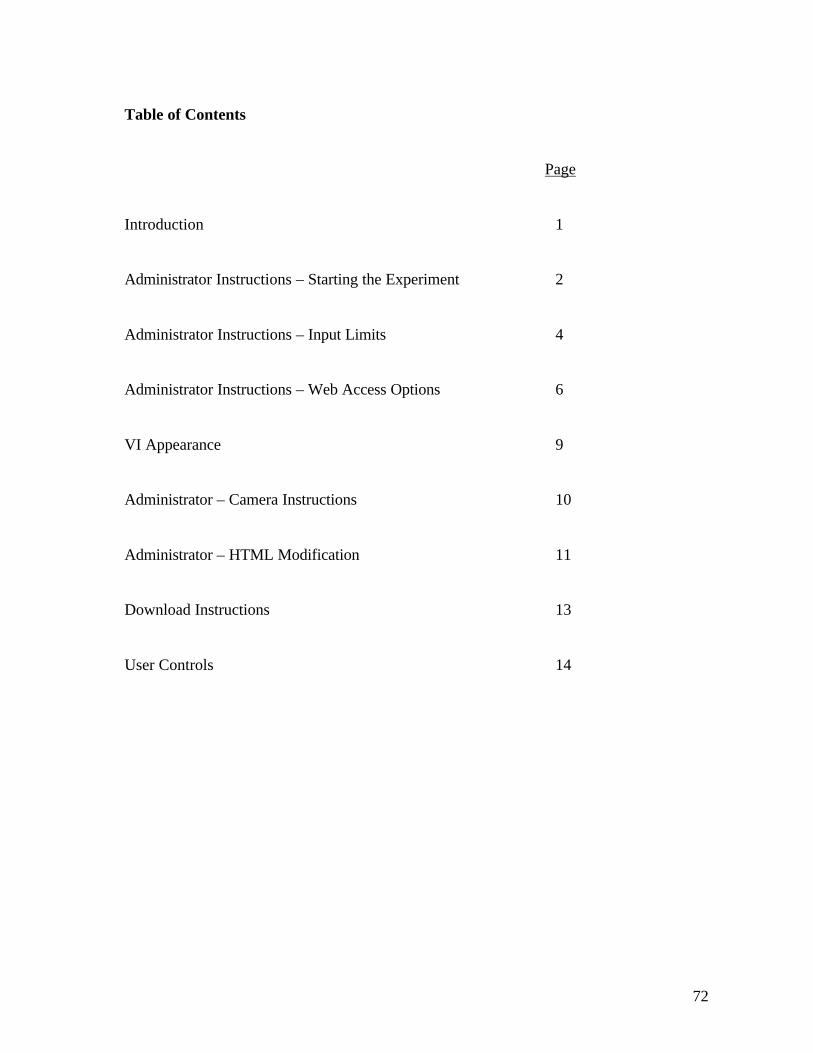
72
Table of Contents
Page
Introduction 1
Administrator Instructions – Starting the Experiment 2
Administrator Instructions – Input Limits 4
Administrator Instructions – Web Access Options 6
VI Appearance 9
Administrator – Camera Instructions 10
Administrator – HTML Modification 11
Download Instructions 13
User Controls 14

73
Introduction
Due to the expanding role of universities and the increasing constraints placed on
prospective students, innovations are needed in order to reach a broader audience. Many
courses have already been converted into a distance-learning environment using cameras
and filmed lectures to meet these needs. This research allows the remote controlling and
display of a possibly destructive laboratory experiment, thereby further expanding the
benefits of distance education to laboratory exercises.
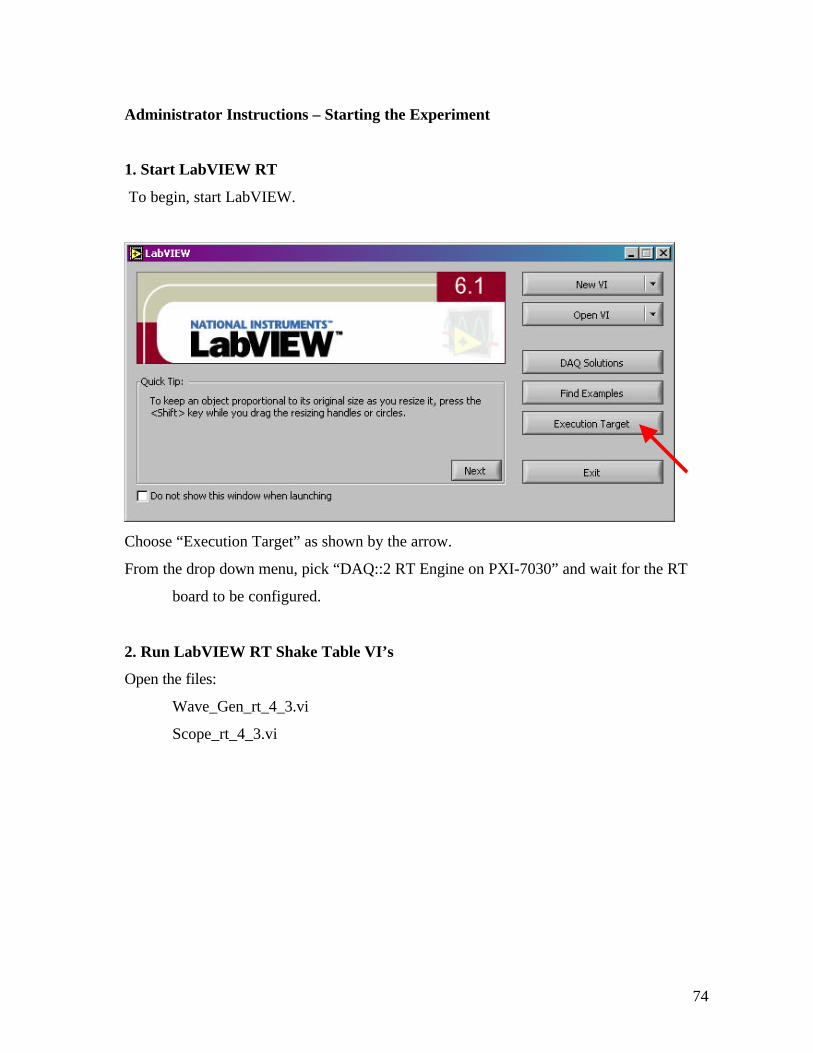
74
Administrator Instructions – Starting the Experiment
1. Start LabVIEW RT
To begin, start LabVIEW.
Choose “Execution Target” as shown by the arrow.
From the drop down menu, pick “DAQ::2 RT Engine on PXI-7030” and wait for the RT
board to be configured.
2. Run LabVIEW RT Shake Table VI’s
Open the files:
Wave_Gen_rt_4_3.vi
Scope_rt_4_3.vi
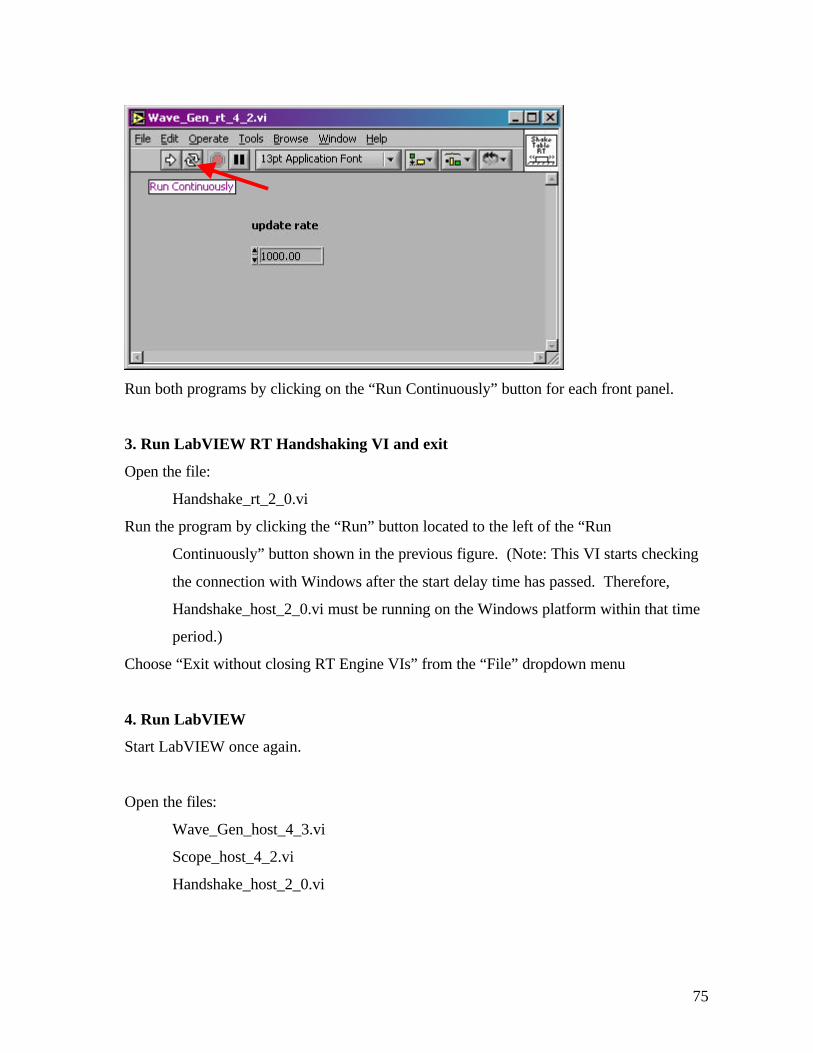
75
Run both programs by clicking on the “Run Continuously” button for each front panel.
3. Run LabVIEW RT Handshaking VI and exit
Open the file:
Handshake_rt_2_0.vi
Run the program by clicking the “Run” button located to the left of the “Run
Continuously” button shown in the previous figure. (Note: This VI starts checking
the connection with Windows after the start delay time has passed. Therefore,
Handshake_host_2_0.vi must be running on the Windows platform within that time
period.)
Choose “Exit without closing RT Engine VIs” from the “File” dropdown menu
4. Run LabVIEW
Start LabVIEW once again.
Open the files:
Wave_Gen_host_4_3.vi
Scope_host_4_2.vi
Handshake_host_2_0.vi
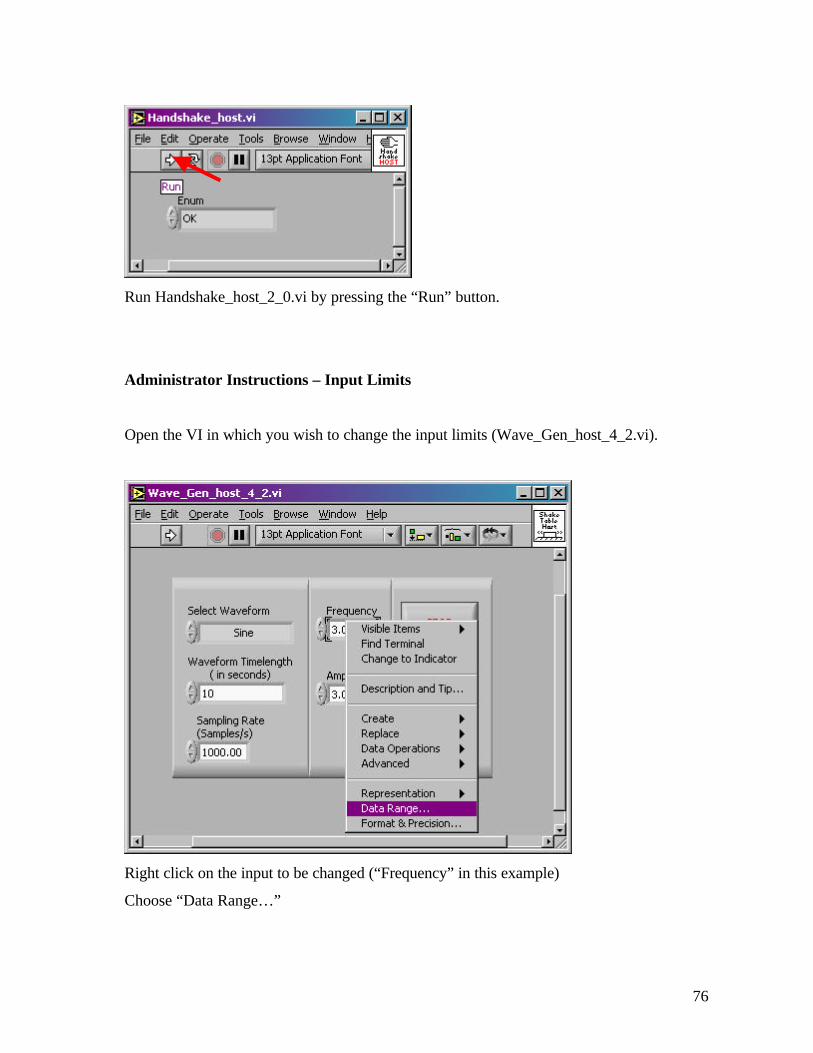
76
Run Handshake_host_2_0.vi by pressing the “Run” button.
Administrator Instructions – Input Limits
Open the VI in which you wish to change the input limits (Wave_Gen_host_4_2.vi).
Right click on the input to be changed (“Frequency” in this example)
Choose “Data Range…”
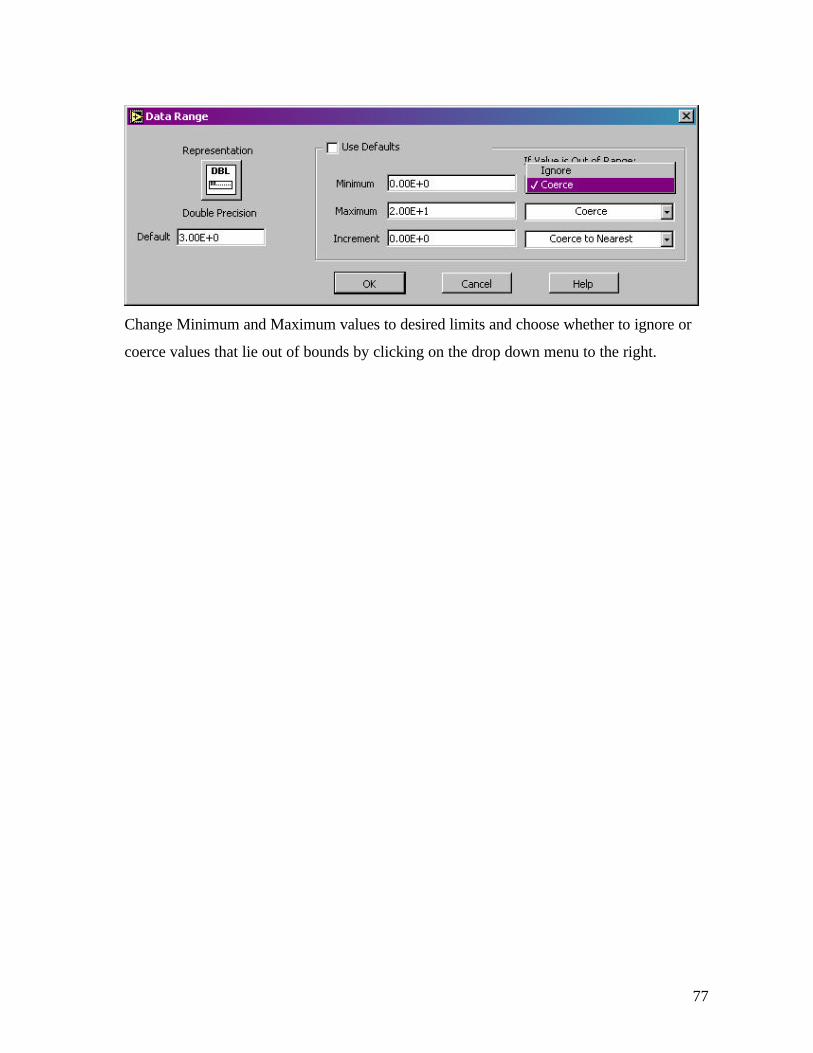
77
Change Minimum and Maximum values to desired limits and choose whether to ignore or
coerce values that lie out of bounds by clicking on the drop down menu to the right.
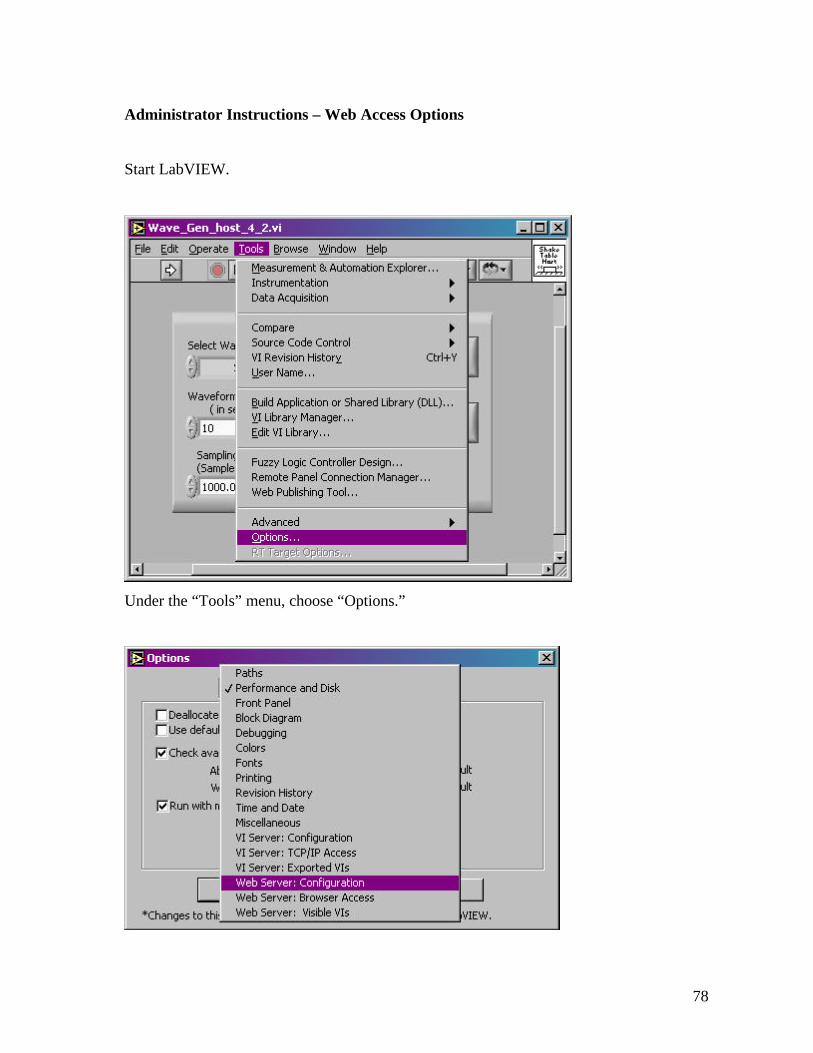
78
Administrator Instructions – Web Access Options
Start LabVIEW.
Under the “Tools” menu, choose “Options.”

79
From the “Options” menu configure each of the following:
Web Server: Configuration
Web Server: Browser Access
Web Server: Visible VIs
Web Server: Configuration
Check the Enable Web Server Box.
Make sure that the Root Directory is valid (Use the www directory in the LabVIEW 6.1
folder)
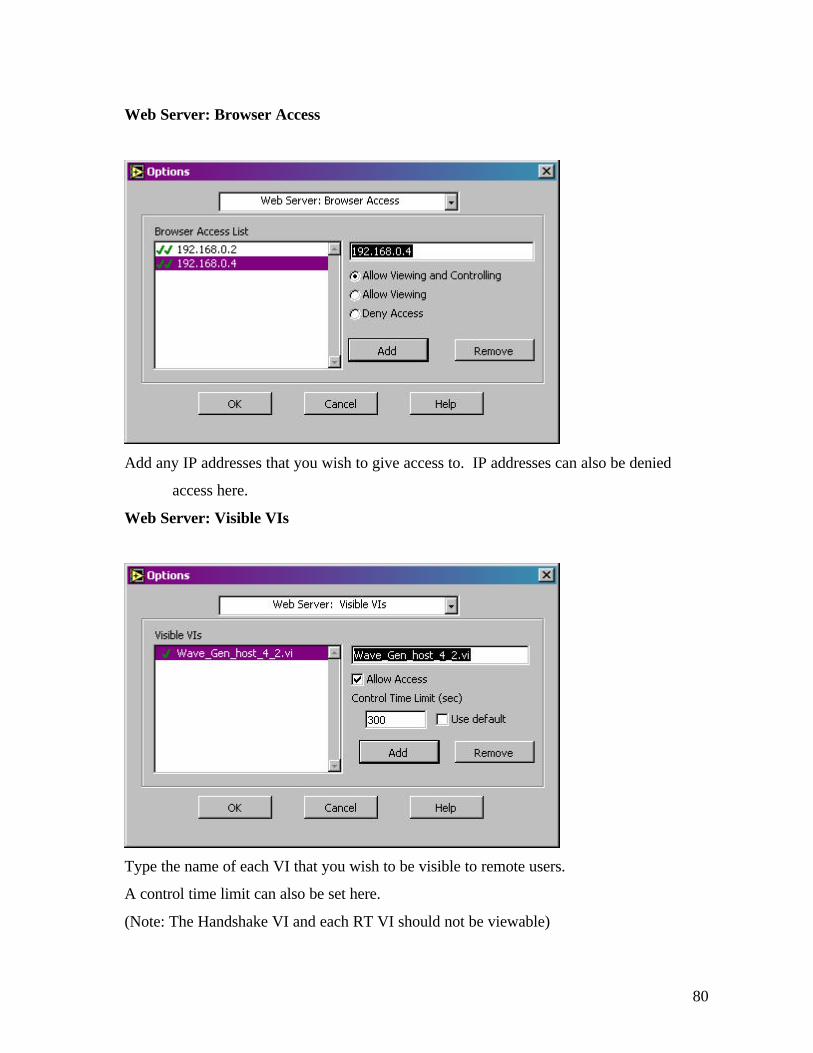
80
Web Server: Browser Access
Add any IP addresses that you wish to give access to. IP addresses can also be denied
access here.
Web Server: Visible VIs
Type the name of each VI that you wish to be visible to remote users.
A control time limit can also be set here.
(Note: The Handshake VI and each RT VI should not be viewable)
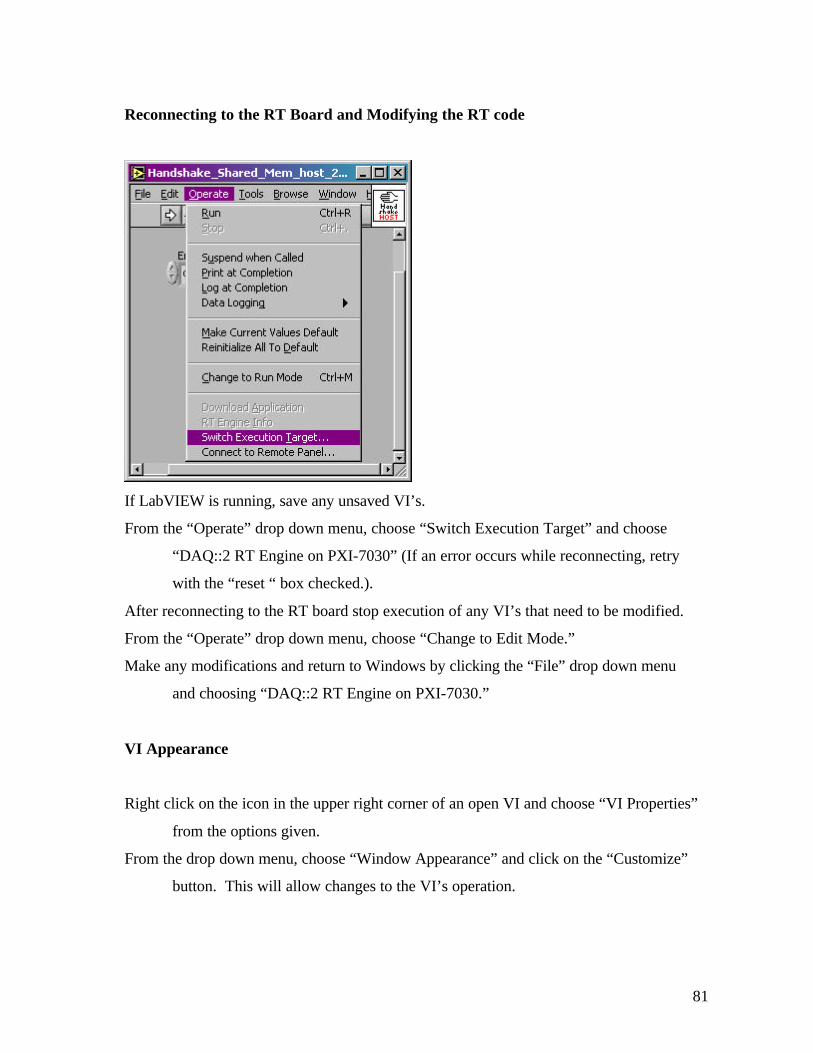
81
Reconnecting to the RT Board and Modifying the RT code
If LabVIEW is running, save any unsaved VI’s.
From the “Operate” drop down menu, choose “Switch Execution Target” and choose
“DAQ::2 RT Engine on PXI-7030” (If an error occurs while reconnecting, retry
with the “reset “ box checked.).
After reconnecting to the RT board stop execution of any VI’s that need to be modified.
From the “Operate” drop down menu, choose “Change to Edit Mode.”
Make any modifications and return to Windows by clicking the “File” drop down menu
and choosing “DAQ::2 RT Engine on PXI-7030.”
VI Appearance
Right click on the icon in the upper right corner of an open VI and choose “VI Properties”
from the options given.
From the drop down menu, choose “Window Appearance” and click on the “Customize”
button. This will allow changes to the VI’s operation.
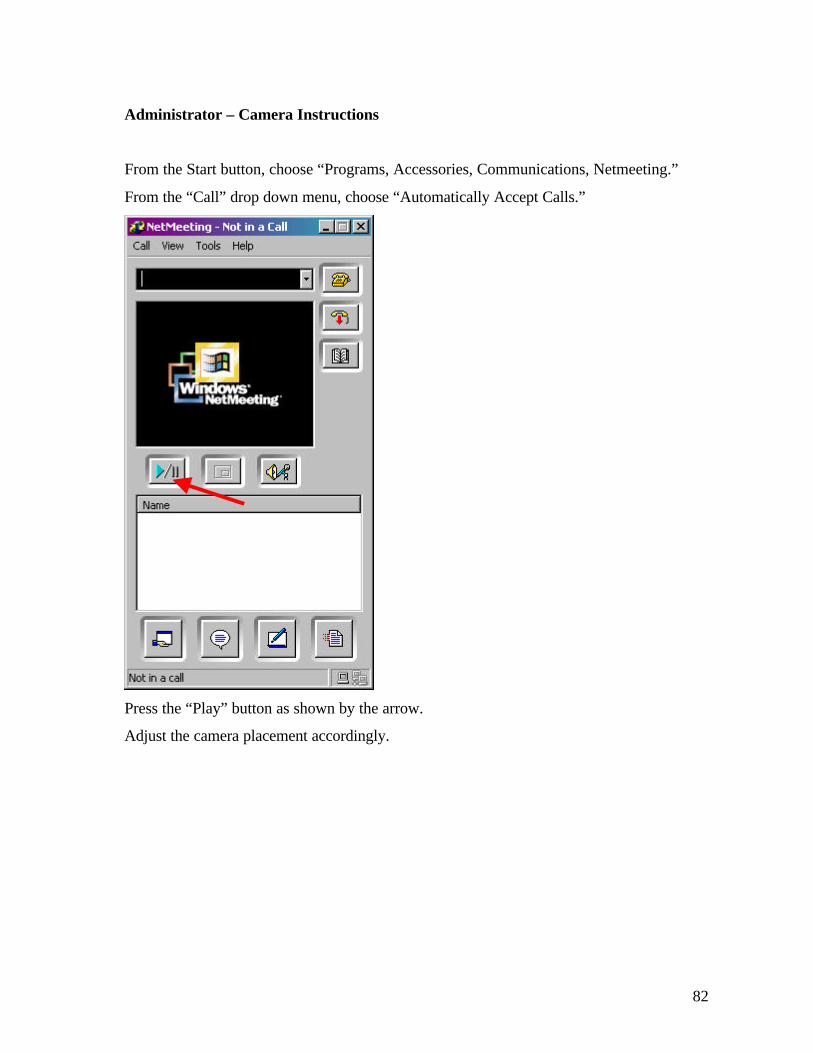
82
Administrator – Camera Instructions
From the Start button, choose “Programs, Accessories, Communications, Netmeeting.”
From the “Call” drop down menu, choose “Automatically Accept Calls.”
Press the “Play” button as shown by the arrow.
Adjust the camera placement accordingly.
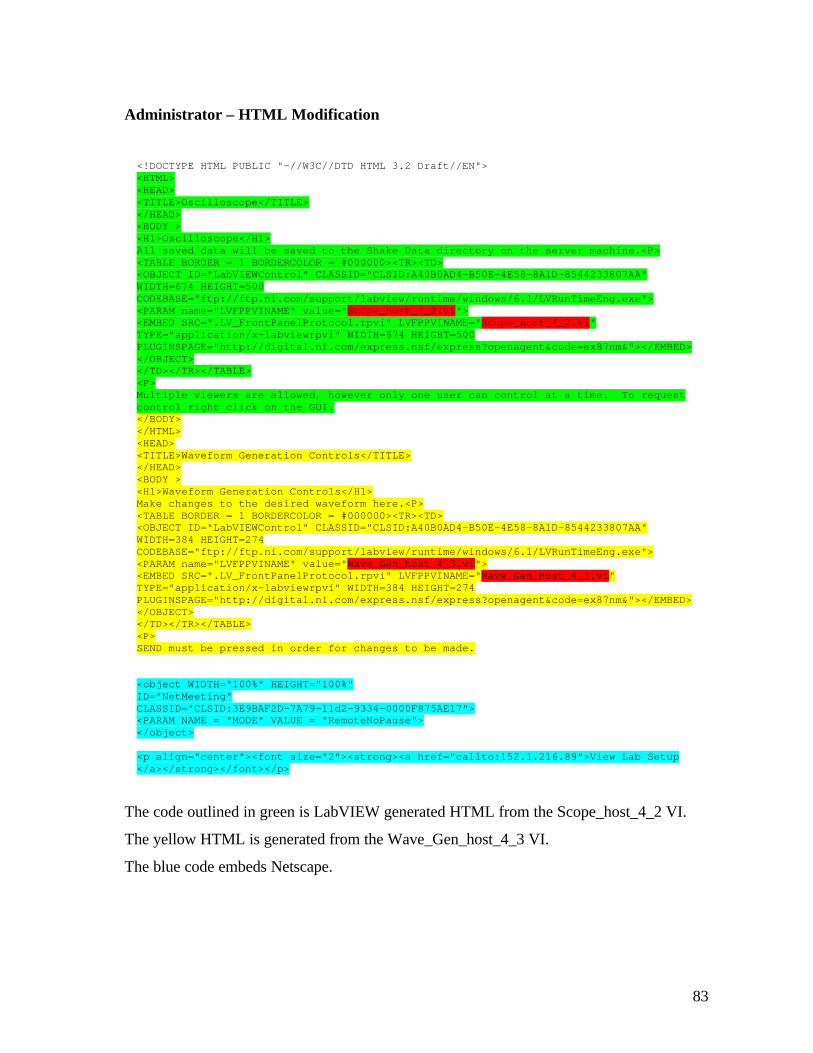
83
Administrator – HTML Modification
<!DOCTYPE HTML PUBLIC "-//W3C//DTD HTML 3.2 Draft//EN"> <HTML> <HEAD> <TITLE>Oscilloscope</TITLE> </HEAD> <BODY > <H1>Oscilloscope</H1> All saved data will be saved to the Shake Data directory on the server machine.<P> <TABLE BORDER = 1 BORDERCOLOR = #000000><TR><TD> <OBJECT ID="LabVIEWControl" CLASSID="CLSID:A40B0AD4-B50E-4E58-8A1D-8544233807AA" WIDTH=674 HEIGHT=500 CODEBASE="ftp://ftp.ni.com/support/labview/runtime/windows/6.1/LVRunTimeEng.exe"> <PARAM name="LVFPPVINAME" value="Scope_host_4_2.vi"> <EMBED SRC=".LV_FrontPanelProtocol.rpvi" LVFPPVINAME="Scope_host_4_2.vi" TYPE="application/x-labviewrpvi" WIDTH=674 HEIGHT=500 PLUGINSPAGE="http://digital.ni.com/express.nsf/express?openagent&code=ex87nm&"></EMBED> </OBJECT> </TD></TR></TABLE> <P> Multiple viewers are allowed, however only one user can control at a time. To request control right click on the GUI. </BODY> </HTML> <HEAD> <TITLE>Waveform Generation Controls</TITLE> </HEAD> <BODY > <H1>Waveform Generation Controls</H1> Make changes to the desired waveform here.<P> <TABLE BORDER = 1 BORDERCOLOR = #000000><TR><TD> <OBJECT ID="LabVIEWControl" CLASSID="CLSID:A40B0AD4-B50E-4E58-8A1D-8544233807AA" WIDTH=384 HEIGHT=274 CODEBASE="ftp://ftp.ni.com/support/labview/runtime/windows/6.1/LVRunTimeEng.exe"> <PARAM name="LVFPPVINAME" value="Wave_Gen_host_4_3.vi"> <EMBED SRC=".LV_FrontPanelProtocol.rpvi" LVFPPVINAME="Wave_Gen_host_4_3.vi" TYPE="application/x-labviewrpvi" WIDTH=384 HEIGHT=274 PLUGINSPAGE="http://digital.ni.com/express.nsf/express?openagent&code=ex87nm&"></EMBED> </OBJECT> </TD></TR></TABLE> <P> SEND must be pressed in order for changes to be made. <object WIDTH="100%" HEIGHT="100%" ID="NetMeeting" CLASSID="CLSID:3E9BAF2D-7A79-11d2-9334-0000F875AE17"> <PARAM NAME = "MODE" VALUE = "RemoteNoPause"> </object> <p align="center"><font size="2"><strong><a href="callto:152.1.216.89">View Lab Setup </a></strong></font></p>
The code outlined in green is LabVIEW generated HTML from the Scope_host_4_2 VI.
The yellow HTML is generated from the Wave_Gen_host_4_3 VI.
The blue code embeds Netscape.
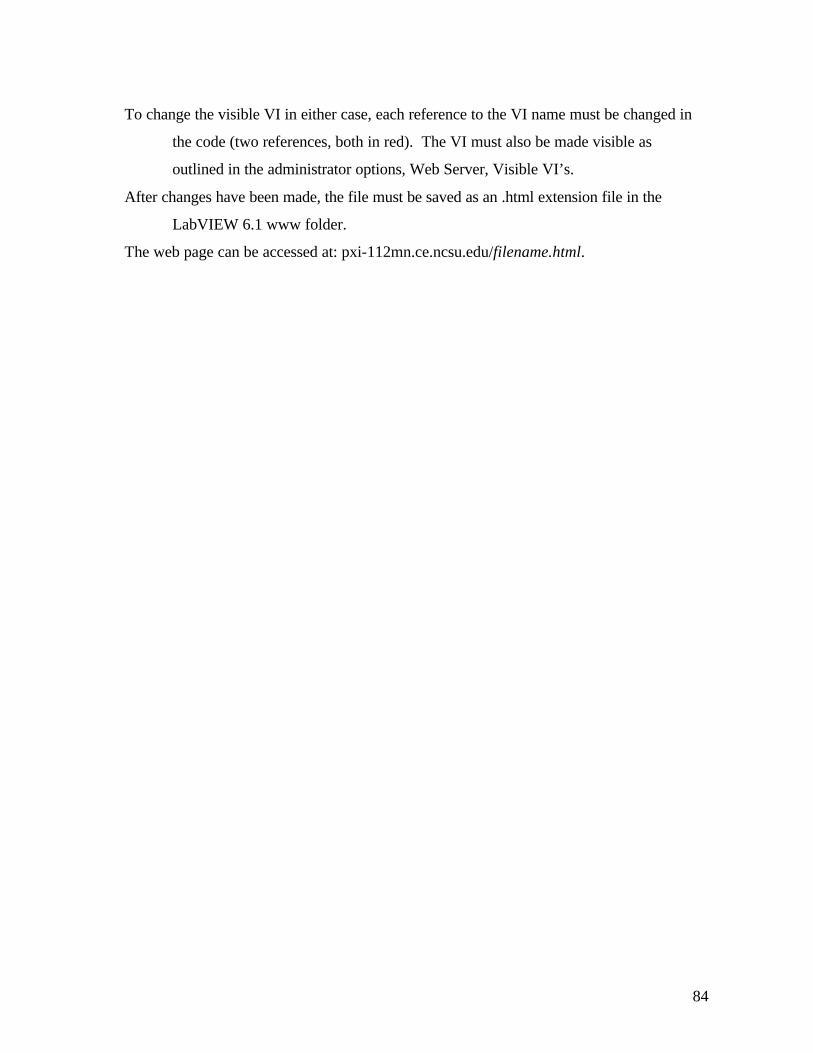
84
To change the visible VI in either case, each reference to the VI name must be changed in
the code (two references, both in red). The VI must also be made visible as
outlined in the administrator options, Web Server, Visible VI’s.
After changes have been made, the file must be saved as an .html extension file in the
LabVIEW 6.1 www folder.
The web page can be accessed at: pxi-112mn.ce.ncsu.edu/filename.html.
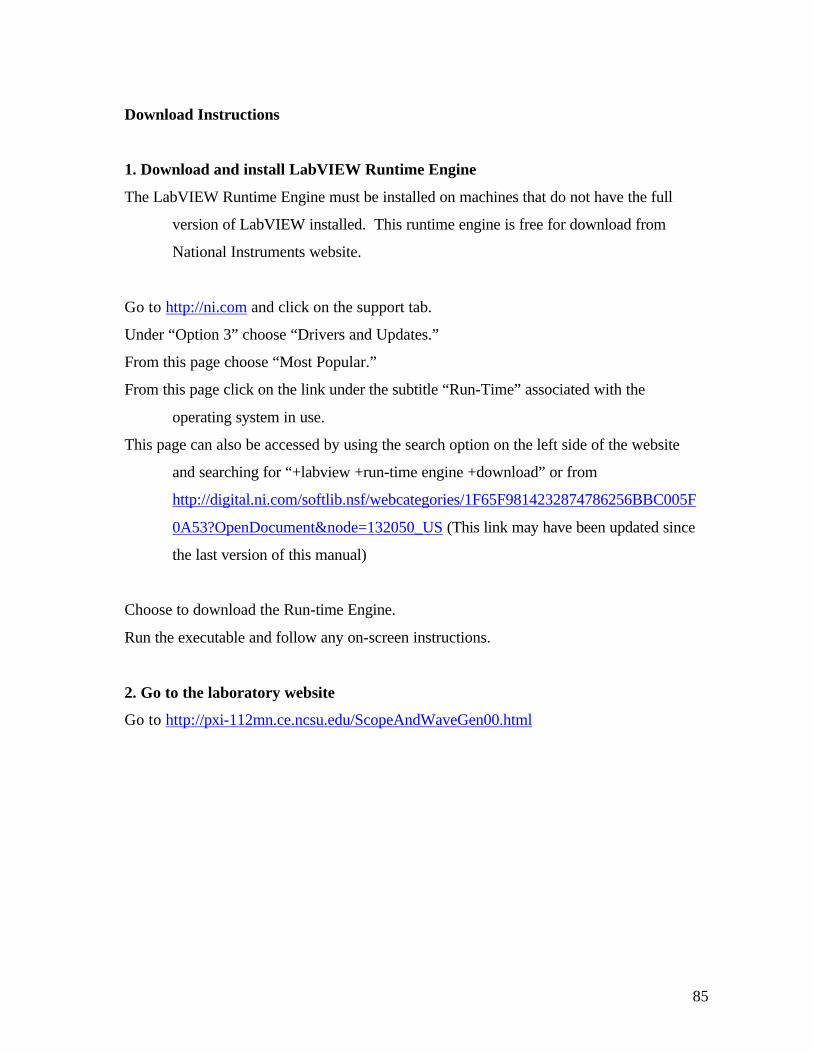
85
Download Instructions
1. Download and install LabVIEW Runtime Engine
The LabVIEW Runtime Engine must be installed on machines that do not have the full
version of LabVIEW installed. This runtime engine is free for download from
National Instruments website.
Go to http://ni.com and click on the support tab.
Under “Option 3” choose “Drivers and Updates.”
From this page choose “Most Popular.”
From this page click on the link under the subtitle “Run-Time” associated with the
operating system in use.
This page can also be accessed by using the search option on the left side of the website
and searching for “+labview +run-time engine +download” or from
http://digital.ni.com/softlib.nsf/webcategories/1F65F9814232874786256BBC005F
0A53?OpenDocument&node=132050_US (This link may have been updated since
the last version of this manual)
Choose to download the Run-time Engine.
Run the executable and follow any on-screen instructions.
2. Go to the laboratory website
Go to http://pxi-112mn.ce.ncsu.edu/ScopeAndWaveGen00.html

86
User Controls
Wave_Gen_host_4_3.vi
Select Waveform: This input allows the user to choose which type of waveform
to send to the electromagnetic shaker. The options include:
Sine, Square, Triangle, and Sawtooth.
Waveform Timelength: This input allows the user to determine the timelength of the
waveform generated. The units are seconds and the limit
values are 0 and 120. Values outside of the range are
coerced to the nearest legal value. Changes can be made to
these limits by the administrator only.
87
Sampling Rate: The sampling rate is used to determine the number of
samples per second that are sent to the DAQ board.
Frequency: The frequency determines the number of cycles per second
generated in the waveform for a sampling rate of 1000
Samples /s. This value is given in Hz. The frequency limits
are set at 0 and 20 Hz.
Amplitude: The amplitude determines the strength of the waveform and
is given in Volts. Limits are set at 0 and 8 V.
Send: Sends the waveform created by the user inputs given to the
RT board and DAQ.
Stop: Stops execution of the VI.

88
Scope_host_4_3.vi
Channel Vertical: Toggles the display curve on and off for the selected
channel.
Position: Moves the given channel display curve up or down on the
vertical scale.
/div: Changes the volts represented by each division on the
vertical axis of the display graph. For example, if a data
point is displayed at a y value of 2 and volts per division is
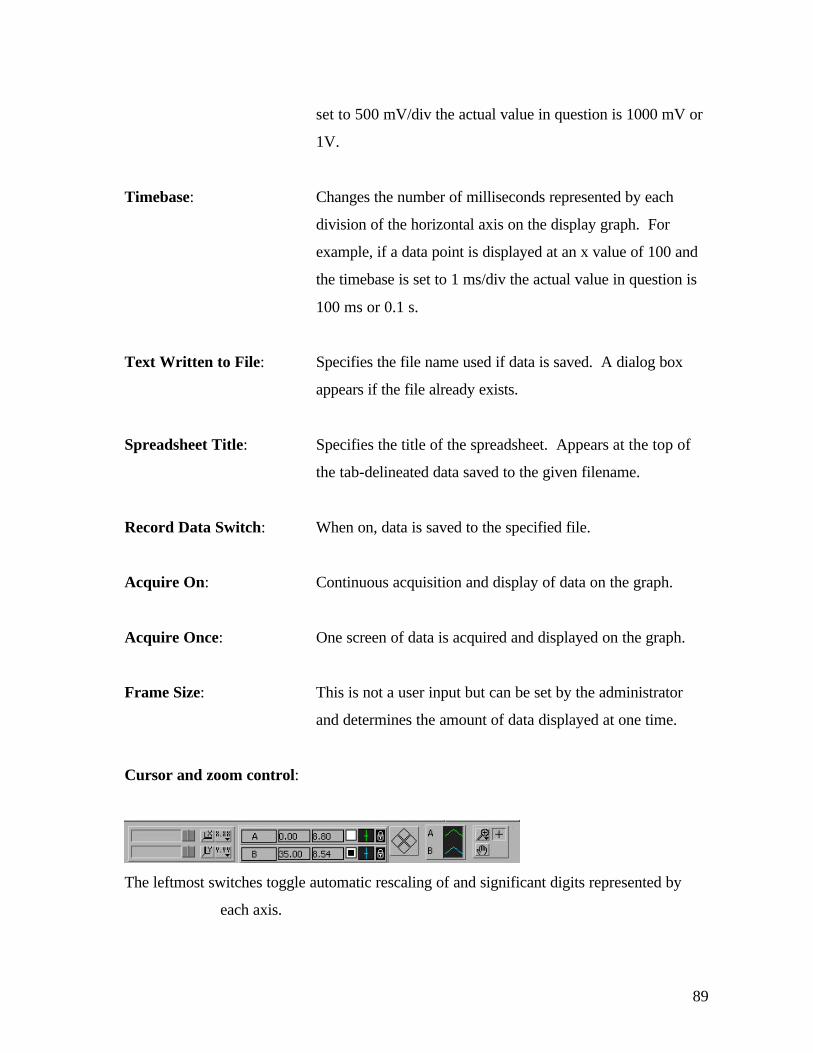
89
set to 500 mV/div the actual value in question is 1000 mV or
1V.
Timebase: Changes the number of milliseconds represented by each
division of the horizontal axis on the display graph. For
example, if a data point is displayed at an x value of 100 and
the timebase is set to 1 ms/div the actual value in question is
100 ms or 0.1 s.
Text Written to File: Specifies the file name used if data is saved. A dialog box
appears if the file already exists.
Spreadsheet Title: Specifies the title of the spreadsheet. Appears at the top of
the tab-delineated data saved to the given filename.
Record Data Switch: When on, data is saved to the specified file.
Acquire On: Continuous acquisition and display of data on the graph.
Acquire Once: One screen of data is acquired and displayed on the graph.
Frame Size: This is not a user input but can be set by the administrator
and determines the amount of data displayed at one time.
Cursor and zoom control:
The leftmost switches toggle automatic rescaling of and significant digits represented by
each axis.

90
The middle buttons control the cursors and show the X & Y values on the curves at the
point shown.
The rightmost switches control panning and zooming options.


![HOME AUDIO SYSTEM - CNET Content Solutions€¦ · model name [SHAKE-99/SHAKE-77/SHAKE-55/SHAKE-33] [4-487-569-14(1)] GB2GB filename[D:\NORM'S JOB\SONY HA\SO140043\SHAKE-99_77_55_33](https://img.pdfslide.us/doc/110x75/5f6d806635b4b45b2279704e/home-audio-system-cnet-content-solutions-model-name-shake-99shake-77shake-55shake-33.jpg)