Embed Size (px)
Citation preview
Reminders
• HW 3 Posted
• HW 1 Graded and Posted
• Grading appeal process
MGTSC 352Lecture 6: Forecasting
Wrap-up of ForecastingHoldout strategy
Debugging Forecasting Models
Monte Carlo SimulationPlaying Roulette with Excel
Bard Outside example
95% Prediction Interval
• Technically correct formula;– Forecast + Bias + 2 x Std Error
• Heuristic for use in this class; – Forecast 2 SE
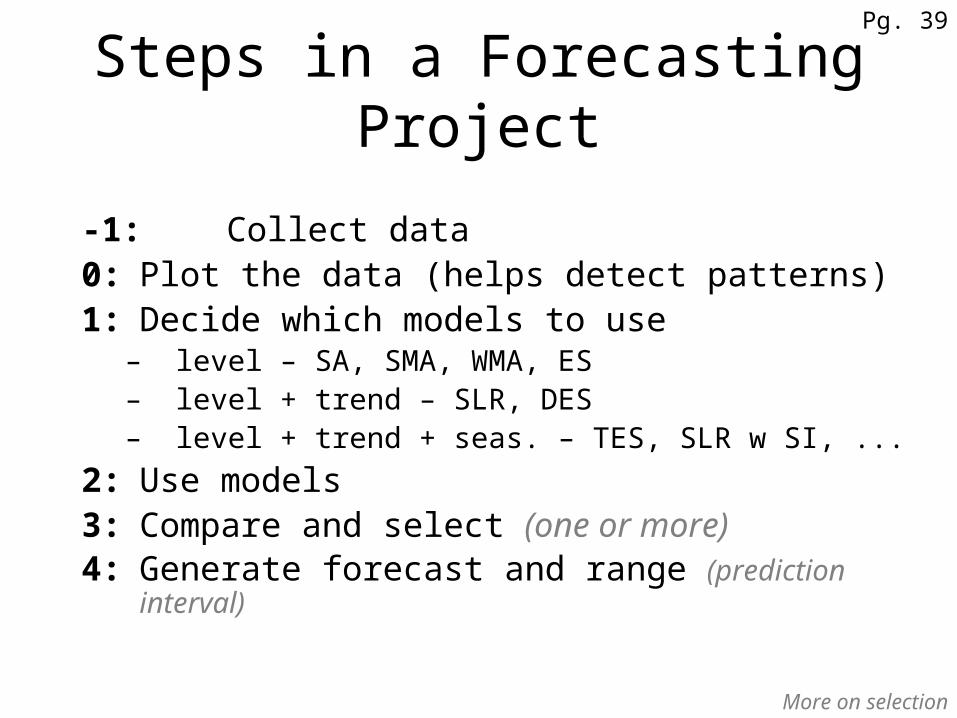
Steps in a Forecasting Project
-1: Collect data0: Plot the data (helps detect patterns)1: Decide which models to use
– level – SA, SMA, WMA, ES– level + trend – SLR, DES– level + trend + seas. – TES, SLR w SI, ...
2: Use models3: Compare and select (one or more)4: Generate forecast and range (prediction interval)
More on selection
Pg. 39
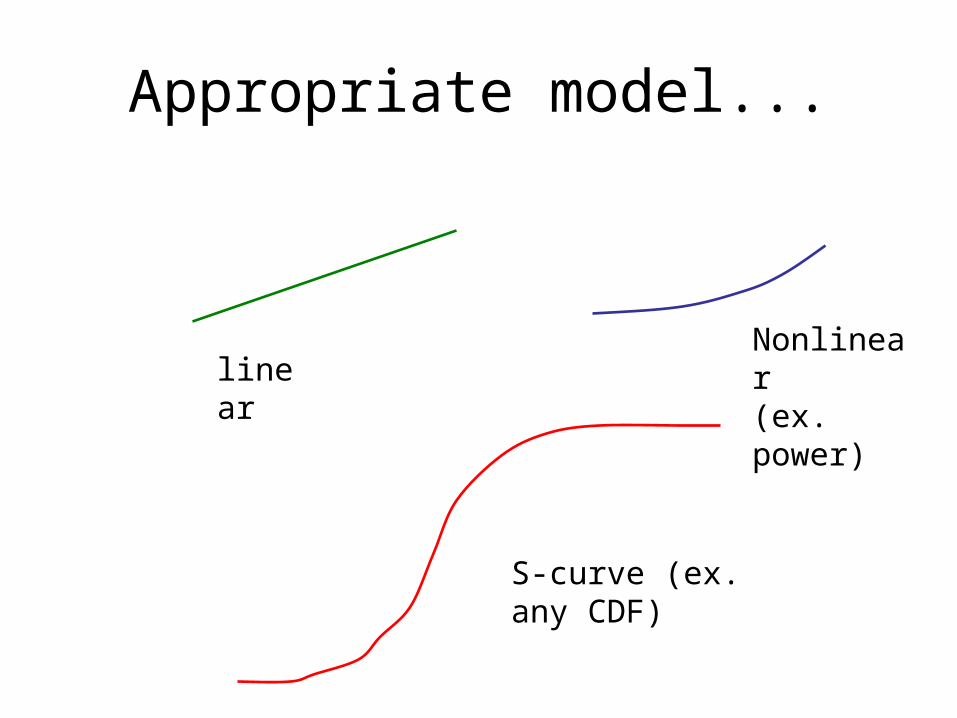
Appropriate model...
linearNonlinear (ex. power)
S-curve (ex. any CDF)
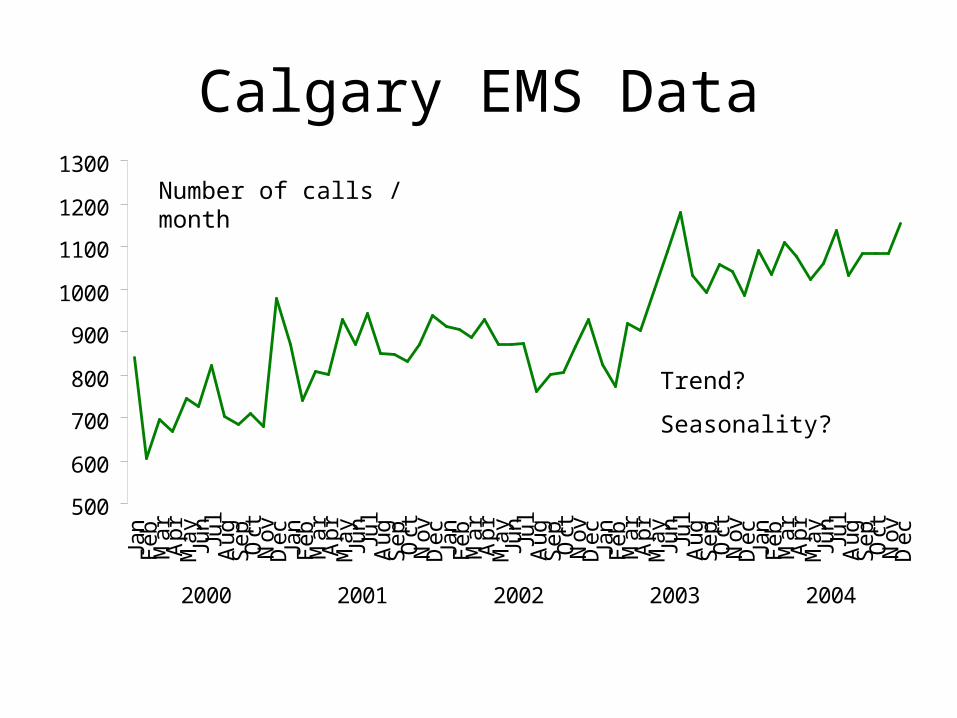
Calgary EMS Data
500
600
700
800
900
1000
1100
1200
1300Ja
nF
eb
Ma
rA
pr
Ma
yJu
nJu
lA
ug
Se
pO
ctN
ov
De
cJa
nF
eb
Ma
rA
pr
Ma
yJu
nJu
lA
ug
Se
pO
ctN
ov
De
cJa
nF
eb
Ma
rA
pr
Ma
yJu
nJu
lA
ug
Se
pO
ctN
ov
De
cJa
nF
eb
Ma
rA
pr
Ma
yJu
nJu
lA
ug
Se
pO
ctN
ov
De
cJa
nF
eb
Ma
rA
pr
Ma
yJu
nJu
lA
ug
Se
pO
ctN
ov
De
c
2000 2001 2002 2003 2004
Trend?
Seasonality?
Number of calls / month
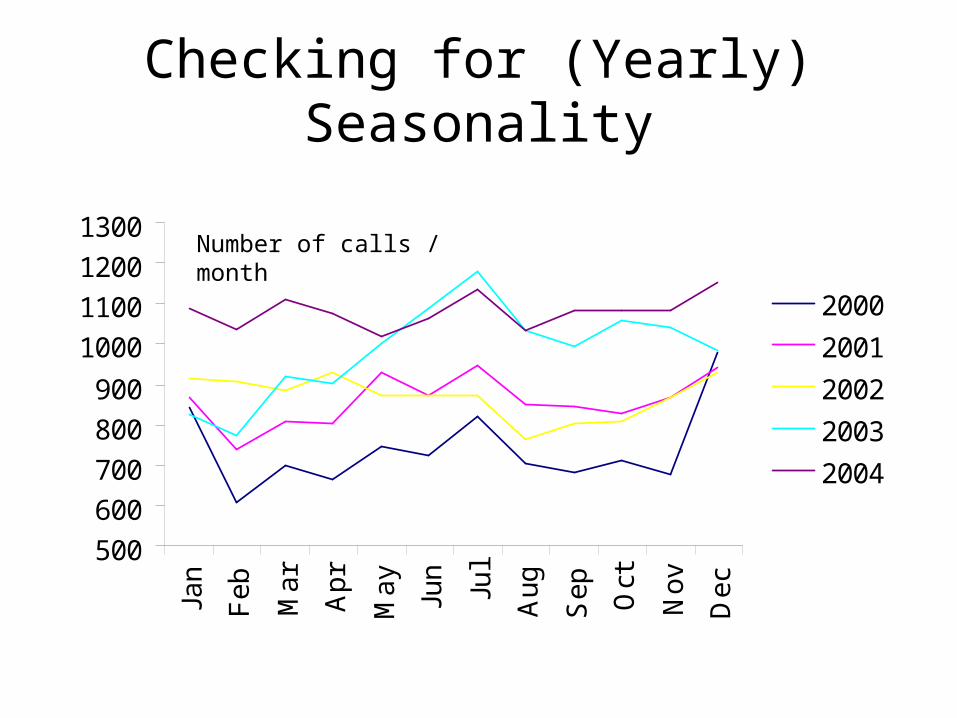
Checking for (Yearly) Seasonality
500
600
700
800
900
1000
1100
1200
1300Ja
n
Fe
b
Ma
r
Ap
r
Ma
y
Jun
Jul
Au
g
Se
p
Oct
No
v
De
c
2000
2001
2002
2003
2004
Number of calls / month
Weekly or Hourly Seasonality
0
20
40
60
80
100
120
140
Sun Mon Tue Wed Thu Fri Sat
Avg. # of calls / hr., 2004
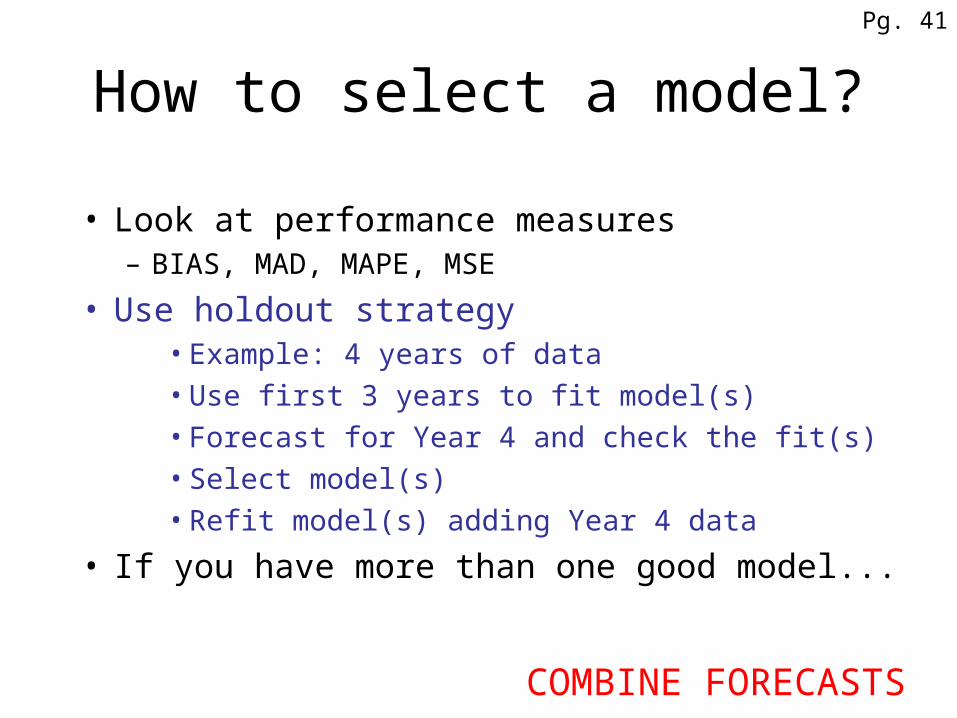
How to select a model?
• Look at performance measures– BIAS, MAD, MAPE, MSE
• Use holdout strategy• Example: 4 years of data• Use first 3 years to fit model(s)• Forecast for Year 4 and check the fit(s)• Select model(s)• Refit model(s) adding Year 4 data
• If you have more than one good model...
COMBINE FORECASTS
Pg. 41
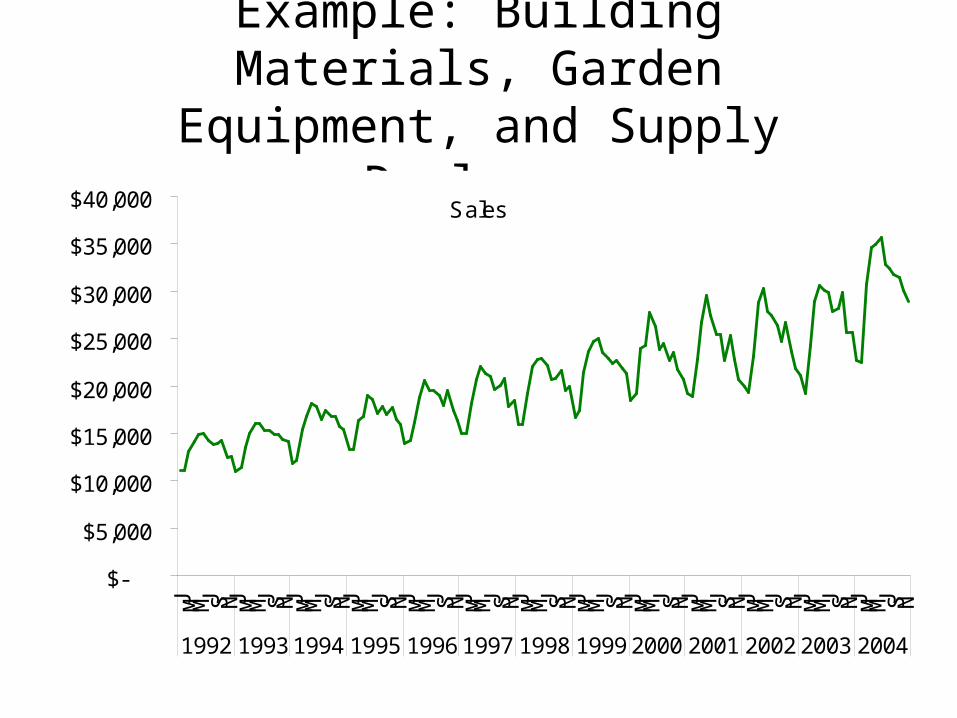
Example: Building Materials, Garden Equipment, and Supply Dealers
Sales
$-
$5,000
$10,000
$15,000
$20,000
$25,000
$30,000
$35,000
$40,000J M M J S N J M M J S N J M M J S N J M M J S N J M M J S N J M M J S N J M M J S N J M M J S N J M M J S N J M M J S N J M M J S N J M M J S N J M M J S N
1992 1993 1994 1995 1996 1997 1998 1999 2000 2001 2002 2003 2004
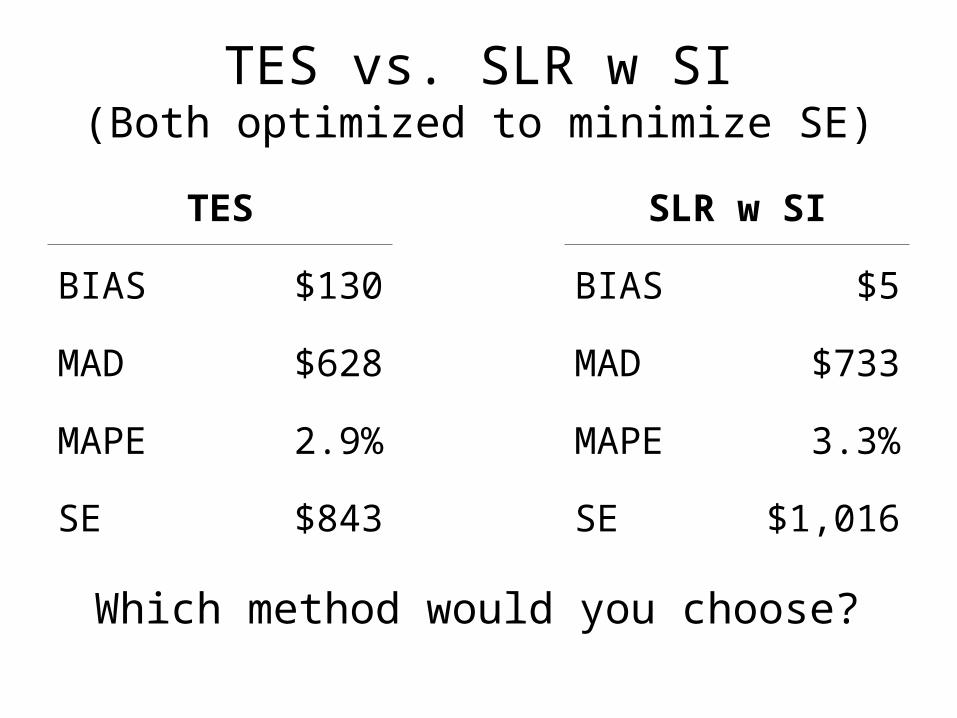
TES vs. SLR w SI(Both optimized to minimize SE)
TES SLR w SI
BIAS $130 BIAS $5
MAD $628 MAD $733
MAPE 2.9% MAPE 3.3%
SE $843 SE $1,016
Which method would you choose?
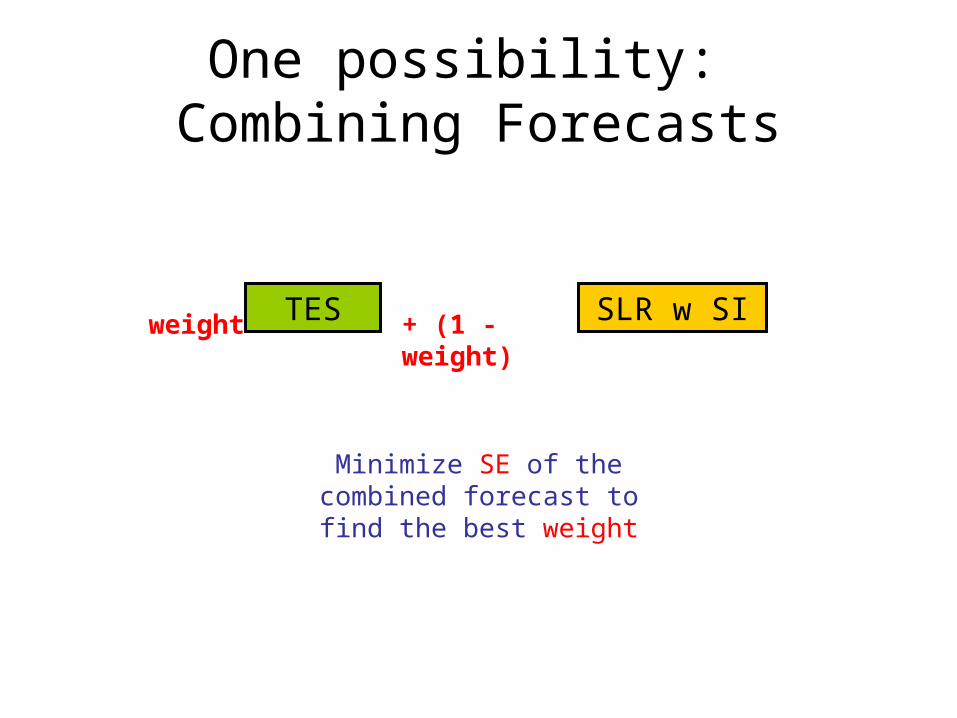
One possibility: Combining Forecasts
TES SLR w SIweight + (1 - weight)
Minimize SE of the combined forecast to find the best weight
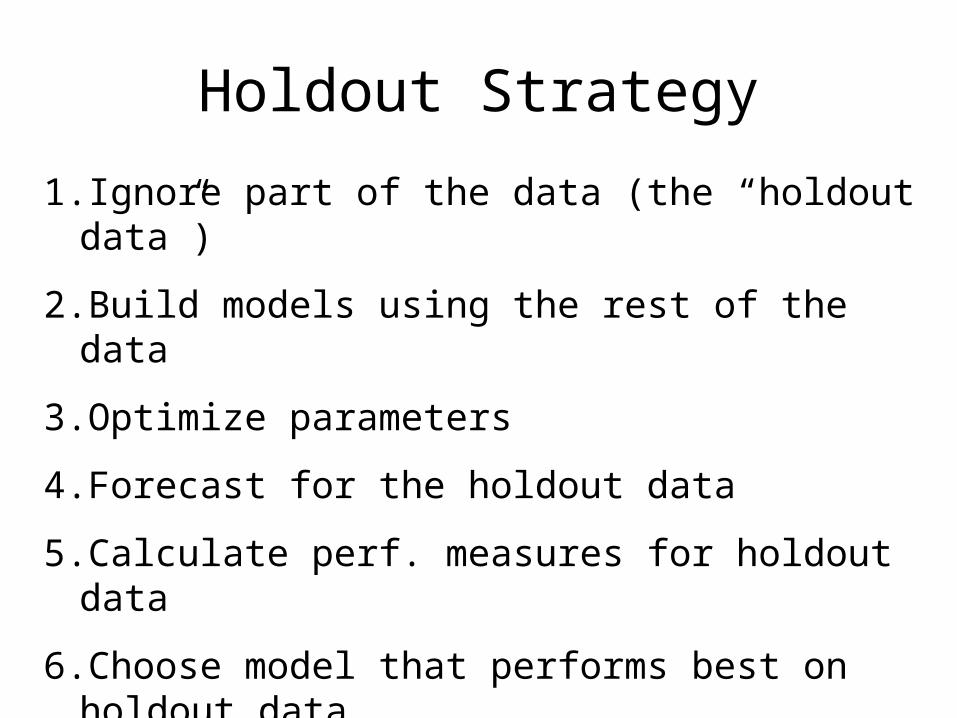
Holdout Strategy
1. Ignore part of the data (the “holdout data”)
2.Build models using the rest of the data
3.Optimize parameters
4.Forecast for the holdout data
5.Calculate perf. measures for holdout data
6.Choose model that performs best on holdout data
7.Refit parameters of best model, using all data
$15,000
$17,000
$19,000
$21,000
$23,000
$25,000
$27,000
$29,000
$31,000
$33,000
$35,000
Jan
Feb
Mar
Apr
May Jun
Jul
Aug Sep Oct
Nov
Dec Jan
Feb
Mar
Apr
May Jun
Jul
Aug Sep Oct
Nov
Dec Jan
Feb
Mar
Apr
May Jun
Jul
Aug Sep Oct
Nov
Dec Jan
Feb
Mar
Apr
May Jun
Jul
Aug Sep Oct
Nov
Dec Jan
Feb
Mar
Apr
May Jun
Jul
Aug Sep Oct
Nov
Dec Jan
Feb
Mar
Apr
May Jun
Jul
Aug Sep Oct
Nov
Dec Jan
Feb
Mar
Apr
May Jun
Jul
Aug Sep Oct
Nov
Dec Jan
Feb
Mar
Apr
May Jun
Jul
Aug Sep Oct
Nov
Dec Jan
Feb
Mar
Apr
May Jun
Jul
Aug Sep Oct
Nov
Dec Jan
Feb
Mar
Apr
May Jun
Jul
Aug Sep Oct
Nov
Dec Jan
Feb
Mar
Apr
May Jun
Jul
Aug Sep Oct
Nov
Dec Jan
Feb
Mar
Apr
May Jun
Jul
Aug Sep Oct
Nov
Dec Jan
Feb
Mar
Apr
May Jun
Jul
Aug Sep Oct
Nov
Dec
1992 1993 1994 1995 1996 1997 1998 1999 2000 2001 2002 2003 2004
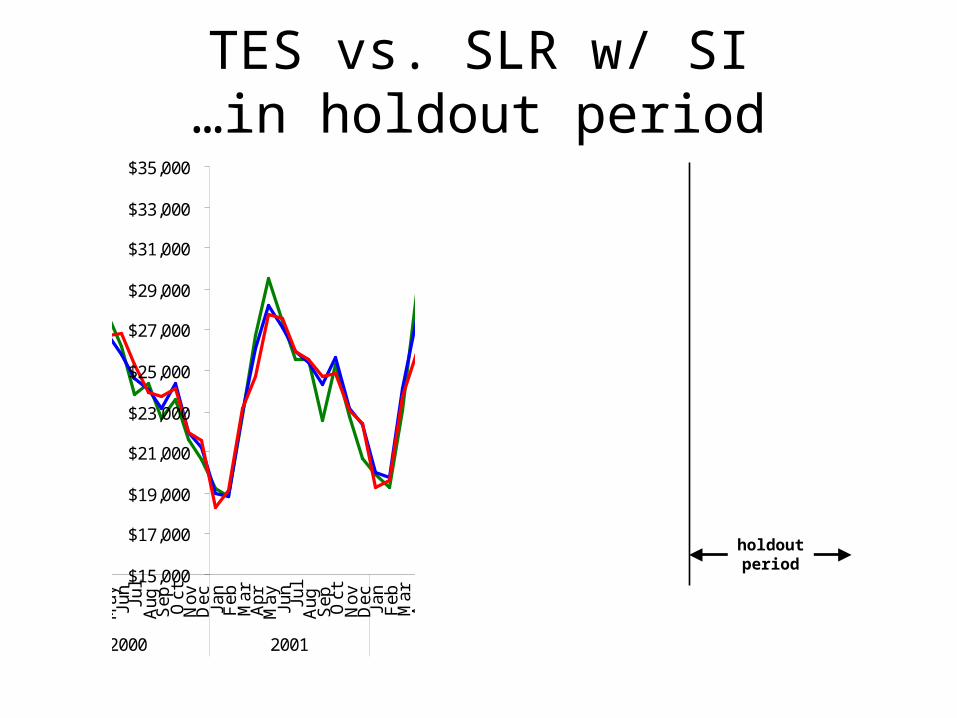
TES vs. SLR w/ SI…in holdout period
holdoutperiod
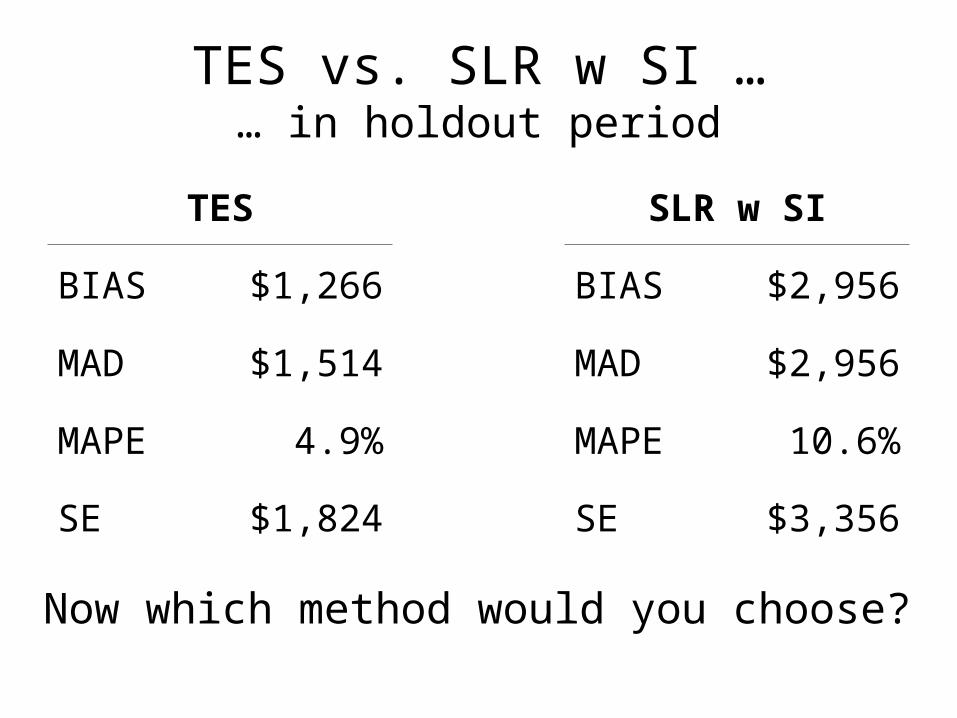
TES vs. SLR w SI …… in holdout period
TES SLR w SI
BIAS $1,266 BIAS $2,956
MAD $1,514 MAD $2,956
MAPE 4.9% MAPE 10.6%
SE $1,824 SE $3,356
Now which method would you choose?
Holdout Strategy Recap
• Performance during holdout period: a.k.a. “out of sample” performance
• In other words: how well does the method perform when forecasting data it hasn’t “seen” yet?
• Question: Why is SE during holdout period worse than SE during “training period”?
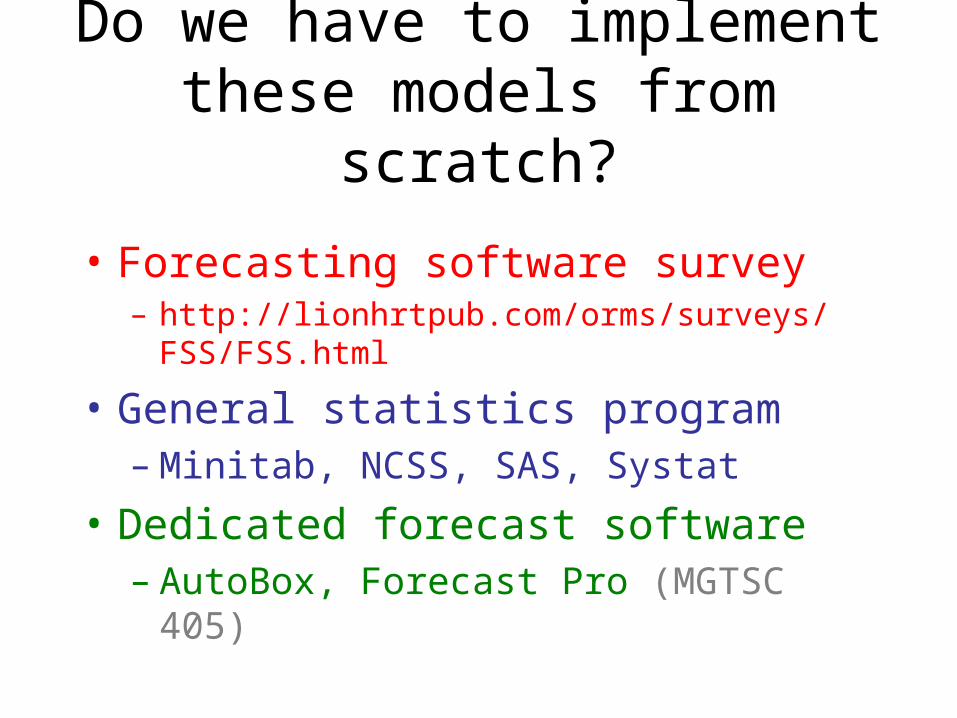
Do we have to implement these models from scratch?
• Forecasting software survey– http://lionhrtpub.com/orms/surveys/FSS/FSS.html
• General statistics program – Minitab, NCSS, SAS, Systat
• Dedicated forecast software– AutoBox, Forecast Pro (MGTSC 405)
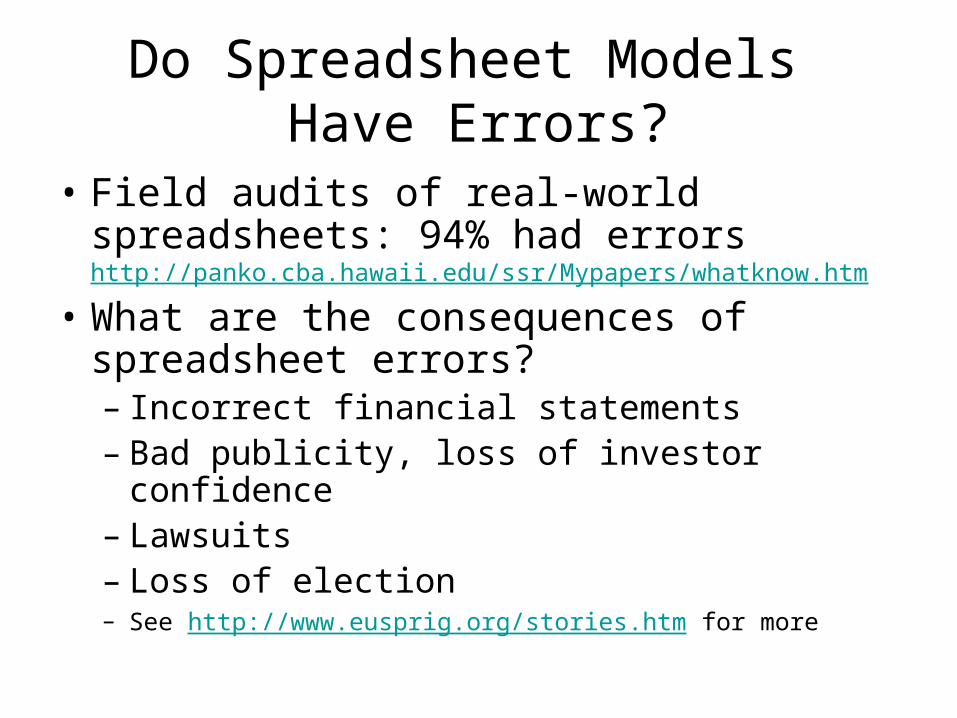
Do Spreadsheet Models Have Errors?
• Field audits of real-world spreadsheets: 94% had errorshttp://panko.cba.hawaii.edu/ssr/Mypapers/whatknow.htm
• What are the consequences of spreadsheet errors?– Incorrect financial statements– Bad publicity, loss of investor confidence– Lawsuits– Loss of election– See http://www.eusprig.org/stories.htm for more
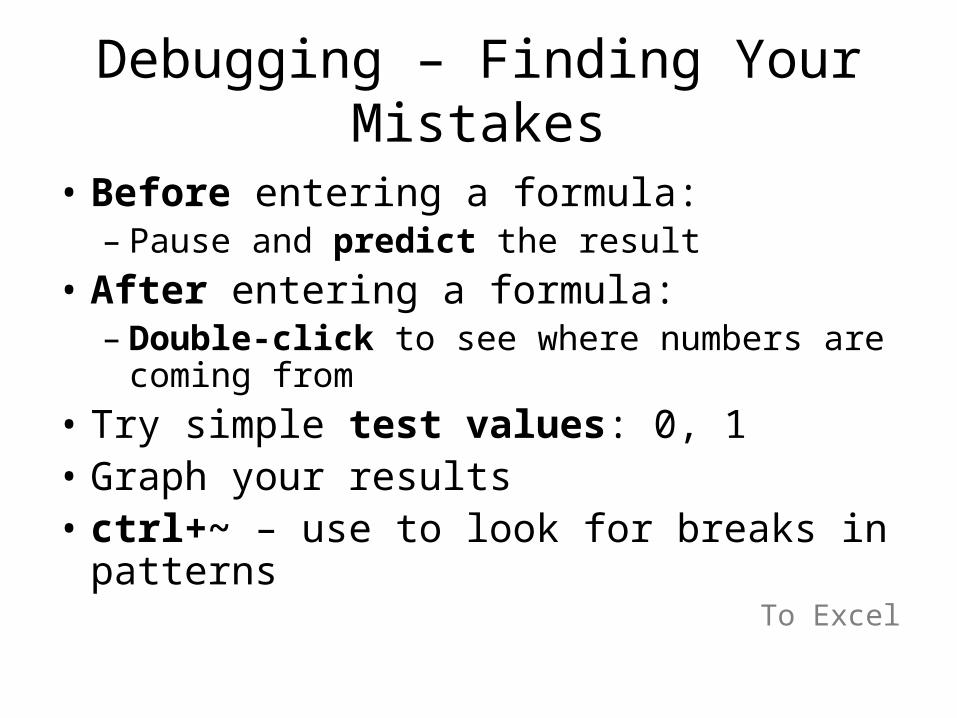
Debugging – Finding Your Mistakes
• Before entering a formula:– Pause and predict the result
• After entering a formula:– Double-click to see where numbers are
coming from
• Try simple test values: 0, 1• Graph your results• ctrl+~ – use to look for breaks in patterns
To Excel
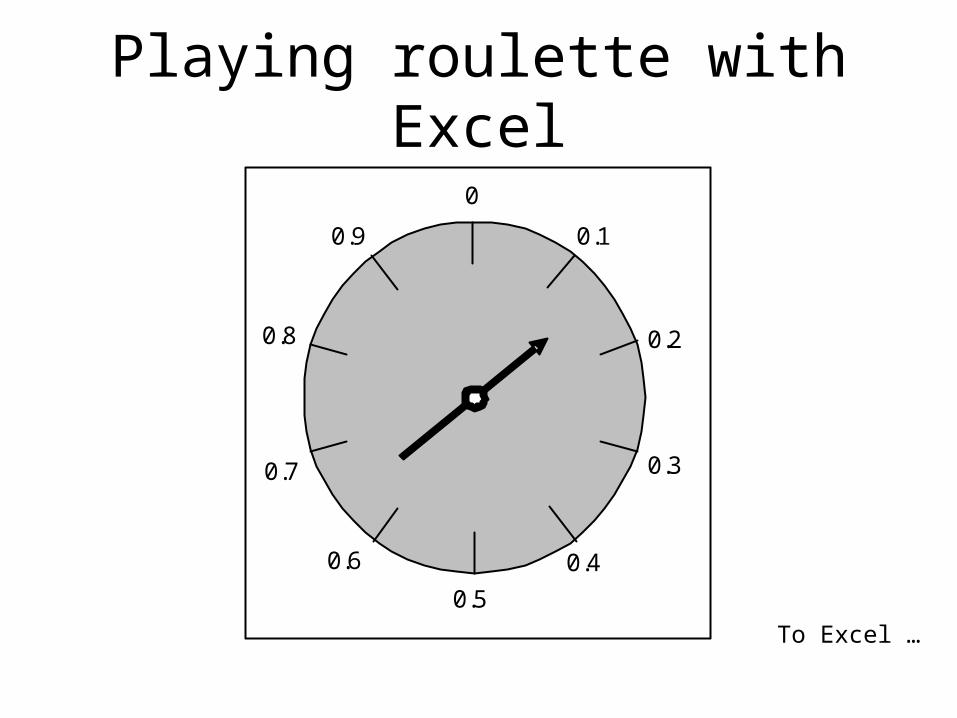
Playing roulette with Excel
0.1
0.2
0.3
0.4
0.5
0.6
0.7
0.8
0.9
0
To Excel …
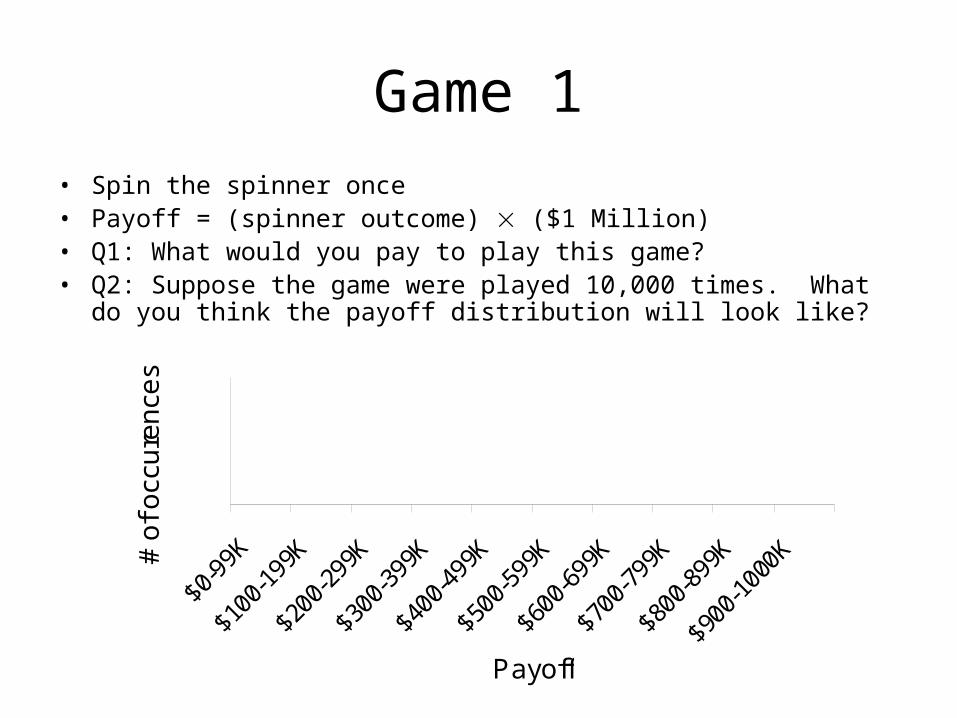
Game 1
• Spin the spinner once• Payoff = (spinner outcome) ($1 Million)• Q1: What would you pay to play this game?• Q2: Suppose the game were played 10,000 times. What do you
think the payoff distribution will look like?
Payoff
# o
f o
ccu
ren
ces
?
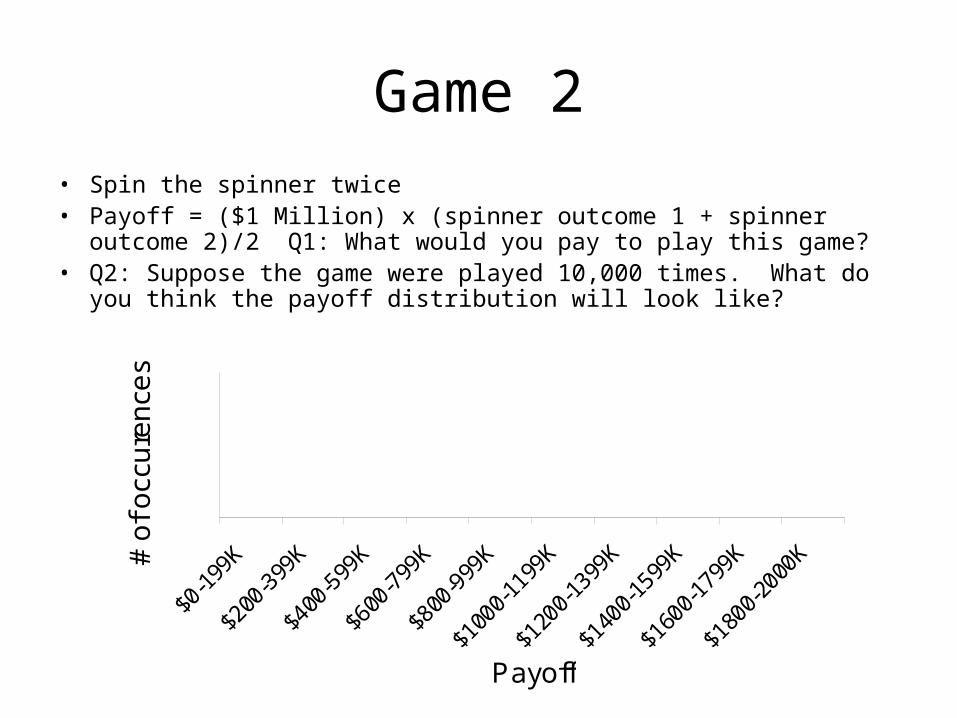
Game 2
• Spin the spinner twice• Payoff = ($1 Million) x (spinner outcome 1 + spinner outcome 2)/2
Q1: What would you pay to play this game?• Q2: Suppose the game were played 10,000 times. What do you
think the payoff distribution will look like?
Payoff
# o
f o
ccu
ren
ces
?
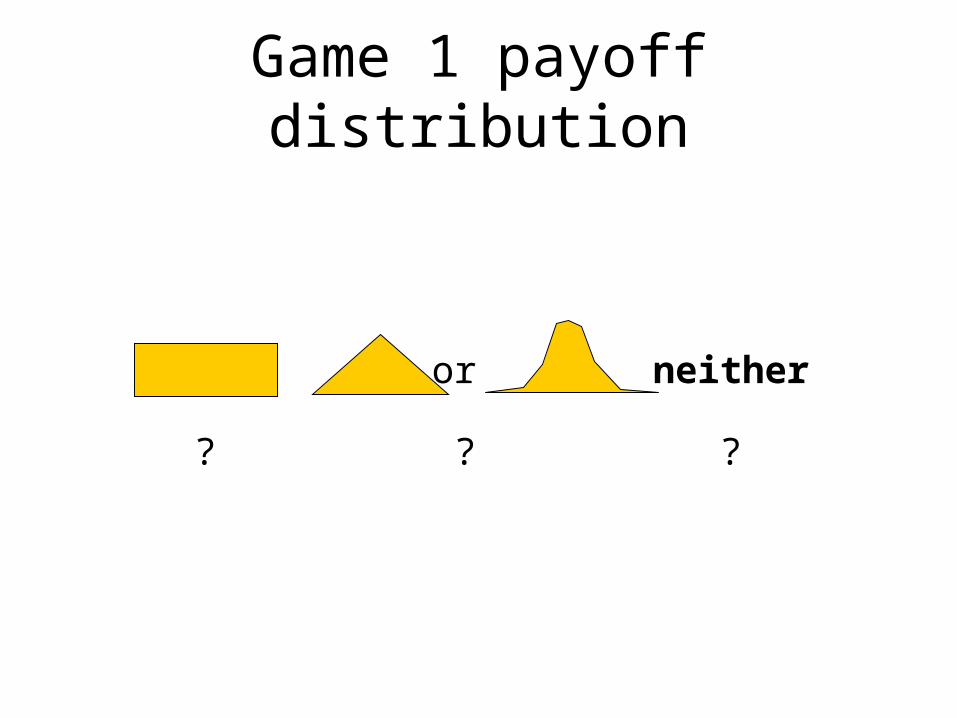
Game 1 payoff distribution
or neither
? ? ?

Game 2 payoff distribution
or neither
? ? ?
Using Excel to get the right answer
• Simulate one spin: =RAND()
• Repeat 10,000 times
• Plot histogram
– To Excel
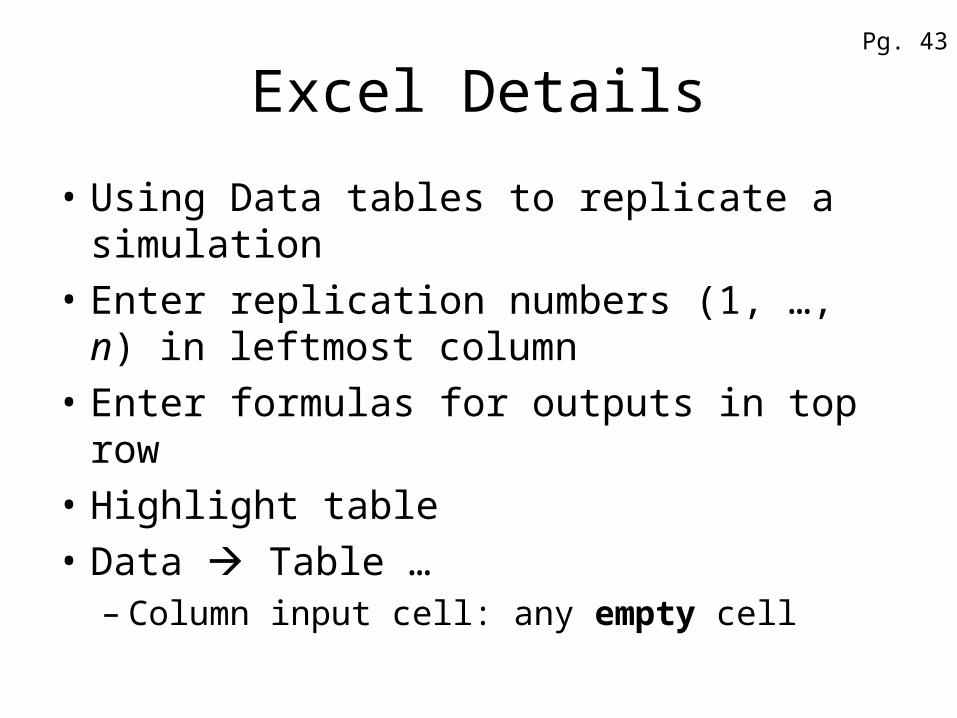
Excel Details
• Using Data tables to replicate a simulation
• Enter replication numbers (1, …, n) in leftmost column
• Enter formulas for outputs in top row
• Highlight table
• Data Table …– Column input cell: any empty cell
Pg. 43
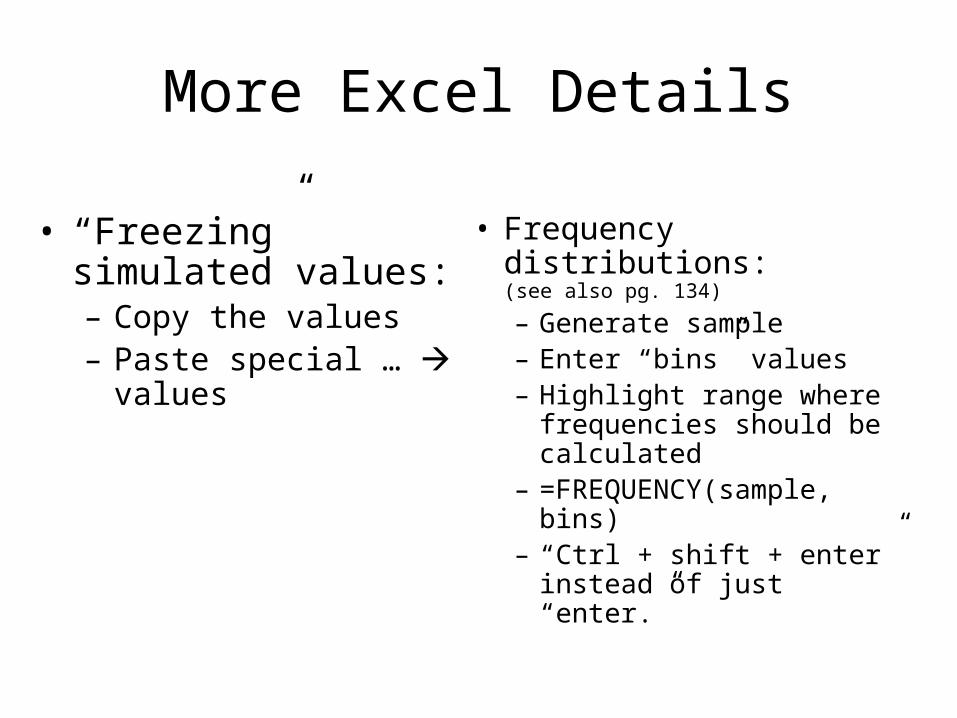
More Excel Details
• “Freezing” simulated values:– Copy the values– Paste special …
values
• Frequency distributions:(see also pg. 134)
– Generate sample– Enter “bins” values– Highlight range where
frequencies should be calculated
– =FREQUENCY(sample, bins)
– “Ctrl + shift + enter” instead of just “enter.”
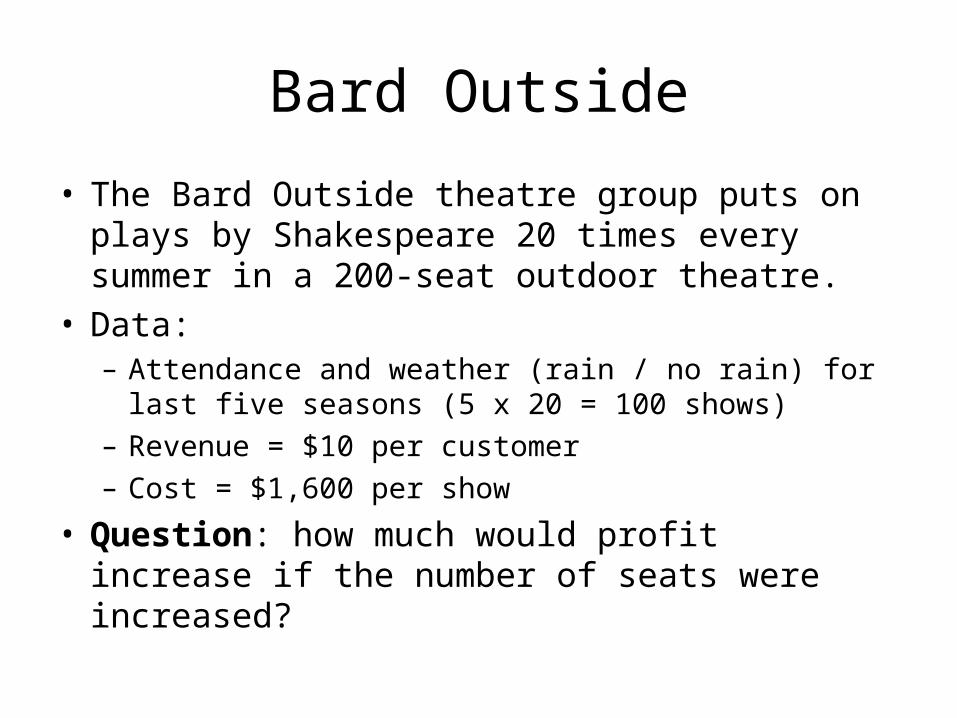
Bard Outside
• The Bard Outside theatre group puts on plays by Shakespeare 20 times every summer in a 200-seat outdoor theatre.
• Data:– Attendance and weather (rain / no rain) for last five
seasons (5 x 20 = 100 shows)– Revenue = $10 per customer– Cost = $1,600 per show
• Question: how much would profit increase if the number of seats were increased?
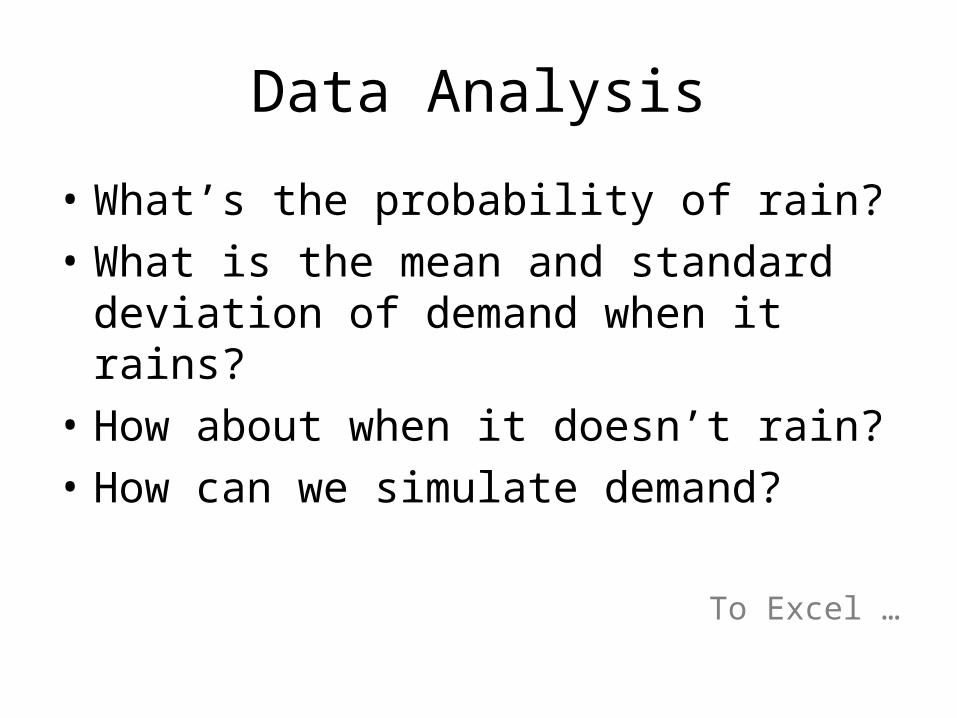
Data Analysis
• What’s the probability of rain?
• What is the mean and standard deviation of demand when it rains?
• How about when it doesn’t rain?
• How can we simulate demand?
To Excel …
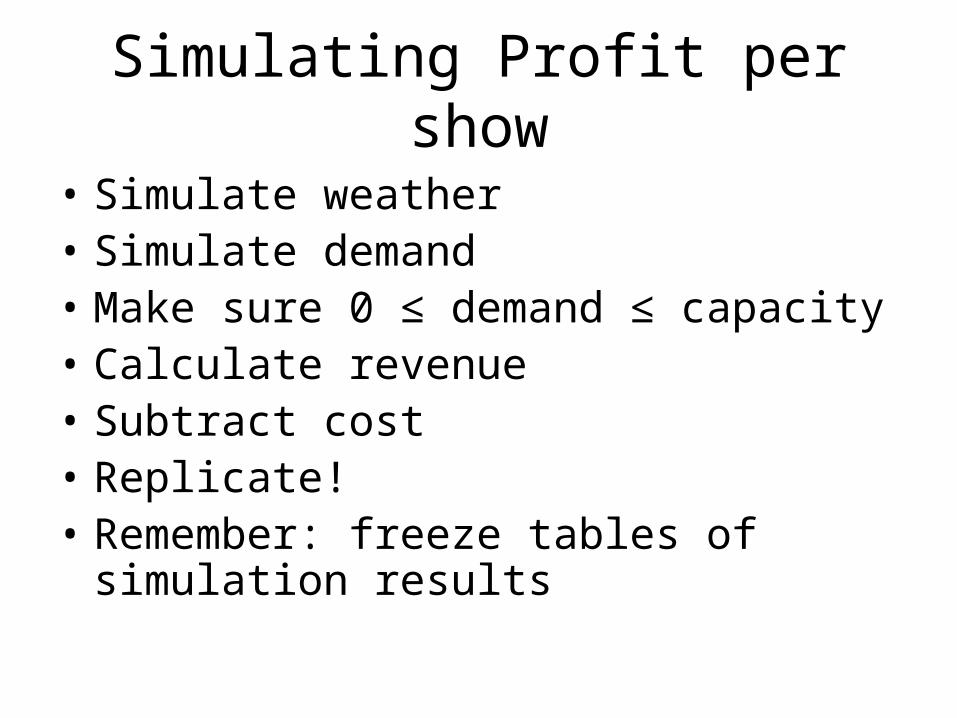
Simulating Profit per show
• Simulate weather• Simulate demand• Make sure 0 ≤ demand ≤ capacity• Calculate revenue• Subtract cost• Replicate!• Remember: freeze tables of simulation
results
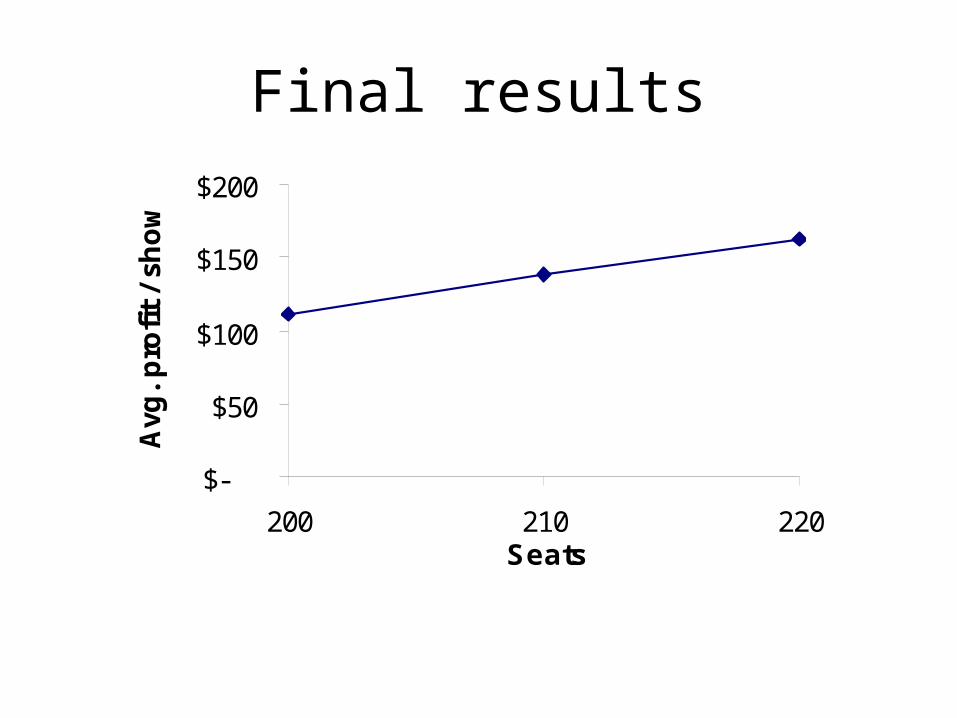
Final results
$-
$50
$100
$150
$200
200 210 220Seats
Avg
. p
rofi
t /
sho
w