Embed Size (px)
Citation preview
Remedial Program Status GE Plant Sites
Hudson Falls and Fort Edward
Community Forum
January 16, 2013
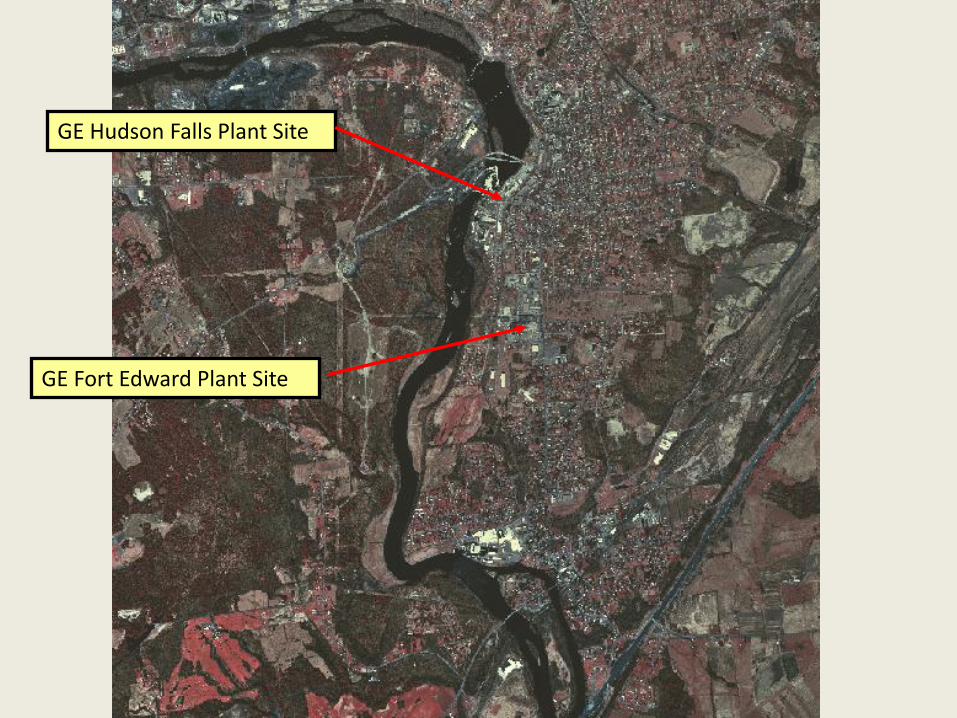
GE Hudson Falls Plant Site
GE Fort Edward Plant Site
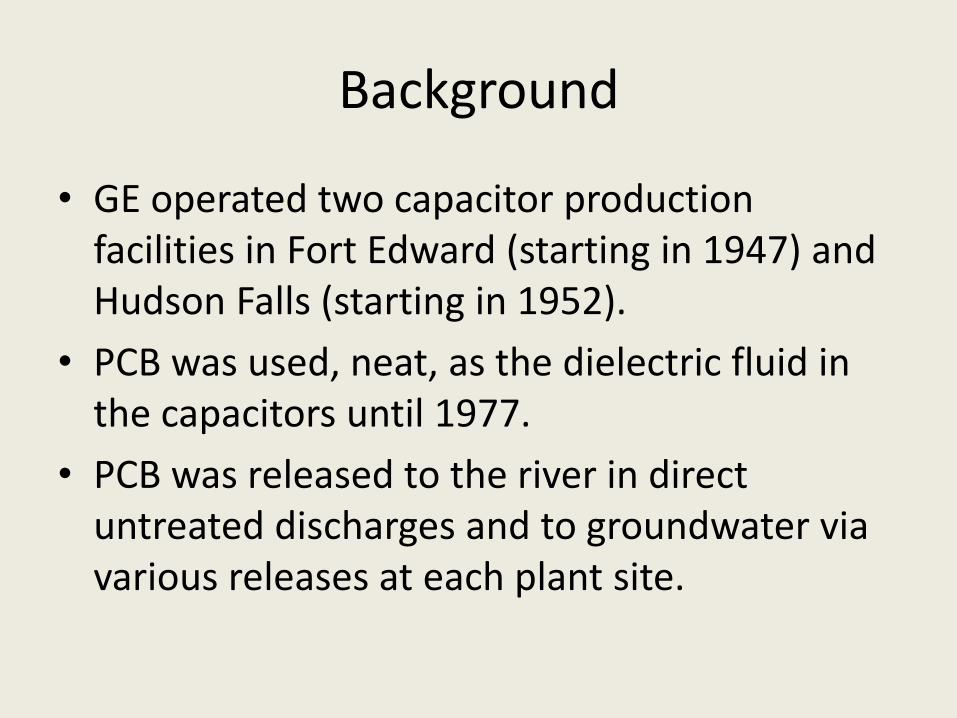
Background
• GE operated two capacitor production facilities in Fort Edward (starting in 1947) and Hudson Falls (starting in 1952).
• PCB was used, neat, as the dielectric fluid in the capacitors until 1977.
• PCB was released to the river in direct untreated discharges and to groundwater via various releases at each plant site.
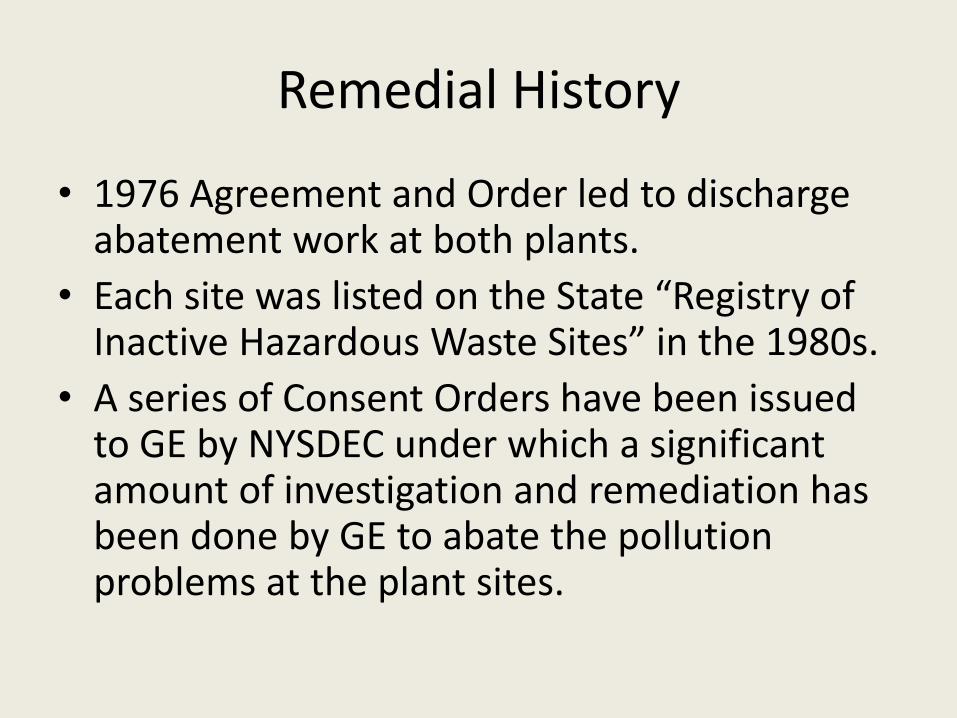
Remedial History
• 1976 Agreement and Order led to discharge abatement work at both plants.
• Each site was listed on the State “Registry of Inactive Hazardous Waste Sites” in the 1980s.
• A series of Consent Orders have been issued to GE by NYSDEC under which a significant amount of investigation and remediation has been done by GE to abate the pollution problems at the plant sites.
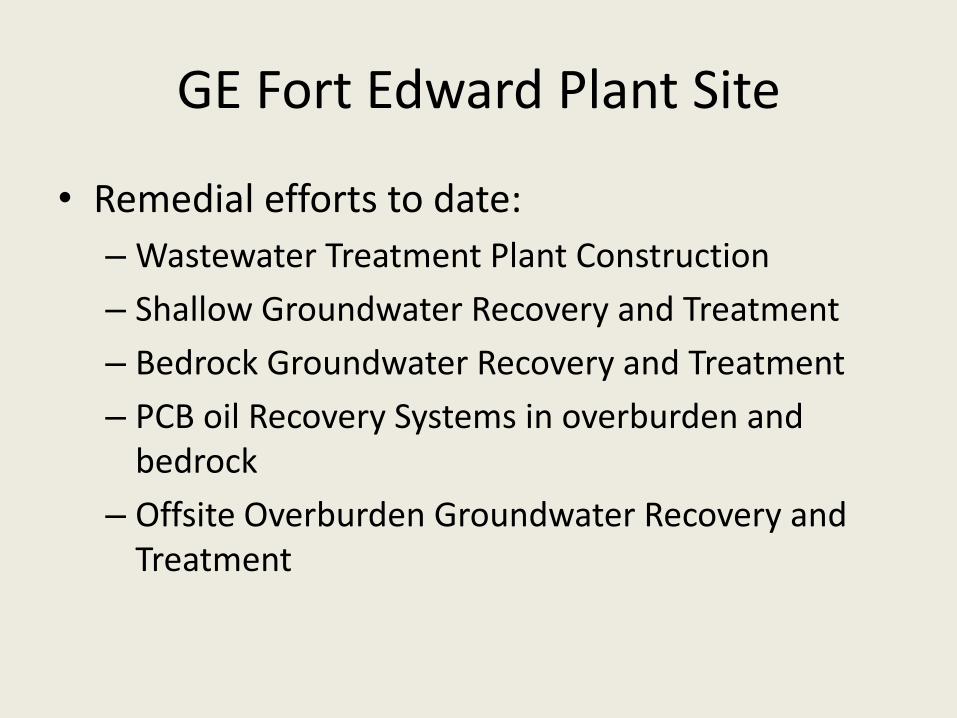
GE Fort Edward Plant Site
• Remedial efforts to date:
– Wastewater Treatment Plant Construction
– Shallow Groundwater Recovery and Treatment
– Bedrock Groundwater Recovery and Treatment
– PCB oil Recovery Systems in overburden and bedrock
– Offsite Overburden Groundwater Recovery and Treatment
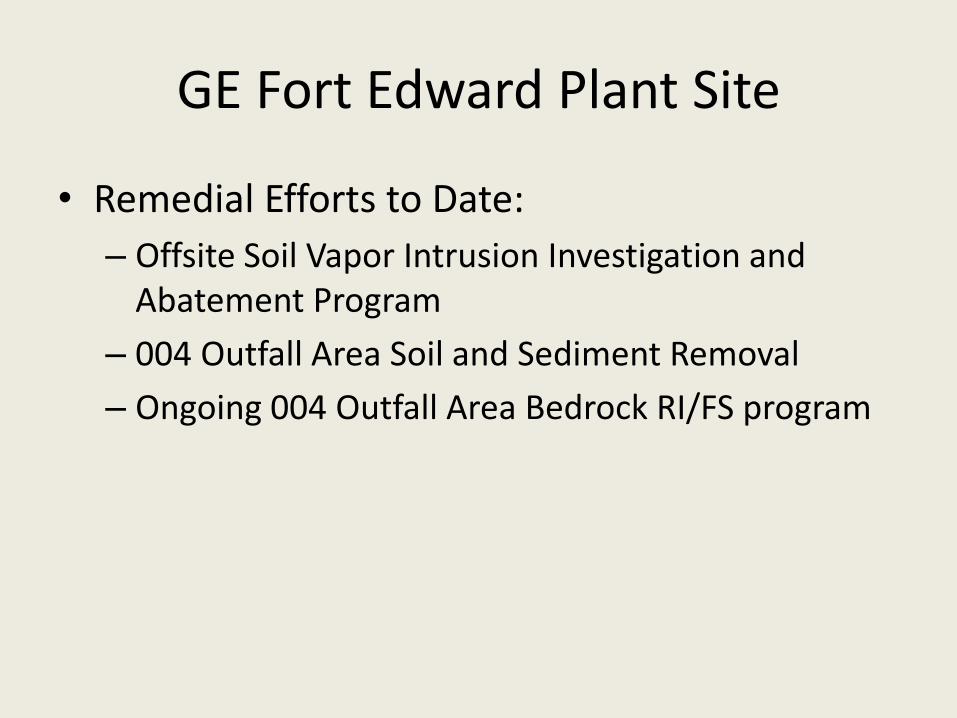
GE Fort Edward Plant Site
• Remedial Efforts to Date:
– Offsite Soil Vapor Intrusion Investigation and Abatement Program
– 004 Outfall Area Soil and Sediment Removal
– Ongoing 004 Outfall Area Bedrock RI/FS program
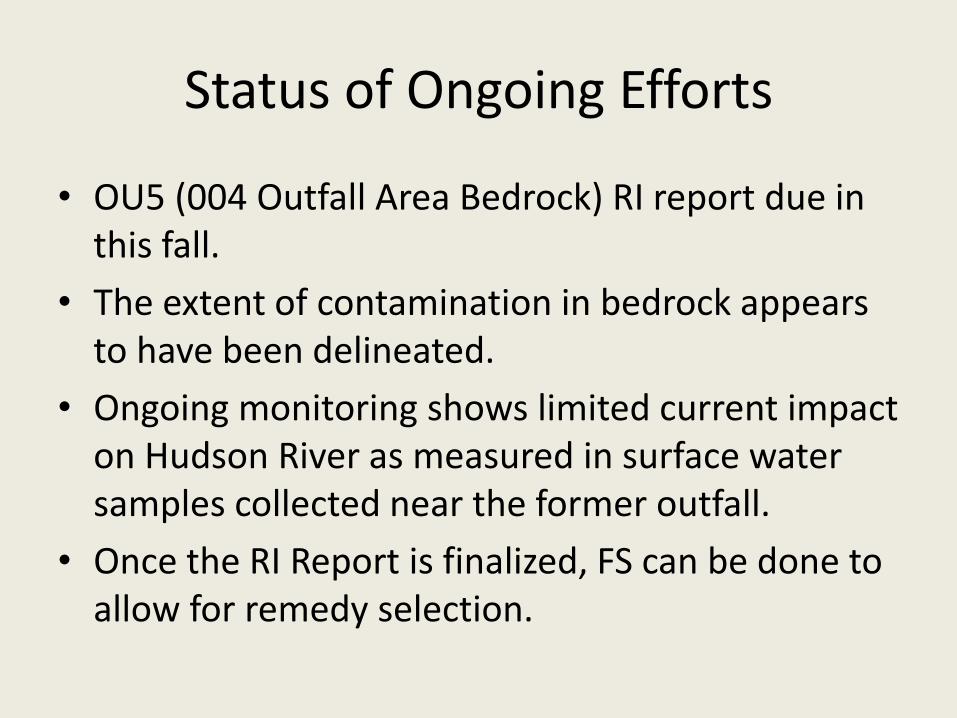
Status of Ongoing Efforts
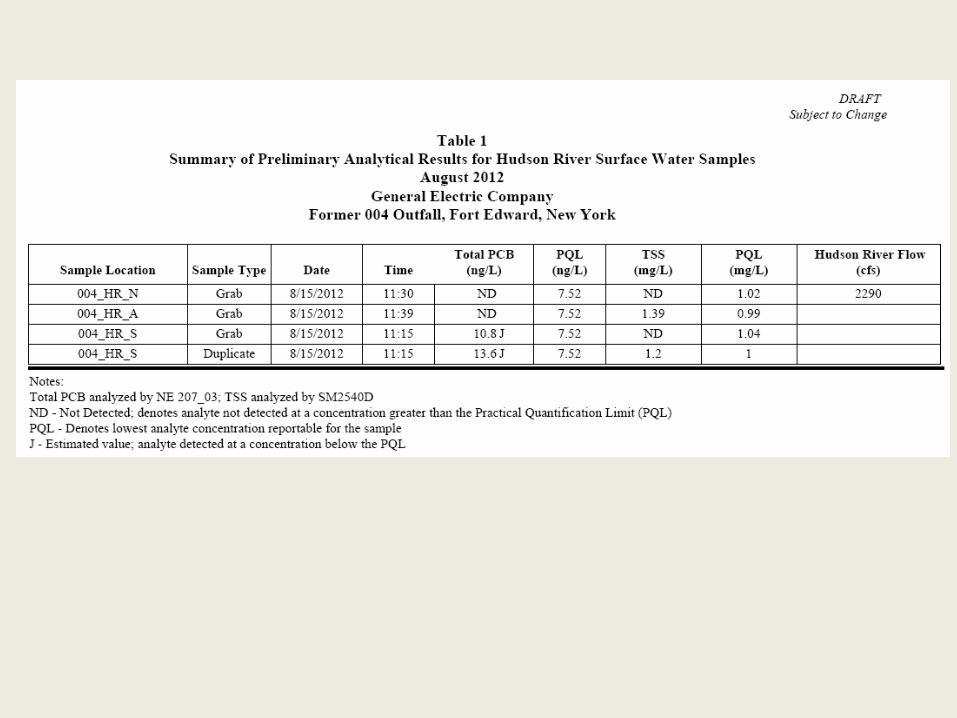
• OU5 (004 Outfall Area Bedrock) RI report due in this fall.
• The extent of contamination in bedrock appears to have been delineated.
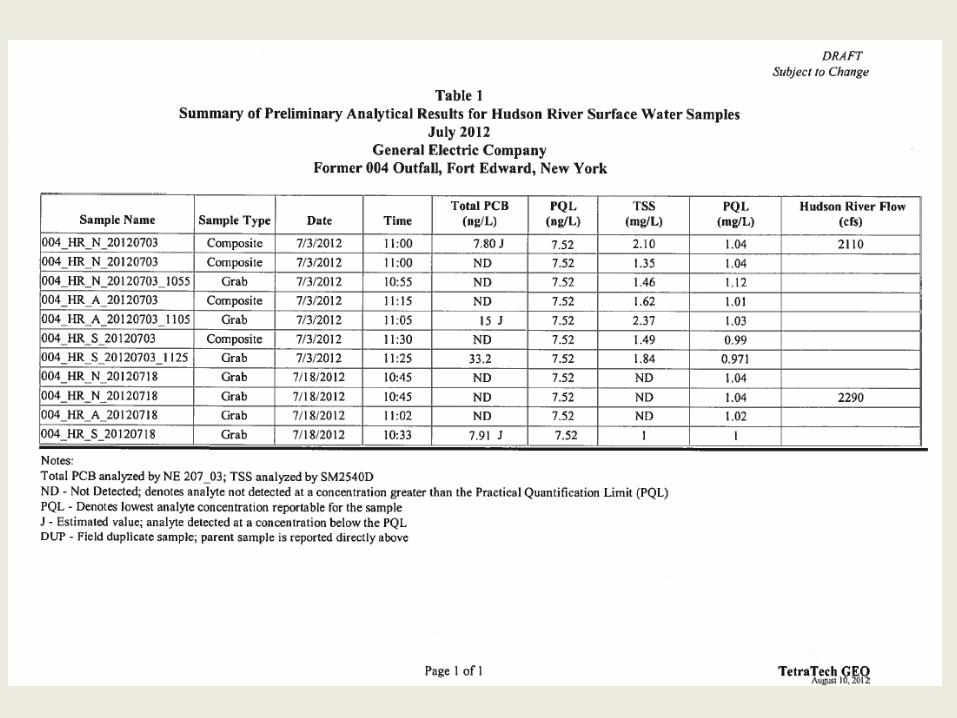
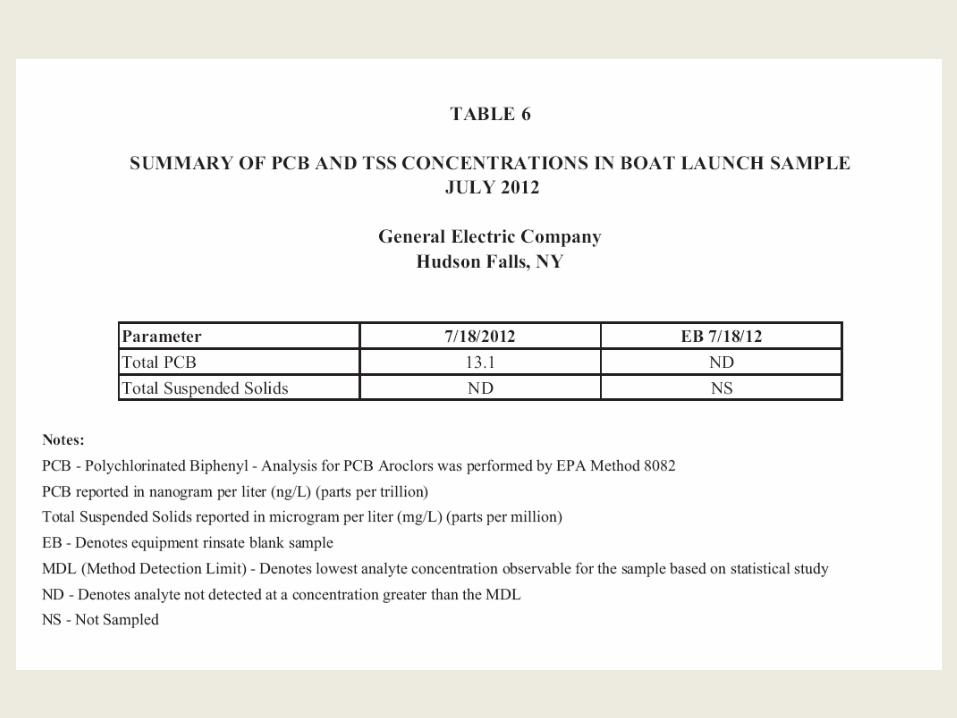
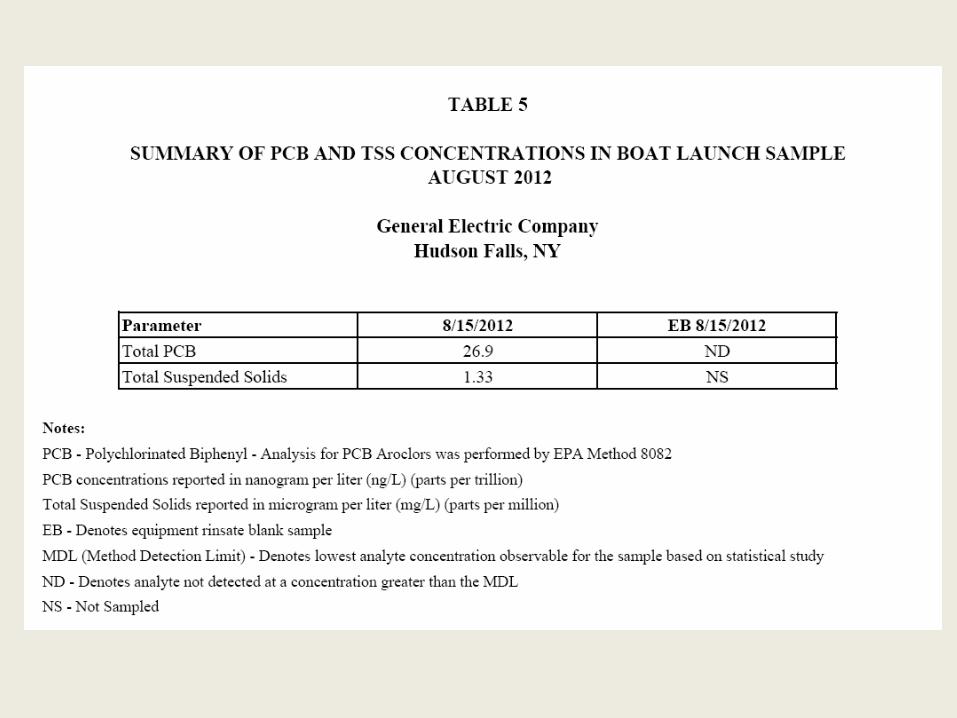
• Ongoing monitoring shows limited current impact on Hudson River as measured in surface water samples collected near the former outfall.
• Once the RI Report is finalized, FS can be done to allow for remedy selection.
GE Hudson Falls Plant Site
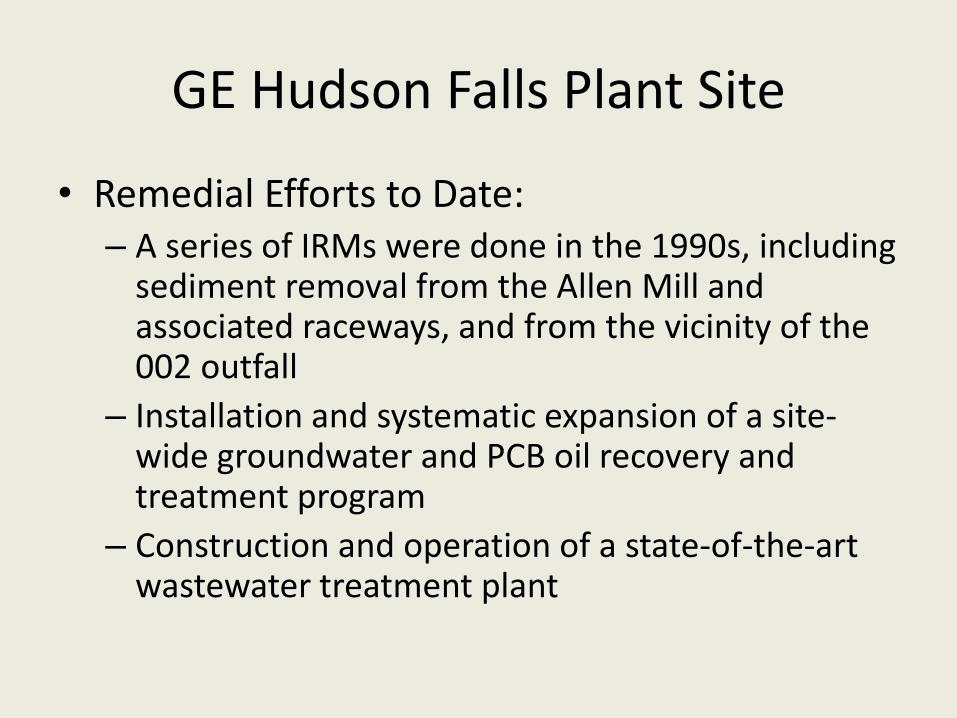
• Remedial Efforts to Date: – A series of IRMs were done in the 1990s, including
sediment removal from the Allen Mill and associated raceways, and from the vicinity of the 002 outfall
– Installation and systematic expansion of a site-wide groundwater and PCB oil recovery and treatment program
– Construction and operation of a state-of-the-art wastewater treatment plant
GE Hudson Falls Plant Site
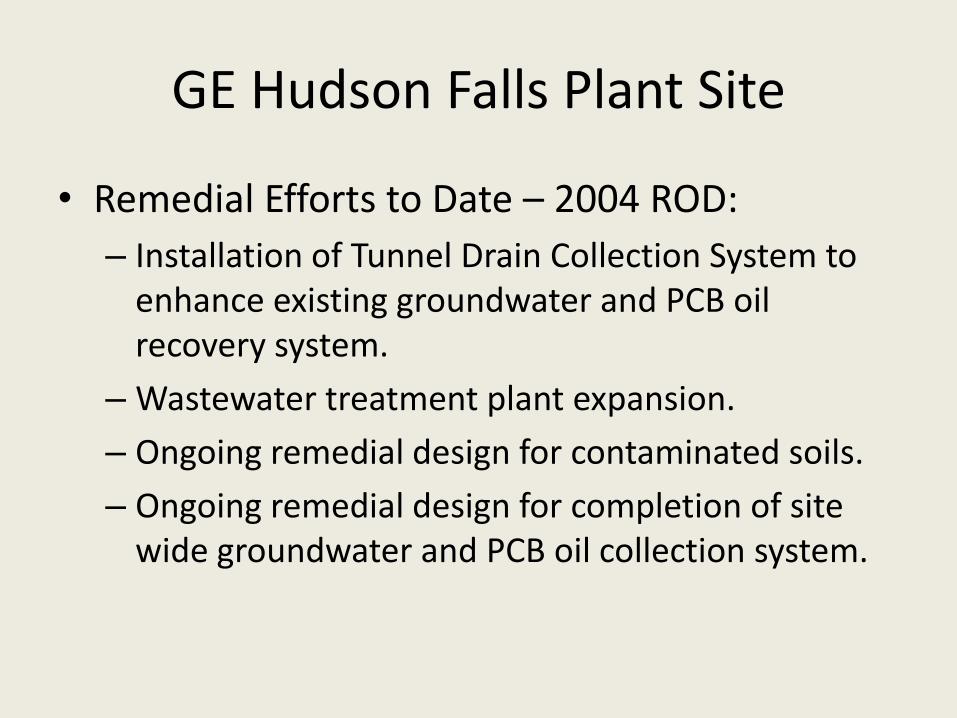
• Remedial Efforts to Date – 2004 ROD:
– Installation of Tunnel Drain Collection System to enhance existing groundwater and PCB oil recovery system.
– Wastewater treatment plant expansion.
– Ongoing remedial design for contaminated soils.
– Ongoing remedial design for completion of site wide groundwater and PCB oil collection system.
Status of Ongoing Efforts
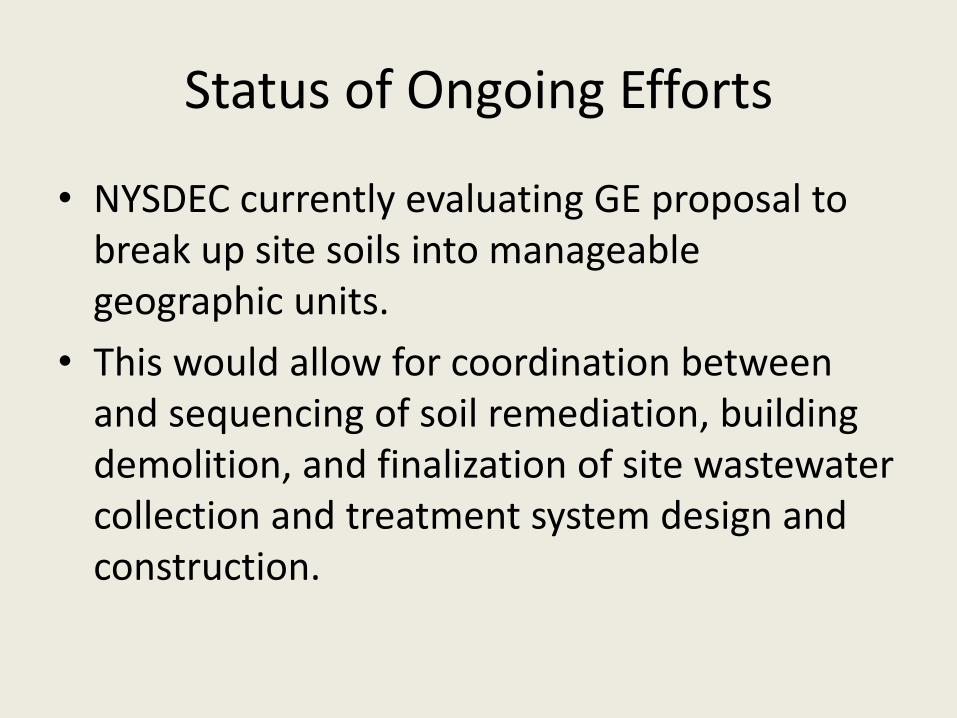
• NYSDEC currently evaluating GE proposal to break up site soils into manageable geographic units.
• This would allow for coordination between and sequencing of soil remediation, building demolition, and finalization of site wastewater collection and treatment system design and construction.
Current Impact of Plant Sites on River
• Major releases from plant sites were primarily abated by cessation of direct discharges in 1970s.
• Identification of ongoing releases during RI/FS programs in the 1980s and 1990s resulted in IRMs to achieve additional significant reductions in PCB releases.
• Remaining work needed to minimize impact of the plant sites on the river, and thus maximize the effectiveness of the EPA-lead sediment remedy.
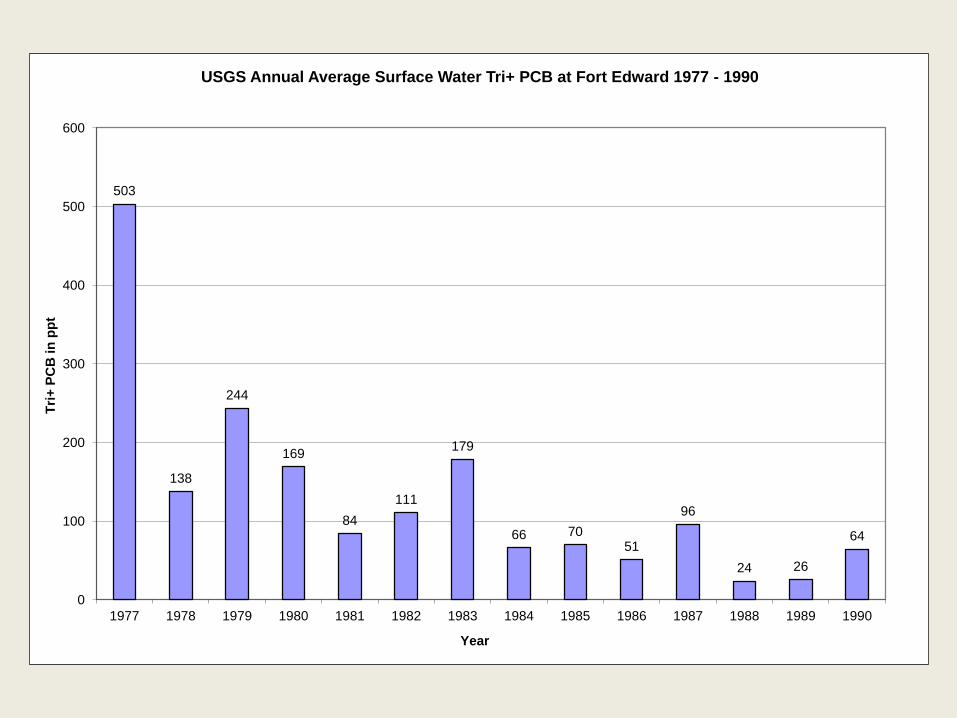
503
138
244
169
84
111
179
66 70 51
96
24 26
64
0
100
200
300
400
500
600
1977 1978 1979 1980 1981 1982 1983 1984 1985 1986 1987 1988 1989 1990
Tri
+ P
CB
in
pp
t
Year
USGS Annual Average Surface Water Tri+ PCB at Fort Edward 1977 - 1990
1
10
100
1000
10000
4/5
/19
91
10
/5/1
99
1
4/5
/19
92
10
/5/1
99
2
4/5
/19
93
10
/5/1
99
3
4/5
/19
94
10
/5/1
99
4
4/5
/19
95
10
/5/1
99
5
4/5
/19
96
10
/5/1
99
6
4/5
/19
97
10
/5/1
99
7
4/5
/19
98
10
/5/1
99
8
4/5
/19
99
10
/5/1
99
9
4/5
/20
00
10
/5/2
00
0
4/5
/20
01
10
/5/2
00
1
4/5
/20
02
10
/5/2
00
2
4/5
/20
03
10
/5/2
00
3
4/5
/20
04
10
/5/2
00
4
4/5
/20
05
10
/5/2
00
5
4/5
/20
06
10
/5/2
00
6
4/5
/20
07
10
/5/2
00
7
4/5
/20
08
10
/5/2
00
8
PC
B in
ng
/l
.
Date
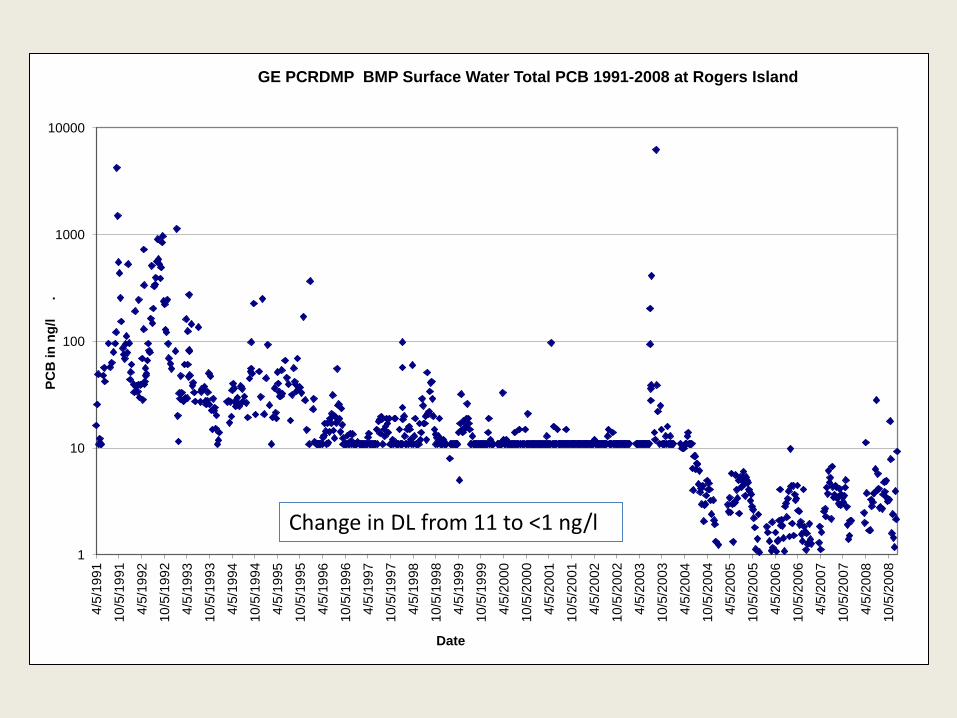
GE PCRDMP BMP Surface Water Total PCB 1991-2008 at Rogers Island
Change in DL from 11 to <1 ng/l
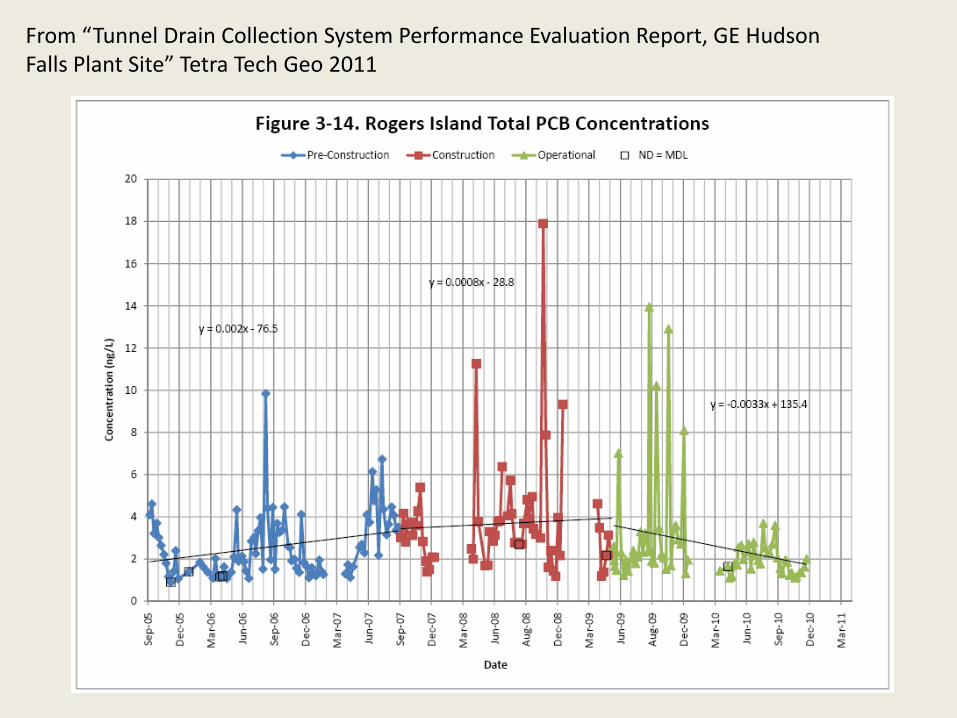
From “Tunnel Drain Collection System Performance Evaluation Report, GE Hudson Falls Plant Site” Tetra Tech Geo 2011
0
1
2
3
4
5
6
7
8
9
10
6/2
/20
11
6/9
/20
11
6/1
6/2
01
1
6/2
3/2
01
1
6/3
0/2
01
1
7/7
/20
11
7/1
4/2
01
1
7/2
1/2
01
1
7/2
8/2
01
1
8/4
/20
11
8/1
1/2
01
1
8/1
8/2
01
1
8/2
5/2
01
1
9/1
/20
11
9/8
/20
11
9/1
5/2
01
1
9/2
2/2
01
1
9/2
9/2
01
1
10
/6/2
01
1
10
/13
/20
11
TPC
B in
ng/
l
Date
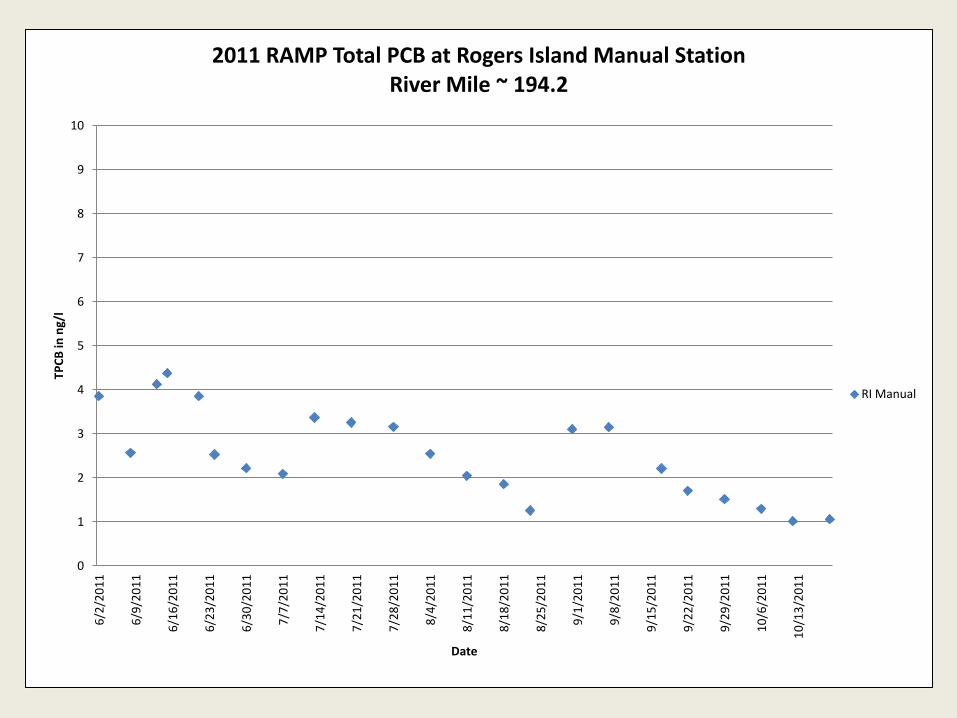
2011 RAMP Total PCB at Rogers Island Manual Station River Mile ~ 194.2
RI Manual
0
10
20
30
40
50
60
70
80
90
100
8/1
8/2
01
1 0
:00
8/2
0/2
01
1 0
:00
8/2
2/2
01
1 0
:00
8/2
4/2
01
1 0
:00
8/2
6/2
01
1 0
:00
8/2
8/2
01
1 0
:00
8/3
0/2
01
1 0
:00
9/1
/20
11
0:0
0
9/3
/20
11
0:0
0
9/5
/20
11
0:0
0
9/7
/20
11
0:0
0
9/9
/20
11
0:0
0
9/1
1/2
01
1 0
:00
9/1
3/2
01
1 0
:00
9/1
5/2
01
1 0
:00
9/1
7/2
01
1 0
:00
9/1
9/2
01
1 0
:00
9/2
1/2
01
1 0
:00
9/2
3/2
01
1 0
:00
9/2
5/2
01
1 0
:00
9/2
7/2
01
1 0
:00
9/2
9/2
01
1 0
:00
10
/1/2
01
1 0
:00
10
/3/2
01
1 0
:00
10
/5/2
01
1 0
:00
10
/7/2
01
1 0
:00
10
/9/2
01
1 0
:00
10
/11
/20
11
0:0
0
10
/13
/20
11
0:0
0
10
/15
/20
11
0:0
0
10
/17
/20
11
0:0
0
10
/19
/20
11
0:0
0
10
/21
/20
11
0:0
0
10
/23
/20
11
0:0
0
10
/25
/20
11
0:0
0
10
/27
/20
11
0:0
0
TPC
B in
ng/
l
Date
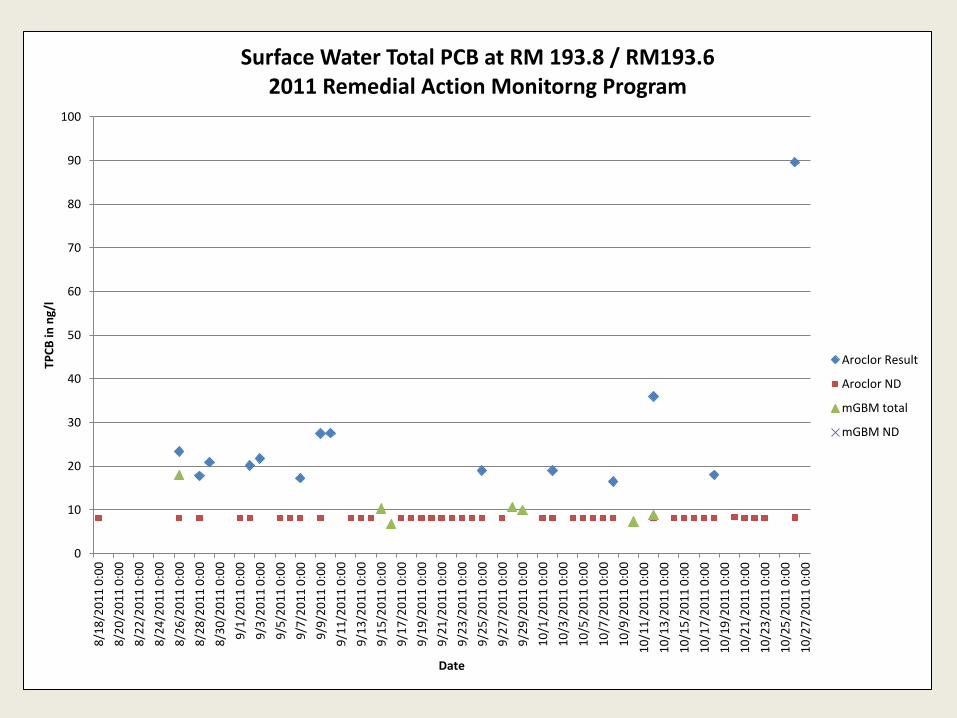
Surface Water Total PCB at RM 193.8 / RM193.6 2011 Remedial Action Monitorng Program
Aroclor Result
Aroclor ND
mGBM total
mGBM ND
0
5
10
15
20
25
30
35
40
45
50
5/9
/20
12
5/1
6/2
01
2
5/2
3/2
01
2
5/3
0/2
01
2
6/6
/20
12
6/1
3/2
01
2
6/2
0/2
01
2
6/2
7/2
01
2
7/4
/20
12
7/1
1/2
01
2
7/1
8/2
01
2
7/2
5/2
01
2
8/1
/20
12
8/8
/20
12
8/1
5/2
01
2
8/2
2/2
01
2
8/2
9/2
01
2
9/5
/20
12
9/1
2/2
01
2
9/1
9/2
01
2
9/2
6/2
01
2
Tota
l PC
B in
ng/
l
Sample Date
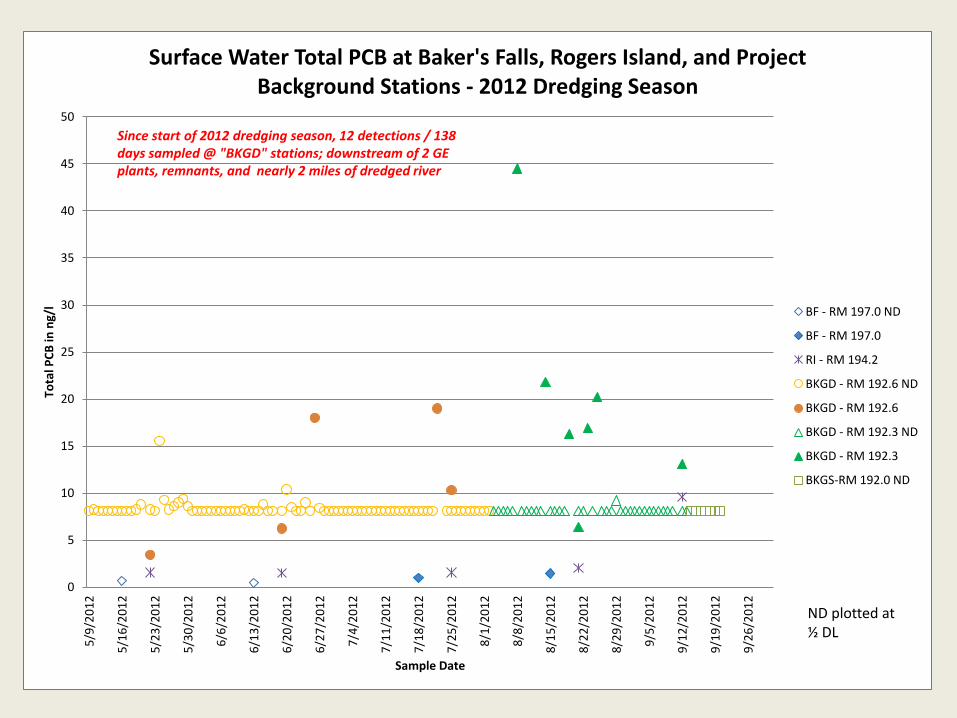
Surface Water Total PCB at Baker's Falls, Rogers Island, and Project Background Stations - 2012 Dredging Season
BF - RM 197.0 ND
BF - RM 197.0
RI - RM 194.2
BKGD - RM 192.6 ND
BKGD - RM 192.6
BKGD - RM 192.3 ND
BKGD - RM 192.3
BKGS-RM 192.0 ND
Since start of 2012 dredging season, 12 detections / 138 days sampled @ "BKGD" stations; downstream of 2 GE plants, remnants, and nearly 2 miles of dredged river
ND plotted at ½ DL
Summary
• Source control at the plant sites (cessation of direct untreated discharges, implementation of numerous IRMs by GE, and implementation of the final remedies at both plants by GE and NYSDEC) has created a new status quo – the plant sites no longer appear to be sources of PCB to the river of large scale significance.
Summary
• Available surface water PCB data suggest that the Hudson River PCB problem is starting to diminish as the remedial program progresses downstream.
• The combination of upstream source control, with focused environmental dredging of contaminated sediments, appears to be working to reduce PCB concentrations in surface water.
For More Information
• To discuss the GE Hudson Falls and Fort Edward plant site remedial projects, or to obtain data, please call or email:
Kevin Farrar
Division of Environmental Remediation
518-402-9778