Embed Size (px)
Citation preview

Relocation of Non-Nuclear Production to an Alternate Location
Business Case
October 18, 2007
Revision 2
Prepared for U.S. Department of Energy
National Nuclear Security Administration Defense Programs
Office of Transformation
Prepared by Science Applications International Corporation

This Page Intentionally Blank.
Revision 2 October 2007
RECORD OF CHANGES
REV 1 TO REV 2
- Changed document date from September 20th to October 18th, 2007.
- Reorganized Executive Summary for greater clarity.
- Added an acronyms list.
- Made minor editorial cleanups.
REV 0 TO REV 1
- Changed document date from September 17th to September 20th, 2007.
- Added the alternative showing the Status Quo, Continue Current Facility Operations, in Table ES-1 and Table 6.
- Changed “Annualized FY06 Dollars” to “Constant FY06 Dollars” in Table ES-1, Table 3 and Table 6.
- Changed interpretation of the breakeven point from the 95th percentile, of the range of assumptions, based on linear interpolation of the data, to the 99.58th percentile of the range of assumptions, based on simulations that showed the nonlinearity of data in that region.
- Adjusted the text to better define the base case and median values for the model results.
- Added the opinion letter from TechSource, Incorporated as Appendix 6.
Revision 2 October 2007

This Page Intentionally Blank.
Revision 2 October 2007
Relocation of Non-Nuclear Production to an Alternate Location Business Case
TABLE OF CONTENTS
List of Figures .............................................................................................................................................. iii
List of Tables ............................................................................................................................................... iii
Executive Summary ..................................................................................................................................... iv
1.0 Introduction ....................................................................................................................................... 11.1 Study Objective ....................................................................................................................... 11.2 Approach ................................................................................................................................. 21.2.1 Location Selection .............................................................................................................. 21.2.2 Business Case Model .......................................................................................................... 2
2.0 Relocation Scenario........................................................................................................................... 32.1 Facility Construction and Occupation ..................................................................................... 32.2 Production Resumption ........................................................................................................... 32.3 Personnel ................................................................................................................................. 3
3.0 Alternative City Selection ................................................................................................................. 53.1 Benefits.................................................................................................................................... 53.2 Costs ........................................................................................................................................ 5
4.0 Quantifying Benefits ......................................................................................................................... 9
5.0 Quantifying Costs ............................................................................................................................ 115.1 Nonrecurring Costs................................................................................................................ 115.1.1 Moving Costs.................................................................................................................... 12 5.1.2 Personnel Costs – Initial Staffing ..................................................................................... 125.1.3 Delay costs........................................................................................................................ 125.2 Recurring Costs ..................................................................................................................... 135.2.1 Lease Costs ....................................................................................................................... 135.2.2 Operating Costs................................................................................................................. 14
6.0 Quantitative Results......................................................................................................................... 156.1 Business Case Model............................................................................................................. 15 6.2 KCRIMS to Albuquerque Risk Adjusted Results ................................................................. 166.3 Business Case Comparisons .................................................................................................. 18
7.0 Discussion of Sensitivity Analysis Results ..................................................................................... 217.1 Production Volume................................................................................................................ 217.2 Outsourcing Percent .............................................................................................................. 227.3 Legacy Remediation.............................................................................................................. 22 7.4 Annual Transportation........................................................................................................... 22 7.5 Continuity of Critical Operations .......................................................................................... 237.6 Moving Costs ........................................................................................................................ 237.7 Employee Willingness to Relocate........................................................................................ 237.8 Regulatory Framework.......................................................................................................... 237.9 Community Acceptance ........................................................................................................ 247.10 Life Extension Program (LEP) Strategy................................................................................ 247.11 Reliable Replacement Warhead (RRW) Strategy ................................................................. 247.12 Stockpile Size, and Composition and Technology................................................................ 247.13 Weapon Activity Budgets...................................................................................................... 24
Revision 2 i October 2007

Relocation of Non-Nuclear Production to an Alternate Location Business Case
8.0 Risk Identification ........................................................................................................................... 258.1 Viability of the Build-Ahead Plan......................................................................................... 258.2 Early Attrition at KCP........................................................................................................... 258.3 Implementation Challenges ................................................................................................... 258.4 Distant Location Planning ..................................................................................................... 258.5 Greenfield Site Availability................................................................................................... 268.6 Viability of On-Site Facility Scenario ................................................................................... 268.7 Lost Commercialization Potential ......................................................................................... 268.8 Capturing Regional Savings .................................................................................................. 268.9 Increased Near-Term Negative Cash Flow ........................................................................... 278.10 Deferred Maintenance (RTBF and FIRP) ............................................................................. 27
Appendix 1 – Alternate Location Strengths, Weaknesses, Opportunities, and Threats (SWOT) Analysis 29
Appendix 2 – City Desirability Analysis .................................................................................................... 31
Appendix 3 – Scenario Assumptions .......................................................................................................... 37Spectrum of Alternatives ................................................................................................................. 37
Appendix 4 – Business Case Model ........................................................................................................... 39Description of the Business Case Model ......................................................................................... 39Selection of Variables and Ranges for Sensitivity Analysis ........................................................... 41
Appendix 5 – Crystal Ball Sensitivity Analysis.......................................................................................... 55Sensitivity Results from CB Analysis ............................................................................................. 55
Appendix 6 – Opinion Letter ...................................................................................................................... 59
Appendix 7 – Vitae ..................................................................................................................................... 61
Revision 2 ii October 2007
Relocation of Non-Nuclear Production to an Alternate Location Business Case
LIST OF FIGURES
Figure ES-1. Annual Cash Flow Difference for Albuquerque Compared to KCRIMS Proposal – Budget Year ($ millions) .......................................................................................................................................... vi
Figure 1. Site Selection Analysis.............................................................................................................. 5
Figure 2. City Desirability Comparisons .................................................................................................. 6
Figure 3. Range of Collocation Benefits .................................................................................................. 9
Figure 4. Nonrecurring Cost Relationships ............................................................................................ 11
Figure 5. Albuquerque Scenario Schedule Extension............................................................................. 13
Figure 6. Net Present Value of Albuquerque Move vs. KCRIMS ($M) ................................................ 17
Figure 7. Likelihood Distributions for Net Present Value difference from KCRIMS............................ 17
Figure 8. Effect of Production Variations on Total Operating Cost ....................................................... 22
Figure 9. Additional Annual Cash Flow Requirements Associated with Moving to Albuquerque....... 27
Figure 4-1. Summary Worksheet ............................................................................................................... 48
Figure 4-2. Albuquerque Site Worksheet................................................................................................... 49
Figure 5-1. Graphical Representation of Input Parameters – Contribution to Variance ............................ 56
LIST OF TABLES
Table ES-1. Near-Term Cash Flow Difference – Albuquerque Move versus KCRIMS Proposal ............. vi
Table ES-2. Business Case Comparison All Alternatives .........................................................................vii
Table 1. Salary Comparisons for Selected Weapons Complex Locations................................................... 7
Table 2. Relative Constructions Costs ......................................................................................................... 7
Table 3. Business Case Model Results (Base Case) .................................................................................. 15
Table 4. Likelihood vs. Net Present Value Difference from KCRIMS .................................................... 16
Table 5. Business Case Model Parameters and Ranges............................................................................. 18
Table 6. All Business Case Options Arrayed............................................................................................. 19
Table 7. Sensitivity of Input Parameters: Rank Correlation and Contribution to Variance....................... 21
Table 2-1. Normalized City Desirability Scores ........................................................................................ 32
Table 2-2. Sensitivity Analysis Factors City Desirability.......................................................................... 32
Table 3-1. Scenario Assumptions .............................................................................................................. 37
Table 4-1. Construction and Lease Cost Differentials by Site................................................................... 40
Table 4-2. Moving Cost Spreads for each Site .......................................................................................... 40
Table 4-3. Model Parameters and Assumptions ........................................................................................ 42
Table 4-4. Taxes by Site ............................................................................................................................. 49
Table 4-4. Taxes by Site ............................................................................................................................. 50
Revision 2 iii October 2007
Relocation of Non-Nuclear Production to an Alternate Location Business Case
Table 4-5. Facilities Worksheet ................................................................................................................. 51
Table 4-6. Moving Cost Calculator............................................................................................................ 52
Table 4-7. Build Ahead Source Data ......................................................................................................... 53
Table 4-8. Remediation Cost Source Data................................................................................................. 53
Table 5-1. Sensitivity of Input Parameters: Rank Correlation and Contribution to Variance. .................. 55
LIST OF ACRONYMS
DOE Department of Energy
EA Environmental Assessment
FIRP Facilities and Infrastructure Recapitalization Program
FTE Full-Time Equivalent
FYNSP Future Years Nuclear Security Program
HUD U.S. Department of Housing and Urban Development
KCP Kansas City Plant
KCRIMS Kansas City Responsive Infrastructure Manufacturing and Sourcing
LEP Life Extension Program
NNSA National Nuclear Security Administration
NPV Net Present Value
O&M Operations and Maintenance
OMB Office of Management and Budget
RFQ request for quotations
RRW Reliable Replacement Warhead
RTBF Readiness in Technical Base and Facilities
SNL Sandia National Laboratories
SNL-NM Sandia National Laboratories-New Mexico
SWOT strengths, weaknesses, opportunities, and threats
Revision 2 iv October 2007
Relocation of Non-Nuclear Production to an Alternate Location Business Case
EXECUTIVE SUMMARY
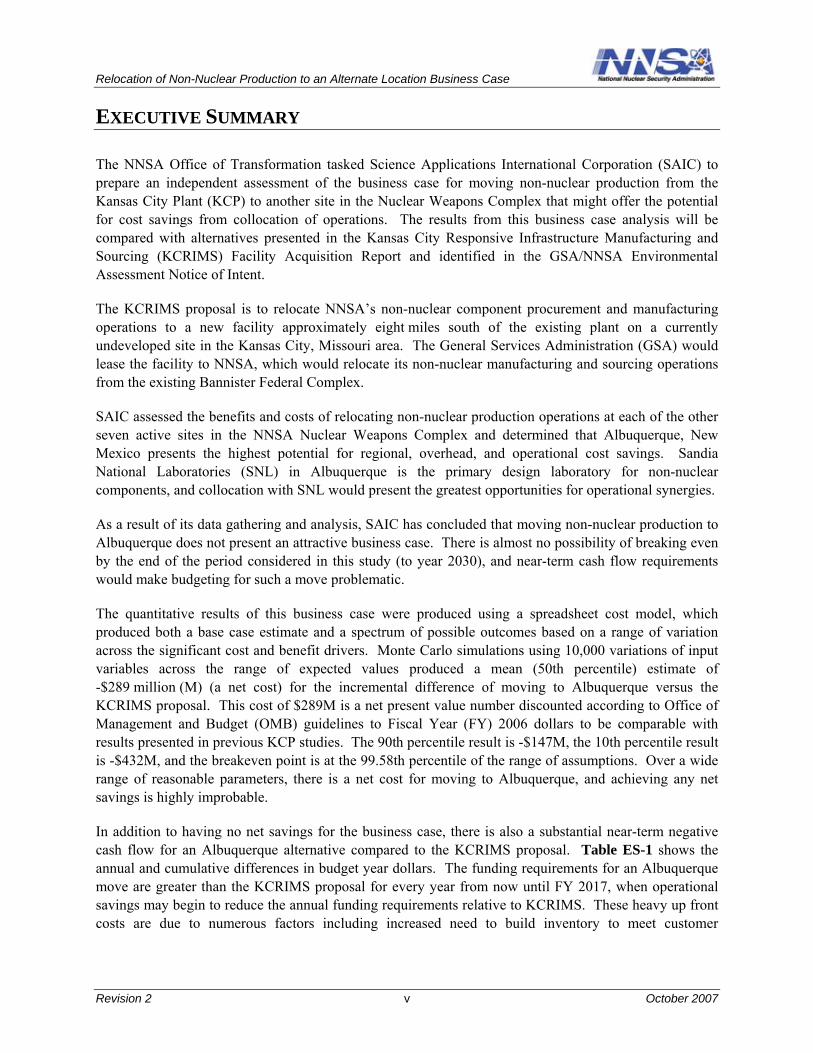
The NNSA Office of Transformation tasked Science Applications International Corporation (SAIC) to prepare an independent assessment of the business case for moving non-nuclear production from the Kansas City Plant (KCP) to another site in the Nuclear Weapons Complex that might offer the potential for cost savings from collocation of operations. The results from this business case analysis will be compared with alternatives presented in the Kansas City Responsive Infrastructure Manufacturing and Sourcing (KCRIMS) Facility Acquisition Report and identified in the GSA/NNSA Environmental Assessment Notice of Intent.
The KCRIMS proposal is to relocate NNSA’s non-nuclear component procurement and manufacturing operations to a new facility approximately eight miles south of the existing plant on a currently undeveloped site in the Kansas City, Missouri area. The General Services Administration (GSA) would lease the facility to NNSA, which would relocate its non-nuclear manufacturing and sourcing operations from the existing Bannister Federal Complex.
SAIC assessed the benefits and costs of relocating non-nuclear production operations at each of the other seven active sites in the NNSA Nuclear Weapons Complex and determined that Albuquerque, New Mexico presents the highest potential for regional, overhead, and operational cost savings. Sandia National Laboratories (SNL) in Albuquerque is the primary design laboratory for non-nuclear components, and collocation with SNL would present the greatest opportunities for operational synergies.
As a result of its data gathering and analysis, SAIC has concluded that moving non-nuclear production to Albuquerque does not present an attractive business case. There is almost no possibility of breaking even by the end of the period considered in this study (to year 2030), and near-term cash flow requirements would make budgeting for such a move problematic.
The quantitative results of this business case were produced using a spreadsheet cost model, which produced both a base case estimate and a spectrum of possible outcomes based on a range of variation across the significant cost and benefit drivers. Monte Carlo simulations using 10,000 variations of input variables across the range of expected values produced a mean (50th percentile) estimate of -$289 million (M) (a net cost) for the incremental difference of moving to Albuquerque versus the KCRIMS proposal. This cost of $289M is a net present value number discounted according to Office of Management and Budget (OMB) guidelines to Fiscal Year (FY) 2006 dollars to be comparable with results presented in previous KCP studies. The 90th percentile result is -$147M, the 10th percentile result is -$432M, and the breakeven point is at the 99.58th percentile of the range of assumptions. Over a wide range of reasonable parameters, there is a net cost for moving to Albuquerque, and achieving any net savings is highly improbable.
In addition to having no net savings for the business case, there is also a substantial near-term negative cash flow for an Albuquerque alternative compared to the KCRIMS proposal. Table ES-1 shows the annual and cumulative differences in budget year dollars. The funding requirements for an Albuquerque move are greater than the KCRIMS proposal for every year from now until FY 2017, when operational savings may begin to reduce the annual funding requirements relative to KCRIMS. These heavy up front costs are due to numerous factors including increased need to build inventory to meet customer
Revision 2 v October 2007
F
Relocation of Non-Nuclear Production to an Alternate Location Business Case
requirements during the longer move and restart period, hiring and training costs for new personnel, and extended operation and maintenance at the legacy facility.
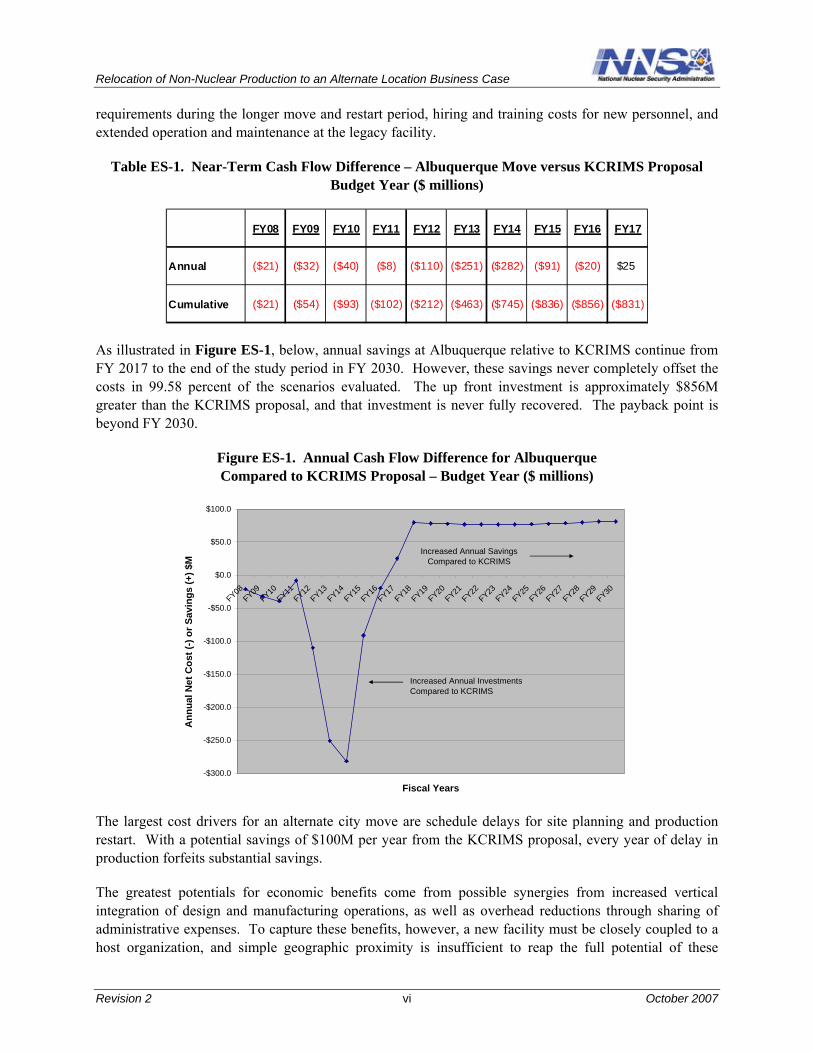
Table ES-1. Near-Term Cash Flow Difference – Albuquerque Move versus KCRIMS Proposal Budget Year ($ millions)
FY08 FY09 FY10 FY11 FY12 FY13 FY14 FY15 FY16 FY17
Annual ($21) ($32) ($40) ($8) ($110) ($251) ($282) ($91) ($20) $25
Cumulative ($21) ($54) ($93) ($102) ($212) ($463) ($745) ($836) ($856) ($831)
As illustrated in Figure ES-1, below, annual savings at Albuquerque relative to KCRIMS continue from FY 2017 to the end of the study period in FY 2030. However, these savings never completely offset the costs in 99.58 percent of the scenarios evaluated. The up front investment is approximately $856M greater than the KCRIMS proposal, and that investment is never fully recovered. The payback point is beyond FY 2030.
Figure ES-1. Annual Cash Flow Difference for Albuquerque Compared to KCRIMS Proposal – Budget Year ($ millions)
$100.0
$50.0
$0.0
-$50.0
-$100.0
-$150.0
-$200.0
-$250.0
-$300.0
Y0 Y0 Y1 1 1 1 1 1 Y1 Y1 Y1 Y Y2 Y2 Y28 9 0 1 2 3 4 5 6 7 8 9 0 1 4 5 6 7 8 9 01 2 2 22 23 2 2 2 3F F FY FY FY FY FY F F F FY FY FY FY F F F F FY FY FY FY
Increased Annual Investments Compared to KCRIMS
Increased Annual Savings Compared to KCRIMS
Fiscal Years
The largest cost drivers for an alternate city move are schedule delays for site planning and production restart. With a potential savings of $100M per year from the KCRIMS proposal, every year of delay in production forfeits substantial savings.
The greatest potentials for economic benefits come from possible synergies from increased vertical integration of design and manufacturing operations, as well as overhead reductions through sharing of administrative expenses. To capture these benefits, however, a new facility must be closely coupled to a host organization, and simple geographic proximity is insufficient to reap the full potential of these
Ann
ual N
et C
ost (
-) or
Sav
ings
(+) $
M
Revision 2 vi October 2007
Relocation of Non-Nuclear Production to an Alternate Location Business Case
savings. Complete collocation would require facility acquisition scenarios not easily envisioned, where planning lead-times for a line-item construction project or commercial construction on government property would further extend overall schedule delays. The longer it takes to complete planning, construction, move and production restart, the more costly is a move to Albuquerque. When the additional risks and complexities of an alternate city move are factored into this business case, it leaves a distant location move with too many potential costs that are not offset by regional economic and collocation savings.
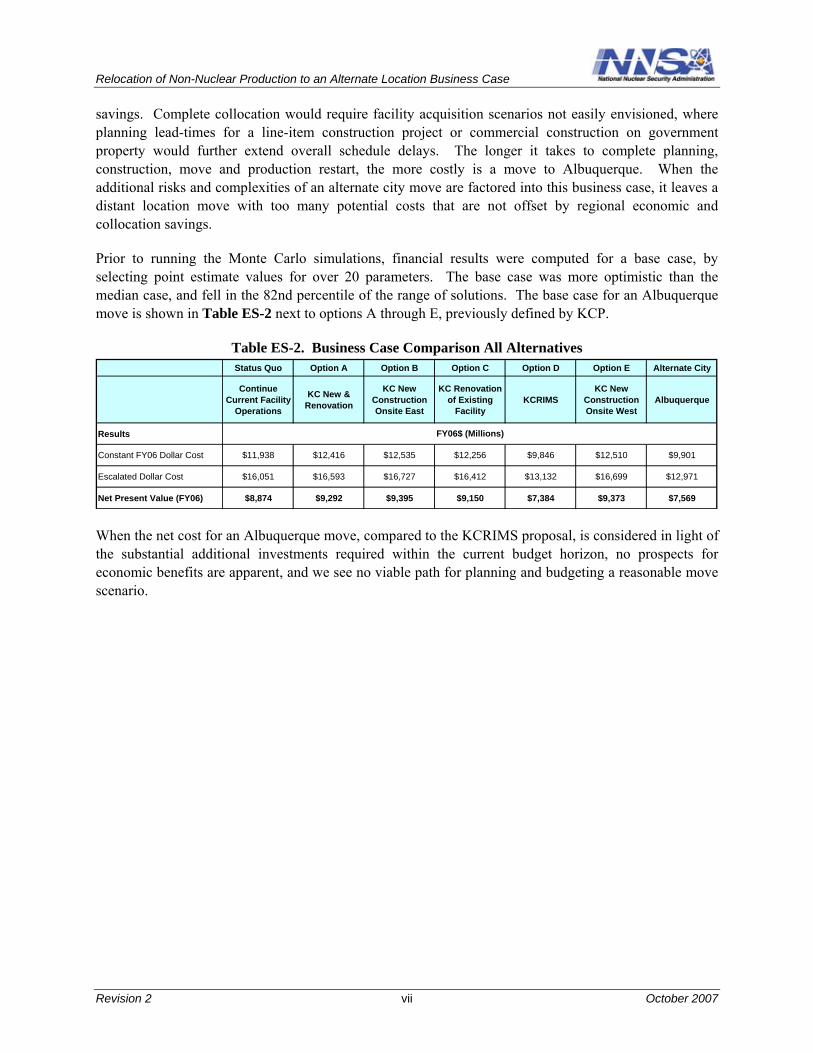
Prior to running the Monte Carlo simulations, financial results were computed for a base case, by selecting point estimate values for over 20 parameters. The base case was more optimistic than the median case, and fell in the 82nd percentile of the range of solutions. The base case for an Albuquerque move is shown in Table ES-2 next to options A through E, previously defined by KCP.
Table ES-2. Business Case Comparison All Alternatives Status Quo Option A Option B Option C Option D Option E Alternate City
Continue Current Facility
Operations
KC New & Renovation
KC New Construction Onsite East
KC Renovation of Existing
Facility KCRIMS
KC New Construction Onsite West
Albuquerque
Results FY06$ (Millions)
Constant FY06 Dollar Cost $11,938 $12,416 $12,535 $12,256 $9,846 $12,510 $9,901
Escalated Dollar Cost $16,051 $16,593 $16,727 $16,412 $13,132 $16,699 $12,971
Net Present Value (FY06) $8,874 $9,292 $9,395 $9,150 $7,384 $9,373 $7,569
When the net cost for an Albuquerque move, compared to the KCRIMS proposal, is considered in light of the substantial additional investments required within the current budget horizon, no prospects for economic benefits are apparent, and we see no viable path for planning and budgeting a reasonable move scenario.
Revision 2 vii October 2007

Relocation of Non-Nuclear Production to an Alternate Location Business Case
This page intentionally blank.
Revision 2 viii October 2007
Relocation of Non-Nuclear Production to an Alternate Location Business Case
1.0 INTRODUCTION
The NNSA Office of Transformation tasked Science Applications International Corporation (SAIC) to prepare an independent assessment of the business case for moving non-nuclear production from the Kansas City Plant (KCP) to another site in the Nuclear Weapons Complex that might offer the potential for cost savings from collocation of operations. The results from this business case analysis will be compared with alternatives presented in the Kansas City Responsive Infrastructure Manufacturing and Sourcing (KCRIMS) Facility Acquisition Report1 and identified in the General Services Administration (GSA)/National Nuclear Security Administration (NNSA) Environmental Assessment Notice of Intent.2
The Notice of Intent states that GSA and NNSA believe that the relocation of the non-nuclear production mission to another location outside of the Kansas City metropolitan area is not a reasonable alternative and do not intend to analyze it as an alternative in the present Environmental Assessment (EA). To ensure that the record is complete, NNSA tasked SAIC to assess a business case for the relocation alternative and compare it to the other alternatives.
The six alternatives identified in the Notice of Intent are listed below (letters in parentheses indicate the numbering in the Facility Acquisition Report).
• Renovate the existing GSA office space, demolish existing GSA warehouse space, and construct and operate a new manufacturing facility on the GSA portion of the Bannister Federal Complex. (A)
• Construct a new office and manufacturing facility on the eastern portion of the Bannister Federal Complex. (B)
• Renovate the existing GSA office and warehouse space at the Bannister Federal Complex, relocate NNSA’s non-nuclear operations to the renovated facilities, and conduct future operations in the renovated facilities. (C)
• The proposed action, for GSA to procure the construction of new facilities to house NNSA’s nonnuclear component procurement and manufacturing operations in the Kansas City area. (D)
• Demolish existing GSA office and warehouse space, construct and operate new office and manufacturing facilities on GSA’s portion of the Bannister Federal Complex. (E)
• No Action, i.e., continuing NNSA’s non-nuclear operations in the existing Bannister Federal Complex facilities.
1.1 Study Objective
The objective of this study is to provide an independent and objective business case assessment of moving non-nuclear production from Kansas City to another city and compare it to the business cases of other alternatives considered in the Facility Acquisition Report.
1 Facility Acquisition Report Kansas City, MO Non-Nuclear Production, December 20, 2006, National Nuclear Security Administration (NNSA) and General Services Administration.(GSA).
2 Notice of Intent to Prepare an Environmental Assessment for the Transformation of the Facilities and Infrastructure for the Non-nuclear Production Activities Conducted at the NNSA’s Kansas City Plant at Kansas City, Missouri, May 1, 2007, Federal Register. Vol. 72, No. 83.
Revision 2 1 October 2007
Relocation of Non-Nuclear Production to an Alternate Location Business Case
1.2 Approach
The SAIC team (the team) took the following steps to complete the business case assessment:
• Conduct extensive data gathering through document reviews, interviews and literature searches.
• Consider all Nuclear Weapons Complex sites and converge to the most favorable location.
• Build an accurate and reliable business case cost model around a series of input parameters tied to the significant cost and benefit drivers.
• Exercise the model through a range of reasonable values for the important input parameters to establish a range of likely outcomes, explore sensitivities, and identify the parameters that most influence the outcome.
• Address additional risks that may not have been explicitly quantified in the model and consider the qualitative impact of these risks on the overall conclusions.
1.2.1 Location Selection
The team assessed the economic benefits of relocating to each of the other seven locations in the Nuclear Weapons Complex. This assessment is described in Section 3. These locations were screened for potential economic advantages as well as for relative desirability for employee relocation. The team concluded from this assessment that Albuquerque, New Mexico was the most favorable site primarily due to benefits from collocation with Sandia National Laboratories (SNL), the designer for non-nuclear components.
1.2.2 Business Case Cost Model
The team identified the spectrum of potential economic benefits involving regional construction cost and wage rates, overhead sharing, and possible design to manufacturing synergies that could result in operational savings, described in Section 4. Similarly the team identified the major cost drivers associated with relocation and production startup, described in Section 5. The team constructed a cost model whose quantitative results and assumptions are described in Section 6. Sensitivity analysis of the primary benefit and cost drivers is discussed along with a general discussion of other sensitivities in Section 7. Risks to the success of a relocation alternative were identified and are discussed in Section 8. While this study did not conduct a quantitative risk assessment of the preferred city relocation scenario, qualitative consideration of risks did inform the selection of the range of variables used in the cost model.
Revision 2 2 October 2007
Relocation of Non-Nuclear Production to an Alternate Location Business Case
2.0 RELOCATION SCENARIO
The team assessed a scenario for moving non-nuclear production from Kansas City to an alternate location that assumes the same basic plan as what is proposed for KCRIMS, while also considering factors that address the potentially significant benefits of vertical integration with the design agency.
2.1 Facility Construction and Occupation
In the KCRIMS proposal, the facility will be leased from GSA following GSA’s preparation of a request for quotations (RFQ) and facility construction; thus, the same scenario is assumed for the relocation to the alternate location. The KCRIMS proposal assumes that the facility will be ready for move-in three years from release of a GSA RFQ, and the release of the RFQ is assumed to be early fiscal year (FY) 2008. To accommodate the move to an alternate location, the team assumed a delay of between 1.5 and 3 years in releasing the GSA RFQ for the alternate location, but that once released, the three year construction period holds.
2.2 Production Resumption
The KCRIMS proposal assumes that production lines will continue to operate until each is dismantled sequentially and moved to the new facility. The total move time will be about two years, but no line will be inoperable for more than six months, and the facility will be back to full production within six months of the last production line transfer. The relocation scenario assumes the same approach: production lines continue to operate until sequential dismantlement and transport for installation at an alternate location. However, because most of the product will not require re-qualification in KCRIMS, but will in any other location, each production line downtime will stretch from 6 months to approximately two years to accommodate personnel training and more comprehensive process re-qualification not required for KCRIMS. Thus the alternate location facility will not be back into full production until two years following the last production line transfer.
Parts and components will be built ahead to supply customer requirements during production suspension - six months worth for the KCRIMS proposal and 24 months worth for the relocation scenario. The build-ahead inventory will be worked off in both cases, so there is no net cost impact for materials; however the up front labor cash flow will not be recouped, so the cash flow requirements are accordingly higher for the relocation scenario.
2.3 Personnel
The KCRIMS proposal assumes that the labor force will essentially transfer, without disruption, to the new facility in Kansas City. The relocation scenario acknowledges that some of the labor force will not relocate to an alternate location; those that do will require relocation reimbursements and those that remain may require a retention incentive to improve prospects for build-ahead parts and continued operation of the production lines up to dismantlement. The relocation scenario also plans for hiring, clearances, training, and qualification activities for the replacement labor force in an alternate location. To model this, the team assumed that one year’s average salary for both salaried and hourly employees would be required for each new hire at any distant location.
Revision 2 3 October 2007

Relocation of Non-Nuclear Production to an Alternate Location Business Case
This page intentionally blank.
Revision 2 4 October 2007
LANL
SNL
KCPNTS
PXSRS
LLNL
Y-12LANL
SNL
KCPNTS
PXSRS
LLNL
Y-12LANL
SNL
KCPNTS
PXSRS
LLNL
Y-12
Relocation of Non-Nuclear Production to an Alternate Location Business Case
3.0 ALTERNATIVE CITY SELECTION
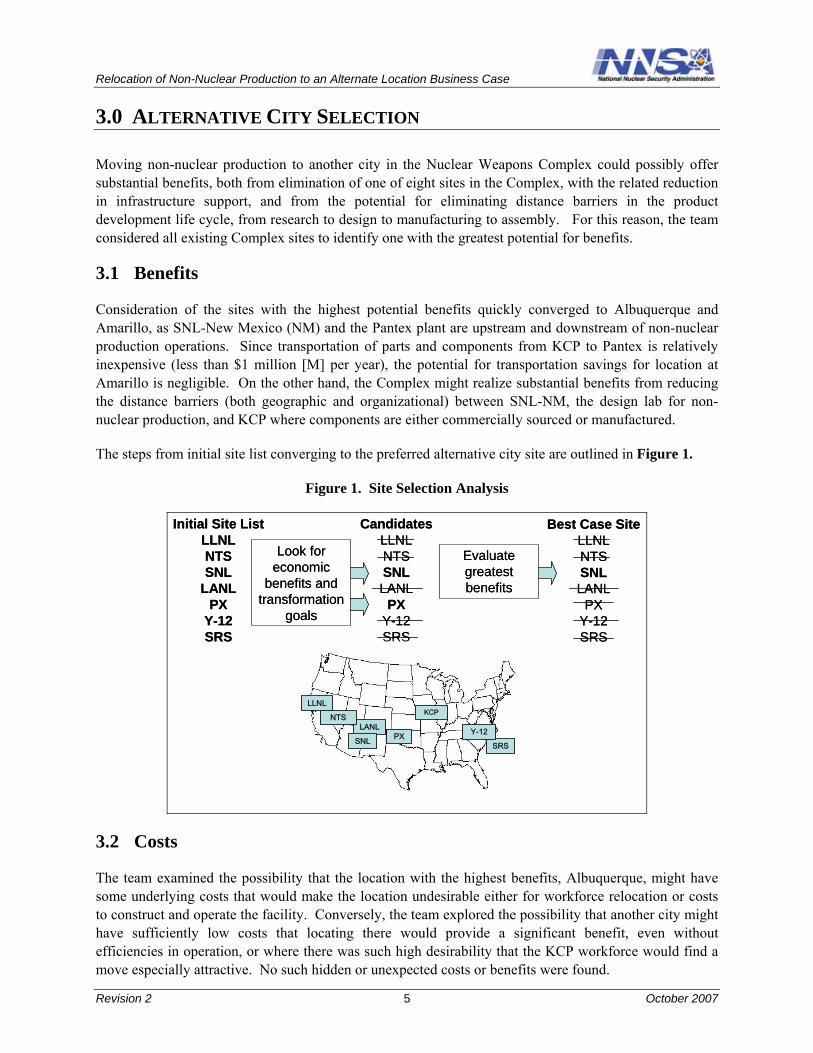
Moving non-nuclear production to another city in the Nuclear Weapons Complex could possibly offer substantial benefits, both from elimination of one of eight sites in the Complex, with the related reduction in infrastructure support, and from the potential for eliminating distance barriers in the product development life cycle, from research to design to manufacturing to assembly. For this reason, the team considered all existing Complex sites to identify one with the greatest potential for benefits.
3.1 Benefits
Consideration of the sites with the highest potential benefits quickly converged to Albuquerque and Amarillo, as SNL-New Mexico (NM) and the Pantex plant are upstream and downstream of non-nuclear production operations. Since transportation of parts and components from KCP to Pantex is relatively inexpensive (less than $1 million [M] per year), the potential for transportation savings for location at Amarillo is negligible. On the other hand, the Complex might realize substantial benefits from reducing the distance barriers (both geographic and organizational) between SNL-NM, the design lab for nonnuclear production, and KCP where components are either commercially sourced or manufactured.
The steps from initial site list converging to the preferred alternative city site are outlined in Figure 1.
Figure 1. Site Selection Analysis
Initial Site List LLNL NTS SNL
LANL PX
Y-12 SRS
Candidates LLNL NTS SNL LANL
PX Y-12 SRS
Best Case Site LLNL NTS SNL LANL
PX Y-12 SRS
Look for economic
benefits and transformation
goals
Evaluate greatest benefits
LANL
SNL
KCPNTS
PX SRS
LLNL
Y-12
Initial Site ListLLNLNTSSNL
LANLPX
Y-12SRS
CandidatesLLNLNTSSNLLANL
PXY-12SRS
Best Case SiteLLNLNTSSNLLANL
PXY-12SRS
Look for economic
benefits and transformation
goals
Evaluate greatest benefits
3.2 Costs
The team examined the possibility that the location with the highest benefits, Albuquerque, might have some underlying costs that would make the location undesirable either for workforce relocation or costs to construct and operate the facility. Conversely, the team explored the possibility that another city might have sufficiently low costs that locating there would provide a significant benefit, even without efficiencies in operation, or where there was such high desirability that the KCP workforce would find a move especially attractive. No such hidden or unexpected costs or benefits were found.
Revision 2 5 October 2007

Relocation of Non-Nuclear Production to an Alternate Location Business Case
The team evaluated each city for both the potential regional economic benefits and the relative desirability of each city as a place to live. The percentage of KCP staff that would relocate has a direct relationship on relocation costs and an indirect impact on the time required to reestablish production at the alternate location. Figure 2 shows the relative desirability of each city in the Complex in relation to Kansas City, which has been normalized to 100. This evaluation is based on a number of different factors, such as housing cost, job market, school district quality, weather, and crime rate.
Figure 2. City Desirability Comparisons
Source: Places Rated Almanac, 7th Edition, David Savageau, Places Rated Books, LLC, 2007
The team looked at the local economic conditions for wages and salaries for equivalent positions, shown in Table 1.
Revision 2 6 October 2007
Relocation of Non-Nuclear Production to an Alternate Location Business Case
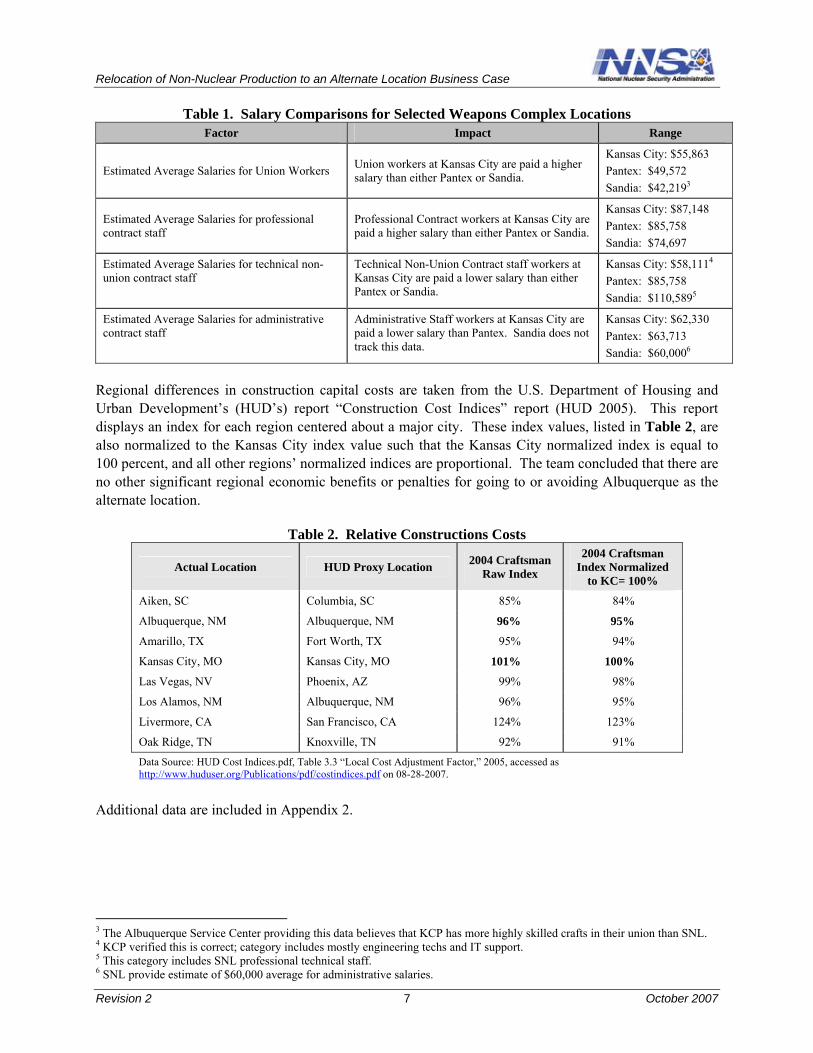
Table 1. Salary Comparisons for Selected Weapons Complex Locations Factor Impact Range
Estimated Average Salaries for Union Workers Union workers at Kansas City are paid a higher salary than either Pantex or Sandia.
Kansas City: $55,863 Pantex: $49,572 Sandia: $42,2193
Estimated Average Salaries for professional contract staff
Professional Contract workers at Kansas City are paid a higher salary than either Pantex or Sandia.
Kansas City: $87,148 Pantex: $85,758 Sandia: $74,697
Estimated Average Salaries for technical nonunion contract staff
Technical Non-Union Contract staff workers at Kansas City are paid a lower salary than either Pantex or Sandia.
Kansas City: $58,1114
Pantex: $85,758 Sandia: $110,5895
Estimated Average Salaries for administrative contract staff
Administrative Staff workers at Kansas City are paid a lower salary than Pantex. Sandia does not track this data.
Kansas City: $62,330 Pantex: $63,713 Sandia: $60,0006
Regional differences in construction capital costs are taken from the U.S. Department of Housing and Urban Development’s (HUD’s) report “Construction Cost Indices” report (HUD 2005). This report displays an index for each region centered about a major city. These index values, listed in Table 2, are also normalized to the Kansas City index value such that the Kansas City normalized index is equal to 100 percent, and all other regions’ normalized indices are proportional. The team concluded that there are no other significant regional economic benefits or penalties for going to or avoiding Albuquerque as the alternate location.
Table 2. Relative Constructions Costs
Actual Location HUD Proxy Location 2004 Craftsman Raw Index
2004 Craftsman Index Normalized
to KC= 100%
Aiken, SC Columbia, SC 85% 84%
Albuquerque, NM Albuquerque, NM 96% 95%
Amarillo, TX Fort Worth, TX 95% 94%
Kansas City, MO Kansas City, MO 101% 100%
Las Vegas, NV Phoenix, AZ 99% 98%
Los Alamos, NM Albuquerque, NM 96% 95%
Livermore, CA San Francisco, CA 124% 123%
Oak Ridge, TN Knoxville, TN 92% 91%
Data Source: HUD Cost Indices.pdf, Table 3.3 “Local Cost Adjustment Factor,” 2005, accessed as http://www.huduser.org/Publications/pdf/costindices.pdf on 08-28-2007.
Additional data are included in Appendix 2.
3 The Albuquerque Service Center providing this data believes that KCP has more highly skilled crafts in their union than SNL. 4 KCP verified this is correct; category includes mostly engineering techs and IT support. 5 This category includes SNL professional technical staff.6 SNL provide estimate of $60,000 average for administrative salaries.
Revision 2 7 October 2007
Relocation of Non-Nuclear Production to an Alternate Location Business Case
This page intentionally blank.
Revision 2 8 October 2007
Reduced Facility Construction
& MaintenanceCosts
Same CityLocation
ReducedLabor Cost
for New Hires
CoordinatedManagement
Priorities, Incentivesand Processes
One Managementin One Location
SharedInfrastructure
Regional EconomicBenefits
Co-locationSynergiesin Design to
Manufacturing
Infrastructure Sharing and OverheadReductions
IntegrationIntegrationCompleteComplete
Collaboration VerticalCollaboration VerticalSame City Incentives IntegrationSame City Incentives IntegrationBenefitsBenefits
Reduced Facility Construction
& Maintenance Costs
Reduced Labor Cost
for New Hires
Common labor pool couldCommon labor pool could substantially reduce newsubstantially reduce new
hiring costs and associatedhiring costs and associatedproduction delays.production delays.
Being in nuclear area mayBeing in nuclear area maydiminish benefits fromdiminish benefits from
commercialization model andcommercialization model and site office oversight model.site office oversight model.
Regional Economic Benefits
Co-location Synergies in Design to
Manufacturing
Same CitLocation
Coordinated Managemen
Priorities, Incentives and Processes
One Managementin One Location
Infrastructure Sharing and Overhead Reductions
Teaming may captureTeaming may capture Likely none. some benefits fromLikely none. some benefits from
two companies intwo companies in collaboration.collaboration.
Shared Infrastructure
Relocation of Non-Nuclear Production to an Alternate Location Business Case
4.0 QUANTIFYING BENEFITS
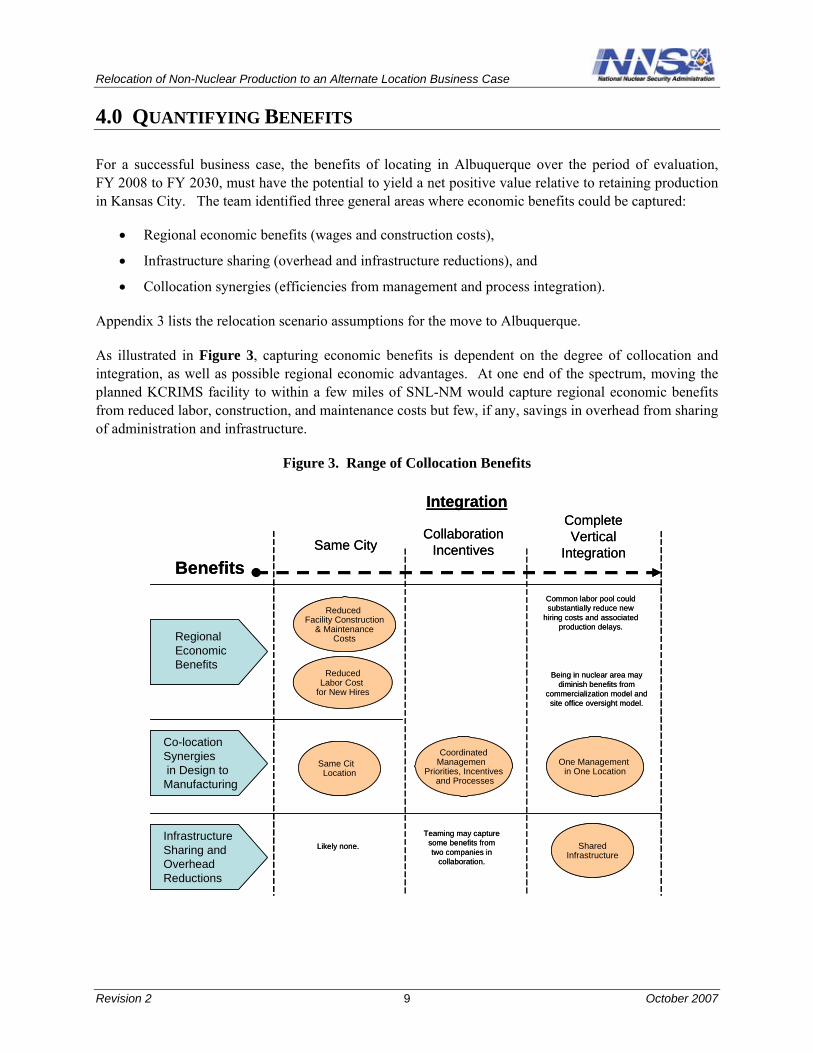
For a successful business case, the benefits of locating in Albuquerque over the period of evaluation, FY 2008 to FY 2030, must have the potential to yield a net positive value relative to retaining production in Kansas City. The team identified three general areas where economic benefits could be captured:
• Regional economic benefits (wages and construction costs),
• Infrastructure sharing (overhead and infrastructure reductions), and
• Collocation synergies (efficiencies from management and process integration).
Appendix 3 lists the relocation scenario assumptions for the move to Albuquerque.
As illustrated in Figure 3, capturing economic benefits is dependent on the degree of collocation and integration, as well as possible regional economic advantages. At one end of the spectrum, moving the planned KCRIMS facility to within a few miles of SNL-NM would capture regional economic benefits from reduced labor, construction, and maintenance costs but few, if any, savings in overhead from sharing of administration and infrastructure.
Figure 3. Range of Collocation Benefits
Revision 2 9 October 2007
Relocation of Non-Nuclear Production to an Alternate Location Business Case
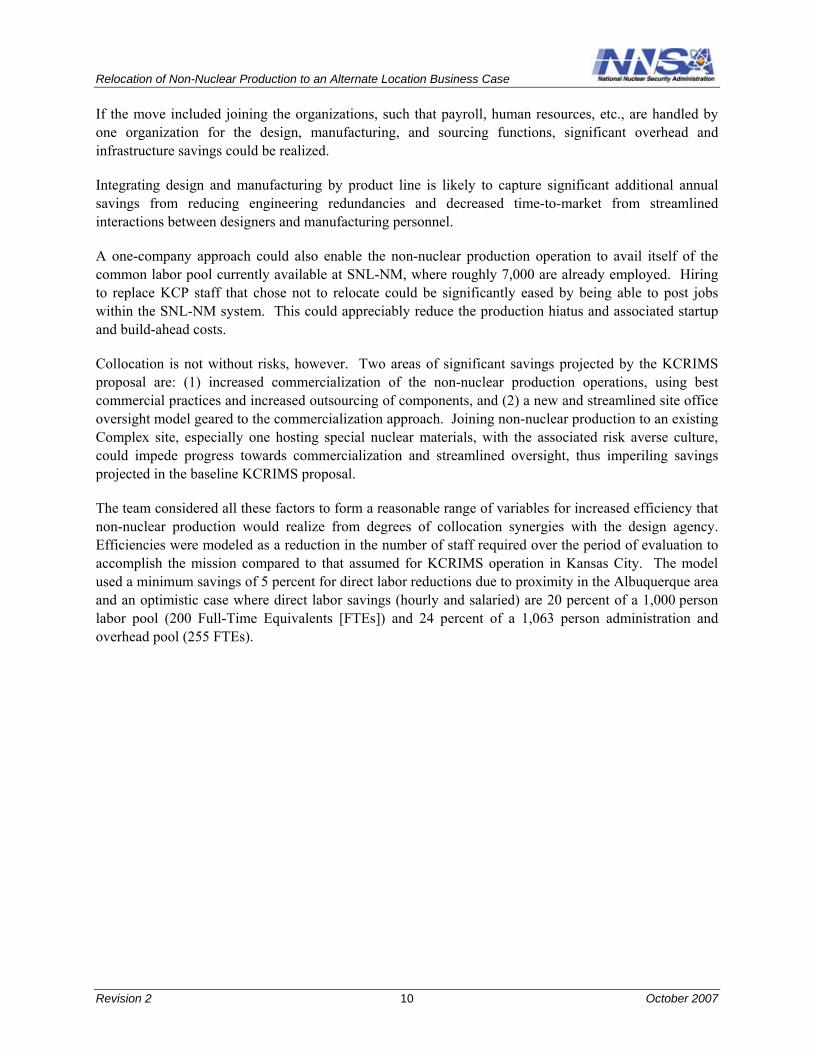
If the move included joining the organizations, such that payroll, human resources, etc., are handled by one organization for the design, manufacturing, and sourcing functions, significant overhead and infrastructure savings could be realized.
Integrating design and manufacturing by product line is likely to capture significant additional annual savings from reducing engineering redundancies and decreased time-to-market from streamlined interactions between designers and manufacturing personnel.
A one-company approach could also enable the non-nuclear production operation to avail itself of the common labor pool currently available at SNL-NM, where roughly 7,000 are already employed. Hiring to replace KCP staff that chose not to relocate could be significantly eased by being able to post jobs within the SNL-NM system. This could appreciably reduce the production hiatus and associated startup and build-ahead costs.
Collocation is not without risks, however. Two areas of significant savings projected by the KCRIMS proposal are: (1) increased commercialization of the non-nuclear production operations, using best commercial practices and increased outsourcing of components, and (2) a new and streamlined site office oversight model geared to the commercialization approach. Joining non-nuclear production to an existing Complex site, especially one hosting special nuclear materials, with the associated risk averse culture, could impede progress towards commercialization and streamlined oversight, thus imperiling savings projected in the baseline KCRIMS proposal.
The team considered all these factors to form a reasonable range of variables for increased efficiency that non-nuclear production would realize from degrees of collocation synergies with the design agency. Efficiencies were modeled as a reduction in the number of staff required over the period of evaluation to accomplish the mission compared to that assumed for KCRIMS operation in Kansas City. The model used a minimum savings of 5 percent for direct labor reductions due to proximity in the Albuquerque area and an optimistic case where direct labor savings (hourly and salaried) are 20 percent of a 1,000 person labor pool (200 Full-Time Equivalents [FTEs]) and 24 percent of a 1,063 person administration and overhead pool (255 FTEs).
Revision 2 10 October 2007

Relocation %
Pre-moveAttrition %
Staff Loss
Hiring, Training& Clearance
Costs
ProductionHiatus (Months)
Build-AheadCash-flow & COM
Hiring, Training& Clearance
Delays
InventoryBuild-AheadQuantities
KnowledgeLoss
New Hires vs. Internal Postings
QuantitativeAssumptions Impacts
ProductionStartupCosts
Costs
PlanningLead-time for Distant CityFacility RFQ
Loss of Near TermKCRIMS Savings
Relocation of Non-Nuclear Production to an Alternate Location Business Case
5.0 QUANTIFYING COSTS
The team approached the cost quantification by dividing costs into nonrecurring and recurring costs. Nonrecurring costs are the investment costs required to relocate non-nuclear production from Kansas City to Albuquerque. Recurring costs are the lease, overhead, taxes and operating costs incurred for ongoing production.
5.1 Nonrecurring Costs
Nonrecurring costs include those incurred during the transition phase and the move phase. The transition phase is the period between a decision and completion of construction. The move phase is the period from construction completion to start of full, qualified, production. This involves moving production equipment to Albuquerque, the initial staffing of the Albuquerque operation, either by transferring staff from Kansas City or by new hires, and the time needed to reestablish production in Albuquerque. Figure 4 shows the relationships between assumptions, impacts and costs, along with areas where investments could provide a mitigating influence. However costs can be estimated using standard industry factors, have a relatively low range of uncertainty, and changes do not materially affect the business case results.
Figure 4. Nonrecurring Cost Relationships LegendLegend
Mitigating Investments
Relocation Incentives
Retention Incentives
Knowledge Preservation
Could Reduce
Could Reduce
Production Restart Costs
Could Reduce
Investments
-
Relocation %
Pre-move Attrition %
MitigatingInvestments
RelocationIncentives
RetentionIncentives
Staff Loss
Hiring, Training& Clearance
Costs
Production Hiatus (Months)
Build-Ahead Cash-flow & COM
Hiring, Training& Clearance
Delays
Inventory Build-Ahead Quantities
Knowledge Loss
New Hires vs. Internal Postings
Quantitative Assumptions Impacts
Production StartuCosts
Costs
Planning Lead-time for Distant City Facility RFQ
Loss of Near Term KCRIMS Savings
KnowledgePreservation
Could Reduce
CouldReduce
Production Restart Costs
CouldReduce
Investments
-
Revision 2 11 October 2007
Relocation of Non-Nuclear Production to an Alternate Location Business Case
5.1.1 Moving Costs
Moving 800 miles to Albuquerque from the current KCP location costs more than moving eight miles to the proposed Kansas City, Missouri location. Besides the additional mileage, there are other variables to consider such as additional packaging, drivers and riggers, and insurance. However, the difference in moving costs can be estimated using standard industry factors, they have a relatively low range of estimating uncertainty, and the numbers do not materially affect the business case results.
5.1.2 Personnel Costs – Initial Staffing
Personnel costs are assessed from several perspectives. The initial look is at the percentage of KCP workers that are likely to relocate to Albuquerque.
The demographics of the KCP labor force are such that by 2012 over 55 percent will be eligible for retirement. It is doubtful that many of these professionals will relocate; past history within NNSA indicates that 20 percent is the likely upper limit. Accordingly, the team modeled as much as 50 percent of the retirement-eligible staff retiring during the transition phase, and 90 percent retiring during the actual move phase to Albuquerque.
For the non-retirement eligible population, the team assumed that individuals would leave at increased rates and modeled that range as doubling from 4 percent to 8 percent during the transition phase. Separations are also likely from those who are hired in Albuquerque, and the team modeled these at 8 percent during the transition phase dropping to 6 percent during the move phase.
The percentage of staff that willingly relocates, coupled with the attrition of retirement-eligible and voluntary separations, drives the need for new hires, with associated costs and delays for security clearances and training. The extent of hiring and training to rebuild the workforce is a significant factor in the production hiatus, the time from when a product line closes at Kansas City to startup and qualification at a new site.
5.1.3 Delay costs
The KCRIMS proposal projects potential savings of approximately $100M per year commencing upon resumption of qualified production at a new local facility. The scenario for moving to Albuquerque includes two distinct delays that affect the time when those savings will start: (a) delay in the initial planning for GSA to obtain an option to purchase appropriate land and the release of a RFQ to developers, and (b) delay in the planned production hiatus of 6 months to 24 months, to complete the distant location move; to recruit, hire, clear, and train the workforce; and to commence production making qualified parts.
The cost model broke the implementation timelines into three parts: planning and contracting; construction phase; and move to qualified production. Using the proposed KCRIMS timeline as the basis of comparison, the total timeline planned from now to qualified production at KCRIMS is approximately five years. For the alternate city option, the nominal scenario has a two year delay before Albuquerque GSA could release an RFQ and approximately two years from move to qualified production. The KCRIMS timeline includes six months for parts qualification, so the nominal timeline for an Albuquerque move is five years plus three and a half, or approximately eight and a half years total. When running Monte Carlo simulations in the cost model, the team varied this timeline from six and a half years through twelve years with a base case value of eight years. This range includes optimistic and pessimistic
Revision 2 12 October 2007
GSA RFQ to Construction Complete
KCRIMS Proposal
KCP Move / Occupancy Complete
GSA RFQ to Construction Complete
Alternate City Scenario
KCP Move / Occupancy Complete
Normal Production
Delay for Albuquerque GSA to release RFQ
~1 to 2.5 years
Nominal Estimate of Planning and Production
Delays ~ 3.5 years
Add l Delay for New Production Start~ 9 to 18 Months
Normal Production
Relocation of Non-Nuclear Production to an Alternate Location Business Case
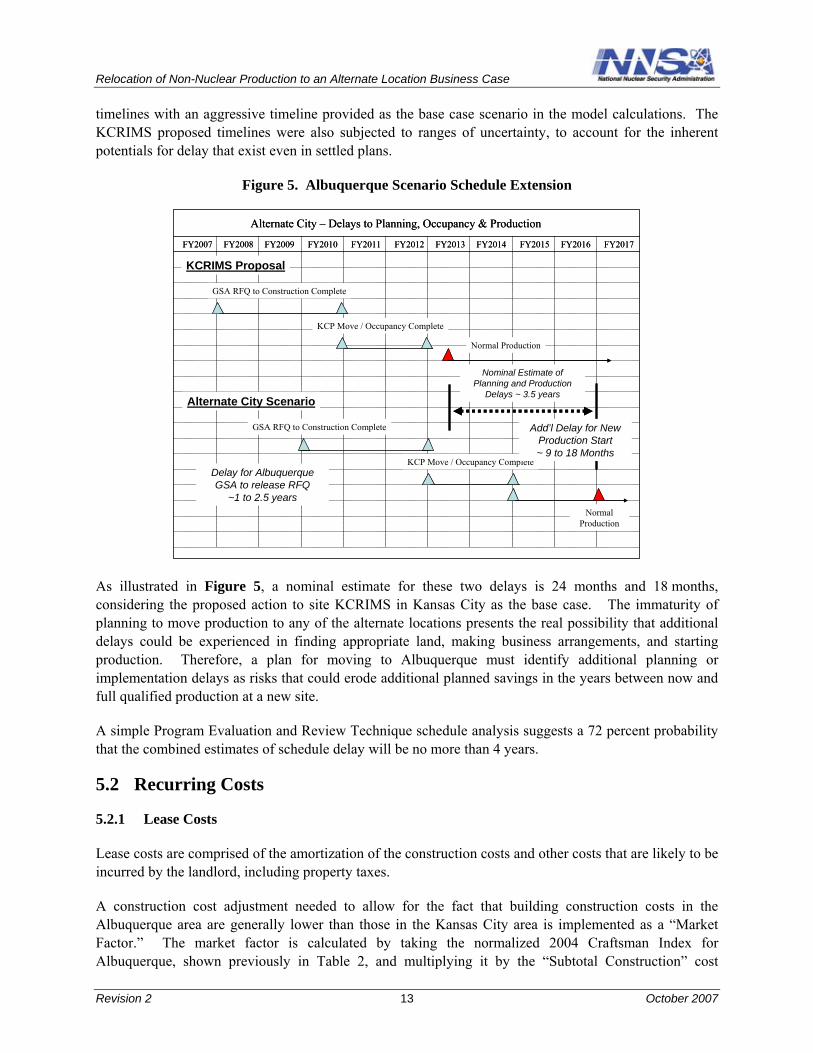
timelines with an aggressive timeline provided as the base case scenario in the model calculations. The KCRIMS proposed timelines were also subjected to ranges of uncertainty, to account for the inherent potentials for delay that exist even in settled plans.
Figure 5. Albuquerque Scenario Schedule Extension
FY2007 FY2008 FY2009 FY2010 FY2011 FY2012 FY2013 FY2014 FY2015 FY2016 FY2017
Alternate City – Delays to Planning, Occupancy & Production
’
FY2007 FY2008 FY2009 FY2010 FY2011 FY2012 FY2013 FY2014 FY2015 FY2016 FY2017
GSA RFQ to Construction Complete
KCRIMS Proposal
KCP Move / Occupancy Complete
GSA RFQ to Construction Complete
Alternate City Scenario
KCP Move / Occupancy Complete
Normal Production
Delay for Albuquerque GSA to release RFQ
~1 to 2.5 years
Nominal Estimate of Planning and Production
Delays ~ 3.5 years
Add l Delay for New Production Start ~ 9 to 18 Months
Normal Production
Alternate City – Delays to Planning, Occupancy & Production
’
As illustrated in Figure 5, a nominal estimate for these two delays is 24 months and 18 months, considering the proposed action to site KCRIMS in Kansas City as the base case. The immaturity of planning to move production to any of the alternate locations presents the real possibility that additional delays could be experienced in finding appropriate land, making business arrangements, and starting production. Therefore, a plan for moving to Albuquerque must identify additional planning or implementation delays as risks that could erode additional planned savings in the years between now and full qualified production at a new site.
A simple Program Evaluation and Review Technique schedule analysis suggests a 72 percent probability that the combined estimates of schedule delay will be no more than 4 years.
5.2 Recurring Costs
5.2.1 Lease Costs
Lease costs are comprised of the amortization of the construction costs and other costs that are likely to be incurred by the landlord, including property taxes.
A construction cost adjustment needed to allow for the fact that building construction costs in the Albuquerque area are generally lower than those in the Kansas City area is implemented as a “Market Factor.” The market factor is calculated by taking the normalized 2004 Craftsman Index for Albuquerque, shown previously in Table 2, and multiplying it by the “Subtotal Construction” cost
Revision 2 13 October 2007
Relocation of Non-Nuclear Production to an Alternate Location Business Case
estimate for the comparable option in the Facility Acquisition Report. The resulting comparable construction cost is less in Albuquerque than it is in Kansas City, resulting in a lower estimate of lease cost.
Property taxes in Albuquerque are lower than those in Kansas City, Missouri. Overall, the lease cost for an Albuquerque facility might be approximately $900 thousand (K) per year less than for the proposed Kansas City facility.7
5.2.2 Operating Costs
The team assumed the same production levels as for the KCRIMS business case and, disregarding collocation efficiencies for the moment, found that all things being equal (attrition, rehire, training, equipment, etc.), a primary benefits driver was regional salary cost differential. However, the differential between Albuquerque and KCRIMS is only 2.5 percent in favor of Albuquerque, which is insufficient to offset the additional 2-year continuation of Bannister operations and the length of time for personnel training and qualification in Albuquerque. As such, the cost over the span of the study for Albuquerque personnel cost is $5.1 billion (B) while KCRIMS is $5.0B.
7 The Kansas City annual lease cost is $29,591 thousand and the Albuquerque annual lease cost is $28,668 thousand, which is approximately $923 thousand less per year.
Revision 2 14 October 2007
Relocation of Non-Nuclear Production to an Alternate Location Business Case
6.0 QUANTITATIVE RESULTS
6.1 Business Case Model
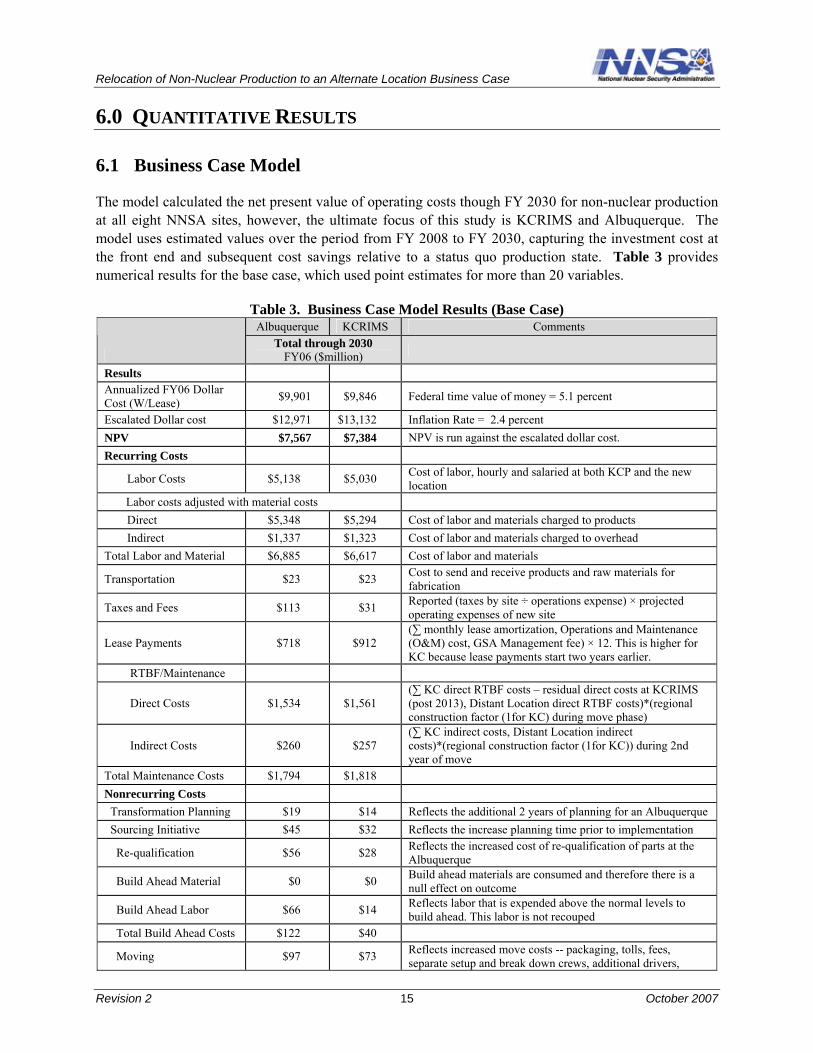
The model calculated the net present value of operating costs though FY 2030 for non-nuclear production at all eight NNSA sites, however, the ultimate focus of this study is KCRIMS and Albuquerque. The model uses estimated values over the period from FY 2008 to FY 2030, capturing the investment cost at the front end and subsequent cost savings relative to a status quo production state. Table 3 provides numerical results for the base case, which used point estimates for more than 20 variables.
Table 3. Business Case Model Results (Base Case) Albuquerque KCRIMS Comments
Total through 2030 FY06 ($million)
Results Annualized FY06 Dollar Cost (W/Lease) $9,901 $9,846 Federal time value of money = 5.1 percent
Escalated Dollar cost $12,971 $13,132 Inflation Rate = 2.4 percent NPV $7,567 $7,384 NPV is run against the escalated dollar cost. Recurring Costs
Labor Costs $5,138 $5,030 Cost of labor, hourly and salaried at both KCP and the new location
Labor costs adjusted with material costs Direct $5,348 $5,294 Cost of labor and materials charged to products Indirect $1,337 $1,323 Cost of labor and materials charged to overhead
Total Labor and Material $6,885 $6,617 Cost of labor and materials
Transportation $23 $23 Cost to send and receive products and raw materials for fabrication
Taxes and Fees $113 $31 Reported (taxes by site ÷ operations expense) × projected operating expenses of new site
Lease Payments $718 $912 (∑ monthly lease amortization, Operations and Maintenance (O&M) cost, GSA Management fee) × 12. This is higher for KC because lease payments start two years earlier.
RTBF/Maintenance
Direct Costs $1,534 $1,561 (∑ KC direct RTBF costs – residual direct costs at KCRIMS (post 2013), Distant Location direct RTBF costs)*(regional construction factor (1for KC) during move phase)
Indirect Costs $260 $257 (∑ KC indirect costs, Distant Location indirect costs)*(regional construction factor (1for KC)) during 2nd year of move
Total Maintenance Costs $1,794 $1,818 Nonrecurring Costs Transformation Planning $19 $14 Reflects the additional 2 years of planning for an Albuquerque Sourcing Initiative $45 $32 Reflects the increase planning time prior to implementation
Re-qualification $56 $28 Reflects the increased cost of re-qualification of parts at the Albuquerque
Build Ahead Material $0 $0 Build ahead materials are consumed and therefore there is a null effect on outcome
Build Ahead Labor $66 $14 Reflects labor that is expended above the normal levels to build ahead. This labor is not recouped
Total Build Ahead Costs $122 $40
Moving $97 $73 Reflects increased move costs -- packaging, tolls, fees, separate setup and break down crews, additional drivers,
Revision 2 15 October 2007
Relocation of Non-Nuclear Production to an Alternate Location Business Case
Albuquerque KCRIMS Comments Total through 2030
FY06 ($million) tractors, trailers, and travel costs
Demolition & Remediation $287 $287 The team selected the demolition and remediation of the Bannister Complex option to include in the costs.
The final business case result is a risk adjusted value derived from 10,000 simulations across the reasonable range of variables, provided in the next section.
A complete description of the model methodology is provided in Appendix 5.
6.2 KCRIMS to Albuquerque Risk Adjusted Results
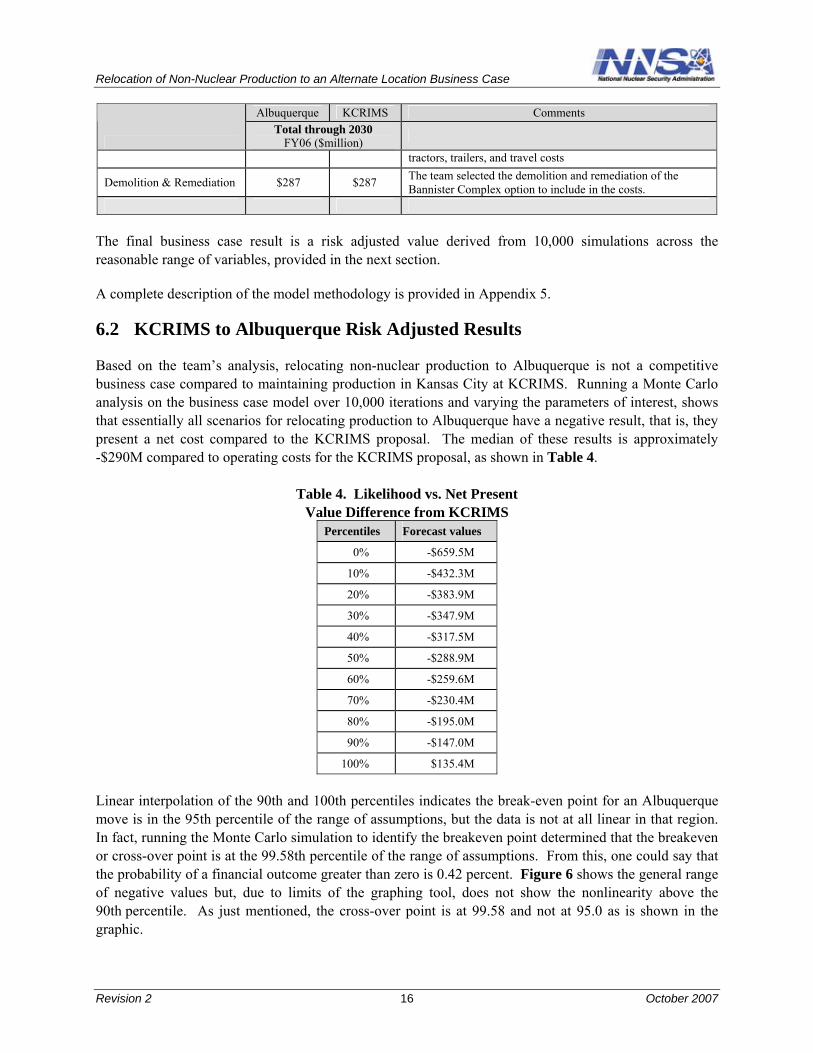
Based on the team’s analysis, relocating non-nuclear production to Albuquerque is not a competitive business case compared to maintaining production in Kansas City at KCRIMS. Running a Monte Carlo analysis on the business case model over 10,000 iterations and varying the parameters of interest, shows that essentially all scenarios for relocating production to Albuquerque have a negative result, that is, they present a net cost compared to the KCRIMS proposal. The median of these results is approximately -$290M compared to operating costs for the KCRIMS proposal, as shown in Table 4.
Table 4. Likelihood vs. Net Present Value Difference from KCRIMS
Percentiles Forecast values
0% -$659.5M
10% -$432.3M
20% -$383.9M
30% -$347.9M
40% -$317.5M
50% -$288.9M
60% -$259.6M
70% -$230.4M
80% -$195.0M
90% -$147.0M
100% $135.4M
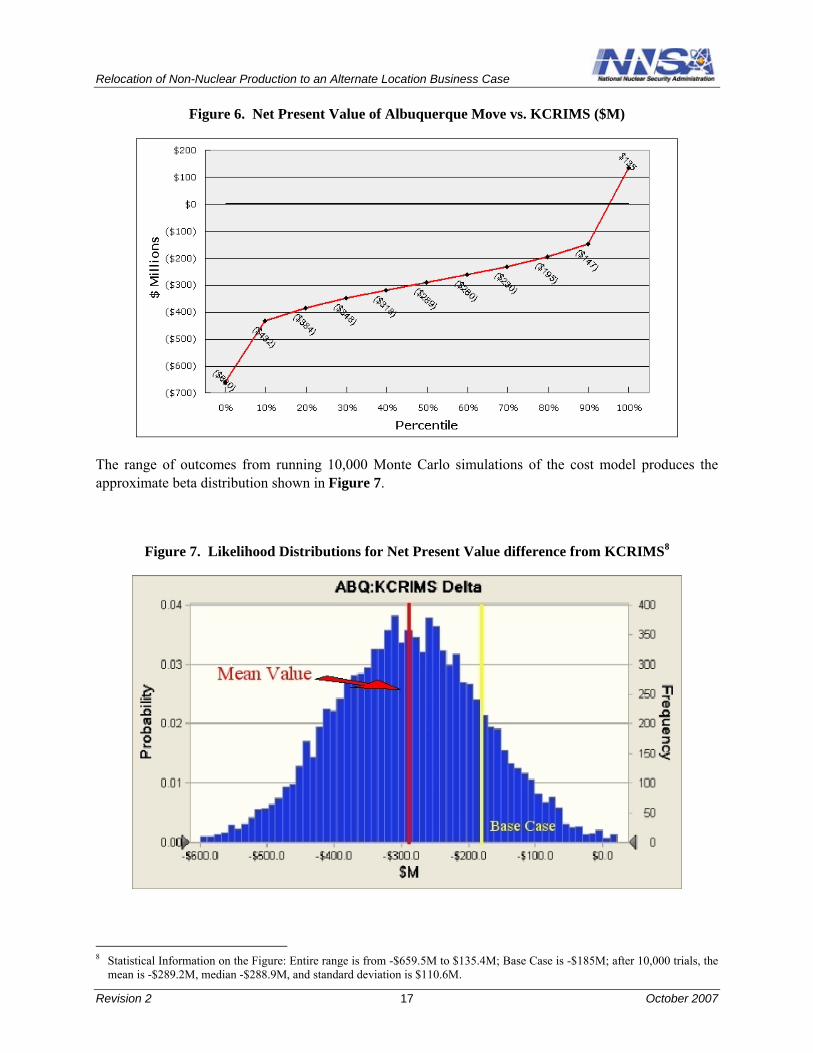
Linear interpolation of the 90th and 100th percentiles indicates the break-even point for an Albuquerque move is in the 95th percentile of the range of assumptions, but the data is not at all linear in that region. In fact, running the Monte Carlo simulation to identify the breakeven point determined that the breakeven or cross-over point is at the 99.58th percentile of the range of assumptions. From this, one could say that the probability of a financial outcome greater than zero is 0.42 percent. Figure 6 shows the general range of negative values but, due to limits of the graphing tool, does not show the nonlinearity above the 90th percentile. As just mentioned, the cross-over point is at 99.58 and not at 95.0 as is shown in the graphic.
Revision 2 16 October 2007
Relocation of Non-Nuclear Production to an Alternate Location Business Case
Figure 6. Net Present Value of Albuquerque Move vs. KCRIMS ($M)
The range of outcomes from running 10,000 Monte Carlo simulations of the cost model produces the approximate beta distribution shown in Figure 7.
Figure 7. Likelihood Distributions for Net Present Value difference from KCRIMS8
Statistical Information on the Figure: Entire range is from -$659.5M to $135.4M; Base Case is -$185M; after 10,000 trials, the mean is -$289.2M, median -$288.9M, and standard deviation is $110.6M.
Revision 2 17 October 2007
8

Relocation of Non-Nuclear Production to an Alternate Location Business Case
The result comes from varying the parameters over the ranges shown in Table 5. These ranges represent the difference from the parameter values for the KCRIMS business case and are discussed in detail in Appendix 4.
Table 5. Business Case Model Parameters and Ranges Variable Expected Minimum Maximum Distribution
Transportation Costs 100% 80% 120% Triangular
Retirement Rate (Kansas City Status Quo) 10% 4% 30% Triangular
KCP Salaried Staff Retirement Rate during Announcement Phase 40% 10% 50% Triangular
KCP Hourly Staff Retirement Rate during Announcement Phase 40% 10% 50% Triangular
KCP Salaried Staff Retirement Rate during Transition Phase 50% 30% 60% Triangular
KCP Hourly Staff Retirement Rate during Transition Phase 50% 30% 60% Triangular
KCP Salaried Staff Retirement Rate during Move Phase 90% 80% 100% Triangular
KCP Hourly Staff Retirement Rate during Move Phase 90% 80% 100% Triangular
KCP Salaried Staff Leaving During the Announcement Phase 8% 4% 10% Triangular
KCP Hourly Staff Leaving During the Announcement Phase 8% 4% 10% Triangular
KCP Salaried Staff Leaving During the Transition Phase 2.5% 0% 5% Triangular
KCP Hourly Staff Leaving During the Transition Phase 2.5% 0% 5% Triangular
Distant Location Salaried Staff Leaving During the Transition Phase 8% 5% 15% Triangular
Distant Location Hourly Staff Leaving During the Move Phase 8% 5% 10% Triangular
Percent of KCRIMS Staff Needed for Albuquerque 88% 78% 97.6% Normal
Albuquerque Cost of Construction vs. KC 88% 88% 100% Triangular
Duration of Offsite Planning at Distant location (years) 3.0 2.5 4.0 Triangular
Duration of Construction at Distant location (years) 2.0 1.5 3.0 Triangular
Duration of Move at distant location (years) 3.0 2.5 5.0 Triangular
6.3 Business Case Comparisons
Table 6 arrays the business case results for the original five options considered in the KCP Concept of Operations normalized for comparison with the KCRIMS proposal and Albuquerque business cases generated by the team’s model.
Revision 2 18 October 2007

Relocation of Non-Nuclear Production to an Alternate Location Business Case
Table 6. All Business Case Options Arrayed Status Quo Option A Option B Option C Option D Option E Alternate
City Continue Current Facility
Operations
KC New & Renovation
KC New Construction Onsite East
KC Renovation of
Existing Facility
KCRIMS KC New
Construction Onsite West
Albuquerque
Results FY06$ (Millions)
Constant FY06 Dollar Cost $11,938 $12,416 $12,535 $12,256 $9,846 $12,510 $9,901
Escalated Dollar Cost $16,051 $16,593 $16,727 $16,412 $13,132 $16,699 $12,971
Net Present Value (FY06) $8,874 $9,292 $9,395 $9,150 $7,384 $9,373 $7,569
Recurring Costs
Labor Costs $6,565.3 $6,565.3 $6,565.3 $6,565.3 $5,030.0 $6,565.3 $5,138.0
Labor Costs adjusted with material costs
Direct $6,302.7 $6,302.7 $6,302.7 $6,302.7 $5,293.8 $6,302.7 $5,347.7
Indirect $1,575.7 $1,575.7 $1,575.7 $1,575.7 $1,323.4 $1,575.7 $1,336.9 Total Labor and Material $7,878.3 $7,878.3 $7,878.3 $7,878.3 $6,617.2 $7,878.3 $6,684.6
Transportation $23.0 $23.0 $23.0 $23.0 $23.0 $23.0 $23.0
Taxes and Fees $37.1 $37.1 $37.1 $37.1 $31.2 $37.1 $113.2
Lease Payments $912.0 $717.9
RTBF/Maintenance
Direct Costs $2,797.2 $2,797.2 $2,797.2 $2,797.2 $1,561.4 $2,797.2 $1,532.9
Indirect Costs $565.5 $565.5 $565.5 $565.5 $256.7 $565.5 $259.9 Total Maintenance Costs $3,362.7 $3,362.7 $3,362.7 $3,362.7 $1,818.1 $3,362.7 $1,792.9
Nonrecurring Costs Transformation Planning $13.5 $18.6 Sourcing Initiative $31.6 $45.4
Re-qualification $28.1 $56.2 Build Ahead Material $0.0 $0.0 Build Ahead Labor $13.5 $65.7 Total Build Ahead Costs $41.6 $121.9
Moving $73.0 $96.9
Demolition & Renovation Costs Mothball Cost $2.0 $1.7 Demolition and Remediation $286.6 $286.6 Demolition, Remediation and Sale $241.6 $241.6 Partial Reuse Cost $181.5 $181.5 $181.5 $181.5 $181.5 Facility Compliance Cost $364.0 $364.0 $364.0 $364.0 $364.0 New Facility Construction $569.7 $688.0 $408.9 $186.3 $663.0 $175.1 Existing Facility Construction $91.0
Revision 2 19 October 2007
Relocation of Non-Nuclear Production to an Alternate Location Business Case
This page intentionally blank.
Revision 2 20 October 2007
Relocation of Non-Nuclear Production to an Alternate Location Business Case
7.0 DISCUSSION OF SENSITIVITY ANALYSIS RESULTS
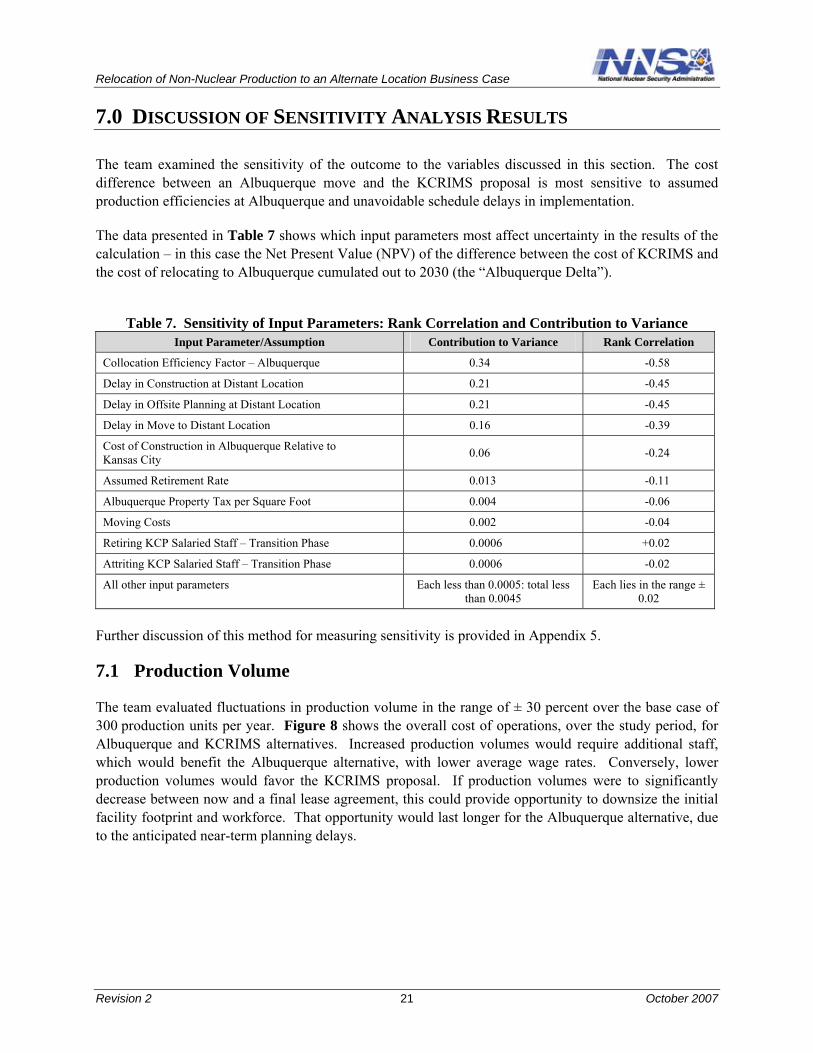
The team examined the sensitivity of the outcome to the variables discussed in this section. The cost difference between an Albuquerque move and the KCRIMS proposal is most sensitive to assumed production efficiencies at Albuquerque and unavoidable schedule delays in implementation.
The data presented in Table 7 shows which input parameters most affect uncertainty in the results of the calculation – in this case the Net Present Value (NPV) of the difference between the cost of KCRIMS and the cost of relocating to Albuquerque cumulated out to 2030 (the “Albuquerque Delta”).
Table 7. Sensitivity of Input Parameters: Rank Correlation and Contribution to Variance Input Parameter/Assumption Contribution to Variance Rank Correlation
Collocation Efficiency Factor – Albuquerque 0.34 -0.58
Delay in Construction at Distant Location 0.21 -0.45
Delay in Offsite Planning at Distant Location 0.21 -0.45
Delay in Move to Distant Location 0.16 -0.39
Cost of Construction in Albuquerque Relative to Kansas City 0.06 -0.24
Assumed Retirement Rate 0.013 -0.11
Albuquerque Property Tax per Square Foot 0.004 -0.06
Moving Costs 0.002 -0.04
Retiring KCP Salaried Staff – Transition Phase 0.0006 +0.02
Attriting KCP Salaried Staff – Transition Phase 0.0006 -0.02
All other input parameters Each less than 0.0005: total less than 0.0045
Each lies in the range ± 0.02
Further discussion of this method for measuring sensitivity is provided in Appendix 5.
7.1 Production Volume
The team evaluated fluctuations in production volume in the range of ± 30 percent over the base case of 300 production units per year. Figure 8 shows the overall cost of operations, over the study period, for Albuquerque and KCRIMS alternatives. Increased production volumes would require additional staff, which would benefit the Albuquerque alternative, with lower average wage rates. Conversely, lower production volumes would favor the KCRIMS proposal. If production volumes were to significantly decrease between now and a final lease agreement, this could provide opportunity to downsize the initial facility footprint and workforce. That opportunity would last longer for the Albuquerque alternative, due to the anticipated near-term planning delays.
Revision 2 21 October 2007

Relocation of Non-Nuclear Production to an Alternate Location Business Case
Figure 8. Effect of Production Variations on Total Operating Cost
7.2 Outsourcing Percent
The team evaluated changes in outsourcing percentage in the range of + 10 percent of the KCRIMS proposed percentage, and this did not materially change the final results. KCP typically estimates $10K per part number for outsourcing. The normal KCP mix of direct labor and material is 70 percent and 30 percent respectively. Outsourcing would reduce direct labor; it would shift the overall balance of labor and material and increase the relative proportion of material overhead. Both direct labor and material overhead are primarily people costs, so a shift to increased outsourcing would not impact the potential costs or savings of the respective alternatives.
7.3 Legacy Remediation
This study primarily addressed the differences between the KCRIMS proposal and Albuquerque. Between these two cases there are no appreciable differences in the legacy remediation approach or costs. The team considered the three cases: mothballing the facility with a caretaker left in perpetuity; destruction and remediation; and destruction and remediation with a resale return on investment. Because the selection makes little difference to the overall project outcome, and because selection of a preferred option could be political as well as cost driven, the team selected the second (demolition and remediation with no return for resale) as the figure to use in the calculations. The team moved costs for the planned demolition and remediation of the Bannister site out to FY 2015 and beyond, so they would not arbitrarily impact the cash flow comparisons in the Future Years Nuclear Security Program (FYNSP) window, which will soon extend to FY 2014.
7.4 Annual Transportation
Recurring transportation costs consist primarily of shipping piece parts and components from vendors to the plant and then shipping finished systems and subsystems to the Pantex plant for final assembly. Due to the relatively low production volumes and the compact nature of the end products, overall annual
Revision 2 22 October 2007
Relocation of Non-Nuclear Production to an Alternate Location Business Case
transportation costs for non-nuclear production are less than $1M; therefore, potential changes in transportation costs related to fuel cost increases, or other impacts, are not significant in the comparison of alternatives.
7.5 Continuity of Critical Operations
Once any move was complete and production underway, making qualified parts, then continuity of critical operations would be comparable between KCRIMS and an Albuquerque move. However, the KCRIMS move, where each line is envisioned to be down for about six months, would provide considerably better continuity of operations. The Albuquerque plan will prolong the period during which production continues at Bannister, with the related deferred maintenance actions, for in the neighborhood of two years longer than the KCRIMS proposal. The startup may take an additional year and a half to produce qualified parts. As a result the distant city location would add approximately three and a half more years to the period of diminished responsiveness for non-nuclear production compared to the KCRIMS proposal.
7.6 Moving Costs
Moving costs are likely to vary from the estimate, but variations are expected to be a small component of overall costs, and the business case outcome will not be impacted by changes over the range of uncertainty.
7.7 Employee Willingness to Relocate
The team’s analysis did not indicate that employee willingness to relocate was a major cost driver. Of course, the retention of knowledgeable personnel would be a key factor in determining how long it would take to resume production and qualify parts. On the other hand, hiring a new work force in Albuquerque could result in a more junior work force with local wage rates and lower average salaries. Also, the cost for severance, calculated based on current employee salaries and longevities, was somewhat less than the expected cost of employee relocation. KCP has been very proficient at knowledge preservation, and reports that as of now they have approximately 60 percent of the production processes captured using their process mapping and knowledge preservation process. Additional investments in knowledge preservation could further reduce the impact of knowledge loss should the relocation percentage be low. Anecdotal evidence suggests that the relocation percentage could very between 10 percent and 40 percent depending on the price of Honeywell stock, the possibility of relocation incentives, and other factors.
The relocation percentage factor in the cost model addresses the costs directly associated with relocations, and for this reason a higher relocation percentage results in higher costs. Severance costs are less than relocation costs and new hires will cost less than experienced. However, the secondary impact of the relocation percentage is that loss of staff and knowledge will lengthen the delay for production startup. This impact is modeled indirectly by the nominal two year delay for production and the range of uncertainty associated with how long that might take under adverse conditions.
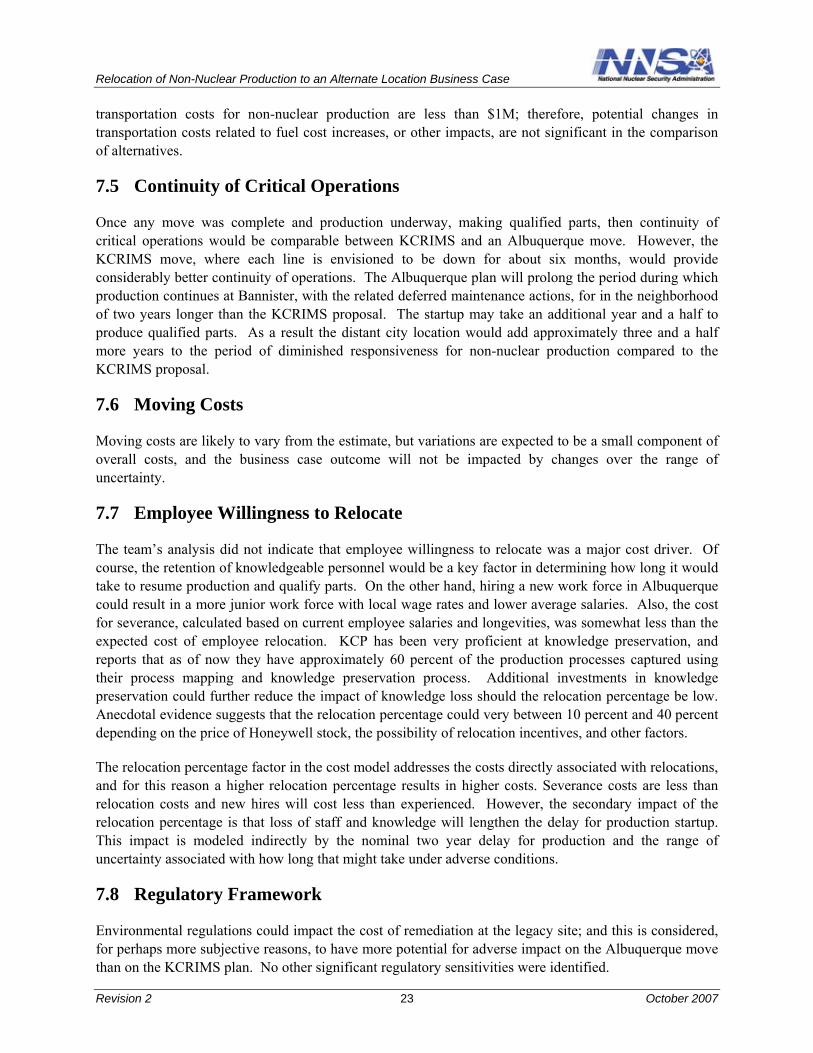
7.8 Regulatory Framework
Environmental regulations could impact the cost of remediation at the legacy site; and this is considered, for perhaps more subjective reasons, to have more potential for adverse impact on the Albuquerque move than on the KCRIMS plan. No other significant regulatory sensitivities were identified.
Revision 2 23 October 2007
Relocation of Non-Nuclear Production to an Alternate Location Business Case
7.9 Community Acceptance
A plan to move 2000 jobs out of the local area could easily result in local community or political pressures that could result in delays for protracted public hearings. As discussed, any delays to implementation a move from the Bannister facility significantly affect the potential for savings. Whether any protests against an out of state move would eventually prevail is less important than the risk that the ensuing delays would impose on both the economic picture and on continuity of operations and availability of a responsive infrastructure.
7.10 Life Extension Program (LEP) Strategy
The KCRIMS proposal is to complete the W76 LEP before the move including an inventory of build-ahead parts to meet schedule delivery requirements. A move to Albuquerque could require tooling up for the subsequent production focus while still at Bannister. This study did not assess the build ahead schedule for this scenario.
7.11 Reliable Replacement Warhead (RRW) Strategy
In general, the business case for moving non-nuclear production is neutral to whether RRW is approved or not. The main factor is that protracted instability in the non-nuclear production capability, due to a distant city move, would likely complicate development production of RRW, and could impact delivery lead-times, since the notional schedules for both appear to coincide.
7.12 Stockpile Size, and Composition and Technology
Reductions in stockpile size will drive up unit costs due to allocation of fixed costs; however, it is not apparent that this would affect KCRIMS or an Albuquerque facility differently. Changes in stockpile composition would require responsive infrastructure, which favors the KCRIMS alternative by avoiding potential planning and startup delays.
7.13 Weapon Activity Budgets
Weapon budget reductions in the current budget window would favor the KCRIMS proposal, because moving to Albuquerque requires significant extra cash flow in the next seven years. Future decreased budgets favor KCRIMS, because less investment is made in the current FYNSP window, and therefore there is less need to book future savings to recoup investment.
Revision 2 24 October 2007
Relocation of Non-Nuclear Production to an Alternate Location Business Case
8.0 RISK IDENTIFICATION
The team identified the following set of risks and assessed the qualitative impact on the successful relocation of non-nuclear component production to Albuquerque. Planning for this move would include a detailed and comprehensive risk analysis and risk management plan to assure success.
8.1 Viability of the Build-Ahead Plan
With the assumption of a 2 year hiatus from shut-down at KCP to parts qualification at Albuquerque, the build-ahead inventory quantities will have to be approximately 4 times that of the KCRIMS proposal, plus any reasonable risk reserves. The team did not study in detail the plans for producing build-ahead reserves, but used the KCRIMS build-ahead estimate as source data. Uncertainty of the amount of time required to re-qualify parts and the associated shift premiums and durations that would be associated with producing the build-ahead inventory could pose additional risks for the Albuquerque alternative.
8.2 Early Attrition at KCP
Experience with previous plant shutdowns (e.g., Pinellas, Florida) found earlier than desired attrition from the legacy plant once the planned closing had been announced. Financial incentives were required to maintain sufficient personnel to produce the build-ahead inventory of neutron generators, and the plant was actually closed earlier than planned, somewhat due to attrition of the work force. Because of the significant build-ahead inventories required by the Albuquerque alternative, attrition at KCP is regarded as a significant risk, to be mitigated, perhaps, by retention incentives for the current workforce prior to the move.
8.3 Implementation Challenges
The planning for a KCRIMS move includes manufacturing back-flow (that is, moving parts back and forth between plants during the assembly and test process) that may not be feasible with a long distance move. The move from KCP to KCRIMS is planned to take place over a period of up to two years, with each of 13 functional manufacturing or support areas moving in sequential fashion. Due to the zigzag nature of the manufacturing process flow, there are provisions in the plan for components or subsystems to be migrated back and forth, as needed, from the new facility to the old during assembly and testing. Such an ad hoc back-flow of components or subsystems, as work is in process, causes startup risks and manufacturing planning in Albuquerque to be more complicated and could possibly impede the startup and qualification of parts.
8.4 Distant Location Planning
The estimated $5.1M for additional planning to support the Albuquerque move (see Table 6) could be insufficient, especially if unforeseen problems arise, differences in scenarios emerge, or delays in implementation occur. The team assumed that a large part of the manufacturing planning for KCRIMS would also be directly applicable to an alternate city scenario. In the event that a more radical scenario were considered, to capture vertical integration savings, the prospect of having different management or a different overall manufacturing approach might make the KCRIMS manufacturing plans obsolete. (KCRIMS is planned for manufacturing lines to be organized by function, whereas SNL has recommended that non-nuclear production be organized by product line.) The difference in approach
Revision 2 25 October 2007

Relocation of Non-Nuclear Production to an Alternate Location Business Case
would need to be worked out between the two in a combined leadership model, and that could lead to a further planning delay.
8.5 Greenfield Site Availability
The Albuquerque scenario includes the assumption that comparable GSA land acquisition, financing, development and lease arrangements could be executed without unusual delays. There is a risk that a desirable plot of 100-140 acres might not be readily available, with the same level of utilities and environmental advantages as the proposed KCRIMS site. This study did not review commercially available land in the Albuquerque area.
8.6 Viability of On-Site Facility Scenario
It was a conclusion of this study that the maximum of benefits could be achieved in a scenario in which non-nuclear production is collocated with the design counterparts, so that there would be one location, one building, one company, and even one manager overseeing the combined operations. The team estimated the potential benefits from such a scenario to be a savings of approximately 20 percent of production operations costs and approximately 24 percent of overhead costs. These estimates were based on broad-brush, anecdotal estimates from the relocation of the neutron generator operations from Pinellas and the bottom-up estimated reduction of 255 FTEs used in the KCP Alternate City Study (2005). These numbers were used to compute potential benefits for such a vertical integration scenario, however, this study was not able to envision how to make this practical. The two alternatives to providing one million square feet of useful space inside the fence at SNL-AL are: (a) a line-item construction project and (b) a commercial development and lease on Government property. Both these alternatives are very challenging in terms of near-term planning, administrative approvals and execution. This makes formulation of an executable scenario to achieve the most optimistic savings problematic.
8.7 Lost Commercialization Potential
The KCRIMS proposal to save approximately $100M per year is primarily based on three categories of savings: increased out-sourcing, a more commercial manufacturing model, and a streamlined site office oversight model. When trying to capture benefits from an alternate city location, the most attractive savings are captured to the degree that complete vertical integration is achieved between design and production. However, such vertical integration, with the resulting symbiotic relationship with the host location – in this case, a site with special nuclear materials – may impede the culture change required to capture savings from the streamlined commercialization and oversight models. In addition, reductions in Federal site office personnel could work against the potential commercialization savings, because the same management may be challenged to apply radically different oversight models to activities that were collocated. The same collocation that could foster improved design to manufacturing interfaces and savings would also likely impede the transformation of the non-nuclear production enterprise to a more commercial model, thereby reducing benefits that such a move would attempt to capture.
8.8 Capturing Regional Savings
It is possible that the regional statistics for labor rates and construction costs will translate into actual savings when hiring, construction and maintenance are carried out in practice. The clearance requirements to work at the plant and the specialized nature of the work force contribute a risk that
Revision 2 26 October 2007
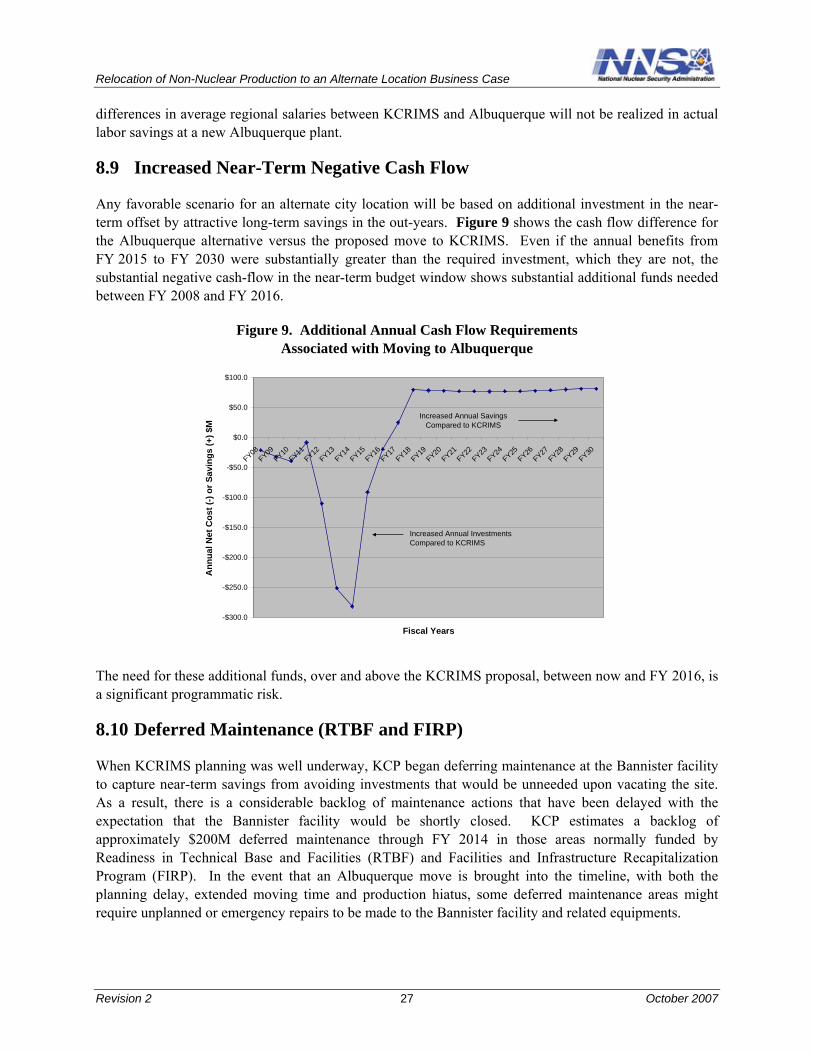
Relocation of Non-Nuclear Production to an Alternate Location Business Case
differences in average regional salaries between KCRIMS and Albuquerque will not be realized in actual labor savings at a new Albuquerque plant.
8.9 Increased Near-Term Negative Cash Flow
Any favorable scenario for an alternate city location will be based on additional investment in the near-term offset by attractive long-term savings in the out-years. Figure 9 shows the cash flow difference for the Albuquerque alternative versus the proposed move to KCRIMS. Even if the annual benefits from FY 2015 to FY 2030 were substantially greater than the required investment, which they are not, the substantial negative cash-flow in the near-term budget window shows substantial additional funds needed between FY 2008 and FY 2016.
Figure 9. Additional Annual Cash Flow Requirements Associated with Moving to Albuquerque
Ann
ual N
et C
ost (
-) or
Sav
ings
(+) $
M
$100.0
$50.0
$0.0
-$50.0
-$100.0
-$150.0
-$200.0
-$250.0
-$300.0
Y Y1 1FY1 1
F F8
FY1 2FY2 5
FY2 7FY2
F0
FY0F F
0FY1 2
FY1F
5FY1 7
FY1 9FY2
F F F4
FY2 6FY2 9
FY38 9 3Y
4Y1 6
Y1 0Y
1Y2 3
Y2 8Y2 02
Increased Annual Investments Compared to KCRIMS
Increased Annual Savings Compared to KCRIMS
Fiscal Years
The need for these additional funds, over and above the KCRIMS proposal, between now and FY 2016, is a significant programmatic risk.
8.10 Deferred Maintenance (RTBF and FIRP)
When KCRIMS planning was well underway, KCP began deferring maintenance at the Bannister facility to capture near-term savings from avoiding investments that would be unneeded upon vacating the site. As a result, there is a considerable backlog of maintenance actions that have been delayed with the expectation that the Bannister facility would be shortly closed. KCP estimates a backlog of approximately $200M deferred maintenance through FY 2014 in those areas normally funded by Readiness in Technical Base and Facilities (RTBF) and Facilities and Infrastructure Recapitalization Program (FIRP). In the event that an Albuquerque move is brought into the timeline, with both the planning delay, extended moving time and production hiatus, some deferred maintenance areas might require unplanned or emergency repairs to be made to the Bannister facility and related equipments.
Revision 2 27 October 2007

Relocation of Non-Nuclear Production to an Alternate Location Business Case
This page intentionally blank.
Revision 2 28 October 2007

Relocation of Non-Nuclear Production to an Alternate Location Business Case
APPENDIX 1 – ALTERNATE LOCATION STRENGTHS, WEAKNESSES, OPPORTUNITIES, AND THREATS (SWOT) ANALYSIS
SWOT Analysis
The SWOT analysis addresses the case in which the facility approach is comparable to the KCRIMS proposal except for placement in Albuquerque within ten miles of the Kirtland perimeter.
Strengths - Supports the vision of transformation; - Reduces the Nuclear Weapons Complex from eight to seven major sites; - New state-of-the-art facility allows for efficient design of space with flexible features; - No disruption from construction or demolition on existing operations; - Greater residual value of building on green field site yields more favorable financial terms; - New facility and new hires will assist in achieving cultural change; - Allows potential for future privatization; and - Potentially less expensive construction, operations and maintenance costs.
Weaknesses - Relocation planning is more complicated due to split operations, extended production hiatus and significant staff attrition;
- Planning and production delays reduce near term savings and increase legacy operation costs;
- Annual New Mexico taxes on gross operating revenue of approximately 2.9 percent; - Uprooting employees with resulting social and economic impacts; - No viable scenario for true collocation (inside the fence) at SNL-NM; and - Requires substantial restructuring of corporate relationships to attain vertical integration.
Opportunities - Staff hiring and recruiting may be enhanced at a new state of the art facility; - Ability to negotiate real estate or operating tax breaks with state and local jurisdictions; - Potential efficiencies from proximity to non-nuclear design agent; - Potential for more early design influence and design for manufacturability; and - Use of GSA standard leasing authority.
Threats - NEPA process, timing and results on new site is unknown; - Greenfield site is unknown–impact on zoning, utility feeds, site infrastructure; - Purchase price for site is unknown; - Potential to lose savings from commercialization and oversight model; - Legacy site political concerns related to tax base and employment; - Legacy site impact on environmental remediation criteria; - Potential for unexpected early employee attrition at Bannister; - Unknowns associated with severance, relocation and rehiring costs; and - Substantial uncertainties in work force management related to retirements, attrition, etc.
Revision 2 29 October 2007
Relocation of Non-Nuclear Production to an Alternate Location Business Case
This page intentionally blank.
Revision 2 30 October 2007
Relocation of Non-Nuclear Production to an Alternate Location Business Case
APPENDIX 2 – CITY DESIRABILITY ANALYSIS
The data and methodology for analyzing the comparative advantages and disadvantages of living and working in a particular city were taken from Places Rated Almanac, 7th Edition, David Savageau, Places Rated Books, LLC, 2007.
This reference evaluates nine comparison categories associated with 379 separate metropolitan areas throughout the United States.
• “Places Rated Almanac is more useful than any system that considers just states because numbers for big areas of geography hide the smaller exceptions. Instead, Places Rated Almanac focuses on metropolitan areas, the smallest unit of urban geography for which there is the largest and freshest amount of comparable data.
• The term metropolitan area simply means a large city, including its suburbs. Since 1950, metropolitan areas have taken on an official connotation defined by detailed federal standards. Simply put, an area qualifies as “metropolitan” if there is an urbanized area of at least 50,000 people (the “core”) together with the surrounding county. Adjacent suburban and rural counties are added to the metro area based on how many persons commute to work into the core.”
A key advantage to this area definition is that statistics of city suburbs that straddle county and even state borders are included in that metropolitan area. Kansas City, Missouri is an example of such an area where that city and its surrounding suburbs span 2 states, 15 counties and 310 cities and contains a total population of 1,979,219 people. The population of just the city of Kansas City, Missouri is 444,965.
The nine categories of attributes are made up of five relating mainly to facilities: ambiance, transportation, education, health care, and recreation.
And four categories which are related to indicators: housing costs, jobs, crime, and climate.
Each comparison category for each metropolitan area is scored according to how many kinds and qualities of facilities there are for categories in the first group and how far off various indicators are from national averages or personal comfort measures for the second group.
The seven alternative cities that the study team investigated had the following scores as judged by Places Rated Almanac (PRA 2007). These scores in turn were normalized in Table 2-1 to the Kansas City score, such that the normalized score for Kansas City equals 100 and the other cities’ scores were proportional.
Revision 2 31 October 2007
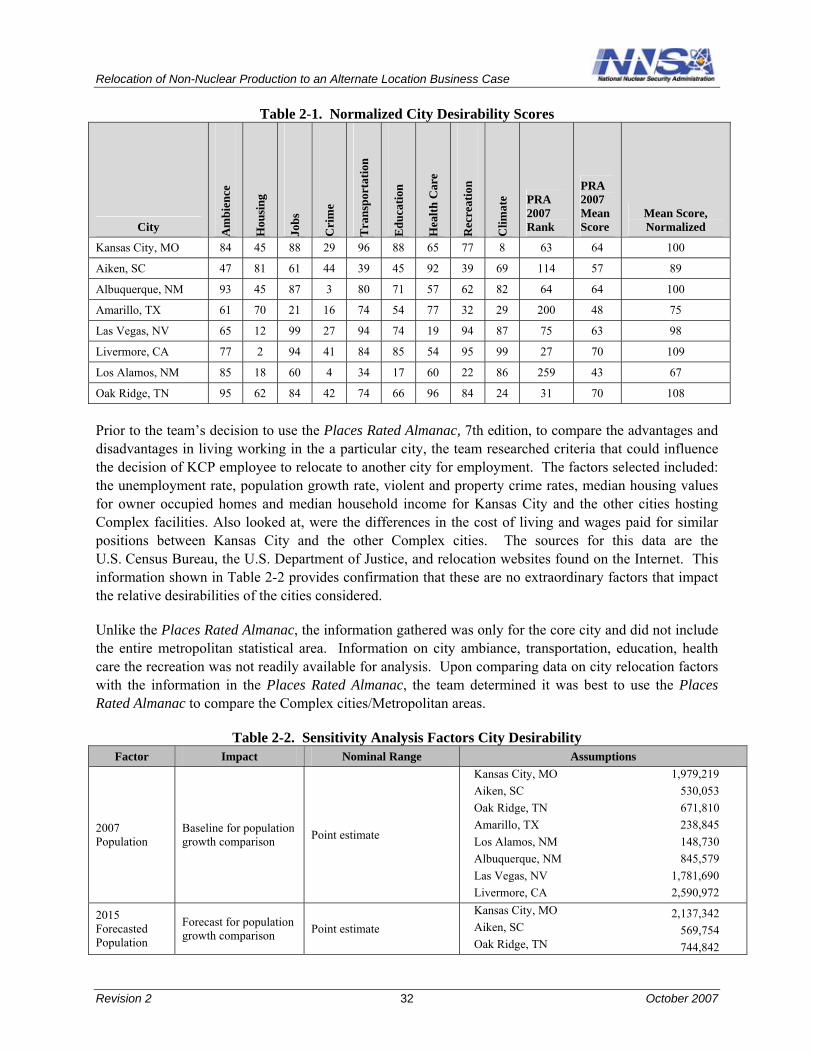
Relocation of Non-Nuclear Production to an Alternate Location Business Case
Table 2-1. Normalized City Desirability Scores
City Am
bien
ce
Hou
sing
Jobs
Cri
me
Tra
nspo
rtat
ion
Edu
catio
n
Hea
lth C
are
Rec
reat
ion
Clim
ate PRA
2007 Rank
PRA 2007 Mean Score
Mean Score, Normalized
Kansas City, MO 84 45 88 29 96 88 65 77 8 63 64 100
Aiken, SC 47 81 61 44 39 45 92 39 69 114 57 89
Albuquerque, NM 93 45 87 3 80 71 57 62 82 64 64 100
Amarillo, TX 61 70 21 16 74 54 77 32 29 200 48 75
Las Vegas, NV 65 12 99 27 94 74 19 94 87 75 63 98
Livermore, CA 77 2 94 41 84 85 54 95 99 27 70 109
Los Alamos, NM 85 18 60 4 34 17 60 22 86 259 43 67
Oak Ridge, TN 95 62 84 42 74 66 96 84 24 31 70 108
Prior to the team’s decision to use the Places Rated Almanac, 7th edition, to compare the advantages and disadvantages in living working in the a particular city, the team researched criteria that could influence the decision of KCP employee to relocate to another city for employment. The factors selected included: the unemployment rate, population growth rate, violent and property crime rates, median housing values for owner occupied homes and median household income for Kansas City and the other cities hosting Complex facilities. Also looked at, were the differences in the cost of living and wages paid for similar positions between Kansas City and the other Complex cities. The sources for this data are the U.S. Census Bureau, the U.S. Department of Justice, and relocation websites found on the Internet. This information shown in Table 2-2 provides confirmation that these are no extraordinary factors that impact the relative desirabilities of the cities considered.
Unlike the Places Rated Almanac, the information gathered was only for the core city and did not include the entire metropolitan statistical area. Information on city ambiance, transportation, education, health care the recreation was not readily available for analysis. Upon comparing data on city relocation factors with the information in the Places Rated Almanac, the team determined it was best to use the Places Rated Almanac to compare the Complex cities/Metropolitan areas.
Table 2-2. Sensitivity Analysis Factors City Desirability Factor Impact Nominal Range Assumptions
2007 Population
Baseline for population growth comparison Point estimate
Kansas City, MOAiken, SC Oak Ridge, TN Amarillo, TX Los Alamos, NMAlbuquerque, NMLas Vegas, NV Livermore, CA
1,979,219 530,053 671,810 238,845 148,730 845,579
1,781,690 2,590,972
2015 Forecasted Population
Forecast for population growth comparison Point estimate
Kansas City, MOAiken, SC Oak Ridge, TN
2,137,342 569,754 744,842
Revision 2 32 October 2007
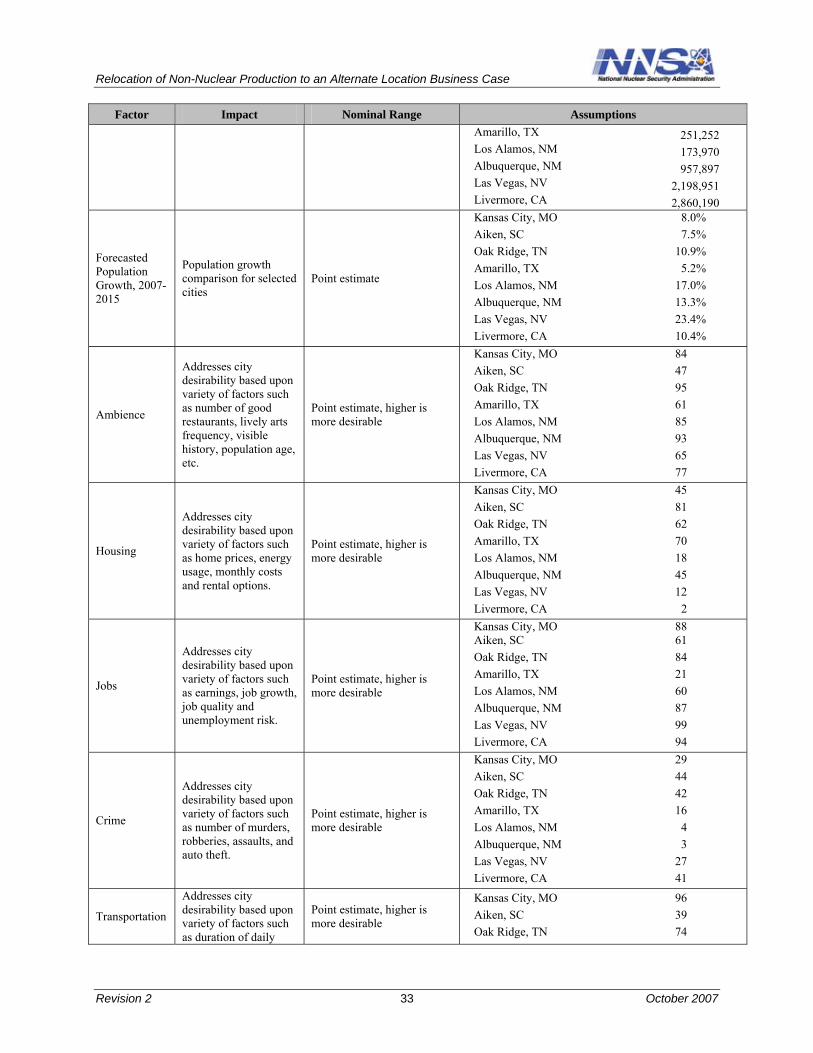
Relocation of Non-Nuclear Production to an Alternate Location Business Case
Factor Impact Nominal Range Assumptions Amarillo, TX Los Alamos, NMAlbuquerque, NMLas Vegas, NV Livermore, CA
251,252 173,970 957,897
2,198,951 2,860,190
Forecasted Population Growth, 20072015
Population growth comparison for selected cities
Point estimate
Kansas City, MO Aiken, SC Oak Ridge, TN Amarillo, TX Los Alamos, NM Albuquerque, NM Las Vegas, NV Livermore, CA
8.0% 7.5%
10.9% 5.2%
17.0% 13.3% 23.4% 10.4%
Ambience
Addresses city desirability based upon variety of factors such as number of good restaurants, lively arts frequency, visible history, population age, etc.
Point estimate, higher is more desirable
Kansas City, MO Aiken, SC Oak Ridge, TN Amarillo, TX Los Alamos, NM Albuquerque, NM Las Vegas, NV Livermore, CA
84 47 95 61 85 93 65 77
Housing
Addresses city desirability based upon variety of factors such as home prices, energy usage, monthly costs and rental options.
Point estimate, higher is more desirable
Kansas City, MO Aiken, SC Oak Ridge, TN Amarillo, TX Los Alamos, NM Albuquerque, NM Las Vegas, NV Livermore, CA
45 81 62 70 18 45 12
2
Jobs
Addresses city desirability based upon variety of factors such as earnings, job growth, job quality and unemployment risk.
Point estimate, higher is more desirable
Kansas City, MO Aiken, SC Oak Ridge, TN Amarillo, TX Los Alamos, NM Albuquerque, NM Las Vegas, NV Livermore, CA
88 61 84 21 60 87 99 94
Crime
Addresses city desirability based upon variety of factors such as number of murders, robberies, assaults, and auto theft.
Point estimate, higher is more desirable
Kansas City, MO Aiken, SC Oak Ridge, TN Amarillo, TX Los Alamos, NM Albuquerque, NM Las Vegas, NV Livermore, CA
29 44 42 16
4 3
27 41
Transportation
Addresses city desirability based upon variety of factors such as duration of daily
Point estimate, higher is more desirable
Kansas City, MO Aiken, SC Oak Ridge, TN
96 39 74
Revision 2 33 October 2007
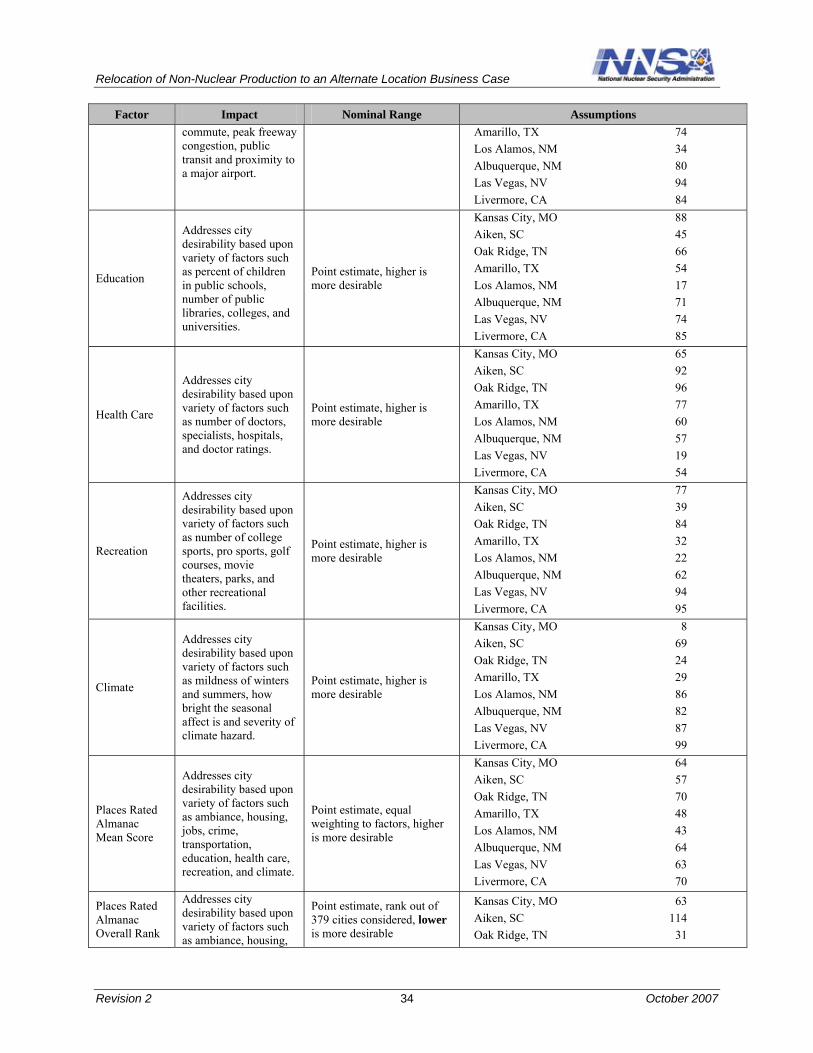
Relocation of Non-Nuclear Production to an Alternate Location Business Case
Factor Impact Nominal Range Assumptions commute, peak freeway congestion, public transit and proximity to a major airport.
Amarillo, TX Los Alamos, NM Albuquerque, NM Las Vegas, NV Livermore, CA
74 34 80 94 84
Education
Addresses city desirability based upon variety of factors such as percent of children in public schools, number of public libraries, colleges, and universities.
Point estimate, higher is more desirable
Kansas City, MO Aiken, SC Oak Ridge, TN Amarillo, TX Los Alamos, NM Albuquerque, NM Las Vegas, NV Livermore, CA
88 45 66 54 17 71 74 85
Health Care
Addresses city desirability based upon variety of factors such as number of doctors, specialists, hospitals, and doctor ratings.
Point estimate, higher is more desirable
Kansas City, MO Aiken, SC Oak Ridge, TN Amarillo, TX Los Alamos, NM Albuquerque, NM Las Vegas, NV Livermore, CA
65 92 96 77 60 57 19 54
Recreation
Addresses city desirability based upon variety of factors such as number of college sports, pro sports, golf courses, movie theaters, parks, and other recreational facilities.
Point estimate, higher is more desirable
Kansas City, MO Aiken, SC Oak Ridge, TN Amarillo, TX Los Alamos, NM Albuquerque, NM Las Vegas, NV Livermore, CA
77 39 84 32 22 62 94 95
Climate
Addresses city desirability based upon variety of factors such as mildness of winters and summers, how bright the seasonal affect is and severity of climate hazard.
Point estimate, higher is more desirable
Kansas City, MO Aiken, SC Oak Ridge, TN Amarillo, TX Los Alamos, NM Albuquerque, NM Las Vegas, NV Livermore, CA
8 69 24 29 86 82 87 99
Places Rated Almanac Mean Score
Addresses city desirability based upon variety of factors such as ambiance, housing, jobs, crime, transportation, education, health care, recreation, and climate.
Point estimate, equal weighting to factors, higher is more desirable
Kansas City, MO Aiken, SC Oak Ridge, TN Amarillo, TX Los Alamos, NM Albuquerque, NM Las Vegas, NV Livermore, CA
64 57 70 48 43 64 63 70
Places Rated Almanac Overall Rank
Addresses city desirability based upon variety of factors such as ambiance, housing,
Point estimate, rank out of 379 cities considered, lower is more desirable
Kansas City, MOAiken, SC Oak Ridge, TN
63 114
31
Revision 2 34 October 2007

Relocation of Non-Nuclear Production to an Alternate Location Business Case
Factor Impact Nominal Range Assumptions jobs, crime, transportation, education, health care, recreation, and climate.
Amarillo, TX Los Alamos, NM Albuquerque, NMLas Vegas, NV Livermore, CA
200 259
64 75 27
Source: Places Rated Almanac, 7th Edition, David Savageau, Places Rated Books, LLC, 2007
Revision 2 35 October 2007

Relocation of Non-Nuclear Production to an Alternate Location Business Case
This page intentionally blank.
Revision 2 36 October 2007
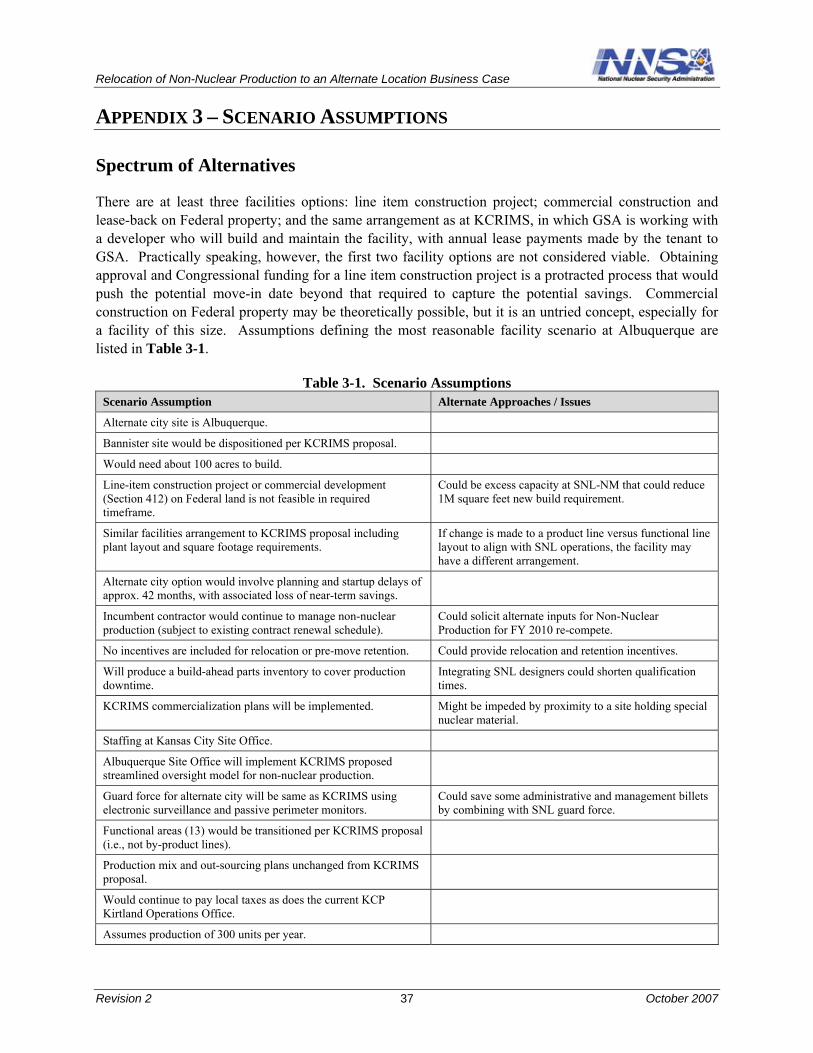
Relocation of Non-Nuclear Production to an Alternate Location Business Case
APPENDIX 3 – SCENARIO ASSUMPTIONS
Spectrum of Alternatives
There are at least three facilities options: line item construction project; commercial construction and lease-back on Federal property; and the same arrangement as at KCRIMS, in which GSA is working with a developer who will build and maintain the facility, with annual lease payments made by the tenant to GSA. Practically speaking, however, the first two facility options are not considered viable. Obtaining approval and Congressional funding for a line item construction project is a protracted process that would push the potential move-in date beyond that required to capture the potential savings. Commercial construction on Federal property may be theoretically possible, but it is an untried concept, especially for a facility of this size. Assumptions defining the most reasonable facility scenario at Albuquerque are listed in Table 3-1.
Table 3-1. Scenario Assumptions Scenario Assumption Alternate Approaches / Issues
Alternate city site is Albuquerque.
Bannister site would be dispositioned per KCRIMS proposal.
Would need about 100 acres to build.
Line-item construction project or commercial development (Section 412) on Federal land is not feasible in required timeframe.
Could be excess capacity at SNL-NM that could reduce 1M square feet new build requirement.
Similar facilities arrangement to KCRIMS proposal including plant layout and square footage requirements.
If change is made to a product line versus functional line layout to align with SNL operations, the facility may have a different arrangement.
Alternate city option would involve planning and startup delays of approx. 42 months, with associated loss of near-term savings.
Incumbent contractor would continue to manage non-nuclear production (subject to existing contract renewal schedule).
Could solicit alternate inputs for Non-Nuclear Production for FY 2010 re-compete.
No incentives are included for relocation or pre-move retention. Could provide relocation and retention incentives.
Will produce a build-ahead parts inventory to cover production downtime.
Integrating SNL designers could shorten qualification times.
KCRIMS commercialization plans will be implemented. Might be impeded by proximity to a site holding special nuclear material.
Staffing at Kansas City Site Office.
Albuquerque Site Office will implement KCRIMS proposed streamlined oversight model for non-nuclear production.
Guard force for alternate city will be same as KCRIMS using electronic surveillance and passive perimeter monitors.
Could save some administrative and management billets by combining with SNL guard force.
Functional areas (13) would be transitioned per KCRIMS proposal (i.e., not by-product lines).
Production mix and out-sourcing plans unchanged from KCRIMS proposal.
Would continue to pay local taxes as does the current KCP Kirtland Operations Office.
Assumes production of 300 units per year.
Revision 2 37 October 2007

Relocation of Non-Nuclear Production to an Alternate Location Business Case
This page intentionally blank.
Revision 2 38 October 2007
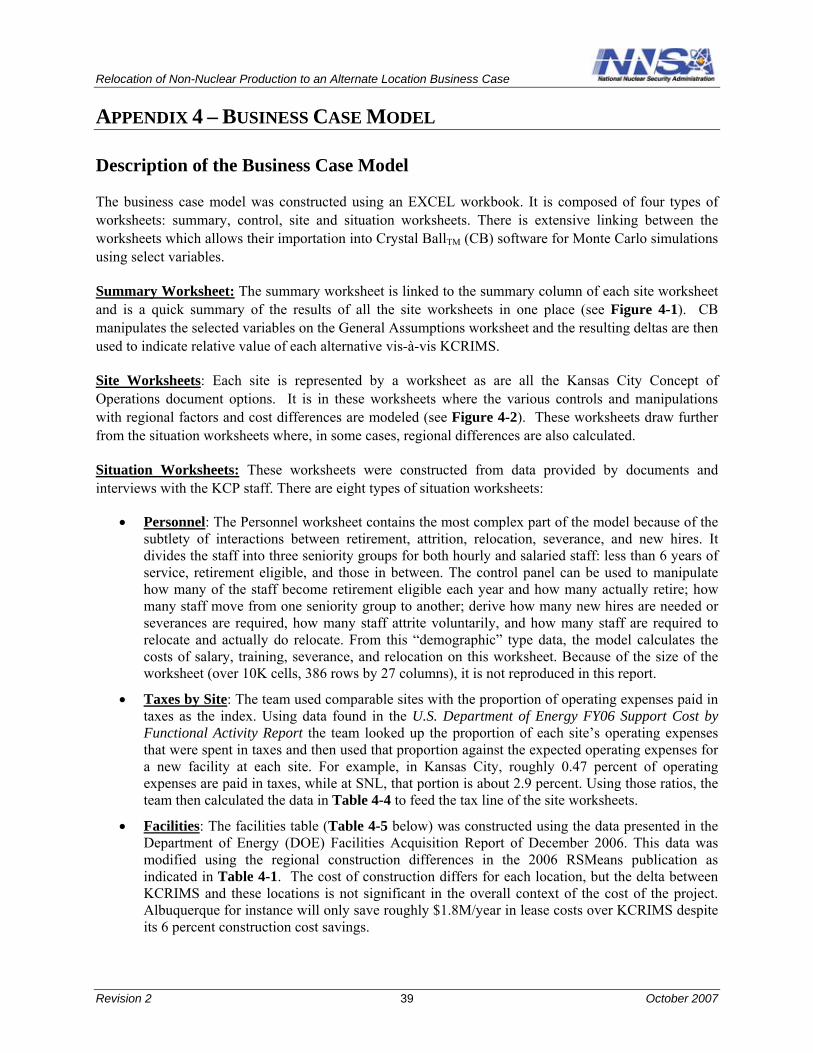
Relocation of Non-Nuclear Production to an Alternate Location Business Case
APPENDIX 4 – BUSINESS CASE MODEL
Description of the Business Case Model
The business case model was constructed using an EXCEL workbook. It is composed of four types of worksheets: summary, control, site and situation worksheets. There is extensive linking between the worksheets which allows their importation into Crystal BallTM (CB) software for Monte Carlo simulations using select variables.
Summary Worksheet: The summary worksheet is linked to the summary column of each site worksheet and is a quick summary of the results of all the site worksheets in one place (see Figure 4-1). CB manipulates the selected variables on the General Assumptions worksheet and the resulting deltas are then used to indicate relative value of each alternative vis-à-vis KCRIMS.
Site Worksheets: Each site is represented by a worksheet as are all the Kansas City Concept of Operations document options. It is in these worksheets where the various controls and manipulations with regional factors and cost differences are modeled (see Figure 4-2). These worksheets draw further from the situation worksheets where, in some cases, regional differences are also calculated.
Situation Worksheets: These worksheets were constructed from data provided by documents and interviews with the KCP staff. There are eight types of situation worksheets:
• Personnel: The Personnel worksheet contains the most complex part of the model because of the subtlety of interactions between retirement, attrition, relocation, severance, and new hires. It divides the staff into three seniority groups for both hourly and salaried staff: less than 6 years of service, retirement eligible, and those in between. The control panel can be used to manipulate how many of the staff become retirement eligible each year and how many actually retire; how many staff move from one seniority group to another; derive how many new hires are needed or severances are required, how many staff attrite voluntarily, and how many staff are required to relocate and actually do relocate. From this “demographic” type data, the model calculates the costs of salary, training, severance, and relocation on this worksheet. Because of the size of the worksheet (over 10K cells, 386 rows by 27 columns), it is not reproduced in this report.
• Taxes by Site: The team used comparable sites with the proportion of operating expenses paid in taxes as the index. Using data found in the U.S. Department of Energy FY06 Support Cost by Functional Activity Report the team looked up the proportion of each site’s operating expenses that were spent in taxes and then used that proportion against the expected operating expenses for a new facility at each site. For example, in Kansas City, roughly 0.47 percent of operating expenses are paid in taxes, while at SNL, that portion is about 2.9 percent. Using those ratios, the team then calculated the data in Table 4-4 to feed the tax line of the site worksheets.
• Facilities: The facilities table (Table 4-5 below) was constructed using the data presented in the Department of Energy (DOE) Facilities Acquisition Report of December 2006. This data was modified using the regional construction differences in the 2006 RSMeans publication as indicated in Table 4-1. The cost of construction differs for each location, but the delta between KCRIMS and these locations is not significant in the overall context of the cost of the project. Albuquerque for instance will only save roughly $1.8M/year in lease costs over KCRIMS despite its 6 percent construction cost savings.
Revision 2 39 October 2007
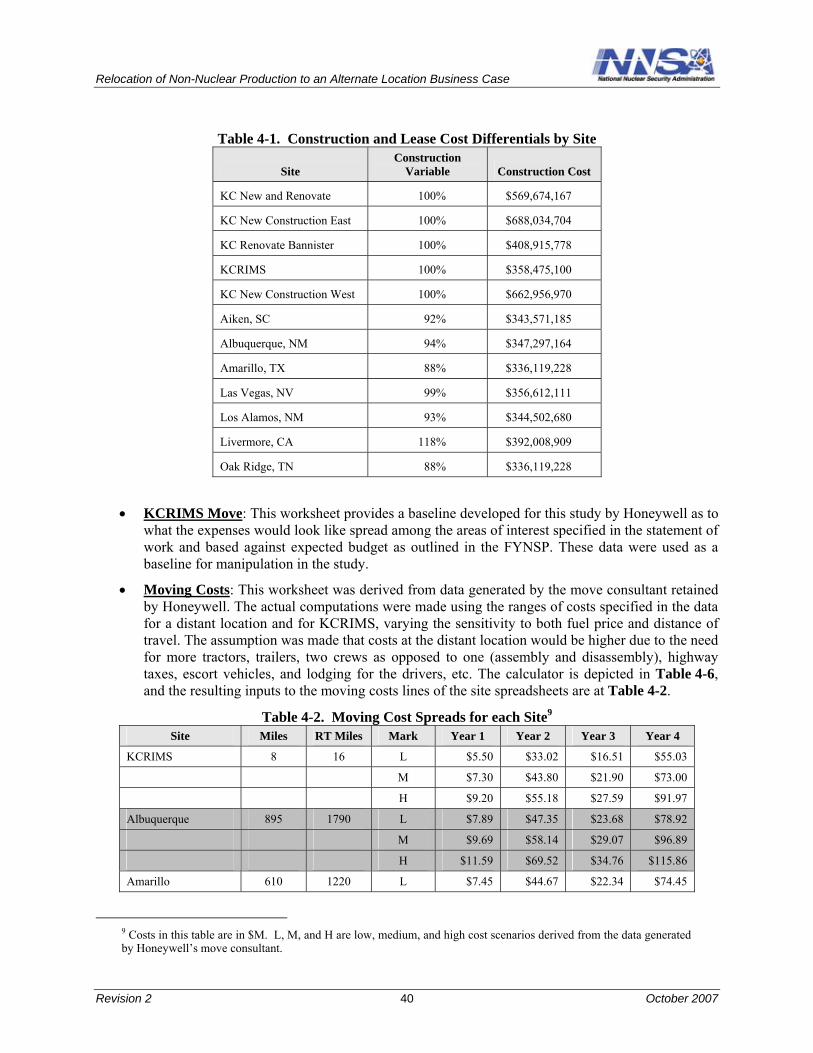
Relocation of Non-Nuclear Production to an Alternate Location Business Case
Table 4-1. Construction and Lease Cost Differentials by Site
Site Construction
Variable Construction Cost
KC New and Renovate 100% $569,674,167
KC New Construction East 100% $688,034,704
KC Renovate Bannister 100% $408,915,778
KCRIMS 100% $358,475,100
KC New Construction West 100% $662,956,970
Aiken, SC 92% $343,571,185
Albuquerque, NM 94% $347,297,164
Amarillo, TX 88% $336,119,228
Las Vegas, NV 99% $356,612,111
Los Alamos, NM 93% $344,502,680
Livermore, CA 118% $392,008,909
Oak Ridge, TN 88% $336,119,228
• KCRIMS Move: This worksheet provides a baseline developed for this study by Honeywell as to what the expenses would look like spread among the areas of interest specified in the statement of work and based against expected budget as outlined in the FYNSP. These data were used as a baseline for manipulation in the study.
• Moving Costs: This worksheet was derived from data generated by the move consultant retained by Honeywell. The actual computations were made using the ranges of costs specified in the data for a distant location and for KCRIMS, varying the sensitivity to both fuel price and distance of travel. The assumption was made that costs at the distant location would be higher due to the need for more tractors, trailers, two crews as opposed to one (assembly and disassembly), highway taxes, escort vehicles, and lodging for the drivers, etc. The calculator is depicted in Table 4-6, and the resulting inputs to the moving costs lines of the site spreadsheets are at Table 4-2.
Table 4-2. Moving Cost Spreads for each Site9
Site Miles RT Miles Mark Year 1 Year 2 Year 3 Year 4
KCRIMS 8 16 L $5.50 $33.02 $16.51 $55.03
M $7.30 $43.80 $21.90 $73.00
H $9.20 $55.18 $27.59 $91.97
Albuquerque 895 1790 L $7.89 $47.35 $23.68 $78.92
M $9.69 $58.14 $29.07 $96.89
H $11.59 $69.52 $34.76 $115.86
Amarillo 610 1220 L $7.45 $44.67 $22.34 $74.45
9 Costs in this table are in $M. L, M, and H are low, medium, and high cost scenarios derived from the data generated by Honeywell’s move consultant.
Revision 2 40 October 2007
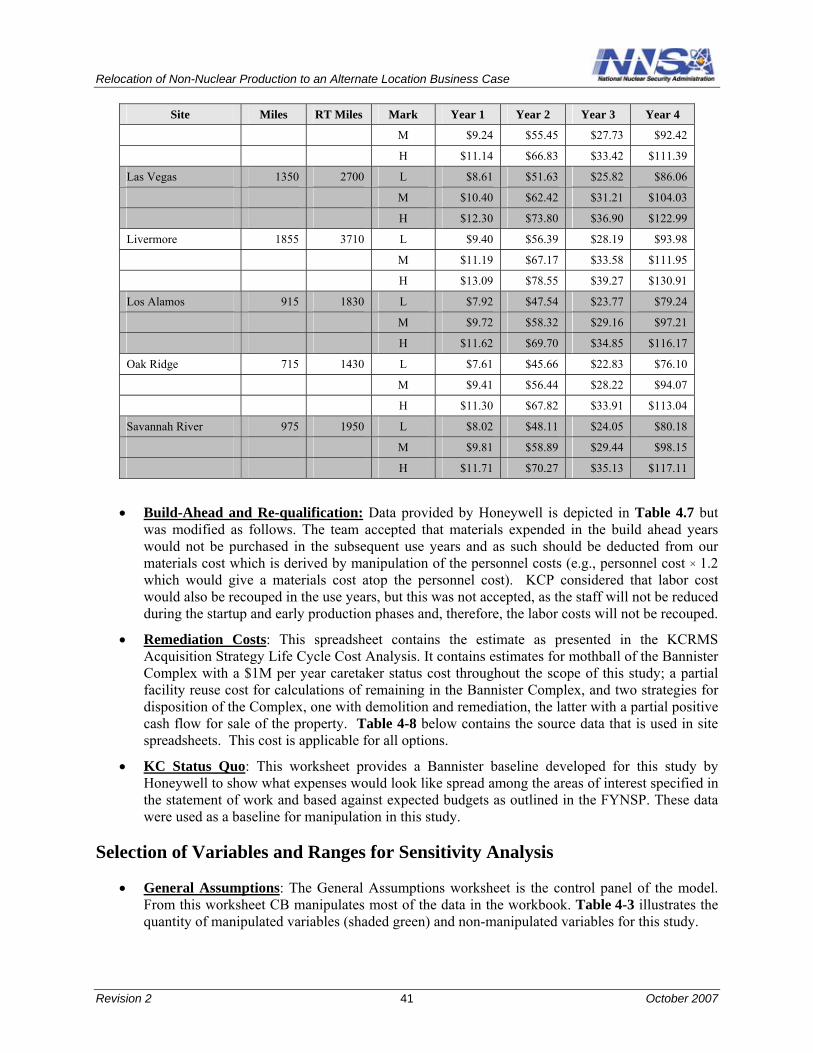
Relocation of Non-Nuclear Production to an Alternate Location Business Case
Site Miles RT Miles Mark Year 1 Year 2 Year 3 Year 4
M $9.24 $55.45 $27.73 $92.42
H $11.14 $66.83 $33.42 $111.39
Las Vegas 1350 2700 L $8.61 $51.63 $25.82 $86.06
M $10.40 $62.42 $31.21 $104.03
H $12.30 $73.80 $36.90 $122.99
Livermore 1855 3710 L $9.40 $56.39 $28.19 $93.98
M $11.19 $67.17 $33.58 $111.95
H $13.09 $78.55 $39.27 $130.91
Los Alamos 915 1830 L $7.92 $47.54 $23.77 $79.24
M $9.72 $58.32 $29.16 $97.21
H $11.62 $69.70 $34.85 $116.17
Oak Ridge 715 1430 L $7.61 $45.66 $22.83 $76.10
M $9.41 $56.44 $28.22 $94.07
H $11.30 $67.82 $33.91 $113.04
Savannah River 975 1950 L $8.02 $48.11 $24.05 $80.18
M $9.81 $58.89 $29.44 $98.15
H $11.71 $70.27 $35.13 $117.11
• Build-Ahead and Re-qualification: Data provided by Honeywell is depicted in Table 4.7 but was modified as follows. The team accepted that materials expended in the build ahead years would not be purchased in the subsequent use years and as such should be deducted from our materials cost which is derived by manipulation of the personnel costs (e.g., personnel cost × 1.2 which would give a materials cost atop the personnel cost). KCP considered that labor cost would also be recouped in the use years, but this was not accepted, as the staff will not be reduced during the startup and early production phases and, therefore, the labor costs will not be recouped.
• Remediation Costs: This spreadsheet contains the estimate as presented in the KCRMS Acquisition Strategy Life Cycle Cost Analysis. It contains estimates for mothball of the Bannister Complex with a $1M per year caretaker status cost throughout the scope of this study; a partial facility reuse cost for calculations of remaining in the Bannister Complex, and two strategies for disposition of the Complex, one with demolition and remediation, the latter with a partial positive cash flow for sale of the property. Table 4-8 below contains the source data that is used in site spreadsheets. This cost is applicable for all options.
• KC Status Quo: This worksheet provides a Bannister baseline developed for this study by Honeywell to show what expenses would look like spread among the areas of interest specified in the statement of work and based against expected budgets as outlined in the FYNSP. These data were used as a baseline for manipulation in this study.
Selection of Variables and Ranges for Sensitivity Analysis
• General Assumptions: The General Assumptions worksheet is the control panel of the model. From this worksheet CB manipulates most of the data in the workbook. Table 4-3 illustrates the quantity of manipulated variables (shaded green) and non-manipulated variables for this study.
Revision 2 41 October 2007
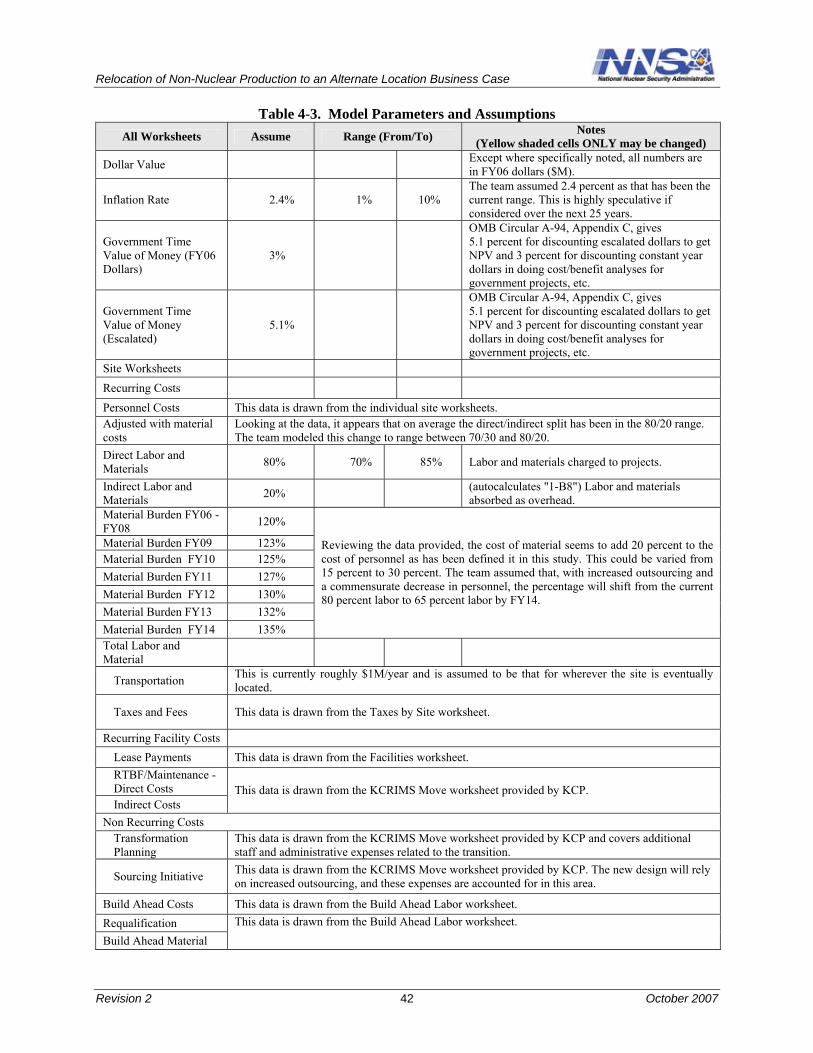
Relocation of Non-Nuclear Production to an Alternate Location Business Case
Table 4-3. Model Parameters and Assumptions All Worksheets Assume Range (From/To) Notes
(Yellow shaded cells ONLY may be changed)
Dollar Value Except where specifically noted, all numbers are in FY06 dollars ($M).
Inflation Rate 2.4% 1% 10% The team assumed 2.4 percent as that has been the current range. This is highly speculative if considered over the next 25 years.
Government Time Value of Money (FY06 Dollars)
3%
OMB Circular A-94, Appendix C, gives 5.1 percent for discounting escalated dollars to get NPV and 3 percent for discounting constant year dollars in doing cost/benefit analyses for government projects, etc.
Government Time Value of Money (Escalated)
5.1%
OMB Circular A-94, Appendix C, gives 5.1 percent for discounting escalated dollars to get NPV and 3 percent for discounting constant year dollars in doing cost/benefit analyses for government projects, etc.
Site Worksheets Recurring Costs
Personnel Costs This data is drawn from the individual site worksheets. Adjusted with material costs
Looking at the data, it appears that on average the direct/indirect split has been in the 80/20 range. The team modeled this change to range between 70/30 and 80/20.
Direct Labor and Materials 80% 70% 85% Labor and materials charged to projects.
Indirect Labor and Materials 20% (autocalculates "1-B8") Labor and materials
absorbed as overhead. Material Burden FY06 - FY08 120%
Reviewing the data provided, the cost of material seems to add 20 percent to the cost of personnel as has been defined it in this study. This could be varied from 15 percent to 30 percent. The team assumed that, with increased outsourcing and a commensurate decrease in personnel, the percentage will shift from the current 80 percent labor to 65 percent labor by FY14.
Material Burden FY09 123% Material Burden FY10 125% Material Burden FY11 127% Material Burden FY12 130% Material Burden FY13 132% Material Burden FY14 135% Total Labor and Material
Transportation This is currently roughly $1M/year and is assumed to be that for wherever the site is eventually located.
Taxes and Fees This data is drawn from the Taxes by Site worksheet.
Recurring Facility Costs Lease Payments This data is drawn from the Facilities worksheet. RTBF/Maintenance Direct Costs This data is drawn from the KCRIMS Move worksheet provided by KCP. Indirect Costs
Non Recurring Costs Transformation Planning
This data is drawn from the KCRIMS Move worksheet provided by KCP and covers additional staff and administrative expenses related to the transition.
Sourcing Initiative This data is drawn from the KCRIMS Move worksheet provided by KCP. The new design will rely on increased outsourcing, and these expenses are accounted for in this area.
Build Ahead Costs This data is drawn from the Build Ahead Labor worksheet. Requalification This data is drawn from the Build Ahead Labor worksheet. Build Ahead Material
Revision 2 42 October 2007
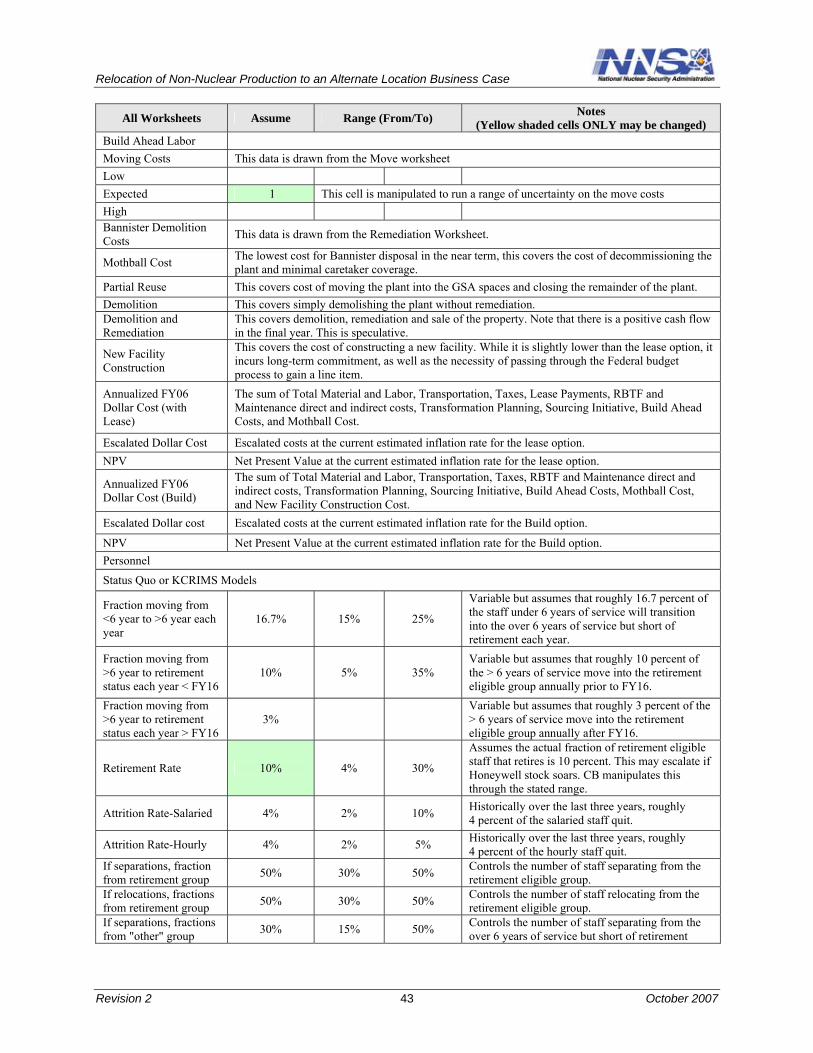
Relocation of Non-Nuclear Production to an Alternate Location Business Case
All Worksheets Assume Range (From/To) Notes (Yellow shaded cells ONLY may be changed)
Build Ahead Labor Moving Costs This data is drawn from the Move worksheet Low Expected 1 This cell is manipulated to run a range of uncertainty on the move costs High Bannister Demolition Costs This data is drawn from the Remediation Worksheet.
Mothball Cost The lowest cost for Bannister disposal in the near term, this covers the cost of decommissioning the plant and minimal caretaker coverage.
Partial Reuse This covers cost of moving the plant into the GSA spaces and closing the remainder of the plant. Demolition This covers simply demolishing the plant without remediation. Demolition and Remediation
This covers demolition, remediation and sale of the property. Note that there is a positive cash flow in the final year. This is speculative.
New Facility Construction
This covers the cost of constructing a new facility. While it is slightly lower than the lease option, it incurs long-term commitment, as well as the necessity of passing through the Federal budget process to gain a line item.
Annualized FY06 Dollar Cost (with Lease)
The sum of Total Material and Labor, Transportation, Taxes, Lease Payments, RBTF and Maintenance direct and indirect costs, Transformation Planning, Sourcing Initiative, Build Ahead Costs, and Mothball Cost.
Escalated Dollar Cost Escalated costs at the current estimated inflation rate for the lease option. NPV Net Present Value at the current estimated inflation rate for the lease option.
Annualized FY06 Dollar Cost (Build)
The sum of Total Material and Labor, Transportation, Taxes, RBTF and Maintenance direct and indirect costs, Transformation Planning, Sourcing Initiative, Build Ahead Costs, Mothball Cost, and New Facility Construction Cost.
Escalated Dollar cost Escalated costs at the current estimated inflation rate for the Build option.
NPV Net Present Value at the current estimated inflation rate for the Build option. Personnel
Status Quo or KCRIMS Models
Fraction moving from <6 year to >6 year each year
16.7% 15% 25%
Variable but assumes that roughly 16.7 percent of the staff under 6 years of service will transition into the over 6 years of service but short of retirement each year.
Fraction moving from >6 year to retirement status each year < FY16
10% 5% 35% Variable but assumes that roughly 10 percent of the > 6 years of service move into the retirement eligible group annually prior to FY16.
Fraction moving from >6 year to retirement status each year > FY16
3% Variable but assumes that roughly 3 percent of the > 6 years of service move into the retirement eligible group annually after FY16.
Retirement Rate 10% 4% 30%
Assumes the actual fraction of retirement eligible staff that retires is 10 percent. This may escalate if Honeywell stock soars. CB manipulates this through the stated range.
Attrition Rate-Salaried 4% 2% 10% Historically over the last three years, roughly 4 percent of the salaried staff quit.
Attrition Rate-Hourly 4% 2% 5% Historically over the last three years, roughly 4 percent of the hourly staff quit.
If separations, fraction from retirement group 50% 30% 50% Controls the number of staff separating from the
retirement eligible group. If relocations, fractions from retirement group 50% 30% 50% Controls the number of staff relocating from the
retirement eligible group. If separations, fractions from "other" group 30% 15% 50% Controls the number of staff separating from the
over 6 years of service but short of retirement
Revision 2 43 October 2007

Relocation of Non-Nuclear Production to an Alternate Location Business Case
All Worksheets Assume Range (From/To) Notes (Yellow shaded cells ONLY may be changed)
eligible group.
If relocations, fractions from "other" group 30% 15% 50%
Controls the number of staff relocating from the over 6 years of service but short of retirement eligible group.
Distant Location Model Fractions used to fine tune the distant location model.
Retirement Rates It is assumed that various rates will fluctuate during the different phases of a distant location move. These percentages may be adjusted below:
Before announcement and after move KC Salaried Staff 10% 4% 30% Fraction of retirement eligible Kansas City (KC)
staff that retire prior to announcement of a distant location move, or after the move. KC Hourly Staff 10% 4% 30%
Distant Location Salaried Staff 10% 0% 15%
Fraction of retirement eligible distant location staff that retire after the move. Distant Location Hourly
Staff 10% 0% 15%
Announcement Phase
Retiring KC Salaried Staff Announcement Phase
40% 10% 50% Fraction of retirement eligible KC staff that retire after the announcement of a distant location move. Retiring KC Hourly
Staff Announcement Phase
40% 10% 50%
Transition Phase
Retiring KC Salaried Staff Transition Phase 50% 30% 60%
Fraction of retirement eligible KC staff that retire during the instability of the move preparations. Retiring KC Hourly
Staff Transition Phase 50% 30% 60%
Move Phase
Retiring KC Salaried Staff Move Phase 90% 80% 100%
Fraction of retirement eligible KC staff that retire during the move. Retiring KC Hourly
Staff Move Phase 90% 80% 100%
Attrition Rates
Before announcement and after move KC Salaried Staff 4% 2% 10% Fraction of KC staff that quit prior to
announcement of a distant location move, or after the move.KC Hourly Staff 4% 2% 10%
Distant Location Salaried Staff 0% 0% 10%
Fraction of distant location staff that quit after the move.Distant Location Hourly
Staff 0% 0% 10%
Announcement Phase
Revision 2 44 October 2007
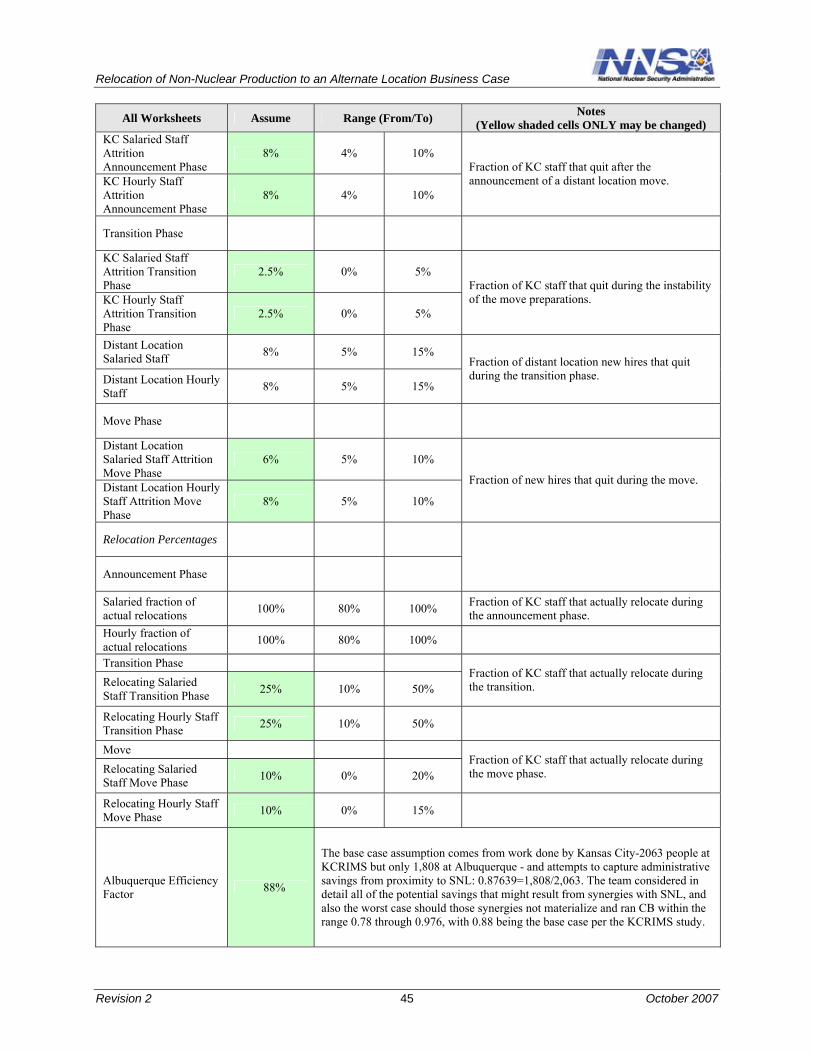
Relocation of Non-Nuclear Production to an Alternate Location Business Case
All Worksheets Assume Range (From/To) Notes (Yellow shaded cells ONLY may be changed)
KC Salaried Staff Attrition Announcement Phase
8% 4% 10% Fraction of KC staff that quit after the announcement of a distant location move. KC Hourly Staff
Attrition Announcement Phase
8% 4% 10%
Transition Phase
KC Salaried Staff Attrition Transition Phase
2.5% 0% 5% Fraction of KC staff that quit during the instability of the move preparations. KC Hourly Staff
Attrition Transition Phase
2.5% 0% 5%
Distant Location Salaried Staff 8% 5% 15%
Fraction of distant location new hires that quit during the transition phase. Distant Location Hourly
Staff 8% 5% 15%
Move Phase
Distant Location Salaried Staff Attrition Move Phase
6% 5% 10%
Fraction of new hires that quit during the move. Distant Location Hourly Staff Attrition Move Phase
8% 5% 10%
Relocation Percentages
Announcement Phase
Salaried fraction of actual relocations 100% 80% 100% Fraction of KC staff that actually relocate during
the announcement phase. Hourly fraction of actual relocations 100% 80% 100%
Transition Phase Fraction of KC staff that actually relocate during the transition. Relocating Salaried
Staff Transition Phase 25% 10% 50%
Relocating Hourly Staff Transition Phase 25% 10% 50%
Move Fraction of KC staff that actually relocate during the move phase.Relocating Salaried
Staff Move Phase 10% 0% 20%
Relocating Hourly Staff Move Phase 10% 0% 15%
Albuquerque Efficiency Factor 88%
The base case assumption comes from work done by Kansas City-2063 people at KCRIMS but only 1,808 at Albuquerque - and attempts to capture administrative savings from proximity to SNL: 0.87639=1,808/2,063. The team considered in detail all of the potential savings that might result from synergies with SNL, and also the worst case should those synergies not materialize and ran CB within the range 0.78 through 0.976, with 0.88 being the base case per the KCRIMS study.
Revision 2 45 October 2007
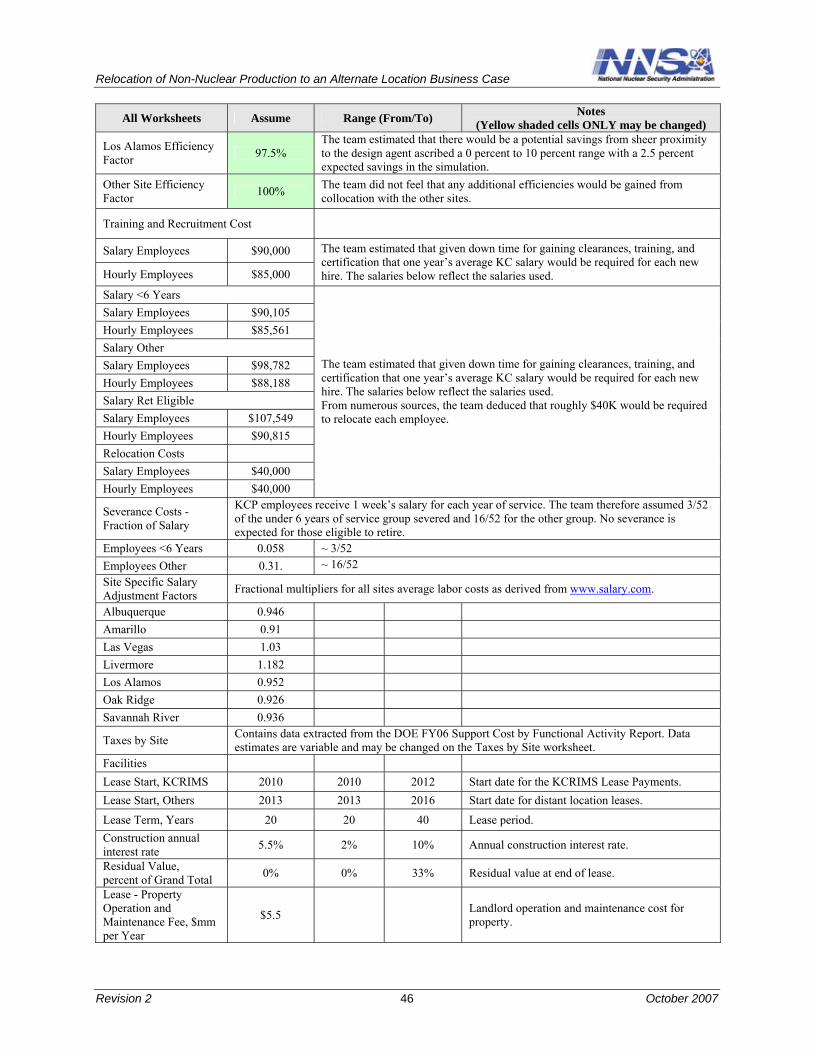
Relocation of Non-Nuclear Production to an Alternate Location Business Case
All Worksheets Assume Range (From/To) Notes (Yellow shaded cells ONLY may be changed)
Los Alamos Efficiency Factor 97.5%
The team estimated that there would be a potential savings from sheer proximity to the design agent ascribed a 0 percent to 10 percent range with a 2.5 percent expected savings in the simulation.
Other Site Efficiency Factor 100% The team did not feel that any additional efficiencies would be gained from
collocation with the other sites.
Training and Recruitment Cost
Salary Employees $90,000 The team estimated that given down time for gaining clearances, training, and certification that one year’s average KC salary would be required for each new hire. The salaries below reflect the salaries used. Hourly Employees $85,000
Salary <6 Years
The team estimated that given down time for gaining clearances, training, and certification that one year’s average KC salary would be required for each new hire. The salaries below reflect the salaries used. From numerous sources, the team deduced that roughly $40K would be required to relocate each employee.
Salary Employees $90,105 Hourly Employees $85,561 Salary Other Salary Employees $98,782 Hourly Employees $88,188 Salary Ret Eligible Salary Employees $107,549 Hourly Employees $90,815 Relocation Costs Salary Employees $40,000 Hourly Employees $40,000
Severance Costs - Fraction of Salary
KCP employees receive 1 week’s salary for each year of service. The team therefore assumed 3/52 of the under 6 years of service group severed and 16/52 for the other group. No severance is expected for those eligible to retire.
Employees <6 Years 0.058 ~ 3/52 Employees Other 0.31. ~ 16/52 Site Specific Salary Adjustment Factors Fractional multipliers for all sites average labor costs as derived from www.salary.com.
Albuquerque 0.946 Amarillo 0.91 Las Vegas 1.03 Livermore 1.182 Los Alamos 0.952 Oak Ridge 0.926 Savannah River 0.936
Taxes by Site Contains data extracted from the DOE FY06 Support Cost by Functional Activity Report. Data estimates are variable and may be changed on the Taxes by Site worksheet.
Facilities Lease Start, KCRIMS 2010 2010 2012 Start date for the KCRIMS Lease Payments. Lease Start, Others 2013 2013 2016 Start date for distant location leases. Lease Term, Years 20 20 40 Lease period. Construction annual interest rate 5.5% 2% 10% Annual construction interest rate.
Residual Value, percent of Grand Total 0% 0% 33% Residual value at end of lease.
Lease - Property Operation and Maintenance Fee, $mm per Year
$5.5 Landlord operation and maintenance cost for property.
Revision 2 46 October 2007
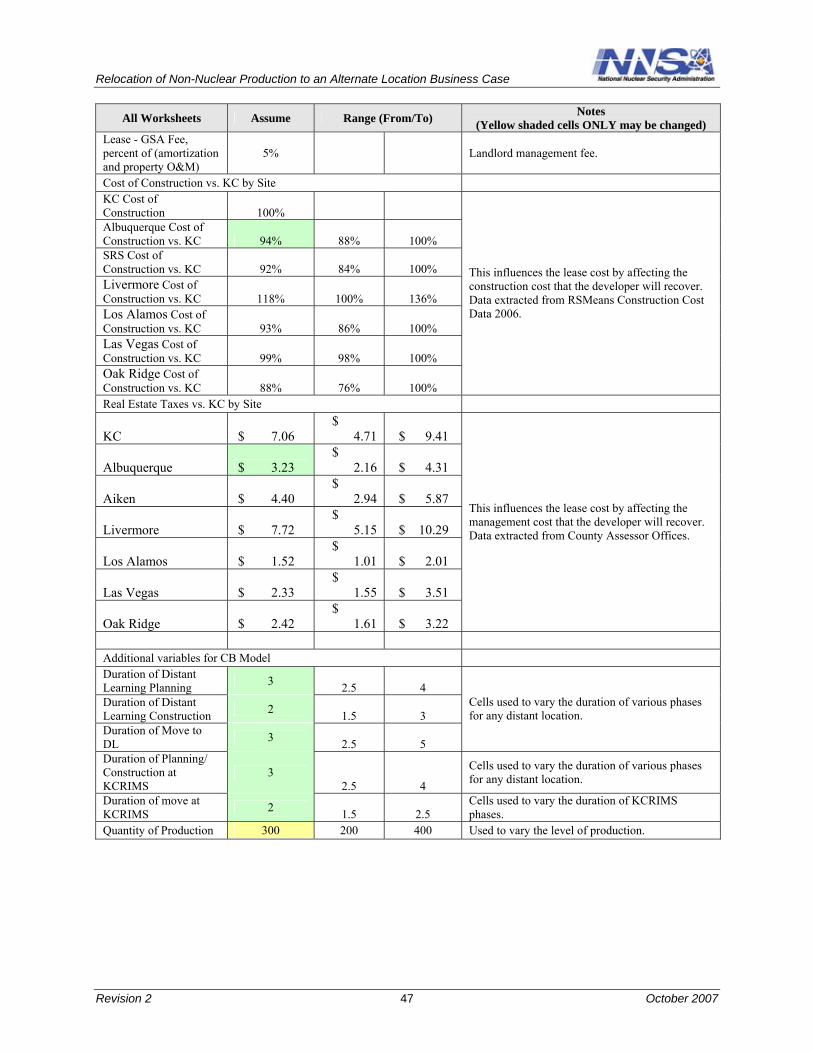
Relocation of Non-Nuclear Production to an Alternate Location Business Case
All Worksheets Assume Range (From/To) Notes (Yellow shaded cells ONLY may be changed)
Lease - GSA Fee, percent of (amortization and property O&M)
5% Landlord management fee.
Cost of Construction vs. KC by Site KC Cost of Construction 100%
This influences the lease cost by affecting the construction cost that the developer will recover. Data extracted from RSMeans Construction Cost Data 2006.
Albuquerque Cost of Construction vs. KC 94% 88% 100% SRS Cost of Construction vs. KC 92% 84% 100% Livermore Cost of Construction vs. KC 118% 100% 136% Los Alamos Cost of Construction vs. KC 93% 86% 100% Las Vegas Cost of Construction vs. KC 99% 98% 100% Oak Ridge Cost of Construction vs. KC 88% 76% 100% Real Estate Taxes vs. KC by Site
KC $ 7.06 $
4.71 $ 9.41
This influences the lease cost by affecting the management cost that the developer will recover. Data extracted from County Assessor Offices.
Albuquerque $ 3.23 $
2.16 $ 4.31
Aiken $ 4.40 $
2.94 $ 5.87
Livermore $ 7.72 $
5.15 $ 10.29
Los Alamos $ 1.52 $
1.01 $ 2.01
Las Vegas $ 2.33 $
1.55 $ 3.51
Oak Ridge $ 2.42 $
1.61 $ 3.22
Additional variables for CB Model Duration of Distant Learning Planning 3
2
3
3
2
2.5 4 Cells used to vary the duration of various phases for any distant location.
Duration of Distant Learning Construction 1.5 3 Duration of Move to DL 2.5 5 Duration of Planning/ Construction at KCRIMS 2.5 4
Cells used to vary the duration of various phases for any distant location.
Duration of move at KCRIMS 1.5 2.5
Cells used to vary the duration of KCRIMS phases.
Quantity of Production 300 200 400 Used to vary the level of production.
Revision 2 47 October 2007
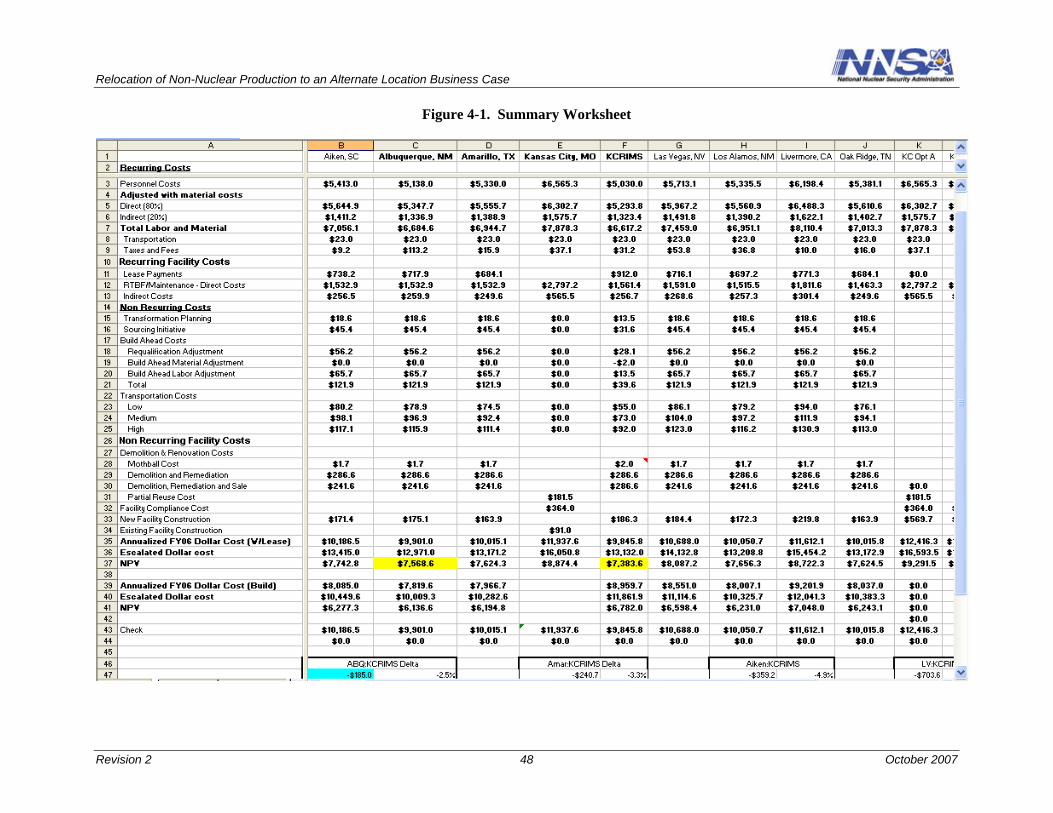
Relocation of Non-Nuclear Production to an Alternate Location Business Case
Figure 4-1. Summary Worksheet
Revision 2 48 October 2007
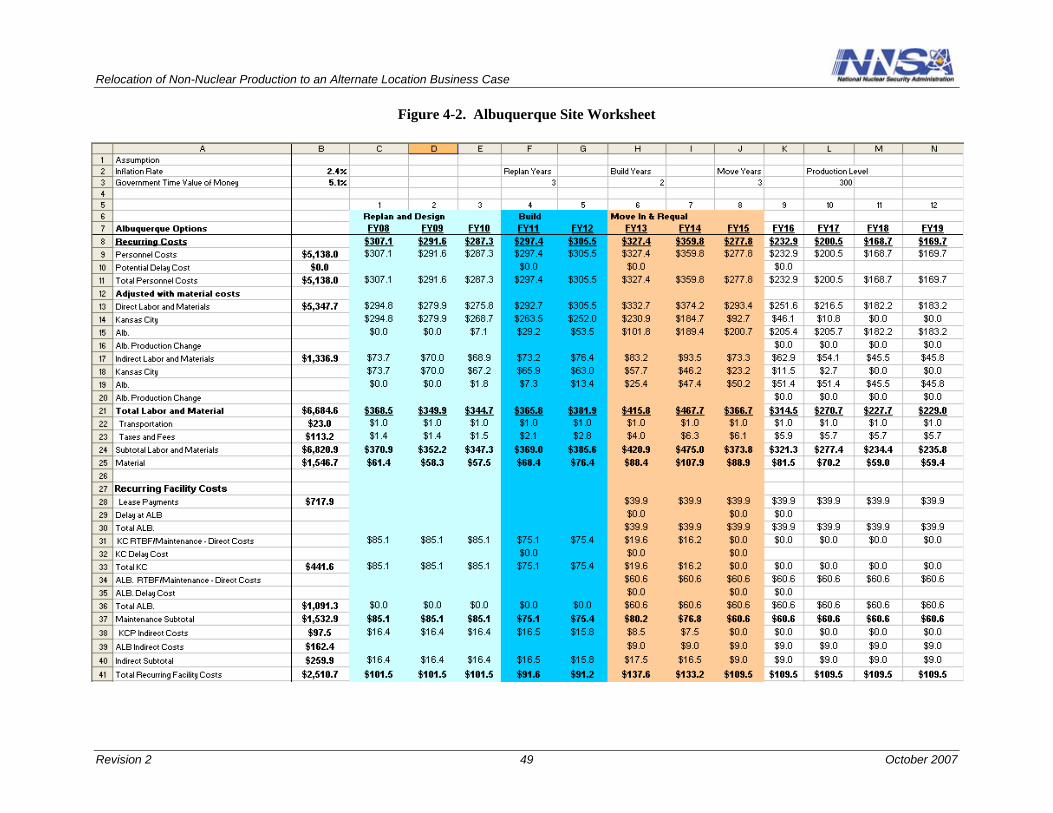
Relocation of Non-Nuclear Production to an Alternate Location Business Case
Figure 4-2. Albuquerque Site Worksheet
Revision 2 49 October 2007
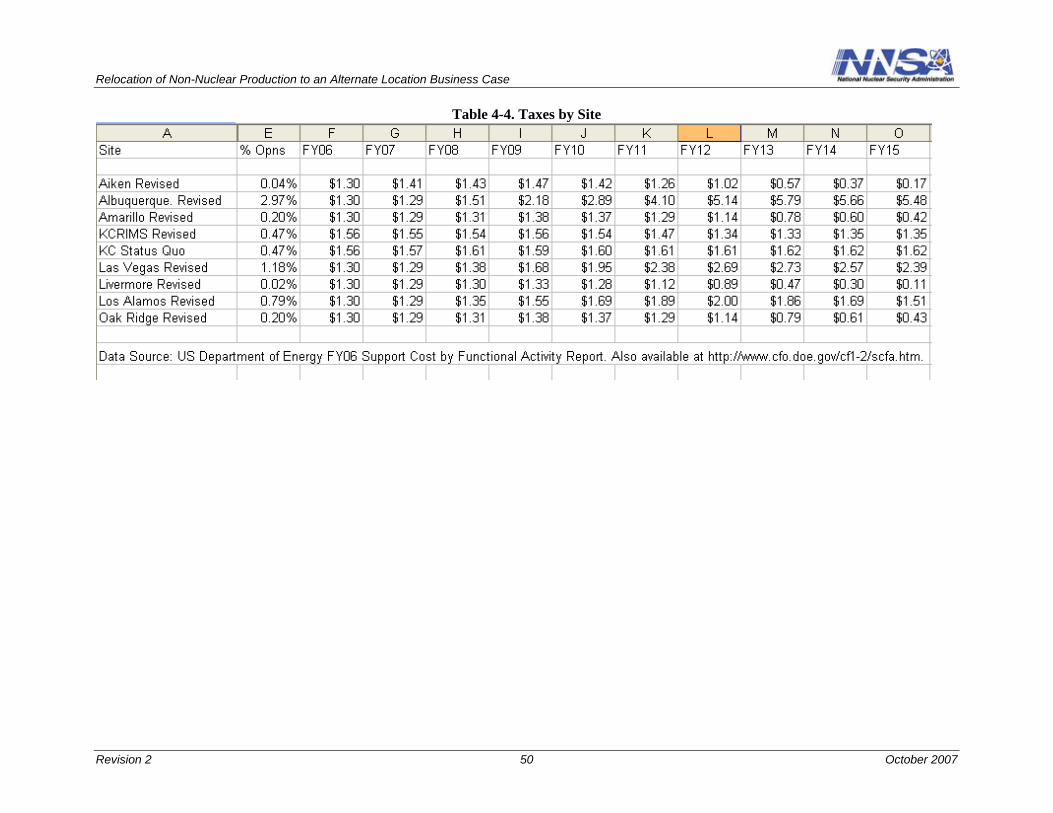
Relocation of Non-Nuclear Production to an Alternate Location Business Case
Table 4-4. Taxes by Site
Revision 2 50 October 2007

Relocation of Non-Nuclear Production to an Alternate Location Business Case
Table 4-5. Facilities Worksheet
Revision 2 51 October 2007
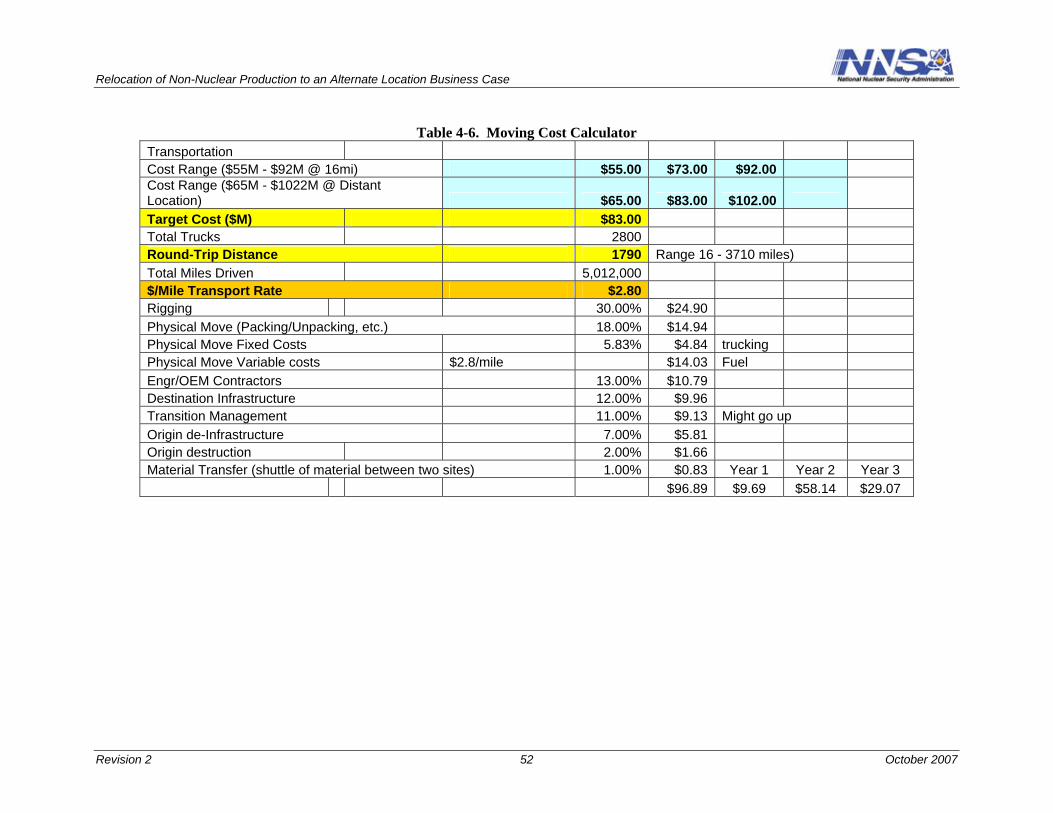
Relocation of Non-Nuclear Production to an Alternate Location Business Case
Table 4-6. Moving Cost Calculator Transportation Cost Range ($55M - $92M @ 16mi) $55.00 $73.00 $92.00 Cost Range ($65M - $1022M @ Distant Location) $65.00 $83.00 $102.00 Target Cost ($M) $83.00 Total Trucks 2800 Round-Trip Distance 1790 Range 16 - 3710 miles) Total Miles Driven 5,012,000 $/Mile Transport Rate $2.80 Rigging 30.00% $24.90 Physical Move (Packing/Unpacking, etc.) 18.00% $14.94 Physical Move Fixed Costs 5.83% $4.84 trucking Physical Move Variable costs $2.8/mile $14.03 Fuel Engr/OEM Contractors 13.00% $10.79 Destination Infrastructure 12.00% $9.96 Transition Management 11.00% $9.13 Might go up Origin de-Infrastructure 7.00% $5.81 Origin destruction 2.00% $1.66 Material Transfer (shuttle of material between two sites) 1.00% $0.83 Year 1 Year 2 Year 3
$96.89 $9.69 $58.14 $29.07
Revision 2 52 October 2007
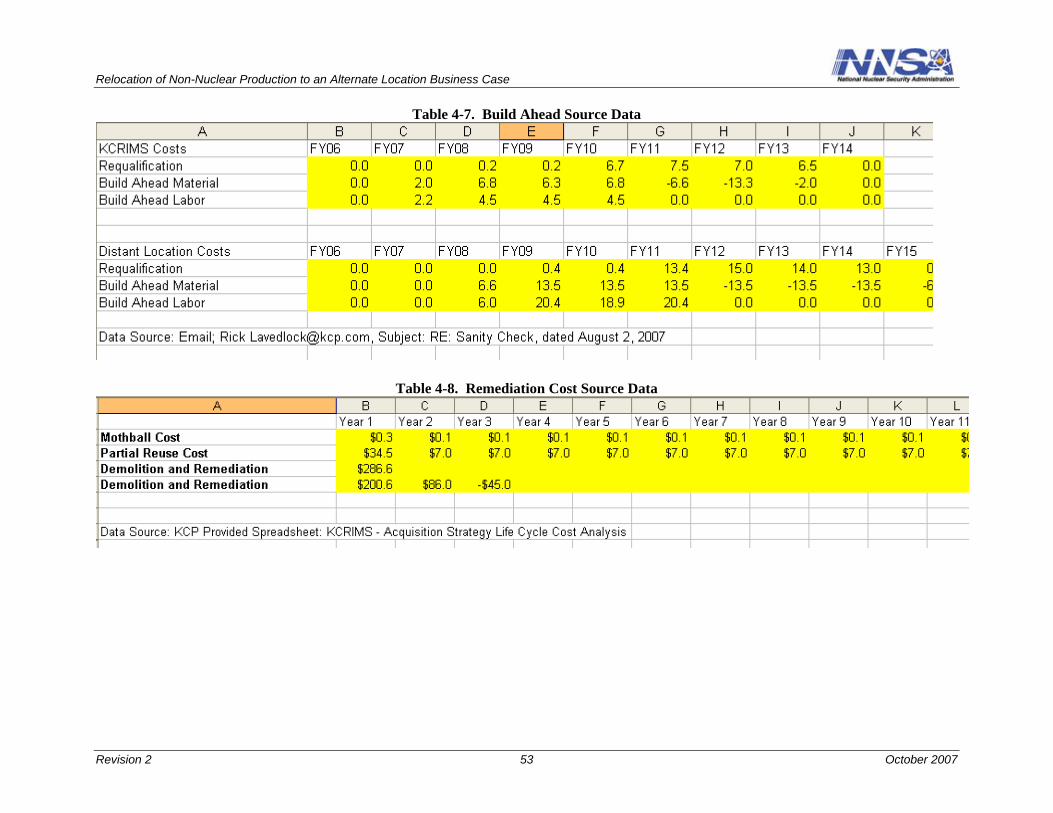
Relocation of Non-Nuclear Production to an Alternate Location Business Case
Table 4-7. Build Ahead Source Data
Table 4-8. Remediation Cost Source Data
Revision 2 53 October 2007

Relocation of Non-Nuclear Production to an Alternate Location Business Case
This page intentionally blank.
Revision 2 54 October 2007
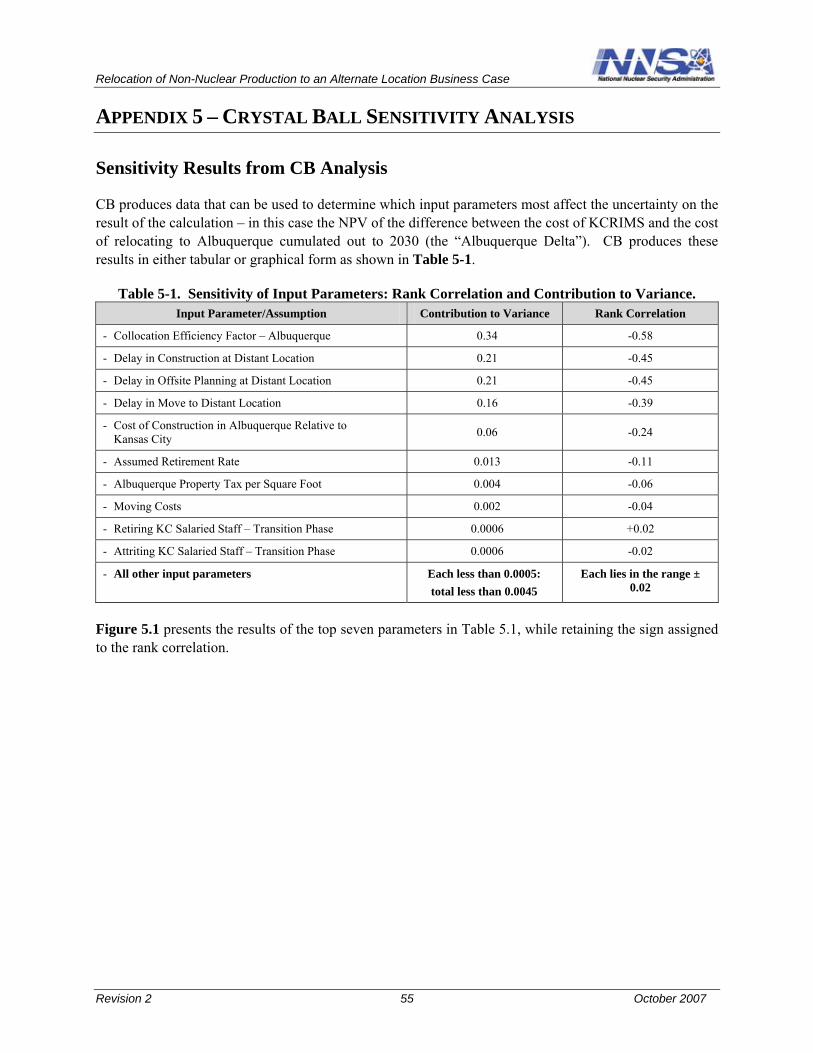
Relocation of Non-Nuclear Production to an Alternate Location Business Case
APPENDIX 5 – CRYSTAL BALL SENSITIVITY ANALYSIS
Sensitivity Results from CB Analysis
CB produces data that can be used to determine which input parameters most affect the uncertainty on the result of the calculation – in this case the NPV of the difference between the cost of KCRIMS and the cost of relocating to Albuquerque cumulated out to 2030 (the “Albuquerque Delta”). CB produces these results in either tabular or graphical form as shown in Table 5-1.
Table 5-1. Sensitivity of Input Parameters: Rank Correlation and Contribution to Variance. Input Parameter/Assumption Contribution to Variance Rank Correlation
- Collocation Efficiency Factor – Albuquerque 0.34 -0.58
- Delay in Construction at Distant Location 0.21 -0.45
- Delay in Offsite Planning at Distant Location 0.21 -0.45
- Delay in Move to Distant Location 0.16 -0.39
- Cost of Construction in Albuquerque Relative to Kansas City 0.06 -0.24
- Assumed Retirement Rate 0.013 -0.11
- Albuquerque Property Tax per Square Foot 0.004 -0.06
- Moving Costs 0.002 -0.04
- Retiring KC Salaried Staff – Transition Phase 0.0006 +0.02
- Attriting KC Salaried Staff – Transition Phase 0.0006 -0.02
- All other input parameters Each less than 0.0005: total less than 0.0045
Each lies in the range ± 0.02
Figure 5.1 presents the results of the top seven parameters in Table 5.1, while retaining the sign assigned to the rank correlation.
Revision 2 55 October 2007
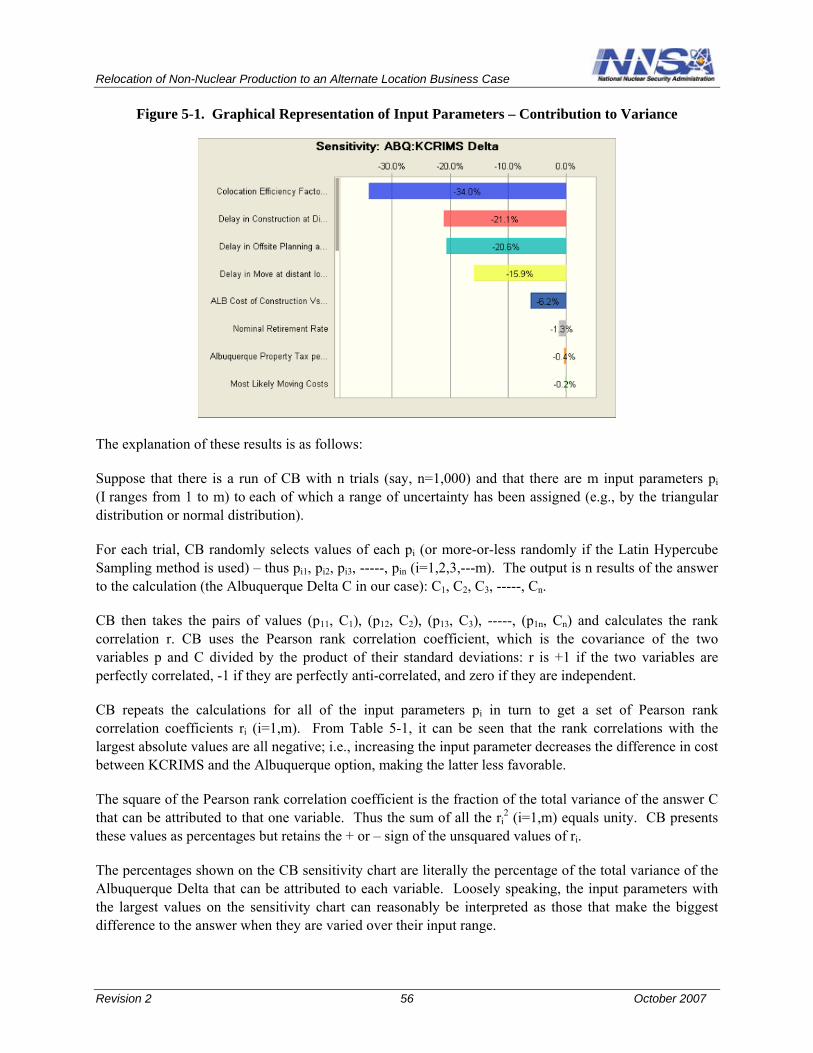
Relocation of Non-Nuclear Production to an Alternate Location Business Case
Figure 5-1. Graphical Representation of Input Parameters – Contribution to Variance
The explanation of these results is as follows:
Suppose that there is a run of CB with n trials (say, n=1,000) and that there are m input parameters pi
(I ranges from 1 to m) to each of which a range of uncertainty has been assigned (e.g., by the triangular distribution or normal distribution).
For each trial, CB randomly selects values of each pi (or more-or-less randomly if the Latin Hypercube Sampling method is used) – thus pi1, pi2, pi3, -----, pin (i=1,2,3,---m). The output is n results of the answer to the calculation (the Albuquerque Delta C in our case): C1, C2, C3, -----, Cn.
CB then takes the pairs of values (p11, C1), (p12, C2), (p13, C3), -----, (p1n, Cn) and calculates the rank correlation r. CB uses the Pearson rank correlation coefficient, which is the covariance of the two variables p and C divided by the product of their standard deviations: r is +1 if the two variables are perfectly correlated, -1 if they are perfectly anti-correlated, and zero if they are independent.
CB repeats the calculations for all of the input parameters pi in turn to get a set of Pearson rank correlation coefficients ri (i=1,m). From Table 5-1, it can be seen that the rank correlations with the largest absolute values are all negative; i.e., increasing the input parameter decreases the difference in cost between KCRIMS and the Albuquerque option, making the latter less favorable.
The square of the Pearson rank correlation coefficient is the fraction of the total variance of the answer C that can be attributed to that one variable. Thus the sum of all the ri
2 (i=1,m) equals unity. CB presents these values as percentages but retains the + or – sign of the unsquared values of ri.
The percentages shown on the CB sensitivity chart are literally the percentage of the total variance of the Albuquerque Delta that can be attributed to each variable. Loosely speaking, the input parameters with the largest values on the sensitivity chart can reasonably be interpreted as those that make the biggest difference to the answer when they are varied over their input range.
Revision 2 56 October 2007
Relocation of Non-Nuclear Production to an Alternate Location Business Case
Most notable about Table 5-1 and Figure 5-1 is that the top five input parameters contribute more than 97.5 percent to the variance of the Albuquerque Delta. What this means is that the analyst could assume that there is no uncertainty associated with any but the top five variables and the outcome of the CB analysis would not change much.
Revision 2 57 October 2007

Relocation of Non-Nuclear Production to an Alternate Location Business Case
This page intentionally blank.
Revision 2 58 October 2007
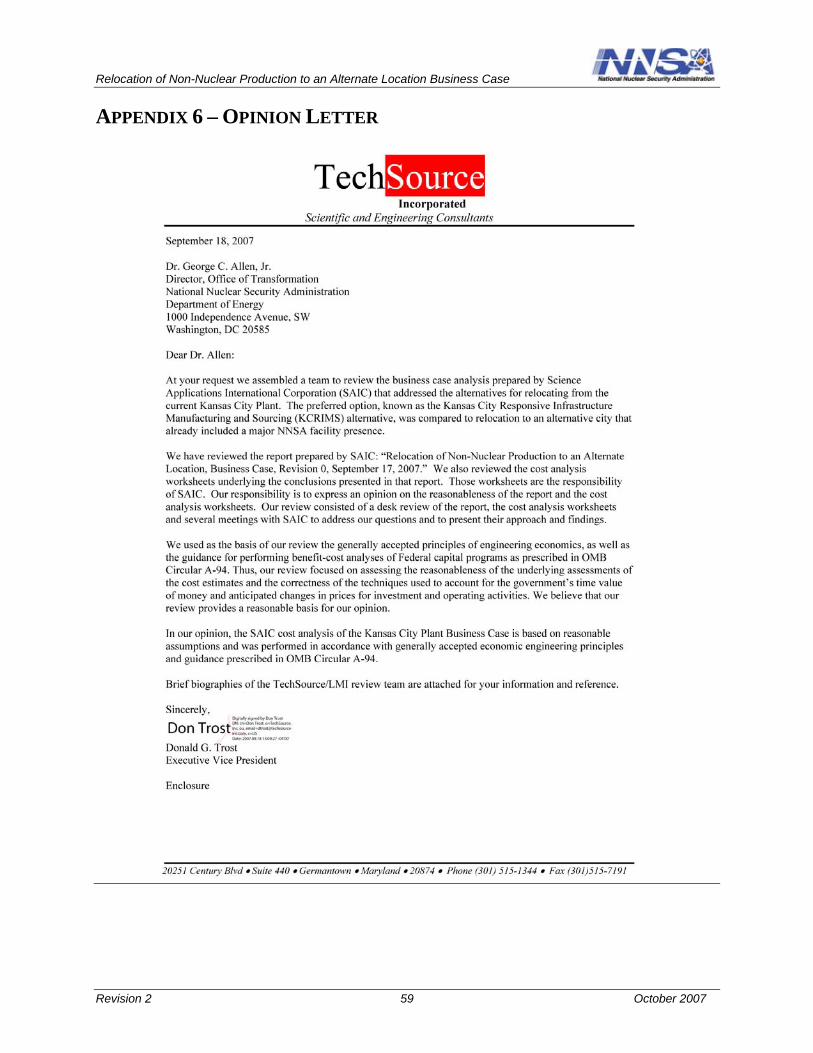
Relocation of Non-Nuclear Production to an Alternate Location Business Case
APPENDIX 6 – OPINION LETTER
Revision 2 59 October 2007
Relocation of Non-Nuclear Production to an Alternate Location Business Case
Revision 2 60 October 2007
Relocation of Non-Nuclear Production to an Alternate Location Business Case
APPENDIX 7 - VITAE
LESLIE A. BOWEN
EDUCATION BA, Physics, Mount Holyoke College, 1974 M.B.A., Corporate Finance, University of Chicago, 1983
LICENSES Senior Reactor Operator License, Commonwealth Edison, Zion Nuclear Power Plant (1976 – 1982)
SECURITY CLEARANCE DOE "Q"
WORK SUMMARY Ms. Bowen has 30 years experience in project and program management, regulatory analysis and licensing, and plant operations. Ms. Bowen spent the first half of her career in support of commercial nuclear power industry beginning as a shift foreman and licensed senior reactor operator at the Zion Nuclear Power Plant, a two-unit Westinghouse pressurized water reactor plant, continuing with licensing for the Byron and Braidwood power plants, and finally providing rate case testimony preparation and litigation support for commercial nuclear utilities. In recent past, Ms. Bowen managed a competitive bid process for disposition of commercial nuclear assets for the U.S. Department of Agriculture, Rural Utilities Service. The next fifteen years of her career, continuing to present, has been in support of the U.S. Department of Energy, primarily for the National Nuclear Security Administration nuclear nonproliferation and defense programs.
PROFESSIONAL EXPERIENCE: SAIC (1998 - present) Senior Regulatory Engineer U. S. Department of Energy, Office of Stockpile Technology Manage project team in support of the Deputy Assistant Deputy Administrator of Military Application and Stockpile Operations and other Federal staff in the evaluation, selection, and management of Readiness Campaign projects; input to program documents; process improvement; implementation of management processes; and day-to-day program office support, including security and records management.
U. S. Department of Agriculture, Rural Utilities Service Assisted the USDA acquisition process for disposition of an ownership share in the Catawba Nuclear Station including preparation of request for bid, collection and monitoring of due diligence documentation, coordination of bidder questions and responses, evaluation and ranking of bids, and support for negotiation with the selected bidders.
U. S. Department of Energy, Office of Fissile Materials Disposition Provide program management support to Headquarters staff in the management and execution of the Pit Disassembly and Conversion Facility (PDCF) project. Provide PDCF regulatory review in areas of DOE order compliance, congressional legislation, and integrated safety program implementation. Coordinate review of and advise on key issues, recruit and manage staff working on-site, draft and produce programmatic documents, and provide action item tracking.
Revision 2 61 October 2007

Relocation of Non-Nuclear Production to an Alternate Location Business Case
U.S. Department of Energy, Office of Nuclear Energy, Science and Technology Assisted in the planning and preparation of the annual workforce and succession plan and quarterly updates; preparing human capital planning responses to meet the President’s Management Agenda and satisfy OMB requirements on an ongoing basis beginning in FY 2002; and records management assessment in FY 2007.
U.S. Department of Energy, Office of Civilian Radioactive Waste Management, Yucca Mountain Site Characterization Project
Assisted implementation of the OCRWM information technology capital planning and investment control (CPIC) process on an ongoing and sustainable basis including preparation of a project procedure.. Assisted in process development and implementation of the project’s IT CPIC process for FY 2002 as required by the Clinger-Cohen legislation, the President’s Management Agenda, and OMB Circulars A11 and A-130. Prepared the FY2002 annual OCRWM IT portfolio report per OMB Circular A-11 for OCRWM submittal to DOE and OMB; this portfolio is viewed as singularly responsive to OMB requirements within DOE.
During transition of the Yucca Mountain M&O contract to the Bechtel SAIC Company, LLC. prepared “Enterprise Architecture and Information Sharing Strategic Plan and the Electronic Document Management System Implementation Plan”.
Prior to that, developed strategy, policy and procedures for document preparation to satisfy criteria of the Nuclear Regulatory Commission (NRC) and other reviewing bodies during the pre-license and license phase of the Yucca Mountain Project. Following a management and systems analysis, recommendations were made for improving the data and document information systems and processes. This work focused on meeting regulatory requirements in site recommendation and licensing application document processes including developing policy for technical document preparation, strategic plan for document control process and supporting systems and strategic plan for other information management systems.
BUTTONWOOD CONSULTING, INC (1997 - 2000)
Sandia National Laboratory, U.S. Nuclear Regulatory Commission (NRC), Improved Human Reliability Method Analyzed nuclear power plant event reports to identify and categorize significant human error contribution to the event. Assisted in finalizing guidelines on incorporating the human contribution to nuclear plant risk in probabilistic risk assessments.
Electric Power Research Institute, Human Performance Indicators Conducted survey of North American industries regarding the monitoring of indicators to measure or predict human behavior in order to develop a framework, with particular application to commercial nuclear power operations, for anticipating and resolving potential problems associated with human performance before an event occurs.
Computer Software Development Co., Ltd., Japan Prepared “interactive” Event Sequence Diagrams (ESD) to use as in-plant risk analysis communication tools. Surveyed risk communication activities within nuclear power plants in the U.S. and Europe and developed guidelines on use of probabilistic safety analyses at all levels of the nuclear power plant organization. Co-authored a feasibility study on the use of formal procedures in the United States for conduct of probabilistic risk assessment walkdowns and a general procedure for performing these
Revision 2 62 October 2007
Relocation of Non-Nuclear Production to an Alternate Location Business Case
walkdowns. Prepared detailed walk-down procedure guidelines for use by nuclear power plants. Prepared risk communication seminar for Japan Power Engineering and Inspection Corporation (JAPEIC) providing a number of papers and a lengthy bibliography on public and technical risk communication.
FLUOR DANIEL (1987 - 1997) Principal Project Engineer
U.S. Department of Energy, Fissile Materials Disposition Program Assisted the U.S. DOE Office of Fissile Materials Disposition in documenting the technical bases for the “Storage and Disposition of Weapons-Usable Fissile Materials Final Programmatic Environmental Impact Statement” (December 1996; Record of Decision, January 1997). Managed the preparation of feasibility design reports for facilities that would provide long-term storage of fissile materials at a number of U.S. DOE sites. Provided analysis of the cost and schedule impact of Nuclear Regulatory Commission (NRC) licensing for facilities required for the disposition and storage of weapons-usable fissile material (co-author; NRC Licensing Processes Potentially Applicable to Storage and Disposition of Excess Plutonium, 1995). These analyses were used in joint DOE/NRC discussions in 1995. Coauthored a number of regulatory studies.
U. S. Department of Energy, Hanford Waste Vitrification Project (HWVP) The HWVP design provided for the immobilization of the high level waste resident in the tanks at the Hanford Reservation. Developed tank waste acceptance process activity reports and guidelines and established the bases of agreement with Westinghouse Hanford Company (WHC) and Richland DOE; coordinated the canister storage building systems integration and wind tunnel testing; created and maintained a systems integration matrix for the entire project; directed the preparation of pre-operational test procedures and system design descriptions.
Louisiana Energy Services Claiborne Enrichment Center Provided engineering and licensing support services for this first-of-a-kind one-step licensing by the Nuclear Regulatory Commission (NRC) of a uranium enrichment facility. The application was filed in early 1991, hearings were completed in 1995, and the Atomic Safety and Licensing Board partial initial decisions have been issued and appealed.
Commercial Nuclear Power Projects Provided project-engineering support to the San Onofre Nuclear Generating Station and the Diablo Canyon Nuclear Power Plant over several years. Provided litigation support services to the Shoreham Nuclear Power Plant and the Byron and Braidwood Nuclear Power Plants in their individual rate cases in front of the state commerce commissions.
Marketing Coordination Manager Directed Headquarters office marketing coordination functions that included sales document publication and production for all business units and staff support for line sales. Managed staff career and job development, budgets, and staffing.
Power Sector Sales Marketing Coordinator Supported sales staff in preparation of proposals and contracts and produced a series of ten training videos on cost-plus project execution and lessons learned.
THEODORE BARRY & ASSOCIATES (1983 - 1987)
Managing Associate
Litigation Support Services Established information management systems to organize litigation support materials used to analyze management process and substantiate expert testimony. Provided management process analysis for a
Revision 2 63 October 2007
Relocation of Non-Nuclear Production to an Alternate Location Business Case
series of retrospective audits, with associated technical reports and expert witness rate case testimony, for nuclear utilities including Louisiana Power & Light, Illinois Power Company, Southern California Edison, Public Service Indiana, and Houston Lighting and Power.
Organizational Analysis Nuclear organization studies and reports for the Omaha Public Power District and the New York Power Authority.
SELF-EMPLOYED - STUDENT (1982 - 1983)
Consultant ARD, Inc. - Surveyed Virginia Electric Power Company Surrey Plant operator emergency response time for a study in support of a human factors engineering design basis. INPO Training - Developed standard training guidelines for BWR and PWR control room operation. PLG, Inc. - Researched and co-authored probabilistic safety assessment study, Zion Nuclear Plant Residual Heat Removal PSA, for cold shutdown operation of the residual heat removal system at Commonwealth Edison's Zion Station.
COMMONWEALTH EDISON COMPANY (1974 - 1982)
Project Engineer Provided project-engineering support to the Byron and Braidwood nuclear power plant projects during Nuclear Regulatory Commission (NRC) licensing and construction phases. Contributor; Zion Probabilistic Safety Study, 1982. Maintained Senior Reactor Operator license. Completed PLG Probabilistic Risk Assessment Short Course.
Staff Assistant Reporting to the Vice President prepared regulatory reports, operating trend reports, and daily information reports for executive management. Provided licensing and hearing support for Zion spent fuel pool density racks and other proceedings. Maintained Senior Reactor Operator license.
Senior Reactor Operator/Shift Foreman Supervised control room and plant operating crews at the Zion Nuclear Power Plant. Worked rotating shifts. Maintained Senior Reactor Operator's license.
Training Instructor Trained station personnel in radiation protection and general safety. Taught operator licensee's basic science and systems classes. Prepared for and passed the Senior Reactor Operator's license examination.
MISCELLANEOUS: Member, American Nuclear Society Recipient, Fluor Daniel Star Award Recipient, Theodore Barry & Associates Chairman’s Cup Recipient, Mount Holyoke College Alumnae Medal of Honor
Revision 2 64 October 2007

Relocation of Non-Nuclear Production to an Alternate Location Business Case
JAMES R. CHAPMAN, PMP
EDUCATION - Cornell University B.S., Mechanical Engineering (1970)
CURRENT TITLE Project Management Consultant, self-employed, subcontractor to SAIC
PROFESSIONAL SUMMARY – Mr. Chapman is an independent project management consultant with extensive experience in project planning, cost estimating, cost model development, cost and schedule management, requirements analysis, project management infrastructure development, IT life-cycle development process, government program management and budgeting process, project leadership and best practices, project diagnosis and recovery, project management training and group facilitation. He has been a Project Management Institute (PMI) certified Project Management Professional (PMP) since 1995.
PROFESSIONAL EXPERIENCE Independent Project Management Consultant - (November 2000 to Present) Mr. Chapman has provided program management support, mentoring and training to the National Nuclear Security Administration to develop project charters, program plans, cost estimates and budgets, resource-loaded schedules, earned-value tracking, and issue papers for the Planning, Programming, Budgeting and Evaluation system. He has provided facilitation for Baldrige organizational process improvement initiatives. He has provided training and technical assistance to the FAA to improve effectiveness of overall project management and MS-Project scheduling activities, and develop a standard work breakdown structure and schedule templates to improve tracking of large, multi-year project integration efforts. Mr. Chapman developed a requirements baseline document and program plan for launching a new telecommunications service. He wrote a draft test plan for a large Web based information system for a city government. He developed and conducted a three-day project management training course for CIOs and IT managers for the State of Virginia. Mr. Chapman conducted project management training courses for numerous non-profit organizations and delivered several presentations to Project Management Institute chapter meetings on Principle Based Project Management and Scalable Methodologies.
Information Builders, Inc. - (November 1998 to November 2000) Senior Implementation Manager responsible for a 35 person software development team to test, deliver, performance tune, and win customer acceptance for a large client/server state-wide budgeting system; developed the project management methodology for a 300 person software consulting division; developed and conducted a 5 day project management training course; wrote a software development methodology incorporating software engineering best practices; conducted Joint Application Design (JAD) sessions and wrote requirements documentation for Web based information systems; and conducted project quality assurance reviews.
Independent Project Management Consultant - (September 1994 to November 1998) • Software engineering manager for 20 software developers in real-time embedded control
systems, and project manager for NT object oriented C++ development project. • Project control manager and project management mentor for mission critical development of
semiconductor manufacturing capital equipment, including mechanical, electrical, and software development. Implemented earned-value performance measurement system to provide biweekly project metrics. Launched project management training on company’s Intranet and prepared materials for in-house training course.
• Project manager for PC system rollouts to a dozen cities for a telecommunications company. Recommended enhancements for company’s software development methodology to incorporate
Revision 2 65 October 2007
Relocation of Non-Nuclear Production to an Alternate Location Business Case
project management principles. Supervised MIS help desk, PC provisioning, and PC setups to support a 300 user nation-wide LAN/WAN network.
• Project schedule management using MS-Project for a large process redesign project; designed queries, reports, and graphics, moving project data to ACCESS and EXCEL to show staffing requirements, task status, project baseline trends, and earned-value results.
• Wrote, marketed, and conducted a one-day project management training course delivered on and off-site. Created, launched, and maintained a project management Web site.
• Developed and published a Scalable Project Management Methodology applying the Project Management Body of Knowledge to projects of different sizes and complexities.
• See http://www.hyperthot.com/project.htm for project management scalable methodology and training materials with links to YouTube training video on “Five Steps to Project Success.”
EG&G, Washington Analytical Services Center, Inc; - (December 1980 to January 1986 and November 1987 to January 1994) Engineering Manager, AN/BSY-2 Project (1992-1994) - Responsible for management, staffing, and budget for 20 engineers providing systems engineering support for the Navy on a large software and electronics project, the AN/BSY-2 Submarine Combat System for SEAWOLF (SSN-21) class submarines. Coordinated engineering support for software surveillance, engineering changes, test and evaluation planning, and installation planning and interface control. Tracked technical issues and focused resources on their resolution. Developed software cost-estimating models to evaluate software change proposals. Used MS-Project to track plans for system integration and design certification testing.
Financial Manager, AN/BSY-2 Project (1987-1992) - Responsible for management, staffing, and budget for ten financial professionals doing cost estimating, project budgeting, earned value analysis, baseline reporting, funds execution, long range planning, and briefings for a $2 Billion systems development project. Maintained cost estimating and budget models for research and development, procurements and operations and maintenance budgets. Prepare cost estimating presentations for two reviews before the DoD Cost Advisory Improvement Group (CAIG) validating the technical quality of the cost estimates. Created cost estimating models and managed the Programming, Planning, and Budgeting System (PPBS). Managed a financial system software development project - documented financial process flows and outputs, feasibility study, supervised system design evolution and testing, user documentation, training, and start-up.
Deputy Director - Plans and Programs, and Schedule Manager (1984-1986) - Responsible for coordinating electronics and software installation schedules; prepared project schedules for risk analysis, and prepared critical path network schedules, programming ARTEMIS on an HP 3000 mini-computer. Conducted requirements analysis for an integrated scheduling system for a large matrixed project organization. Participated in a one-week risk assessment, using multi-attribute utility methods, for a $2B technical development and documented the findings.
Program Manager - Towed Arrays (1983-1984) - Responsible for management, budget, and tasking for project management, engineering, and logistics support services for attack submarine acoustic towed arrays, including management of three subcontractors.
Systems Analyst (1980-1983) - Responsible for project financial management for a $25M engineering development; prepared schedules, cost estimates, work breakdown structures, critical path networks, design-to-cost and life cycle cost estimates. Wrote programs in BASIC to provide logarithmic learning curve spreadsheet calculations for Navy procurement budgets (before the invention of EXCEL, etc.).
Revision 2 66 October 2007
Relocation of Non-Nuclear Production to an Alternate Location Business Case
Peat, Marwick, Mitchell and Co. - (April 1978 to December 1979) Senior Consultant - Provided defense project management and commercial consulting including weapons manufacturing rate cost analyses, project schedules and budgets, work breakdown structures, and source selection plans, organizational studies, transportation operations improvement studies, and a policy classification and tracking system. Wrote programs in BASIC running on GSA mainframes to project future budget requirements for system upgrades.
The Gillette Company - (January 1975 to February 1978) Project Coordinator - Responsible for project plans, schedules, cost estimates, and coordination for implementation of manufacturing machinery for new products and cost savings programs; conducted make-versus-buy studies, cost-benefit analyses, and facility feasibility studies for injection molding and high-speed automatic assembly at factories in France, England, and Brazil.
Polaroid Corporation - (September 1973 to October 1994) Production Supervisor – Responsible for daily shift production making polarized sunglass lenses using a pressure thermal forming process with approximately 20 shift workers. Conducted financial analysis of process parameters to optimize production volumes and yields against operating costs.
Allied Container Corp. - (November 1972 to August 1973) Night Foreman – Served as foreman in a corrugated paper board factory; supervised 40 union employees on night shift (11:00 PM to 7:00 AM) operations, in printing, stitching, taping, stapling, scoring and packing to produce finished, large corrugated containers.
United States Navy Reserve (Active Duty) - (July 1970 to July 1972) Gunnery Officer, USS CORRY (DD-817) – Responsible for approximately 20 enlisted personnel managing twin five-inch gun mounts and fire control radar and computers. Later, awarded commendation letter from Commandant, Naval District Washington, DC for financial and project management as Asst. Special Services Officer, while training to try out for the US. Olympic Rowing Team in 1972 in the Navy Sports Program.
Revision 2 67 October 2007

Relocation of Non-Nuclear Production to an Alternate Location Business Case
This page intentionally blank.
Revision 2 68 October 2007

Relocation of Non-Nuclear Production to an Alternate Location Business Case
DR. GEOFFREY D. KAISER
EDUCATION Ph.D. Theoretical Elementary Particle Physics, Cavendish Laboratory,
Cambridge, United Kingdom (1968) M.A. Natural Sciences, University of Cambridge, United Kingdom (1967) B.A. Natural Sciences, University of Cambridge, United Kingdom (1964)
RECENT CERTIFICATIONS AND TRAINING COURSES Certified Security Vulnerability Analyst, Center for Chemical Process Safety, American Institute of Chemical Engineers (2003) Certified Train-the-Trainer and Vulnerability Analysis Leader – Sandia National Laboratories’ Vulnerability Assessment Methodology – Chemical Facilities (2003) API Workshop on Security Vulnerability Assessments (2004)
CURRENT TITLE Assistant Vice President for Technology at Science Applications International Corporation (SAIC) and SAIC Technical Fellow
PROFESSIONAL SUMMARY Dr. Kaiser is an experienced manager, technical expert, and consultant who is well known in the field of the management of the engineering and technical risks associated with petroleum, petrochemical, chemical and nuclear facilities. He has also applied his risk management expertise to program and financial risks, most recently on behalf of the National Nuclear Security Administration (NNSA). He is proficient in leading and using techniques such as Process Hazards Analysis (PHA – including the Hazard and Operability (HazOp) and What-If? techniques), Quantitative Risk Assessment (QRA), and Security Vulnerability Analysis (SVA). He is also a recognized expert on the consequences of the accidental release of chemically toxic, radiotoxic or flammable vapors to the atmosphere. Since joining the UK Atomic Energy Authority in 1974, he has both developed models of heavy vapor dispersion and has used them on behalf of numerous clients in regulatory contexts and as part of quantitative risk assessments (QRAs). He has also worked in the areas of program and business risk.
Dr. Kaiser has a proven track record in business development. While at NUS Corporation, he built up a group providing Risk Assessment and Risk Management services to the chemical, petrochemical and petroleum industries. He repeated this when he joined SAIC in 1988.
He has managed and participated in many multidisciplinary projects relating to the risks associated with natural and technological hazards. He is a frequent speaker at conferences and seminars. He has written over a hundred papers and reports. Over the years, he has shown that he can perform with excellence in several areas, including detailed technical work, writing, project management, proposal preparation, business development, line management, and technical/management consulting.
He is currently a member of SAIC’s Technical Fellow’s Council (STFC), which has a membership of only 60 in a company of over 40,000 employees.
PROFESSIONAL EXPERIENCE Science Applications International Corporation (SAIC) (March 1988 to Present) Dr. Kaiser is an SAIC Technical Fellow and an Assistant Vice President for Technology. He led SAIC’s effort to provide Process Safety Management (PSM) and related services to the petroleum, petrochemical,
Revision 2 69 October 2007
Relocation of Non-Nuclear Production to an Alternate Location Business Case
chemical and nuclear industries. He also provides program and financial risk management and decision-making services, most recently to the National Nuclear Security Administration. He is responsible for marketing, proposal writing, project management, and technical participation in risk management projects that involve: (a) hazards identification techniques, such as the hazards and operability (HazOp) review; (b) quantitative risk assessment (QRA); (c) atmospheric dispersion and consequence analysis; (d) the development of recommendations for design or procedural changes that will reduce risk; (e) the implementation of process hazards management systems; (f) regulatory compliance support; (g) public communication; and (h) business and program risk. Starting in 1988, when he joined SAIC, he built a business with commercial companies in the process industries. He also provides senior consulting services as needed, including issues resolution, management advice, review of major technical deliverables, and technical work.
During the last five years, Dr. Kaiser has been working with the National Nuclear Security Administration’s (NNSA) Office of Stockpile Technology (OST), providing guidance in the areas of program and project risk management and business practices for both Defense Nonproliferation Programs and the Office of Stockpile Technology. During 2006, he worked on the development of an Applied Science and Technology Roadmap (ASTR) for NNSA’s Nuclear Weapons Complex. This included the coordination of a high-tech decision-making workshop. He works as the de facto risk management coordinator for OST. Also completed within the last three years are projects for which Dr. Kaiser used risk assessment and decision-making tools to: (1) support an alternate cities analysis of the proposed move of NNSA’s KCP; (2) provide NNSA with risk-based support for the FY 2005 budget request for Defense Nonproliferation Programs; (2) review life cycle cost estimates for NNSA’s Pit Disassembly and Conversion Facility, especially contingency estimates; (3) for EPA, analysis of the alternatives for the long-term management of excess mercury using the Analytical Hierarchy Process; and (4) facilitate and/or manage PHA and PSM projects at Marathon Ashland Petroleum refineries.
Some of Dr. Kaiser’s recent work has been in the area of Security Vulnerability Analysis. Projects completed since the beginning of 2003 include: (1) participation in a Security Vulnerability Analysis of a refinery on the Mississippi River in Louisiana; (2) leading a vulnerability analysis of the Department of Veterans’ Affairs’ paper record keeping sites and practices; (3) preparation a review of vulnerability assessment models for the energy industry; (4) participation in an assessment of the State of Colorado’s Emergency Operations Center (EOC) and Alternate EOC; and (5) a Transportation Security Analysis for the National Cooperative Highway Research Program. Dr. Kaiser has received certifications in both the Center for Chemical Process Safety’s Security Vulnerability Analysis methodology and in Sandia National Laboratories’ Vulnerability Assessment Methodology – Chemical Facilities, and has completed the American Petroleum Institute’s SVA course.
During the past several years, Dr. Kaiser has managed and participated in many other risk management projects. Projects include (but are not limited to): (1) leading the preparation of generic Hazard Assessments (as required by EPA's Risk Management Program) for ammonia refrigeration, wastewater treatment facilities, chemical distribution facilities and warehouses, which were published by the Environmental Protection Agency; (2) leading the development of an accident analysis handbook for the Nuclear Regulatory Commission (NRC); (3) supporting an independent assessment of the viability and safety of Mobil Oil's modified HF alkylation technology at the Torrance, CA refinery; (4) the development of a new HazOp methodology for Distributed Control Systems for Amoco Chemical; (5) development of an atmospheric dispersion and consequence model for uranium hexafluoride, hydrogen fluoride and other toxic vapors for the Nuclear Regulatory Commission and leading the development of a chemical safety program for NRC's fuel cycle licensees; (6) for DOE, providing assistance to NNSA headquarters on the Pit Disassembly and Conversion Facility and the Mixed Oxide Fuel Fabrication Facility in the areas of risk and safety, uncertainties in cost and schedule, and decision-
Revision 2 70 October 2007
Relocation of Non-Nuclear Production to an Alternate Location Business Case
making; (7) a quantitative risk assessment of an HCFC production facility for AlliedSignal; (8) a domino effect risk assessment of Pemex’ gas production facilities at Nuevo Pemex and Ciudad Pemex in Tabasco Province, Mexico and (9) development of an implementation plan for an integrated Environmental, Health and Safety information management system for the Venezuelan oil company, PDVSA, and a needs analysis for a combined data management/reporting/knowledge management system in support of PDVSA’s waste pit cleanup activities.
In the late 80s and early 90s, Dr. Kaiser’s work included Risk Management and Prevention Programs (RMPPs), as required by California law, for many clients, including Ultramar Refining, Shell Western E&P, the Harbor Cogeneration Company and Chevron. He has also performed risk assessments of HF use at three facilities in the LA area, including Allied-Signal, Ultramar Refining and Golden West Refining. He has led HazOps of many facilities, including HF alkylation for UNO-VEN, an FCC unit for Cenex, a cancer drug production unit for NaproBiotherapeutics and DOE facilities at Savannah River and the Nevada Test Site.
Dr. Kaiser has prepared and given training courses in hazards identification and risk management to a number of clients including Du Pont, Ultramar Refining, Westinghouse Hanford, the Harbor Cogeneration Company and the American Industrial Hygiene Association.
NUS Corporation (January 1981 to March 1988) From March 1986 through March 1988, Dr. Kaiser was manager of NUS' Reliability and Risk Assessment Department, with responsibilities for both nuclear and industrial projects. He led the development of a new group providing risk management services to the chemical process industries. Examples of projects that he worked on during this time include: (1) management of a risk assessment of E.I. du Pont de Nemours' ammonia barging network, (2) a HazOp of an adiponitrile manufacturing facility, also for du Pont, (3) an independent appraisal of proposed process safety modifications to a major Union Carbide specialty chemical production unit and (4) acting as reviewer and integrator for Long Island Lighting Company submittals to the Nuclear Regulatory Commission.
Prior to March 1986, Dr. Kaiser was manager of NUS' Consequence Assessment Department. During this time, he managed and participated in several studies of the consequences of releasing toxic or flammable chemicals from fixed installations or during transport. He managed a risk assessment of natural and technological hazards for the Federal Emergency Management Agency. He participated in numerous nuclear PRAs and managed several Level 2 (source term) and Level 3 (consequences) projects. He was selected as the principal author of the Chapter on Environmental Transport and Consequence Analysis in the Industry/NRC "PRA Procedures Guide."
United Kingdom Atomic Energy Authority (September 1974 to December 1980) As Head of Physics within the Safety and Reliability Directorate's Environmental and Fission Product Group, Dr. Kaiser led a multidisciplinary team with responsibilities for (1) the development of methods with which to predict the consequences of the accidental release of radiotoxic, chemically toxic and flammable materials to the environment, (2) nuclear and non-nuclear safety analyses and (3) participation in and management of multi- disciplinary projects that have relevance to the safety and environmental impact of advanced technologies. He developed a methodology for the prediction of the consequences of the accidental release of radioactive material to the atmosphere, centering on the computer code TIRION. The most significant use of TIRION was at the 1977 Windscale inquiry into the proposed construction of an oxide fuel reprocessing facility.
Dr. Kaiser also developed models for the behavior of denser-than-air vapors in the atmosphere. The work was applied with particular success to cold mixtures of ammonia and air and was also used in order to
Revision 2 71 October 2007

Relocation of Non-Nuclear Production to an Alternate Location Business Case
calculate some of the results quoted in the Canvey Island Report on the risks associated with a large petrochemical complex on the banks of the Thames estuary in the United Kingdom. This work was part of an effort by the Safety and Reliability Directorate to develop techniques of risk analysis for use in the chemical industry and was funded by the U.K. Health and Safety Executive.
While at the UKAEA, Dr. Kaiser was a frequent speaker at seminars and international conferences. He participated as a lecturer in teaching courses arranged by the UKAEA. He spoke frequently to citizen's groups on the safety of nuclear power and chaired international technical committees.
Daresbury Nuclear Physics Laboratory (September 1971 to August 1974) Dr. Kaiser was a senior research associate in theoretical elementary particle physics.
University of Durham (United Kingdom) (September 1970 to August 1971) Dr. Kaiser was a lecturer in applied mathematics.
Cavendish Laboratory, Cambridge (September 1969 to August 1970) and University of Miami, Center for Theoretical Studies (September 1968 to August 1969) Dr. Kaiser was a postdoctoral research fellow in theoretical elementary particle physics.
AWARDS, HONORS, AND OTHER ACTIVITIES Member, SAIC’s Engineering Science and Technology Council Member, American Nuclear Society Member, American Institute of Chemical Engineers Member, Recording Academy of the United States Technical Co-coordinator and Co-Editor, OECD/NEA/CSNI Group of Experts on Accident Consequences Principal Author, IEEE/ANS/NRC PRA Procedures Guide Invited lecturer at MIT Summer Course on Reactor Safety Exhibition, Jesus College, Cambridge, 1963 Minor Scholarship, Jesus College, Cambridge, 1964
CLEARANCES DOE Q Clearance
PUBLICATIONS Dr. Kaiser has published over 100 papers and reports. The following is a brief selection:
Defense Programs Applied Science and Technology Roadmap (co-author), prepared for the National Nuclear security Administration’s Office of Stockpile Technology, Draft, February 2007.
Transportation Response Options: Scenarios of Infectious Diseases, Biological Agents, Radiological, Chemical and Other Hazardous Materials: A Guide to Transportation’s Role in Public Health Disasters (co-author), NCHRP Project 20-59(19), prepared for the National Cooperative Highway Research Program, Transportation Research Board, National Research Council, September 2005.
Economic and Environmental Analysis of Technologies to Treat Mercury and Dispose in a Waste Containment Facility (project manager and co-author) prepared for the US Environmental Protection Agency, Office of Research and Development, December 2004. This is an update of an earlier report, Preliminary Analysis of Alternatives for the Long Term Management of Excess Mercury (August 2002). This was excerpted and published in The Journal of Environmental Management in 2004 as Use of the
Revision 2 72 October 2007
Relocation of Non-Nuclear Production to an Alternate Location Business Case
Analytic Hierarchy Process to Compare Alternatives for the Long-Term Management of Surplus Mercury.
Analysis of Vulnerability Assessment Methodologies for the Energy Industry (co-author). Prepared for the Department of Energy’s Office of Energy Assurance, December 2004.
Essential Paper Records Vulnerability Assessment (project manager and co-author), prepared for the Department of Veterans Affairs, December 2003.
Security Vulnerability Assessment, Placid Refinery, Port Allen, LA (co-author), prepared for Placid Refining LLC, August 2003.
Assessment of the Emergency Operations Center (EOC) and Alternate EOC – Colorado (co-author), prepared for the State of Colorado Office of Emergency Management, April 2003.
Issues in the Development and Use of Guidance for EPA Hazard Assessments of Toxic Substances, presented at the Center for Chemical Process Safety's Annual International Conference and Workshop on Modeling Consequences of Accidental Releases of Hazardous Materials, San Francisco, September 28 - October 1, 1999.
Risk Management Program Hazard Assessment & Quantitative Risk Assessment of the Use of Chlorine and Sulfur Dioxide by Washington Suburban Sanitary Commission, (project manager and co-author), Prepared for WSSC, April 1999.
Process Hazards Analysis - Building 4 Biopharmaceutical Manufacturing Facility, Centocor, Malvern, PA (project manager and co-author), prepared for Centocor, March 1999.
Risk Analysis, AL/TI Bulk Gas Facilities, Dallas, Texas (project manager and co-author), prepared for Air Liquide America Corporation, Dallas, TX, September 1998.
Process Safety Management at the Puerto La Cruz (PLC) Refinery - An Assessment of Automation Requirements (project manager and co-author), prepared for Petroleos de Venezuela, S.A., Puerto La Cruz, Venezuela, July 1998.
SISMAR (Sistema Integrado para el Manejo del Riesgos) - Scope of Work for a First-Phase Implementation at Puerto La Cruz (project manager and co-author), prepared for Petroleos de Venezuela, S.A., Caracas, Venezuela, May 1998.
Air Modeling Issues Associated with the Risk Management Program in Proceedings of the Center for Chemical Process Safety’s International Conference and Workshop on Risk Analysis in Process Safety, Atlanta, October 1997.
Definition of Requirements and Needs for an Integrated Information Management System for Environment, Health & Safety (Sistema Integrado de Informacion Ambiente y Seguridad “SIAS”) (coauthor), submitted to Petroleos de Venezuela S.A., Caracas, Venezuela, September 1997.
Nuclear Fuel Cycle Facility Accident Analysis Handbook (NUREG-1320, Rev. 1) (project manager and co-author), prepared for the US Nuclear Regulatory Commission, December 1997
Revision 2 73 October 2007
Relocation of Non-Nuclear Production to an Alternate Location Business Case
Alternative Alkylation Technologies in a Refinery (co-author), presented at PSAM-III (Probabilistic Safety Assessment and Management Conference), Crete, June 1996.
Issues in the Estimation of Risk from the Atmospheric Dispersion and Consequence Modeling of Hydrofluoric Acid (principal author), presented at PSAM-III (Probabilistic Safety Assessment and Management Conference), Crete, June 1996.
Developing Risk Management Programs for Small Facilities (co-author), presented at the TAPPI Environmental Conference, Orlando, FL, May 1996.
Model Risk Management Program and Plan for Ammonia Refrigeration (project manager and co-author), prepared for the US Environmental Protection Agency, May 1996. Also prepared contributions to the following Risk Management Plan guidance, available on the web site of EPA’s Chemical Emergency Preparedness and Prevention Office (CEPPO): Wastewater Treatment Facilities, Chemical Distribution Facilities, and Warehouses. Also provided senior review and guidance on the development of the RMP Offsite Consequence Analysis Guidance, and the guidance for propane
Identification and Modeling of Worst-Case Scenarios for Ammonia Refrigeration Systems, presented at the 1996 Annual Meeting of the International Institute of Ammonia Refrigeration, Atlanta, GA, March, 1996.
Torrance Refinery Safety Advisor Project-Evaluation of the Use of Modified HF Alkylation Catalyst at Mobil Oil's Refinery, (co-author) - submitted to the Superior Court of the State of California for the County of Los Angeles, December 1994.
Nuevo Pemex and Ciudad Pemex Domino Effect Analysis (project manager and principal author), prepared for the Instituto Mexicano de Petroleos, Mexico City, October 1994.
HAZOP Techniques for Non-Traditional Applications, and HAZOP Techniques for Computer Based Control Systems; papers presented at the 1994 Process Plant Safety Symposium, Houston, TX; American Institute of Chemical Engineers, March 1994. Also presented at Petroleos de Venezuela’s Conference on Industrial Automation, Puerto La Cruz, November 1997.
SAIC's Computer Programs for Modeling the Atmospheric Dispersion of Hazardous Vapors (project manager and principal author), manual prepared for the United States Nuclear Regulatory Commission (including uranium hexafluoride dispersion), August 1993. Updated October 1994 to include chemical agents for the U.S. Army Chemical Demilitarization Project.
Contingency Analysis Modeling for Superfund Sites and Other Sources (Principal Author), EPA-454/R-93-001, Prepared for the U.S. Environmental Protection Agency, Research Triangle Park, NC, January 1993: shortened version presented as Paper #93-MP-22.05 at the A&WMA's 86th Annual Meeting & Exhibition, Denver, CO, June 1993.
Issues in the Use of Atmospheric Dispersion Models for Accidental Release Planning and Decision Making, Paper #93-MP-9.02 at A&WMA's 86th Annual Meeting & Exhibition, Denver, CO, June 1993; revised version presented at the 1994 International Environmental Conference, Technical Association of Pulp and Paper Industries (TAPPI), Portland, OR, April, 1994.
Issues in the Modeling of the Atmospheric Dispersion of Hydrogen Sulfide Emissions, Paper SPE 025948 at the SPE/EPA Exploration & Production Environmental Conference, San Antonio, TX, March 1993;
Revision 2 74 October 2007
Relocation of Non-Nuclear Production to an Alternate Location Business Case
summary of material provided to the U.S. Environmental Protection Agency in support of the preparation of a report to Congress on hydrogen sulfide.
Accident Prevention and the Clean Air Act Amendments of 1990 with Particular Reference to Anhydrous Hydrogen Fluoride, presented at the 1992 AIChE Summer National Meeting, Minneapolis, August 1992: published in Process Safety Progress.
Ultramar Refining Risk Management and Prevention Program: Sulfur Dioxide and Hydrogen Sulfide (coauthor), Prepared for Ultramar Refining, Wilmington, CA, August 1992.
Risk Assessment - HF Use (Genetron Unit), (Project Manager and Principal Author). Prepared for Allied-Signal, El Segundo, CA, December 1990. Updated February 1995.
Risk Assessment - HF Alkylation Unit, (Project Manager and Principal Author). Prepared for Ultramar Refining, Wilmington, CA, November 1990.
Ultramar Refining - Risk Management and Prevention Program for the HF Alkylation Unit, (Project Manager and Principal Author). Prepared for Ultramar Refining, Wilmington, CA, February 1990.
Risk Management and Prevention Programs for the Ammonia and Sulfuric Acid Systems, (Project Manager and Principal Author). Prepared for the Harbor Cogeneration Company, Wilmington, CA, April 1989.
A Review of Models for Predicting the Dispersion of Ammonia in the Atmosphere, published in Plant Operations/Progress, January 1989.
Ammonia Barging Risk Assessment (project manager and principal author), prepared for E.I. du Pont de Nemours, NUS Report NUS-4893, 1987.
The Implications of Reduced Source Terms for Ex-Plant Consequence Modeling and Emergency Planning, published in Nuclear Safety 27-3, 1986.
Development of a Methodology for Comprehensive Hazards Analysis - a Feasibility Study (project manager and principal author), a comparative risk assessment of natural and technological hazards, prepared for the Federal Emergency Management Agency, NUS Report NUS-4721, 1985.
Ringhals 2 Probabilistic Safety Study, Phase II (project manager and co-author), prepared for the Swedish State Power Board, NUS Report NUS-4409, 1984.
Severe Accident Risk Assessment, Limerick Generating Station (co-author), prepared for the Philadelphia Electric Company, NUS Report NUS-4161, 1983.
Environmental Transport and Consequence Analysis (principal author), Chapter 9 of PRA Procedures Guide, NUREG/CR-2300, United States Nuclear Regulatory Commission, 1983.
Comparison of Reactor Accident Consequence Models (co-author and co-editor), summary Report of the OECD/NEA/CSNI Group of Experts on Accident Consequences, 1982.
Canvey - An Investigation of Potential Hazards from Operations in the Canvey Island/Thurrock Area (co-author), Appendices 4, 9, 12, and 14, Her Majesty's Stationery Office, London, 1980.
Revision 2 75 October 2007

Relocation of Non-Nuclear Production to an Alternate Location Business Case
Production of Dense Gas Mixtures from Ammonia Releases - A Review (principal author), published in Journal of Hazardous Materials 6, PP 197 et seq., 1982.
The Accidental Release of Anhydrous Ammonia to the Atmosphere - A Systematic Study of Factors Influencing Cloud Density and Dispersion (principal author), published in the Journal of the Air Pollution Control Association, 32, PP 66 et seq., 1982.
DENZ - A computer Program for the Calculation of the Consequences of the Accidental Release of Toxic or Explosive Gases to the Atmosphere (principal author), United Kingdom Atomic Energy Authority Report SRD R152, 1979.
Releases of Anhydrous Ammonia from Pressurized Containers - The Importance of Denser-than-Air Mixtures (principal author), published in Atmospheric Environment 12 PP 2289 et seq., 1978.
TIRION4 - A Computer Program for Use in Nuclear Safety Studies (co-author), United Kingdom Atomic Energy Authority Report SRD R134, 1978.
Revision 2 76 October 2007
Relocation of Non-Nuclear Production to an Alternate Location Business Case
DR. STEVEN R. LIGON
EDUCATION
Ph.D. International Politics, Catholic University of America, Washington, D.C. (2002)
M.S. Systems Engineering, George Washington University, Washington, D.C. (2007)
M.A. International Politics, Boston University, Boston, Mass (1991)
B.A. Political Science, Brigham Young University, Provo, Utah (1997)
RECENT CERTIFICATIONS AND TRAINING COURSES
Certified Information System Security Professional, George Washington University (2005)
Professional Certificate in System Engineering, George Washington University (2004)
CURRENT TITLE Lead Systems Engineer, Energy Solutions Operation, SAIC
PROFESSIONAL SUMMARY Dr. Ligon joined the Energy Solutions Operation as Lead Systems Engineer in October 2003 and SAIC in 1994 after completing his first career as a U.S. Navy Intelligence Officer. He has over 26 years of system engineering, database development, and program management experience, 14 years as an intelligence analyst involved in Latin American and Middle Eastern geopolitics, counter terrorism, counter insurgency, counter narcotics, photo interpretation and military force structure analysis.
Dr. Ligon is currently providing System Engineering and Integration support to the Disposal Operations Office (RW-15) of DOE’s Office of Civilian Radioactive Waste. Most recently lead a team in an extensive review of the science and technology needs of DOE’s Office of Stockpile Technology (NA-123). Previously, he orchestrated the project control for the Midwest Independent Transmission Service Operator (MISO) grid automation system and has lead a software development organization from CMM® level 1 to level 3, and assisted in bringing a large SETA organization from SE-CMM® level 3 to level 5. He is a co-inventor of a tool that traces organizational business products to selected models such as the SEI’s CMMI® and ISO9000. Dr. Ligon has designed and installed relational databases, authored works on software testing and process improvement as well as Presidential Politics and Latin American Geopolitics, worked as functional manager for software test and evaluation on a major software development project, as Deputy Program Manager and lead systems integration engineer, as a software production manager, and as a Process Improvement Specialist in system integration, test and evaluation, enterprise and business processes
PROFESSIONAL EXPERIENCE Science Applications International Corporation (SAIC) (December 1994 to Present) Dr. Ligon currently provides system engineering, engineering management and program management advice to NNSA’s Readiness Campaign, Office of Transformation and Office of Civilian Radioactive Waste Management (OCRWM). He has aided in establishing the business practices, integrated project schedules for the Safeguards and Security directorate of OCRWM, lead the effort to draft the NA-10 Applied Science and Technology Roadmap, and contributed to a risk-based assessment of the effectiveness of US nuclear non-proliferation initiatives. Additionally, he has been integral in reviewing NNSA laboratory proposals for the Office of Stockpile Technology’s Integrated Priority List process.
Revision 2 77 October 2007
Relocation of Non-Nuclear Production to an Alternate Location Business Case
Dr. Ligon has also supported DOE’s Energy Efficiency and Renewable Energy directorate by leading the effort to assess engineering management capability maturity against the FAA-iCMM®.
Dr. Ligon oversaw and provided project control for Midwest Independent Transmission Systems Operators, Inc. (MISO), automating the largest bulk electricity transmission market in the world. In this position, he tailored system integration management methodology for application in the Regional Transmission Environment
Dr. Ligon has also been instrumental in two projects to elevate the capability maturity of organizations through process improvement. Supporting a large System Engineering and Technical Assistance contract for the National Intelligence and Mapping Agency (now National Geospatial Intelligence Agency), he was the key mentor for process improvement efforts in system integration, verification, and validation, readiness, technology insertion and enterprise integration processes and aided in achieving the assessment of an SE-CMM level-5 environment. A second effort, as deputy program manager, senior system engineer, and software production supervisor, Dr. Ligon lead a staff of 27 engineers performing operations and maintenance level support to a complex database system comprised of JAVA, Active Server Pages, and MS Access applications built on a Sybase RDBMS. Support included maintenance of existing applications, development of new applications, and complete cradle-to-grave support of all system hardware and software. In this effort he led the effort to raise the organization to Software-CMM level 2, and authored all processes for level 3. He also instituted a time tracking system that produced task-order metrics in support of customer requests which lead to successful capture of two contract options.
Dr. Ligon has lead teams of facilities, systems and software engineers in performing due diligence at the NASA Dryden Flight Research Center at Edwards AFB, CA as part of the successful effort to win the multi-million dollar NASA Outsourcing of Desktop Initiative (ODIN) contract. Duties included inspecting and assessing the status of the physical plant, desktop status in both hardware and software, and the writing of the proposal for support of Dryden as well as 4 optional physical re-cabling plans.
In support of Intelligence customers, Dr. Ligon has lead teams in requirements definition efforts for worldwide communications architectures, integrating large complex systems, and functional testing of large and complex databases. He is proficient in use of DOORS®, CORE®, VISIO®, and all Microsoft Office products.
Dr. Ligon is an adjunct professor of Engineering Management for George Washington University, as well as the senior instructor for SAIC’s Microsoft Project training course.
Independent Contractor (June 1994 – December 1994) Dr. Ligon provided editorial support in development of the Earth Orbiting Satellite Distributed Information System Verification and Validation Plan and data preparation for use in demographic studies of Alcoholic and Drug Abuse Recidivism. Additionally, Dr. Ligon was an adjunct professor for the Joint Military Intelligence College of the Defense Intelligence Agency instructing in Latin American Political and Military Analysis, as well as National Military Strategy Formulation (through 2004).
United States Navy (October 1980 to September 1994) Mr. Ligon transferred from the United States Army Military Police Corps to the United States Navy Intelligence community entering as a Lieutenant (JG). During the subsequent 14 years until his retirement, Mr. Ligon served in numerous positions: Imagery Intelligence Officer (1981 – 1983) and project manager for installation of the first Carrier-based Fleet Imagery Support Terminal (FIST) and established procedures for the evaluation of the then new Tactical Aerial Reconnaissance Pod (TARPS)produced imagery; Lead the Atlantic Command’s Central and South America current intelligence analysis team (1983 – 1985) and established the first unified insurgent tracking database; Afloat Intelligence Staff officer (1985 – 1988) to the Commander of the South Atlantic Force, US Atlantic Fleet directing intelligence support for two circumnavigations of South America as well as converting a desk-top
Revision 2 78 October 2007
Relocation of Non-Nuclear Production to an Alternate Location Business Case
database of intelligence information to the new Dbase 3+ format; Project Manger for Intelligence Plans and Support (1989 – 1992), U.S. Forces Europe where Mr. Ligon instituted practices that reduced costs by 60 percent while improving realism of training support to NATO and US military exercises. Mr. Ligon also coordinated all Component (USAFE, USAREUR, USNAVEUR) intelligence support to European Exercises for both US and NATO commands; and culminating as a Professor of Strategic Intelligence (1992 – 1994) at DIA’s Joint Military Intelligence College instructing graduate/undergraduate Military Strategy, Foreign Policy, Latin America, and Intel Analysis. Additionally he wrote and instituted new NSA Latin American Analysis Remote Learning Course.
Mr. Ligon was awarded the Meritorious Service Medal and two Joint Service Commendation Medals for service as well as the Navy Expeditionary Medal for combat service in the Lebanese Conflict of 1982.
United States Army (April 1977 to October 1980) Mr. Ligon was commissioned as a Regular Army officer from the Brigham Young University Reserve Officer Training Corps as a 2nd Lieutenant in 1977. He was initially branched as a Transportation Corps Officer specializing in Marine and Terminal operations, and later transferring to the Military Police Corps branch in 1979. He served as an Executive officer, Training Officer, Logistics Officer, and Spanish Linguist, controlled budgets and oversaw all procurement, supply and maintenance for a 2,000 person police department in the Panama Canal Zone during the transition to Panamanian control. Of note was his direction of a criminal investigation recovering approximately $2 million in stolen property.
Mr. Ligon was awarded two Army Commendation Medals for service.
AWARDS, HONORS, AND OTHER ACTIVITIES Member, International Test and Evaluation Association Member, International Council of Systems Engineers Member, National Defense Industrial Association Member, American Political Science Association
FOREIGN LANGUAGES Spanish (Native Fluency) Portuguese (Read/write)
PATENTS Patents: System and Method for Determining Performance Level Capabilities in view of Predetermined Model Criteria, United States Provisional Patent Application No. 60/421,101 filed Oct. 25, 2002; completed filing on Oct. 21, 2003.
CLEARANCES DOE Q Clearance, DoD TS/SCI, ISSA
PUBLICATIONS Dr. Ligon has published over a broad range of subjects, a selection of which is listed below.
Technical: Defense Programs Applied Science and Technology Roadmap (co-author), prepared for the National Nuclear Security Administration’s Office of Stockpile Technology, Draft, February 2007.
System Engineered Research and Development Management. Paper presented to the National Defense Industrial Association 8th Annual System Engineering Conference, 26 October 2005.
Revision 2 79 October 2007

Relocation of Non-Nuclear Production to an Alternate Location Business Case
Work-Product-based Cross Model Tracing Methodologies. Paper presented to the National Defense Industrial Association 2nd Annual CMMI Technology Conference, 13 November 2002.
“Totally Integrated Testing That Really Works.” Proceedings of the 1996 Conference of the International Test and Evaluation Association, Seattle Washington, October 1996.
Classified Intelligence Publications: “Libyan Threat Guide”, “Central American Terrorism Indicators”, “South American Intelligence Efforts”
Academic: The Character of Border Conflicts: Latin American Border Conflicts 1830-1995. Dissertation. Catholic University of America, March 2002.
“President Carter's Decision to Boycott the 1980 Olympics.” Chapter in Presidents and Foreign Policy. Drachman, Edward R. and Shank, Alan eds. New York: SUNY Press, 1997.
Revision 2 80 October 2007
Relocation of Non-Nuclear Production to an Alternate Location Business Case
DIANE M. NEMETH, AICP
EDUCATION M.S., Urban Planning, Columbia University, 1978 B.A., Economics, Miami University, 1973
RECENT TRAINING COURSES Federal Real Property Utilization and Disposal Principles of Wireless Site Development Principles of Land Acquisition
CURRENT TITLE Senior Scientist
PROFESSIONAL SUMMARY Ms. Nemeth has over thirty years of experience as an urban planner for city, county and federal governmental agencies and private companies. She began her professional career as an urban planner with the Regional Planning Commission of Cuyahoga County, Ohio and currently works with Science Applications International Corp. Her planning experience includes federal land disposal and reuse, community outreach, strategic planning, land use planning, facility siting, economic development, and environmental compliance with NEPA regulations
PROFESSIONAL EXPERIENCE Science Applications International Corporation (SAIC) March 1993 - Present Since 2000, Ms. Nemeth has supported the Department of Energy (DOE) Office of Legacy Management (LM) and monitors grants awarded to 15 local economic development organizations in communities impacted by DOE downsizing through the 1993 National Defense Authorization Act. She reviews and makes recommendations on grant applications, proposed budgets and the progress of local economic development activities. She helped LM-20 achieve a FY06 performance goal by helping with the successful disposal of the Wayne Interim Storage Site in Wayne, New Jersey, a Formerly Utilized Sites Remedial Action Program (FUSRAP) site. She is currently working on the disposal of another FUSRAP site, the former New Brunswick National Laboratory in New Brunswick, New Jersey and a site in Canonsburg, PA. She is currently preparing a U. S. General Services Administration (GSA) S.F. 118 application for excess property in Canonsburg, PA as well as a U.S. Department of Housing and Urban Development (HUD) Title V Property Surveys for housing for the homeless. She coordinates with both agencies as well as local and state governments on federal property disposals. She analyzed 80 properties under the Uranium Mill Tailings Radiation Act (UMTRA) to determine their potential to site solar energy production facilities. The initial analysis resulted in a feasibility study to site a solar energy production facility on a DOE owned, underutilized UMTRCA property in New Mexico. Ms. Nemeth was on a team that prepared an Evaluation of the Real Estate Assessment Center Methodology for Physical Assessment of HUD Assisted and analyzed the inspection process at selected HUD funded public housing facilities. She helped facilitate four divisions and 250 people within NNSA move from federal into commercial office space. She conducted an initial requirements needs assessments and prepared a Program of Requirements for people, equipment and functional space requirements. Plans included secured space for classified discussions, work documents and information technology systems. She worked closely with the space team including representatives from NNSA, GSA, the building management, and architectural design and construction teams to ensure the space was built out to specifications. She also conducted final build-out surveys and facilitated the move of office equipment and furniture.
Revision 2 81 October 2007
Relocation of Non-Nuclear Production to an Alternate Location Business Case
Ms. Nemeth conducted an analysis of Trenton’s New Jersey’s infrastructure and current employment base to determine the feasibility of attracting new technology employers to the city. The evaluation included interviews with major technology employers, city officials, and local development organizations and a windshield inventory of existing commercial building for their potential reuse by the technology industry. Ms. Nemeth also prepared a feasibility analysis to attract technology businesses to Abilene, Texas and the surround region that focused on the region’s current economic activity, existing technology industries and the availability of technology support services.
Ms. Nemeth also works on work force restructuring activities for LM-10 and is responsible for preparing the Annual Report on Work Force Restructuring for Congress as well as data calls on annual estimated work force headcount and separation count. She is currently working on collective bargaining agreement updates within the Work Force Information System database.
At SAIC, Ms. Nemeth is responsible for preparing socioeconomic, cultural and environmental justice portions of environmental impact statements (EIS) and environmental assessments (EA) for DOE, the National Nuclear Security Agency (NNSA), and the Defense Logistics Agency (DLA). She has worked on the following EAs and EISs: the Surplus Plutonium Disposition EIS, the Nuclear Infrastructure Programmatic EIS, the EIS for Completion of the West Valley Demonstration Project Activities and Closure of the Western New York Nuclear Service Center, the Mercury Management EIS, the Defense Logistic Distribution Depot Restructuring EA, the DLA Human Resources Operation Restructuring EA and The Autumn Air Shows at Libby Army Airfield Fort Huachuca, Arizona EA. She was also was responsible for preparing The Pantex Environmental Information Document. Ms. Nemeth prepared a white paper for NNSA on The Use of GIS Modeling for Defense Programs Environmental Compliance Effort that analyzed the impacts of pending environmental legislation and regulations on NNSA facilities.
Ms. Nemeth prepared strategic plans for several program offices within NNSA and DOE that included goals, objectives and performance measures. For LM, she developed performance metrics to track the progress of economic development projects in New Mexico, Ohio and South Carolina.
PVA Environmental (June 1991- March 1993) As a principal in her own consulting firm, Ms. Nemeth prepared an economic benefit analysis of the construction and operation of a solid waste energy recovery facility in Montgomery County, Maryland and analyzed economic, population, housing data pertaining to the proposed plant. For a proposed coal fired co-generation facility, she prepared a market analysis of air emission offsets which could be purchased from manufacturing concerns within a three state area as a compliance measure under the Clean Air Act. As part of her practice, Ms. Nemeth assisted manufacturers of recycled products in marketing their products to local, state and federal governments within the Baltimore-Washington marketplace.
Gershman, Brickner and Bratton (January 1989 – June 1991) As a project manager, Ms. Nemeth managed Solid Waste Reduction and Recycling Plans for several local governments in Southern California, New York and Pennsylvania. Responsibilities included the design of recycling systems for each community, an analysis of markets for the recyclables and presentations to elected officials. Each plan considered impacts related to population, community infrastructure and economic considerations. While with Gershman, Brickner and Bratton, she also prepared a bond feasibility analysis for a proposed waste-to-energy facility in upstate New York that included the analysis of socio-economic data for St. Lawrence County, New York.
Revision 2 82 October 2007
Relocation of Non-Nuclear Production to an Alternate Location Business Case
Abrams and Associates (November 1988 – December 1989) As the Director of Urban Planning for Abrams & Associates, a commercial real estate firm, Ms. Nemeth prepared a market feasibility study for a 600-acre tract of land in Culpepper County, Virginia. She analyzed the property in consideration of zoning, utility, transportation and economic factors using the county master plan, water and sewer plans as well as information from the Virginia State Highway Department and the Culpeper County Office of Economic Development. The analysis also included a historic investigation due to the property's proximity to a major civil war encampment.
Senior Planner, John J. Allen Associates, Inc. (November 1983 – November 1988) While working as a Senior Planner for this civil engineering consulting firm, Ms. Nemeth prepared conceptual site plans, zoning analysis and utility studies for the development of commercial and residential properties. As part of the development process, she prepared permit applications to local and state governments and gave testimony at public hearings. As project manager, she prepared project feasibility studies for private developers in Maryland and the District of Columbia. Each plan required the close coordination with elected officials and citizen advisory councils of each community in the planning process.
Dewberry & Davis (March 1981-November 1983) As the Assistant Project Manager for the development of a solid waste energy recovery project in Montgomery County, Maryland, Ms. Nemeth conducted environmental and land use analyses of the project and directed the efforts of public relations consultants. To inform the County residents and elected officials about the project and to solicit their comments, Ms. Nemeth directed an extensive public relations campaign including presentations to neighborhood community groups, elected representatives from the municipalities and towns within the County, civic associations, environmental organizations and the media. Ms. Nemeth produced a full range of public information materials on the project such as brochures, audio-visual presentations, newsletters and fact sheets.
Local Governments & Consulting Firms (1973 – 1983) Ms. Nemeth began her professional career as an urban planner with the Regional Planning Commission of Cuyahoga County, Ohio and developed a Costal Zone Management Study for Cuyahoga's County's Lake Erie coast line. She also worked on a number of neighborhood economic development and zoning studies for the suburban communities within the County and prepared environmental assessments for projects funded through Community Development Block Grants.
AWARDS, HONORS AND OTHER ACTIVITIES Member, American Institute of Certified Planners Member, American Planning Association William Kinne Memorial Fellowship, Columbia University's School of Architecture and Planning
CLEARANCES DOE BAO
Revision 2 83 October 2007

Relocation of Non-Nuclear Production to an Alternate Location Business Case
This page intentionally blank.
Revision 2 84 October 2007
Relocation of Non-Nuclear Production to an Alternate Location Business Case
DR. PETER F. RIEHM, PE
EDUCATION – University of Notre Dame, B. S., Mechanical Engineering (1967) University of Notre Dame, M.S., Mechanical Engineering (1970) University of Notre Dame, Ph.D., Mechanical Engineering (1975)
CURRENT TITLE Senior Project Manager, Science Applications International Corporation
PROFESSIONAL SUMMARY – Dr. Riehm has thirty five years of government and private sector experience related to nuclear facilities and programs, including 23 years as consultant/contractor to electrical utilities and the US Department of Energy (DOE), and one year as a Congressional Fellow focusing on legislation associated with the Clean Air Act, risk assessment, and related issues. He has over 16 years or experience in support of the NNSA Office of Defense Programs (DP), and the Offices of Environmental Management (EM) and Civilian Radioactive Waste Management (OCRWM). He has broad experience identifying and resolving environmental, safety and health issues associated with facility operation, the development and regulation of new facility concepts, and participation in diverse policy, program and technical initiatives.
PROFESSIONAL EXPERIENCE
Senior Project Manager, Science Applications International Corporation - (April 1990 to Present) Dr. Riehm has been the SAIC Project Manager large, multi-task order contracts supporting the NNSA since 2001. These contracts supported up to 22 task orders and utilized the services of numerous subcontractors. Dr. Riehm has also served as manager of SAIC’s Defense and Engineering Solutions Division where he oversaw approximately 50 staff members. From December 2000 through October 2001 Dr. Riehm supported the Office of Civilian Radioactive Waste Management (OCRWM) in the transition of M&O support responsibilities to a new contractor team where he assessed personnel strengths and weaknesses as a prelude to retention recommendations, identified technical issues to be managed through the transition process, provided recommendations on organizational structures, and interfaced with DOE clients to determine their preferences for the incoming M&O organization and staffing. Prior to this Dr. Riehm supported the Defense Programs (DP) Technical Standards Manager and was Task Manager supporting DP’s Office of Environmental Support regarding NEPA compliance, as well as the Office of Technical Support regarding engineering and design support initiatives. Dr. Riehm also supported DP in the implementation of DOE’s program to establish and operate a Core Technical Group (CTG) encompassing Headquarters and field elements; in the development and implementation of responses to various Defense Nuclear Facilities Safety Board Recommendations; in the development and review of processes and programs to incorporate ES&H considerations in the planning and operation of the nuclear facilities within the Nuclear Weapons Complex; and in the transfer of DP’s surplus facilities to the Office of Waste Management and Environmental Restoration for final disposition. He participated in Safety Survey teams for several Y-12 facilities and participated in the review and comment process for Corrective Action Plans in response to Tiger Team assessments for DP facilities at Rocky Flats, Sandia National Laboratories (Albuquerque), and Los Alamos National Laboratory.
Certrec Corporation (October 1989 to March 1990) and KMC, Inc. (May 1983 to September 1989) While on the staff of Certrec and KMC, Dr. Riehm coordinated several nuclear utility user groups and interacted closely with utility personnel and with the staff of the Nuclear Regulatory Commission on significant policy and technical issues including safety classification definitions, quality assurance requirements, and other considerations for each equipment category in the Nuclear Steam Supply System
Revision 2 85 October 2007

Relocation of Non-Nuclear Production to an Alternate Location Business Case
and the Balance Of Plant; fitness-for-duty and access authorization programs; degree requirements for reactor operators; and numerous Region-based inspection and enforcement matters.
Atomic Energy Commission / Nuclear Regulatory Commission (August 1974 to May 1983) As a Licensing Project Manager for light water reactors, Dr. Riehm was responsible for managing the review of the Hope Creek and Limerick boiling water reactor license application projects, as well as the Fluor-Pioneer Balance of Plant and Ft. Calhoun Unit 2 construction permit applications. He subsequently joined the Liquid Metal Fast Breeder Reactors Branch as a Reactor Engineer, where he reviewed the natural circulation capability of the Fast Flux Test Facility, analyzed the potential for steam explosions resulting from molten fuel/water interactions in Floating Nuclear Plants, and served as NRC Project Manager for the safety review of the Clinch River Breeder Reactor. Dr. Riehm served on the Program Support Staff of the Director of the Office of Nuclear Reactor Regulation where he conducted budgetary and programmatic evaluations and was a member of the Reliability and Risk Assessment Branch. From 1980 to 1983, Dr. Riehm was on the staff of the NRC's Office of Policy Evaluation as a Senior Policy Analyst. In this capacity, he participated in the NRC's budget review and performed technical and policy analyses for the Commissioners. During this time, Dr. Riehm was awarded a Congressional Fellowship by the American Political Science Association and served for a year on the staff of Congressman Don Ritter (R-PA). His areas of responsibility included the Clean Air Act, risk analysis, and utility-related legislation.
Westinghouse Electric Corporation, Nuclear Energy Division (August 1968 to August 1971) As a Reactor Engineer, Dr. Riehm worked in the area of reactor core physics, including analysis of load follow capability, use of partial length control rods, and computer modeling.
Revision 2 86 October 2007
Relocation of Non-Nuclear Production to an Alternate Location Business Case
WILLIAM I. TOMAN
EDUCATION M.S. Industrial Administration, Carnegie Mellon University, Pittsburgh, PA, 1985 M.S. Nuclear Engineering, University of California at Los Angeles (UCLA), 1980 B.S. Engineering, University of California at Los Angeles (UCLA), 1978
QUALIFICATIONS SUMMARY Energy industry professional with more than 25 years of US and international experience in energy/environmental project management. Extensive knowledge base and analysis expertise in all aspects of industrial/commercial energy business development, including energy infrastructure siting, environmental permitting, public outreach, financing, construction, operating and marketing the product of energy systems. Recognized as an innovator with strong analytical, written and oral communication skills and ability to work effectively under schedule and other constraints.
PROFESSIONAL EXPERIENCE
SCIENCE APPLICATIONS INTERNATIONAL CORP. (SAIC), Washington D.C. 2004 – Present
Senior Project Engineer, Environmental & Nuclear Security Division • Conceived and produced a procurement program for $4.6 billion of uranium to support long term
production of tritium for DOE-NNSA. Client is reviewing implementation of program. • Evaluated economics and reported on utilizing Blended Low Enriched Uranium (BLEU) nuclear
fuel in a commercial nuclear reactor for DOE-NNSA. • Designed and executed bid evaluation process of a US Department of Agriculture sale of an
ownership interest in a commercial nuclear power plant. Process yielded highest price ever accepted for sale of nuclear capacity.
• Proposal Manager for $5 million bid to Southern California Edison RFP for Advanced Integrated Meter (AMI) program. Bid team progressed to Orals and BAFO stage. Placed second overall to IBM proposal.
• Positioned investor group for $3 billion acquisition of 750 MW of existing geothermal power capacity plus development rights to 400 MW of new geothermal capacity.
• Produced lifecycle cost analyses of mercury stockpile disposal options for the US Environmental Protection Agency showing $52 million in savings for best alternative.
• Recommended changes in the organization of the Idaho Operations Office (Idaho Falls) of the US Department of Energy leading to the establishment of the Idaho National Laboratory.
FLUOR CORPORATION, Aliso Viejo, CA 2004
Economic Consultant Retained to model lifecycle financial and economic outcomes and risks of a proposed $1.2 billion IGCC refinery cogeneration project.
CALPINE CORPORATION, Dublin, CA 1999 – 2002
Development Manager Responsible for taking energy infrastructure projects from inception to financing and construction. Negotiated complex agreements with local governments, regulators, contractors, end users and
Revision 2 87 October 2007
Relocation of Non-Nuclear Production to an Alternate Location Business Case
landowners, while adhering to corporate policies of economic return, public/governmental relations, environmental stewardship, and acceptable business risk.
Projects Included: • Developed and permitted the $45 million Wolfskill Energy Center in 4 months. Negotiated
innovative City Alliance Agreement that gained unanimous project approvals from Fairfield, CA’s City Council. This 45 MW Project is online.
• Initial developer for a $600 million combined cycle generating facility. Negotiated a precedent setting City Alliance Agreement, providing the City of Hayward, CA with community-valued benefits while enhancing project economics and public support. This strategically located 600 MW Project has been fully permitted, has a 10-year tolling contract with Pacific Gas & Electric and is slated for construction start in early 2008.
• As developer for a $45 million infrastructure project, negotiated a unique partnership agreement between a data center developer, California State University at Hayward, the City of Hayward, CA and Calpine to self-generate critically reliable electric power.
CMS ENERGY CORPORATION, Dearborn, MI 1993 - 1999
Project Director (1994 – 1999)International responsibilities were to establish trust and credibility with a sovereign government aboutcompany’s ability to conceive, structure, finance, build, and operate energy infrastructure projects withnational and regional impact. Led projects from initial conception to financing and con-struction. • In concert with Ghana’s Volta River Authority (VRA), negotiated key project term sheets resulting in
the construction of two 110 MW combustion turbine units ($120 million investment) at Takoradi. Financing for a third 110 MW steam generator was approved 5/2004. Total project investment is $244 million. Project is anchor load for West African Gas Pipeline transporting natural gas from Nigeria.
• Directed the due-diligence investigation of a $340 million green field hydroelectric project on the Pra River in Ghana of 170 MW.
• In México City, directed proposal development for a 440 MW gas-fired combined cycle plant, which was to be México’s first privately financed and owned power facility.
Senior Project Development Analyst (1993 – 1994) Co-managed the development and acquisition due diligence activities for the Western US. • Financial analyst in the acquisition due diligence of two-50 MW cogeneration units and two-120 MW
cogeneration units in California.
FLUOR CORPORATION, Irvine (now in Aliso Viejo), CA 1989 – 1993
Manager, Project Analysis Worked closely with the President and Project Directors to anticipate and evaluate independent power owner opportunities and risks. Performed economic analyses of company equity investment decisions for numerous other power plant development projects utilizing gas-fired combined cycle, pulverized coal and Integrated Gasified Combined Cycle (IGCC) technologies. • Lead analyst of a $700 million coal-fired power project in New Jersey. • Managed multi-disciplinary task force which evaluated prospects of company entry into nuclear, high
hazardous waste remediation.
Revision 2 88 October 2007
Relocation of Non-Nuclear Production to an Alternate Location Business Case
PUTNAM, HAYES AND BARTLETT, INC., Cambridge, MA 1985 – 1989
Associate Managed and performed electric and gas utility lifecycle financial modeling and strategic planning for this international economic consulting firm under varying assumptions of economic, operational and regulatory oversight conditions.
DELIAN CORPORATION (now TENERA, INC.), Monroeville, PA 1983 – 1984
Senior Nuclear Engineer Developed computer models for this utility consulting firm to assess nuclear plant accident risks.Analyzed market potential for nuclear construction workscope reduction services.
WESTINGHOUSE ELECTRIC CORPORATION, Monroeville, PA 1980 – 1983
Marketing Analyst (1983) and Nuclear Engineer (1980 – 1982) Modeled severe nuclear plant accident risks in first-ever private industry application of Probabilistic Risk Assessment (PRA) techniques for the Zion, Indian Point and Sizewell B (UK) nuclear stations.
ROCKWELL INTERNATIONAL, B-1 Division, El Segundo, CA Summer, 1977 Engineering Intern Analyzed fuel system performance of initial test flights of three prototype B-1 Lancer Bombers. Obtained Security Clearance.
SECURITY CLEARANCE US DOE “BAO”
Revision 2 89 October 2007