Embed Size (px)
Citation preview
1
Relinquishment Report
for
Licences P118 (3/20a) and P239 (3/19a)
Estimates, statistics, opinions and forecasts contained in this document are based on
TOTAL’s own information and knowledge. They are provided in good faith, but, by their nature,
are based on a number of assumptions and are subjective. Readers should therefore carry out
appropriate reviews and due diligence to satisfy themselves as to all information contained in
this document including, without limitation, TOTAL’s opinions, prospect evaluations, reserve
figures, production and cost forecasts and all technical aspects of production, transmission
and other facilities.
While this information was prepared in good faith, no representation or warranty, expressed or
implied, is or will be made, and no responsibility or liability is or will be accepted by TOTAL or
any of their respective affiliates or subsidiaries, employees, officers, directors and agents as
to, or in relation to, the accuracy or completeness of this document and any liability thereof is
hereby expressly disclaimed.
In furnishing this Relinquishment Report to DECC, TOTAL undertakes no obligation to provide
any Third party recipient with access to any additional information.
2
Contents 1. Licence Information ...................................................................................................................... 3
2. Licence Synopsis ......................................................................................................................... 3
3. Work Programme Summary ....................................................................................................... 4
4. Database ....................................................................................................................................... 4
5. Prospectivity Update .................................................................................................................... 6
6. Further technical work undertaken .......................................................................................... 16
7. Resource and Risk Summary ................................................................................................... 17
8. Conclusions: remaining prospectivity ...................................................................................... 17
9. Clearance .................................................................................................................................... 17
Figure 1 : Location of licence P118 (3/20a) and P239 (3/19a) ..................................................... 4
Figure 2: Seismic database ................................................................................................................ 5
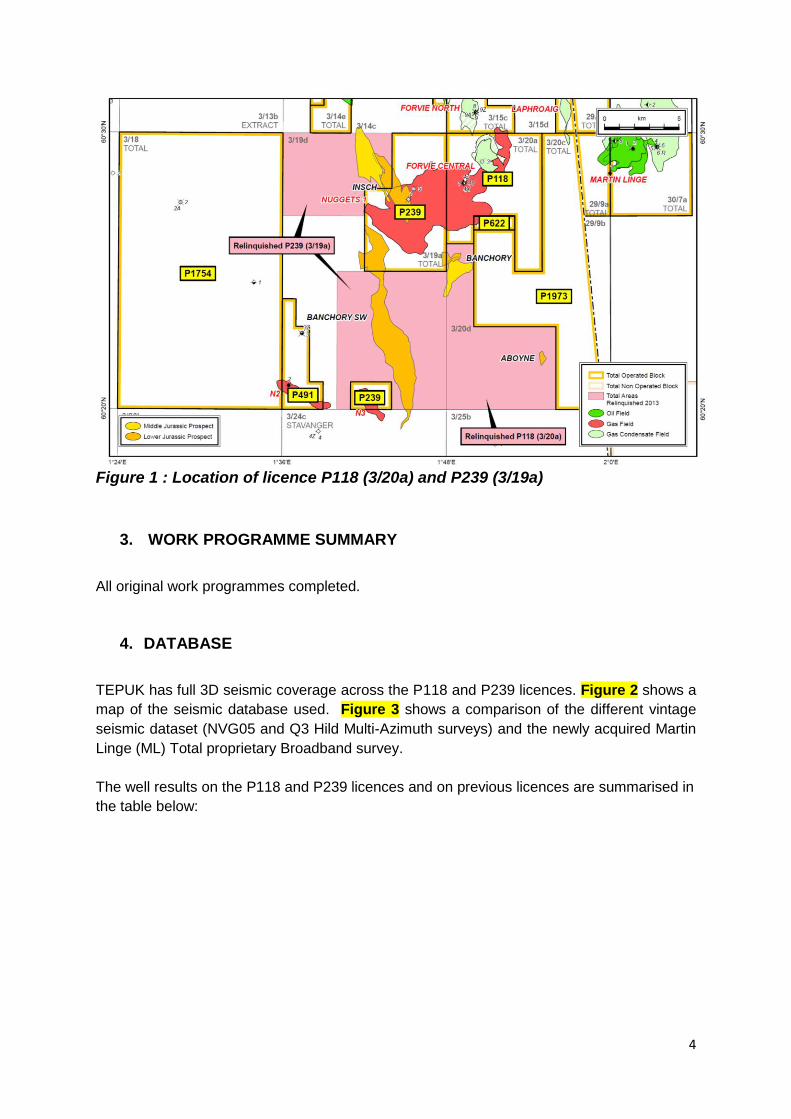
Figure 3: Seismic database comparison –Martin Linge Broadseis 2012-14 MAZ data vs
Vintage data (Q3 Hild 2003 and NVG 2005) .................................................................................... 6
Figure 4: Top Brent Depth Map ......................................................................................................... 7
Figure 5: Insch Upper Brent ............................................................................................................... 8
Figure 6: Insch Lower Brent ............................................................................................................... 9
Figure 7: Banchory Brent .................................................................................................................. 10
Figure 8 Top Statfjord Depth Map ................................................................................................... 11
Figure 9: Fault Sealing Analysis ...................................................................................................... 12
Figure 10: Seal Analysis Alwyn North E2 Fault ............................................................................. 12
Figure 11: Banchory SW Statfjord ................................................................................................... 14
Figure 12: Insch Statfjord .................................................................................................................. 14
Figure 13: Banchory Statfjord ........................................................................................................... 15
Figure 14: Aboyne Statfjord .............................................................................................................. 16

3
1. LICENCE INFORMATION
Licence Number: P118 and P239
Licence Round: 3rd and 4th Round licences
Licence Type: Traditional
Block Numbers: 3/19a and 3/20a
Total E&P UK Ltd confirms DECC is free to publish this report and that all third party
ownership rights have been considered and appropriately cleared for publication purposes.
2. LICENCE SYNOPSIS
Blocks 3/19 and 3/20 are located in the Quadrant 3 (Q3) in the Northern North Sea (NNS)
south from Dunbar, Ellon-Grant, Jura, Islay fields and the recent Laphroaig discovery.
These blocks include the HC discoveries at Statfjord level 3/19b-2 (Shell – marginal
volumes) & 3/19b-3AZ (Shell – tight), Brent level Forvie Central (FC) and Nuggets 1, 2 and 3
in the Tertiary Frigg Formation (Fm) (Fig. 1).
Both 3/19 and 3/20 blocks were awarded 100% to TEPUK, the 3/19 at the 4th licence round
(P239 license, with expiry in March 2018) and the 3/20 block at the 3rd license round (P118
license, with expiry in June 2016). Due to lack of activity, DECC placed both blocks in
Fallow Category BR7 (previously agreed work plan adjusted). TEPUK had several
extensions, one of which was granted in 2011, based on the fact that our seismic
reprocessing was being run out of Cairo and that the Arab uprising had interrupted work.
After discussion with DECC, TEPUK did propose to relinquish the fallow blocks 3/19a and
3/20a outside the Nuggets and Forvie FDA.
TEPUK as a result relinquished part of the P118 and 239 licences on December 19th 2013.
4
Figure 1 : Location of licence P118 (3/20a) and P239 (3/19a)
3. WORK PROGRAMME SUMMARY
All original work programmes completed.
4. DATABASE
TEPUK has full 3D seismic coverage across the P118 and P239 licences. Figure 2 shows a
map of the seismic database used. Figure 3 shows a comparison of the different vintage
seismic dataset (NVG05 and Q3 Hild Multi-Azimuth surveys) and the newly acquired Martin
Linge (ML) Total proprietary Broadband survey.
The well results on the P118 and P239 licences and on previous licences are summarised in
the table below:

5
Figure 2: Seismic database
Block Well Operator Spudded Completed TD (m) Results Comments
3/19
3/19-1,
1RE
Total Oil
Marine
11/09/72 (1)
06/06/73 (1RE)
17/10/72 (1)
19/07/73 (1RE)
2153 (1)
2467 (1RE)
P/A Gas &
OilPrimary objective Eocene Frigg Sands four way dip structure.
150m gross reservoir with 20m gas column & 2m of oil
3/19a-4Total Oil
Marine11/08/1991 20/09/1991 2134 Suspended
Main target four way dip closure at Eocene Frigg level. 45.5m
gross Gas column with a 6m residual oil rim
3/19a-5
NGATotal Fina ELF 30/06/2001 12/08/2001 1860
Suspended
as producer 1st development well Nuggets phase 1. Objective was to penetrate
9m of Frigg sands. Full Gas column encountered
3/19a-7 Total Fina ELF 12/12/2001 31/01/2002 1836Suspended
as producer4th development well Nuggets phase1. Objective was to penetrate
19.5m into the Frigg. Full Gas column encountered
3/19b-2 Shell 15/02/1988 23/06/1988 4115P/A Gas &
Oil
Primary objective Eocene Frigg with an contractual obligation to
investigate at least 500m below BCU. 22m of gas column and 7m
of oil rim were found in the Frigg Sands. 11m of oil bearing
Statfjord Sandstones were encountered
3/19b-3,
3A, 3AZShell
20/02/91 (3)
04/03/91 (3A)
04/04/91 (3)
08/04/91 (3A)
27/06/91 (3AZ)
323
2446
4430
P/AMain goal was to test potential upside downdip of 3/19b-2.
Encountered 30m of oil bearing very tight Lower Jurassic Statfjord
sands
3/19b-6 Total Fina Elf 06/10/2001 26/11/2001 1709Completed
as producer3rd development well Nuggets phase 1. Planned to penetrate 21m
of Frigg Fm. Found 39m of gas bearing Frigg sands
3/20
3/20a-1Total Oil
Marine 30/12/1988 01/02/1989 2180 P/A Gas Well
Targeted Lower Eocene Frigg Fm. 336m gross sand with a 25m
Gas column
3/20a-2 Total Fina ELF 20/08/2001 29/09/2001 1689Completed
as producer2nd development well Nuggets phase 1. Objective as to penetrate
9m of Frigg Fm. Full Gas column encountered
3/20a-3 Total E&P UK 24/01/2006 25/05/2006 4008Suspended
UneconomicMain target faulted Middle Jurassic Brent block. Encountered a
discontinuous gas column with disconnected HC bearing intervals
3/20a-4,
4Z, 4Y,
4X, 4W &
4V
Total E&P UK 22/06/2008 27//01/2009
2777 (4)
3929 (4Z)
2550 (4Y)
2752 (4X)
2495 (4W)2700 (4V)
P/A (4, 4Z,
4Y, 4X, 4W)
Suspended
as producer
(4V)
Replacement for 3/20a-2 Nuggets Frigg well which broke water. 4
Well no HC. 4Z well HC bearing. 4Y P/A for wellbore instability.
4X P/A for wellbore instability. Attempts to ST 4W failed. 4V
confirmed a HC bearing Frigg reservoir and was completed
suspended as producer
6
Figure 3: Seismic database comparison –Martin Linge Broadseis 2012-14 MAZ data vs Vintage data (Q3 Hild 2003 and NVG 2005)
5. PROSPECTIVITY UPDATE
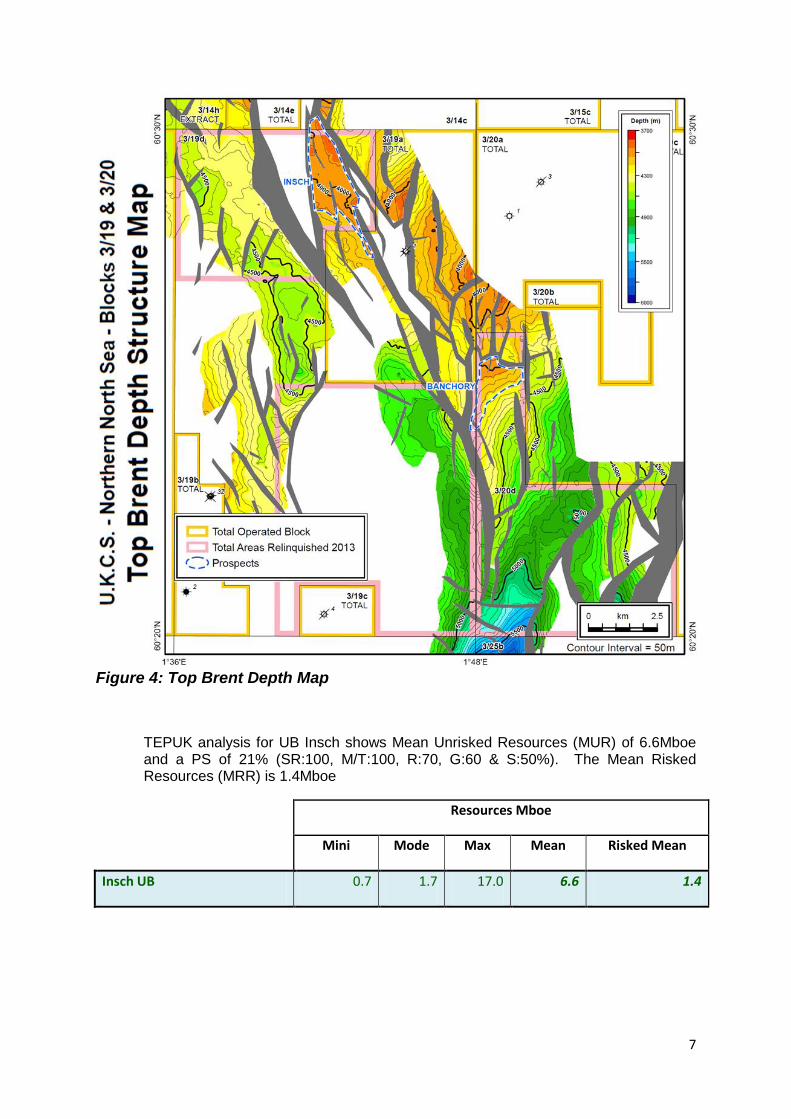
5.1 Brent Prospects Three Brent prospects have been identified. Insch Upper and Lower Brent, Banchory and Aboyne. Insch UB is the shallowest of these Brent segments with a crest situated at -3920m TVDSS; however, it presents a high seal risk (juxtaposition with Triassic Lumvi sands). In contrast, the deepest Banchory has its crest at -4010m TVDSS (Fig. 4). The main risk is geometry due to poor seismic resolution below BCU. 5.1.1 Insch. Insch Brent prospect is divided into Upper Brent (UB) and Lower Brent (LB)
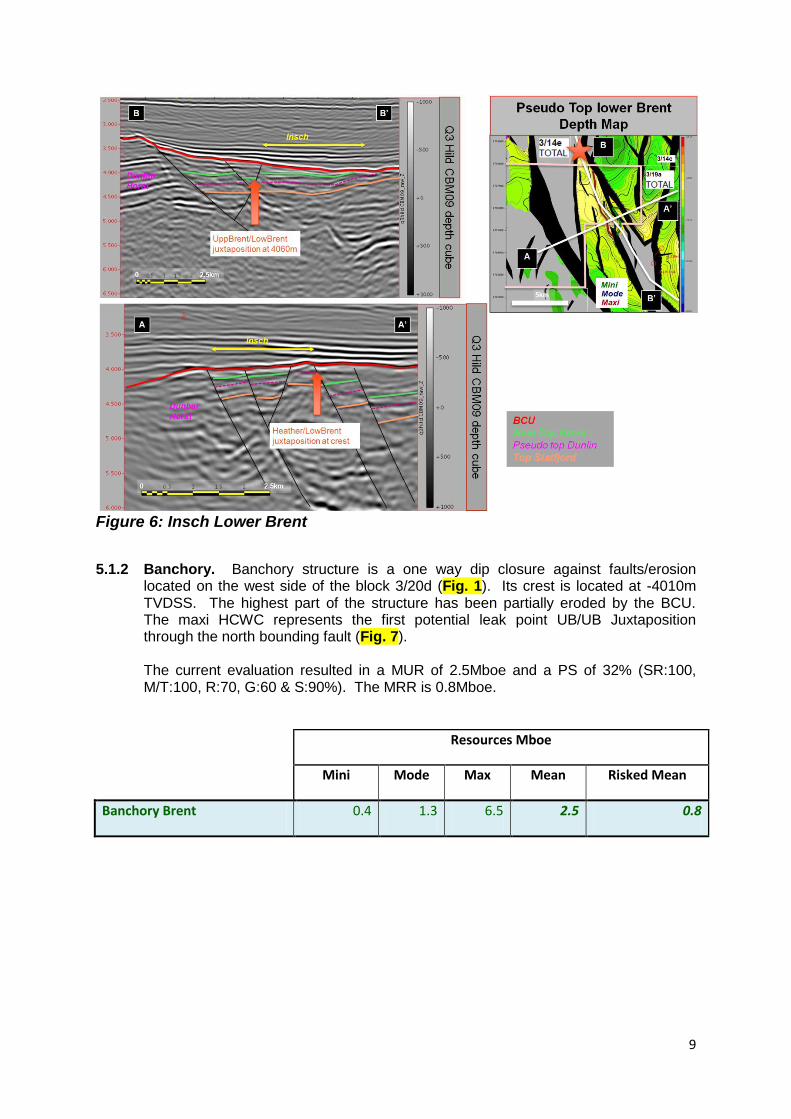
based on the fact that their crests are located in a different position and consequently the juxtapositions differ. It is located between the Blocks 3/19d & 3/19a (Fig. 1). Insch UB is partially eroded by BCU and intra Upper Jurassic unconformity on the eastern part (Fig. 5). Its crest is located at -3920m TVDSS. The maxi Hydrocarbon-Water Contact (HCWC) has been identified at -4060m and represents the first juxtaposition UB/UB.
Presentation title - Place and Country - Date Month Day Year 4
Martin Linge broadseis 2012-14
MAZ depth cube
NVG 2005
CBM 2010 depth cube
Q3 Hild 2003
CBM 2009 depth cube
A A’ A A’ A A’
7
Figure 4: Top Brent Depth Map
TEPUK analysis for UB Insch shows Mean Unrisked Resources (MUR) of 6.6Mboe and a PS of 21% (SR:100, M/T:100, R:70, G:60 & S:50%). The Mean Risked Resources (MRR) is 1.4Mboe
Resources Mboe
Mini Mode Max Mean Risked Mean
Insch UB 0.7 1.7 17.0 6.6 1.4

8
Figure 5: Insch Upper Brent
On the other hand, Insch LB presents a crest at -3940m TVDSS on the eastern side of the structure. The maxi HCWC has been located at -4060m TVDSS and is controlled by the first potential leak point with UB of north panel (Fig. 6). The MUR is of 1.1Mboe and the PS is 38% (SR:100, M/T:100, R:70, G:60 & S:90%). The MRR is 0.4Mboe.
Resources Mboe
Mini Mode Max Mean Risked Mean
Insch LB 0.1 0.5 2.8 1.1 0.4
9
Figure 6: Insch Lower Brent
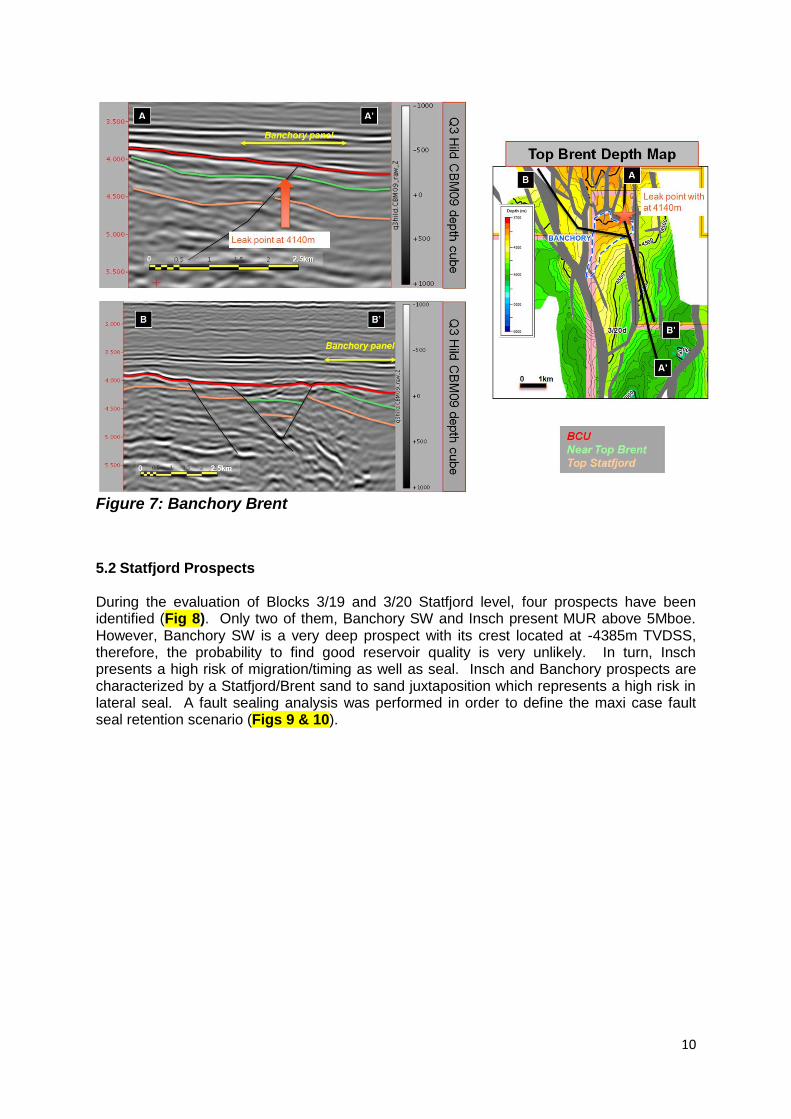
5.1.2 Banchory. Banchory structure is a one way dip closure against faults/erosion
located on the west side of the block 3/20d (Fig. 1). Its crest is located at -4010m TVDSS. The highest part of the structure has been partially eroded by the BCU. The maxi HCWC represents the first potential leak point UB/UB Juxtaposition through the north bounding fault (Fig. 7). The current evaluation resulted in a MUR of 2.5Mboe and a PS of 32% (SR:100, M/T:100, R:70, G:60 & S:90%). The MRR is 0.8Mboe.
Resources Mboe
Mini Mode Max Mean Risked Mean
Banchory Brent 0.4 1.3 6.5 2.5 0.8
10
Figure 7: Banchory Brent
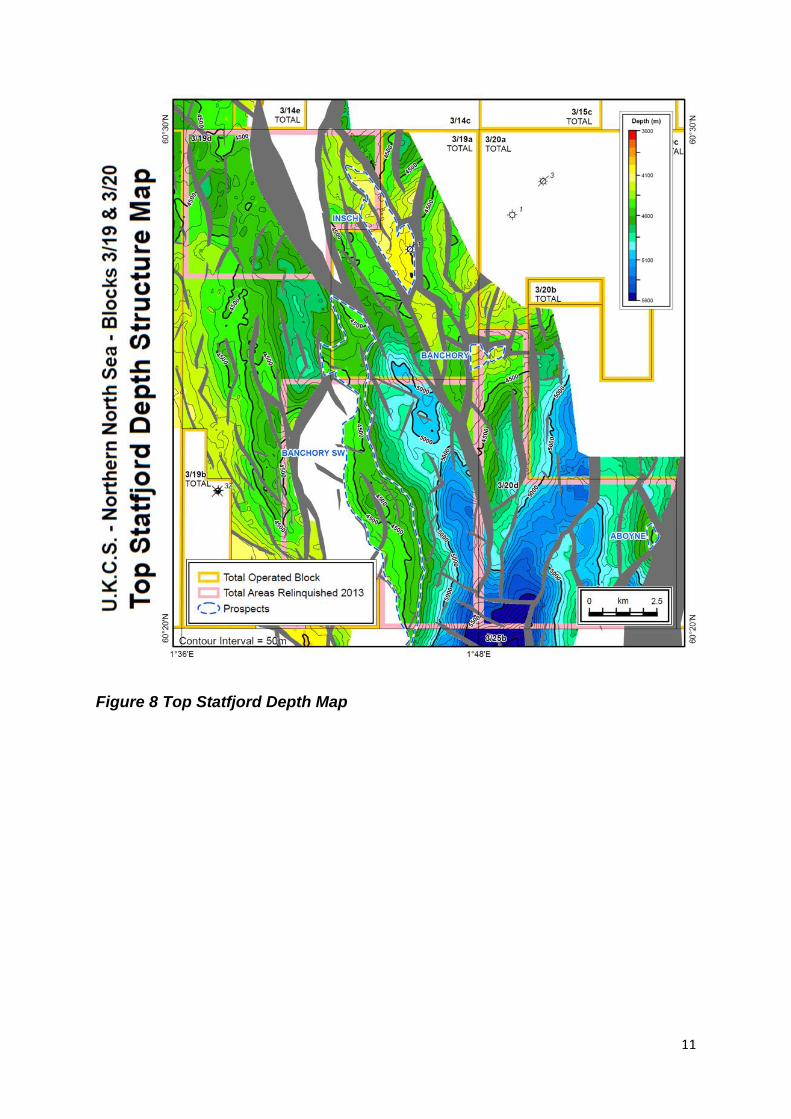
5.2 Statfjord Prospects During the evaluation of Blocks 3/19 and 3/20 Statfjord level, four prospects have been identified (Fig 8). Only two of them, Banchory SW and Insch present MUR above 5Mboe. However, Banchory SW is a very deep prospect with its crest located at -4385m TVDSS, therefore, the probability to find good reservoir quality is very unlikely. In turn, Insch presents a high risk of migration/timing as well as seal. Insch and Banchory prospects are characterized by a Statfjord/Brent sand to sand juxtaposition which represents a high risk in lateral seal. A fault sealing analysis was performed in order to define the maxi case fault seal retention scenario (Figs 9 & 10).
11
Figure 8 Top Statfjord Depth Map
12
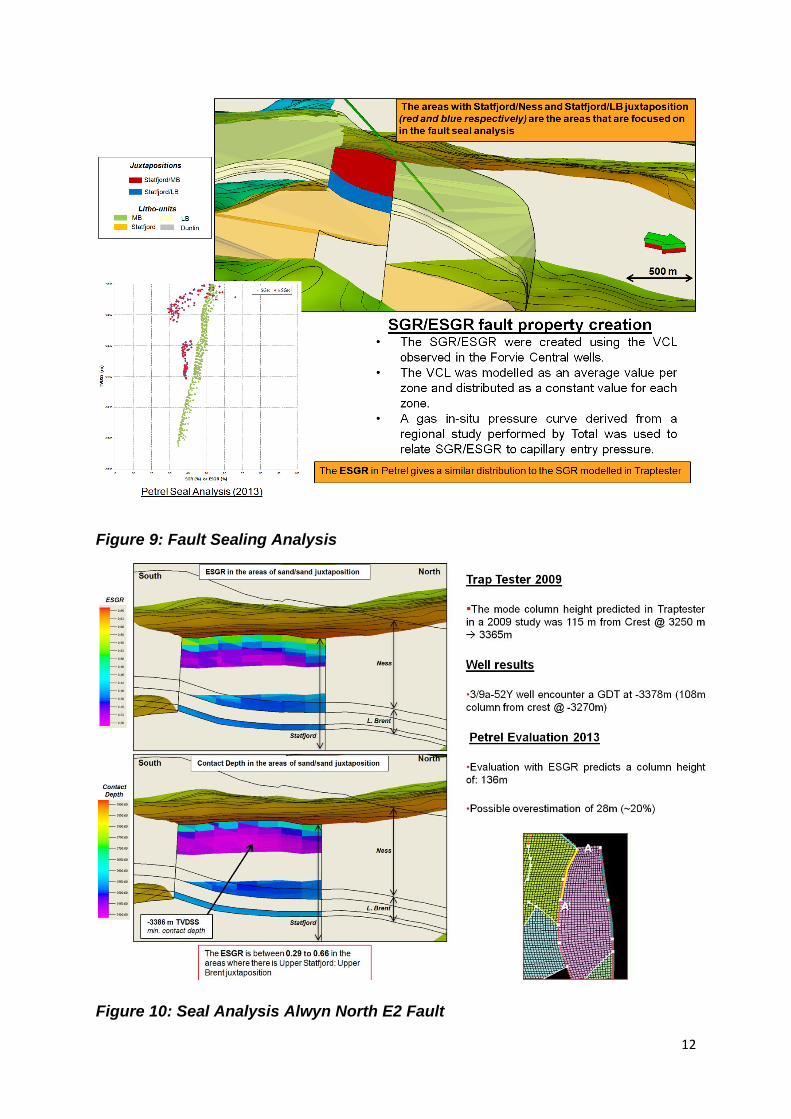
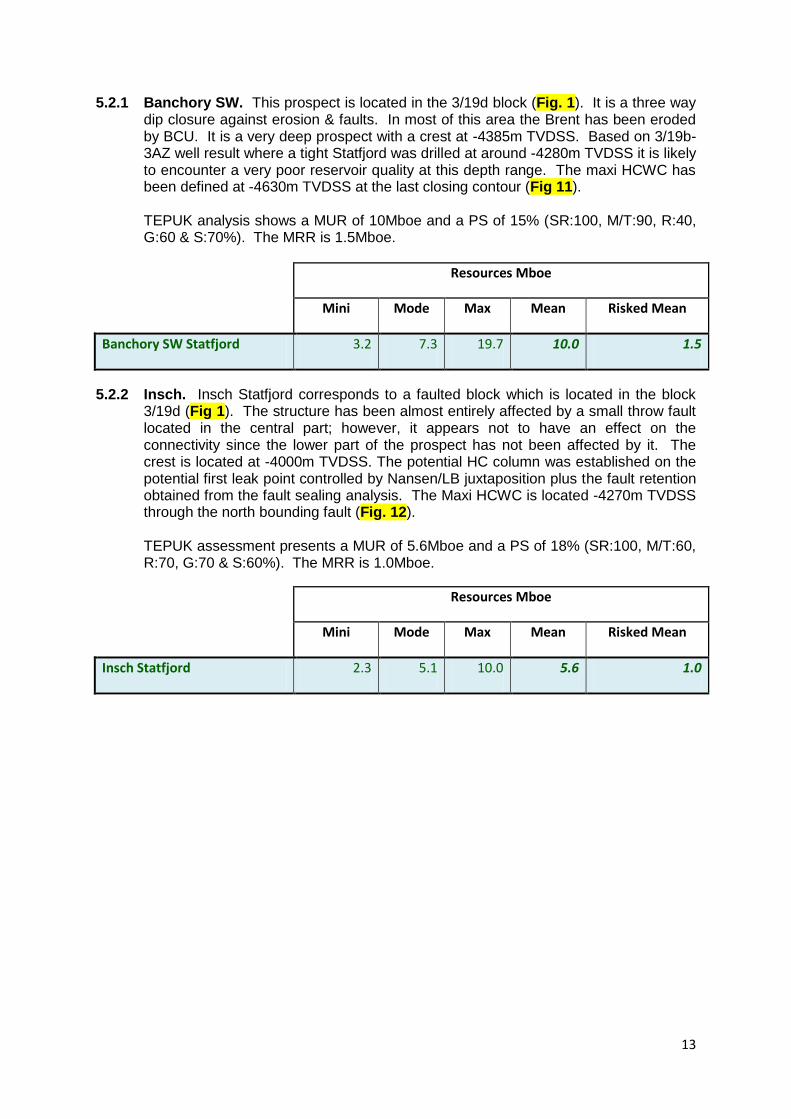
Figure 9: Fault Sealing Analysis
Figure 10: Seal Analysis Alwyn North E2 Fault
13
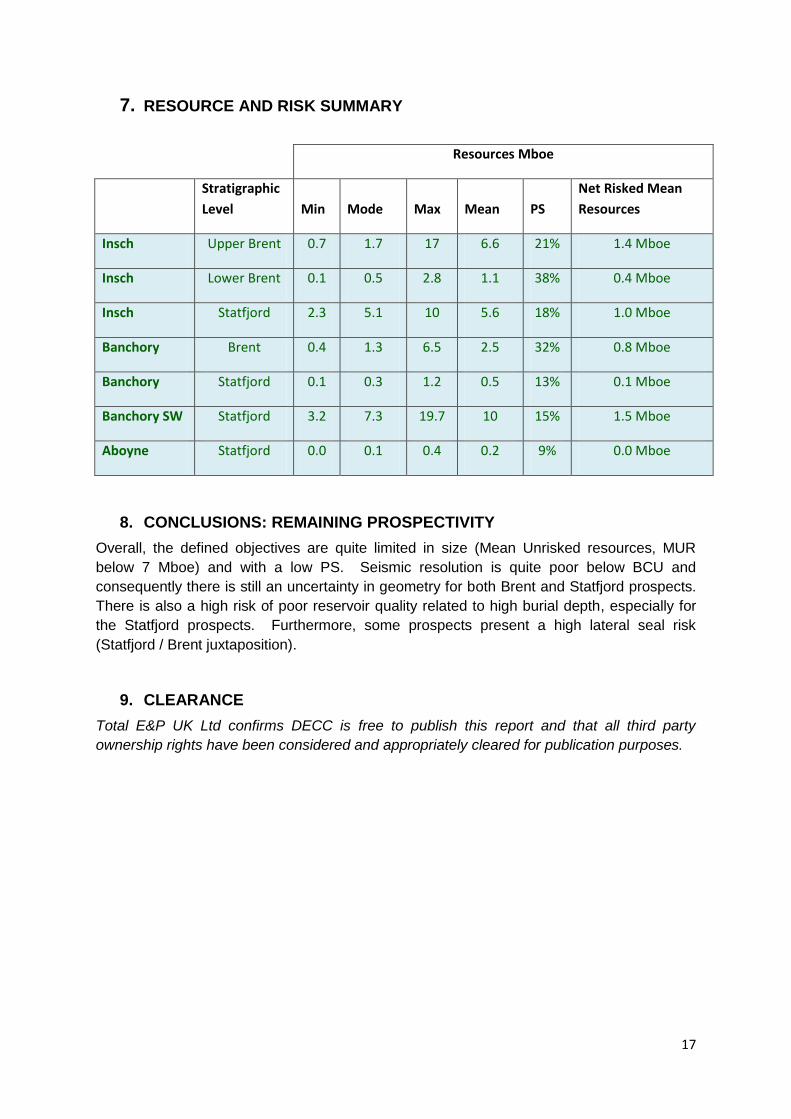
5.2.1 Banchory SW. This prospect is located in the 3/19d block (Fig. 1). It is a three way dip closure against erosion & faults. In most of this area the Brent has been eroded by BCU. It is a very deep prospect with a crest at -4385m TVDSS. Based on 3/19b-3AZ well result where a tight Statfjord was drilled at around -4280m TVDSS it is likely to encounter a very poor reservoir quality at this depth range. The maxi HCWC has been defined at -4630m TVDSS at the last closing contour (Fig 11). TEPUK analysis shows a MUR of 10Mboe and a PS of 15% (SR:100, M/T:90, R:40, G:60 & S:70%). The MRR is 1.5Mboe.
Resources Mboe
Mini Mode Max Mean Risked Mean
Banchory SW Statfjord 3.2 7.3 19.7 10.0 1.5
5.2.2 Insch. Insch Statfjord corresponds to a faulted block which is located in the block 3/19d (Fig 1). The structure has been almost entirely affected by a small throw fault located in the central part; however, it appears not to have an effect on the connectivity since the lower part of the prospect has not been affected by it. The crest is located at -4000m TVDSS. The potential HC column was established on the potential first leak point controlled by Nansen/LB juxtaposition plus the fault retention obtained from the fault sealing analysis. The Maxi HCWC is located -4270m TVDSS through the north bounding fault (Fig. 12). TEPUK assessment presents a MUR of 5.6Mboe and a PS of 18% (SR:100, M/T:60, R:70, G:70 & S:60%). The MRR is 1.0Mboe.
Resources Mboe
Mini Mode Max Mean Risked Mean
Insch Statfjord 2.3 5.1 10.0 5.6 1.0

14
Figure 11: Banchory SW Statfjord
Figure 12: Insch Statfjord

15
5.2.3 Banchory. It is a two way dip closure against fault. Banchory Statfjord does not appear to have been affected by BCU erosion as it’s the case at the Brent level. The crest is located at 4150m TVDSS and presents a partial juxtaposition against Dunlin. The Maxi HCWC is located at -4320m TVDSS and was established based on the potential first leak point controlled by Nansen/LB juxtaposition in addition to the fault retention from fault sealing analysis (Fig. 13).
Figure 13: Banchory Statfjord
TEPUK analysis presents a MUR of 0.5Mboe and a PS of 13% (SR:100, M/T:70, R:50, G:60 & S:60%). The MRR is 0.1Mboe.
Resources Mboe
Mini Mode Max Mean Risked Mean
Banchory Statfjord 0.1 0.3 1.2 0.5 0.1
5.2.4 Aboyne. It is a small two way dip closure against fault. The crest is quite deep at 4450m TVDSS. The Maxi HCWC is located at -4550m TVDSS and was established based of a fill to spill scenario (Fig. 14). PS of 9% (SR:100, M/T:70, R:90, G:40 & S:60%). The MRR is negligible.

16
Figure 14: Aboyne Statfjord
Resources Mboe
Mini Mode Max Mean Risked Mean
Aboyne Statfjord 0 0.1 0.4 0.2 0
6. FURTHER TECHNICAL WORK UNDERTAKEN
As mentioned before, a fault sealing study was carried out in order to assess Banchory and Insch Statfjord prospects. Figures 9 & 10 illustrate how the methodology was calibrated using Alwyn 3/9a-52Y well results.
17
7. RESOURCE AND RISK SUMMARY
Resources Mboe
Stratigraphic
Level Min Mode Max Mean PS
Net Risked Mean
Resources
Insch Upper Brent 0.7 1.7 17 6.6 21% 1.4 Mboe
Insch Lower Brent 0.1 0.5 2.8 1.1 38% 0.4 Mboe
Insch Statfjord 2.3 5.1 10 5.6 18% 1.0 Mboe
Banchory Brent 0.4 1.3 6.5 2.5 32% 0.8 Mboe
Banchory Statfjord 0.1 0.3 1.2 0.5 13% 0.1 Mboe
Banchory SW Statfjord 3.2 7.3 19.7 10 15% 1.5 Mboe
Aboyne Statfjord 0.0 0.1 0.4 0.2 9% 0.0 Mboe
8. CONCLUSIONS: REMAINING PROSPECTIVITY
Overall, the defined objectives are quite limited in size (Mean Unrisked resources, MUR
below 7 Mboe) and with a low PS. Seismic resolution is quite poor below BCU and
consequently there is still an uncertainty in geometry for both Brent and Statfjord prospects.
There is also a high risk of poor reservoir quality related to high burial depth, especially for
the Statfjord prospects. Furthermore, some prospects present a high lateral seal risk
(Statfjord / Brent juxtaposition).
9. CLEARANCE
Total E&P UK Ltd confirms DECC is free to publish this report and that all third party
ownership rights have been considered and appropriately cleared for publication purposes.


![Wolfram Mathematica Tutorial Collection - Differential Equation Solving With DSolve [2008] [p118]](https://img.pdfslide.us/doc/110x75/55cf936d550346f57b9d7e3d/wolfram-mathematica-tutorial-collection-differential-equation-solving-with.jpg)