Embed Size (px)
Citation preview
Religion, Ethics, and Corporate Behavior
by
Gustavo Grullon Rice University
[email protected] (713) 348-6138
George Kanatas Rice University
[email protected] (713) 348-5383
James Weston
Rice University [email protected] (713) 348-4480
This Version: 9/8/2009
We thank seminar participants at Rice University for useful comments and suggestions. We also thank Yaniv Grinstein for providing us the option backdating data.

Abstract We provide evidence that cultural norms affect the likelihood of unethical corporate behavior. Firms headquartered in highly religious counties are less likely to backdate options, grant excessive compensation packages to their managers, practice aggressive earnings management, and be the target of class action securities lawsuits. Our results are strongest for locations with greater concentrations of Protestants, and especially of Mainline Protestants. Finally, we find that a regulatory change designed to curb option backdating has had a much larger effect in less religious counties, suggesting that regulation and religion are substitute mechanisms for monitoring and control.
1
1. Introduction
Recurring public scandals highlight behavior by corporate executives that could be
characterized as self-serving, unethical or even illegal. For example, many managers have been
involved in transactions apparently designed to artificially inflate stock prices (e.g., earnings
manipulation, misreporting) or to expropriate resources from shareholders (e.g., option
backdating, or excessive compensation). Fear of disclosure and/or legal action serves to mitigate,
in part, this type of behavior. However, another potential mechanism for control may be the
moral/ethical environment in which economic agents act. In this paper we test the hypothesis
that cultural controls affect the likelihood of such ethically questionable corporate behavior.
Executives (and other employees) at corporate headquarters presumably live in or near
the community and are exposed to its cultural values and norms. If many of them bring this
ethical system inside the firm, it would presumably help create a corporate culture that either
tolerates, or does not, “bad” behavior by the firm’s employees and executives. Our empirical
strategy is to use a measure of religious activity, or religiosity, as a proxy for the strength of
ethical norms within the community in which a firm is headquartered, and test whether such
norms mitigate unethical corporate behavior.
Until recently, economists have not paid much attention to the importance of societal
cultural factors in explaining economic institutions and behavior. This neglect occurs despite an
emphasis by classical economists such as Adam Smith (1790) on culture’s importance in
understanding economic outcomes. However, a recently renewed appreciation for the role of
culture in economic activity is highlighted by Guiso, Sapienza, and Zingales (2006), who argue
that improved techniques and data availability are uncovering cultural-based explanations to
important economic questions.
2
Other social scientists have also emphasized the influence of a society’s culture, viewing
its ethical system in particular, as an important determinant of economic growth, prosperity, and
development (see, for example, Weber (1905), Banfield (1958), and Harrison (1985)). For
example, a well-known (and controversial) view is that of Weber (1905), who distinguishes
between the ethical codes of Protestants and Catholics, and argues that a primary cause of the
North/South economic growth gap is that Protestantism motivates greater economic development
than Catholicism.1
Economists’ recent focus on culture has provided some theoretical support and empirical
evidence of its importance for economic outcomes (Grier (1997), Landes (1998), Treisman
(2000), Guiso, Sapienza and Zingales (2003, 2004, 2006), Barro and McCleary (2003), and Stulz
and Williamson (2003)). This literature has largely focused on macro implications for growth
and development, and for institutions such as private property rights. In contrast, our interest is
in the effects of culture on an individual’s behavior, and by extension, on corporate behavior.
More specifically, we are interested in the aspect of culture that seeks to promote socially
acceptable behavior – namely, a society’s ethical or moral code as embodied in its religion – and
its contribution in understanding corporate behavior.2
Adam Smith (1790) emphasized the influence of morality in engendering feelings of guilt
or pride as a motivator of proper behavior.3 This religious inculcation of moral sentiments
relates to the concept of a sense of self, or identity, as in Akerlof and Kranton (2000) who study
its importance in economic decision-making. While most (organized) religions have common
elements to their ethical or moral codes, there are distinctive differences among religions ---
1 See Woessmann and Becker (2009) and the references therein for a recent critical treatment of Weber’s argument. 2 We will use the terms ethics and morality interchangeably, meaning that a society’s ethical system is based on its moral code. 3 See Kaplow and Shavell (2007) for a theoretical study, based on this aspect, of the optimal moral system.
3
e.g., in how they conceive heaven and hell, salvation, God, and an after-life --- and these
differences in beliefs have implications for the strength of the cultural identities of their
members. This view is also consistent with the observation (Weber (1905), Harrison (1985)) that
some cultural identities, reflecting a particular ethical system � such as Protestantism �
emphasize feelings of pride in one who engages in moral behavior, while others � such as
Catholicism � emphasize feelings of guilt from engaging in immoral behavior. Thus,
individuals who view themselves as Protestants may experience different utilities from those
who view themselves as Catholics, despite taking identical actions, whether these actions are
ethical or unethical.4
We study behavior within corporations that would likely be viewed by the public as
unethical, undesirable, or at least unfair. Of course this is an ambiguous definition, but it seems
reasonable that the measures we employ are actions corporate executives might not want to have
publicized. Here we might mention that the notion of “fairness” is part of the moral code of
most organized religions – behaving “fairly” is a requirement of such ethical systems.5 We use
different data samples of such inappropriate managerial behavior--- rather than focusing on one
particular type of behavior --- thereby enabling our study to provide a more robust link between
religiosity and ethical behavior promoted by corporate culture. With this aim in mind, we use the
following corporate actions or events as proxies for inappropriate or unethical behavior: (1)
federal class action lawsuits against corporate executives and/or corporations, (2) option back-
dating, (3) seemingly excessive executive compensation and, finally, (4) earnings manipulation
4 Kanatas and Stefanadis (2008) provide a formal analysis showing that societies with pride-based ethical systems exhibit greater economic prosperity than societies with guilt-based systems. 5 Behaving fairly is a value that spans virtually all moral codes and which some social and evolutionary scientists have argued may be “hard wired” in our species (see for example, Heidt (2006)).

4
as indicated by the extent of abnormal accruals. While most of these behaviors are not per se
illegal, they would certainly not be viewed favorably from an ethical or moral perspective.
To test our main hypothesis, we link the occurrence of these corporate events or actions
to the religious composition of the county in which a firm is headquartered, focusing on the
major religious denominations in the U.S. – e.g., Catholics and Protestants.6 If greater religiosity
indeed means a stronger sense of morality throughout the county, then we should find that the
probability of undesirable corporate behavior decreases with higher levels of religiosity.
We also disaggregate our measure of moral culture to test for differences between
religious denominations. According to Weber (1905), different religions entail different degrees
of ethical rigor with Protestantism requiring a more strict moral code than Catholicism (see also
Banfield [1958], Harrison [1985], and Guiso, Sapienza and Zingales [2006]). In fact, there is
empirical evidence that religious differences can affect economic growth (e.g., Barro and
McCleary (2003)). Therefore, in our context, we predict that communities with greater
concentrations of Protestants are less likely to exhibit unethical corporate behavior.
Measuring county religiosity by the per capita number of members of an organized
denomination as well as by the per capita number of churches, we find that both measures
independently have a negative effect on the likelihood of inappropriate behavior. Specifically,
we find that firms headquartered in more religious counties are less likely to be the target of class
action securities lawsuits, manipulate earnings through the use of accruals, backdate options, and
grant large compensation packages to their managers. Distinguishing between Protestants and
Catholics, we find that Protestantism has a strong deterrent effect on unethical behavior; the
evidence for firms headquartered in Catholic counties is somewhat weaker. When we further
6 Other major world religions are too small to consider separately in the US. According to the 2001 National Survey of Religious Identification (NSRI), over 76% of the US population self-identify as Christian. After self-identification as Nonreligious/Secular (13%), the next largest religion is Judaism with just 1.3% of the population.
5
disaggregate Protestant adherents into the different denominations (Mainline Protestants, and
Evangelicals), we obtain our strongest results, with Mainline Protestants standing out with the
most consistent, strong, and highly significant effect across all samples.7 This denomination has
a greater mitigating effect on corporate (mis)behavior than any other Protestant denomination, or
of Catholicism. It seems that the cultural beliefs of mainline Protestants either represent more
effective monitoring and control, and/or are the ones most likely to form the foundation for
corporate culture.
Finally, we test our hypothesis using a quasi-natural experiment. In 2002, the SEC
imposed a regulatory change aimed at curbing the practice of option backdating. Evidence
presented in Heron and Lie (2007) suggests that backdating declined substantially after the
change. Thus, if religion is effective at monitoring and control, then the SEC rule should have a
stronger effect on firms headquartered in less religious counties. And indeed, we find that the
regulatory change has a larger deterrent effect on firms headquartered in low-religious counties.
Further, the effect is stronger for Protestantism than Catholicism.
Our study complements recent work by Hilary and Hui (2009) who link religiosity to
corporate risk exposure and investment decisions. The link between religion and corporate
executive behavior in our paper is through religion’s moral code, rather than attitudes towards
risk. And not only do we show that community religiosity has an effect on (unethical) corporate
behavior, but our analysis also emphasizes the potential differences across religious
denominations in the strength of the moral codes inculcated in their members and therefore the
potentially different effects on behavior.
7 For example, large mainline denominations are Methodist, Presbyterian, and Episcopal churches. Denominations categorized as Evangelical are more disperse but notable examples would include most Baptist and Pentecostal /Charismatic denominations and the Churches of Christ. Appendix A describes the categorization we use in detail
6
Overall, our evidence highlights the importance of cultural norms and values in
explaining economic decisions and outcomes, supporting the related work of La Porta et. al.,
(1999), Stulz and Williamson (2003), Guiso, Sapienza, and Zingales (2003), and Hilary and Hui
(2008), among others). We show that religiosity has a significant deterrent effect on
inappropriate – i.e., illegal and/or unethical --- behavior by managers of locally headquartered
firms. This finding suggests that firms may be adopting the values of their local communities as
an important part of their own corporate culture.
Finally, we should emphasize a point that was perhaps only implied above regarding the
interpretation of our results. We view our results as showing that the community’s social culture
– specifically, its sense of morality that comes from religious teachings – imparts feelings of
guilt (or of pride) for behaving unethically (or ethically), as in Smith (1790). Therefore, morality
becomes a motivator of behavior, as part of the structure of incentives facing any decision-
maker; it is not some unknown factor that influences decision-making apart from incentives.
The paper is organized as follows. Section 2 describes the sample selection procedure,
defines the variables, and provides summary statistics. Section 3 investigates the empirical
relation between several measures of religiosity and our proxies for inappropriate or unethical
managerial behavior. Section 4 provides robustness tests, and Section 5 concludes the paper.
2. Samples and Variable Definitions
This section describes the samples and variables used in our study. We first discuss our
proxies for religious participation and then explain our logic behind our measures of
inappropriate or ethically questionable behavior. Finally, we briefly discuss the control variables
used in our empirical tests and provide some summary statistics of our samples.

7
2.A Proxies for Religious Activity
As in Hilary and Hui (2009), we use data from the Religious Congregations Membership
Study to create our proxies for the level of religious participation in a county. Every 10 years the
Association of Statisticians of American Religious Bodies (ASARB) compiles data from national
surveys on religious affiliation in the United States. Based on the results from these surveys, the
ASARB prepares the Religious Congregations Membership Study, which reports county-by-
county data on the number of churches and total adherents by religious affiliation. This report is
made publicly available through the Association of Religion Data Archives (ARDA) website. In
this study we use data from the 1990 and 2000 surveys, thereby enabling us to measure changes
over the decade.
Following the guidelines used by ARDA, we aggregate Christian denominations into
three main groups: (a) Catholics, (b) Evangelical Protestants, and (c) Mainline Protestants.
ARDA uses the classification scheme developed by Steensland et al (2000). However, when a
denomination does not appear in Steensland et al (2000), ARDA classifies the denomination
using the definitions in Melton (1998) and Mead and Hill (1995). According to the 2000 survey,
over 90% of the religious adherents in the United States belong to one of these three main
groups. The appendix provides a full listing of the denominations included in each group.
We measure the strength of religious activity in a county using the number of churches
per capita. We also use the total number of adherents per capita. The two measures are highly
correlated and we generally find similar results using both measures. However, since the number
8
of adherents is more difficult to verify, the statistics may be biased upward and the bias may be
larger for measures of Catholic adherents.8�
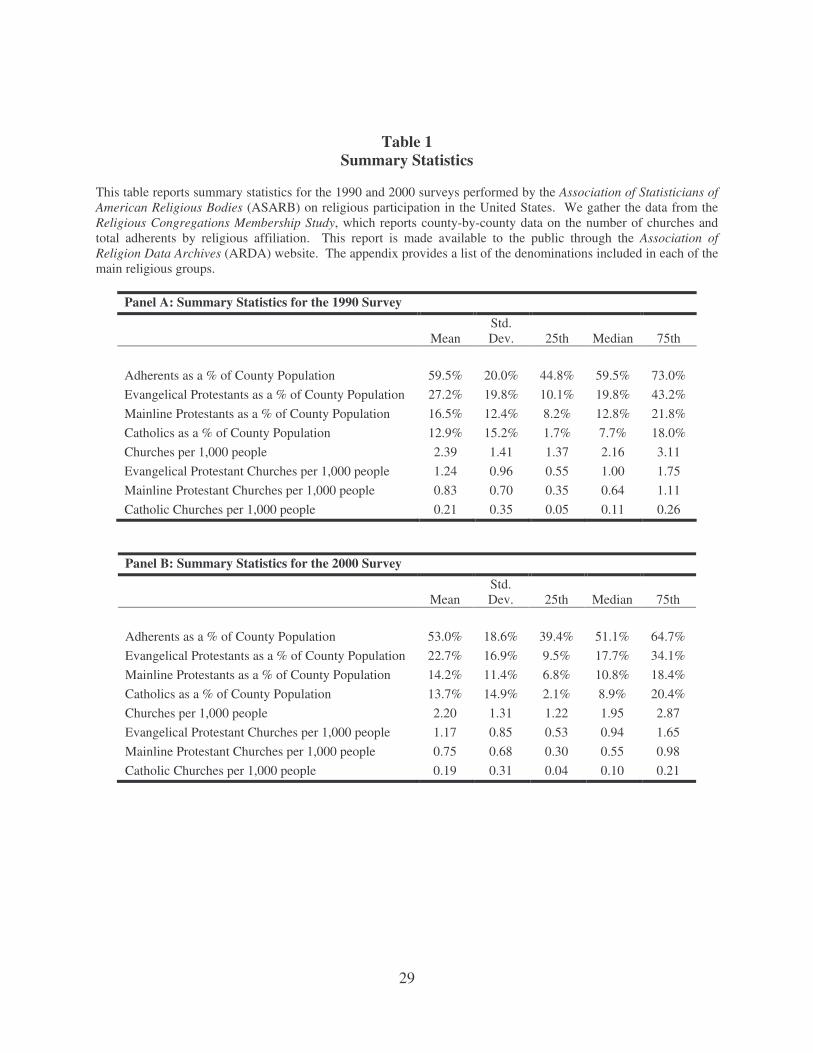
Table 1 reports summary statistics for the 1990 and 2000 surveys on religious
participation. For the typical county in the U.S., the total number of adherents as a fraction of
county population was approximately 60% in 1990 and 53% in 2000. Consistent with the
results in recent surveys, these figures show a declining trend in religiosity among the U.S.
public.9 Table 1 also reports that the typical county had approximately 2 churches per 1,000
people in 1990 and 2000. While our analysis focuses on cross sectional variation, it is interesting
to note that there is a substantial decline in most measures of religiosity from 1990 to 2000,
which is consistent with a broad demographic trend towards secularism. 10 Finally, there is large
variation in our measures of total religious activity across counties and for Catholic, Protestant,
and Evangelical denominations separately.
2.B Proxies for “Inappropriate” Behavior
B.1. Class Action Lawsuits
A primary function of federal securities laws is to protect investors from corporate fraud.
When violations of these laws are identified by various stakeholders (e.g. investors, regulators,
employees, etc.), the result is typically a federal class action lawsuit. Although defendants in
such lawsuits are only accused of violating federal securities regulation, these lawsuits appear to
signal a broader and more negative view of management behavior. For example, Pritchard and
8 See Hout and Greely (1998) and the references therein. Overall, survey responses and self-reported numbers suggest that people may systematically overstate their degree of religiosity. Further, there appears to be more variation in the discrepancy across Catholic dioceses. 9 The 2008 American Religious Identification Survey reports a significant decline over the period 1990-2008 in the number of people who identify themselves as religious. 10 One exception to this is the number of Catholic adherents, although these numbers may be less reliable, as noted.
9
Ferris (2001) find that while investors react negatively to both the revelation of potential fraud
and the filing of a lawsuit, they do not react to the court’s ultimate decision on the merits of the
case. Further, Karpoff et al (2005) provide evidence that most of the value destruction during a
class action lawsuit comes from damaged reputation to the firm and not from the direct penalties
and settlements from the case. Therefore, these findings suggest that class action lawsuits are a
reasonable method of identifying corporate behavior that, at the minimum, is generally viewed as
inappropriate.
Of course, a limitation of using class action lawsuits in our context is that these events
capture both the incidence and disclosure of potential fraud. Thus, empirical results based on
this measure might be interpreted as evidence of religion affecting either the likelihood of a firm
committing fraud or of stakeholders’ incentives to reveal fraud. However, the revelation of
wrong-doing and filing of a class action-lawsuit may be done by individuals that are not at the
location of corporate headquarters and therefore not exposed to the local culture. Thus, the latter
interpretation seems less likely. Nevertheless, we address this possible issue in two ways. First,
we include a measure of litigation risk at the state level to control for cross-sectional differences
in the propensity to report or reveal fraud. Second, our study uses alternative data in which the
detection of inappropriate behavior is based on statistical procedures (e.g., option backdating,
accruals management, excessive compensation), and not on someone detecting fraud and filing a
class action lawsuit. Indeed, a strong point of our analysis is that it does not rely on one
particular sample of inappropriate corporate behavior.
We collect data on federal class action securities fraud lawsuits from the Stanford Law
School’s Securities Class Action Clearinghouse. This clearinghouse maintains a database of all
class action lawsuits since the adoption of the Private Securities Litigation Reform Act (PSLRA)
10
of 1995. We exclude cases in which the company is not directly involved in the alleged fraud
(e.g., mutual fund, IPO allocation cases, analyst recommendations). We then use the class action
lawsuit sample and the Compustat database to identify the targeted firms. We create a dummy
variable equal to 1 if the firm is accused of committing fraud in year t, 0 otherwise. The final
sample used in this analysis consists of roughly 55,000 observations over the period 1996-2006.
As in previous studies, we start our sample after the approval of the PSLRA of 1995 to eliminate
frivolous cases which were allegedly common before this legislation.11
B.2. Option Backdating
Over the past three decades, stock options have become a prominent component of
managers’ compensation packages. While these instruments may be effective in helping align
the interests of managers and shareholders, they also can be abused, resulting in practices that
could be considered as inappropriate or unethical, and in some cases, even as illegal. One of
these practices is option backdating.
In general, firms that grant stock options to their executives and employees set the strike
price so that the options are at-the-money at the time of the grant. One reason for this practice is
that if a firm grants in-the-money options, then it must record the difference between the current
stock price and the strike price as a compensation expense (Accounting Principles Board
Opinion No. 25). In addition, both the manager and the firm receive better tax treatment when
the options are at-the-money than when they are in-the-money (see Heron and Lie (2007) for a
detailed explanation of this issue).
11The PSLRA of 1995 significantly increased the requirements needed to initiate a federal class action lawsuit. Under this legislation, plaintiffs claiming fraud need to "[s]pecify each statement alleged to have been misleading, the reason or reasons why the statement is misleading, and if an allegation regarding the statement or omission is made on information and belief, the complaint shall state with particularity all facts on which that belief is formed" 15 U.S.C. § 78u-4(b)(1).
11
However, prior to 2002, firms could wait several weeks to report to investors and
regulators the stock options granted. Such a delay allows managers or boards to set the grant
date on option grants retroactively to take advantage of the accounting and tax rules while at the
same time allowing their managers to generate immediate capital gains on their stock options.
And indeed, Lie (2005) finds that many firms systematically reported granting stock options
when stock prices were near or at their lowest point in the recent past.
Backdating options is not illegal unless the firm fails to publicly disclose this practice to
investors, and make the proper accounting and tax adjustments. However, many firms were
indeed not complying with these requirements and a large-scale investigation by the Securities
and Exchange Commission (SEC) resulted in hundreds of firms being accused of illegal
backdating. Not only were several executives indicted, but many investors also filed federal
class action suits against their firms. Regardless of how many of these cases reflected illegal
behavior, option backdating has been one of the largest corporate scandals in recent years.
As in the case of class-action lawsuits, firms accused of backdating options incur large
losses in shareholder value from the destruction of reputation (Bernile et al (2008)). This
evidence suggests that the market views such practices as a symptom of a more fundamental
problem in managers’ ethical behavior and possibly of their corporate culture, thereby making
option-backdating a reasonable proxy for inappropriate corporate behavior. In addition, as part
of the Sarbanes-Oxley Act (SOX), the federal government amended Section 16 of the Securities
and Exchange Act of 1934 to try to curtail option backdating by requiring firms to report stock
option grants within two days of the grant date. This regulatory change provides an excellent
setting to test our main hypothesis because if religion has a mitigating effect on unethical
behavior, then religion and regulation may act as substitutes in monitoring and motivating ethical
12
behavior. We test this prediction by examining whether the effect of this regulatory change is
stronger on firms headquartered in less religious counties.
We collect data on option grants from Thomson Financial’s insider trading database. We
use the methodology in Heron and Lie (2006, 2007) and Narayanan and Seyhun (2006) to create
our sample. Specifically, we require observations to have a cleanse indicator equal to R (“data
verified through the cleansing process), H (“cleansed with a very high level of confidence”), or C
(“a record added to nonderivative table or derivative table in order to correspond with a record
on the opposing table”). Following Bebchuk, Grinstein, and Peyer (2009), we define option
backdating as occurring if the CEO receives an option grant on a day when the stock price was at
the lowest level of the month in which the option was granted. The final sample consists of
12,574 observations over the period 1996-2005.
B.3. Executive Compensation
Our third measure of ethically questionable behavior is the granting of excessive
compensation packages to senior corporate executives. This is obviously a controversial
measure. Whether an executive earned his or her compensation is not directly observable.
Superstar CEOs may deserve very large compensation packages if they generate commensurate
shareholder value, much like professional all-star athletes. However, our interest is not in
whether large compensation packages are in the best interests of shareholders, but rather in the
perception of fairness, a concept embedded in most religious moral codes. Thus, while a CEO
may have earned his compensation in the eyes of the corporate board, it may not be viewed as
being fair in the eyes of the community. To the extent the corporate board (and possibly the
CEO) is influenced by the community’s concept of fairness, we predict a negative relation
between measures of the strength of local religiosity and the size of executive compensation.
13
We collect compensation data from Execucomp on a firm’s CEO and Top 5 Executives.
Our measure of total compensation comprises salary and bonus, other annual compensation, total
value of restricted stock granted, total value of stock options granted (using Black-Scholes),
long-term incentive payouts, and all other total compensation. We also create a measure of
relative compensation by scaling the above total compensation by the median income in the
county in which the firm is headquartered. Clearly, we expect that greater executive pay relative
to the county median income would be viewed as being less fair. Our final sample consists of
approximately 21,000 observations over the period 1993-2006.
B.4. Earnings Management
The term earnings management refers to a broad array of both legitimate and illegitimate
decisions that can affect a firm’s reported earnings. Although it is difficult to distinguish
empirically between valid and questionable earnings management, it is clear that the more
aggressive the management of earnings, the more room there is for misleading investors about
the underlying economic condition of the firm. Further, by aggressively manipulating reported
earnings, firms can potentially alter the outcomes of contractual obligations (e.g., debt covenants
and executive compensation) that rely on reported earnings. For these reasons, aggressive
earnings management has been viewed by many as being opportunistic and inappropriate
behavior.
There are a variety of ways to estimate abnormal earnings management; consistent with
previous studies, we use the level of accruals. We follow the approach in Jones, Krishnan, and
Melendrez (2008) and estimate several proxies for abnormal accruals. In total we use five
measures --- total accruals, Jones (1991), modified Jones (1991), Dechow and Dichev (2002)
and modified Dechow and Dichev (2002) --- although, overall, our results are not sensitive to
14
how we measure abnormal accruals. In our main tests, we present results from a combined
measure of the various methods that creates a proxy for abnormal accruals by using the first
principal component of the five techniques. We use Compustat to create these proxies for
earnings management and the final sample consists of roughly 47,000 observations over the
period 1996-2005.
3. Empirical Relation Between Religiosity and Unethical Corporate Behavior
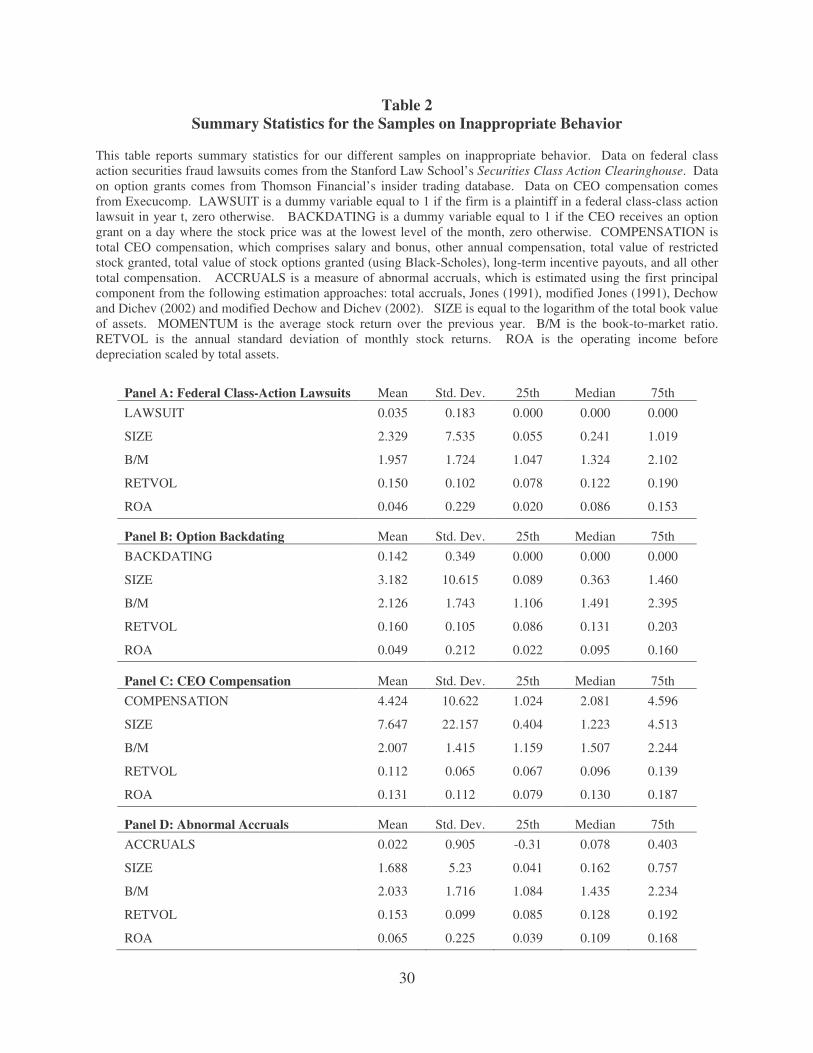
Table 2 presents some brief summary statistics for the four samples used in our study.
The samples are broadly representative of the Compustat database. There is no considerable
difference in the sizes of firms or in the distribution of firms across the four samples, though
firms in the compensation sample do reflect the larger size distribution of Execucomp coverage.
Overall, our sample statistics are qualitatively similar to past studies on fraud, backdating,
compensation, and accrual management. We first present results from a simple univariate test of
the hypothesis that county-level culture affects corporate behavior, and then report the results
from regression-based tests.
3.A Univariate results
Our initial test of the hypothesis that community based religiosity mitigates unethical
corporate behavior is presented in Figure 1. In this univariate test, we partition each of our four
samples into terciles based on our main county-level religiosity metric (total number of churches
per capita). We then compute the unconditional incidences of class action lawsuits and option
backdating, and the unconditional mean levels of executive compensation and abnormal
accruals.
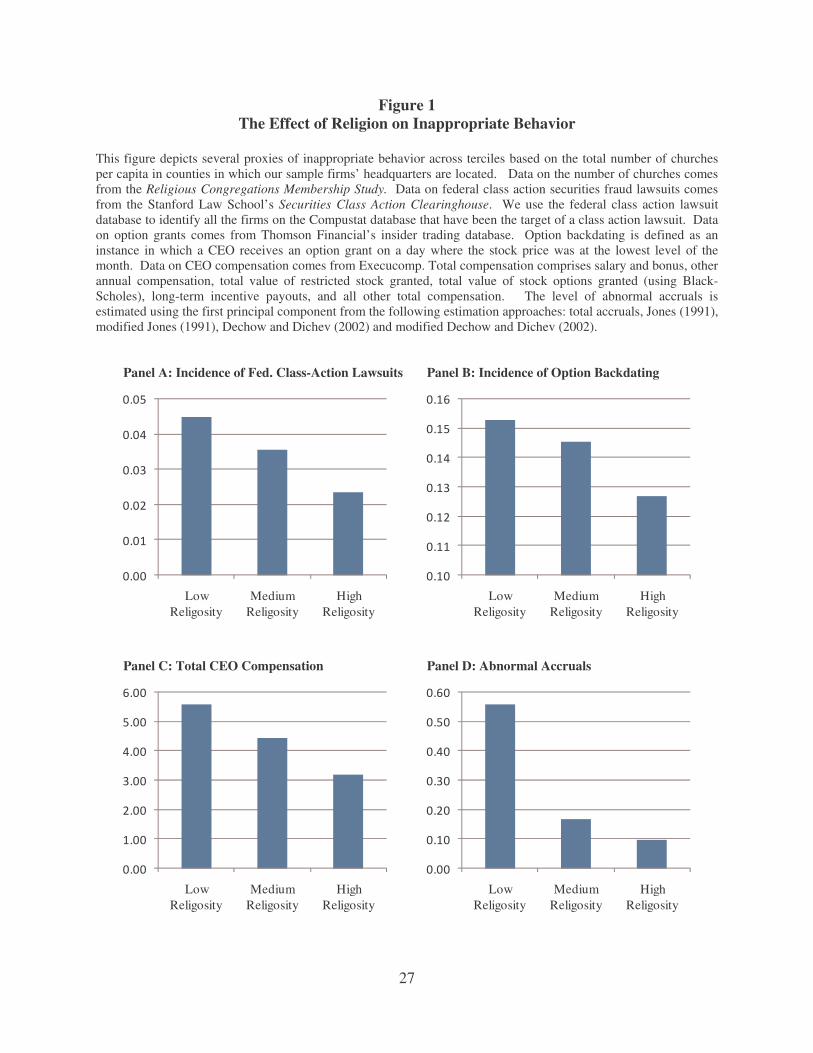
Figure 1 shows a clear pattern. Firms that are headquartered in counties with a low level
of religiosity demonstrate behavior that would more likely be considered unethical by most
15
members of their community. For each of our four measures, we find a monotonic increase in
unethical behavior as community-level religiosity declines. Of course, these are only univariate
tests, but they are indicative of a general pattern in the data that suggests at least a strong
unconditional positive correlation between religiosity and ethical behavior.
3.B Class Action Lawsuits
To test the hypothesis that community-level measures of cultural norms affect the
probability of class action lawsuits, we estimate a series of multivariate logit regressions where
the dichotomous dependent variable is whether or not a firm was the target of a class action
lawsuit. Since factors such as firm size, profitability, past stock returns, volatility of stock
returns, and investment opportunities have been shown to affect the likelihood of class action
lawsuits (see, for example, Field, Lowry, and Shu (2005)), we include these variables in our
regressions. Further, we use the Pacific Research Institute’s litigation risk score to control for
differences across states in the propensity to report or reveal fraud. The litigation risk score
ranks states from least litigious to most litigious based on the structure of the state legal system
and on the incidence of lawsuits. All of our coefficients and standard errors are estimated using
year-by-year Fama-Macbeth logit regressions.
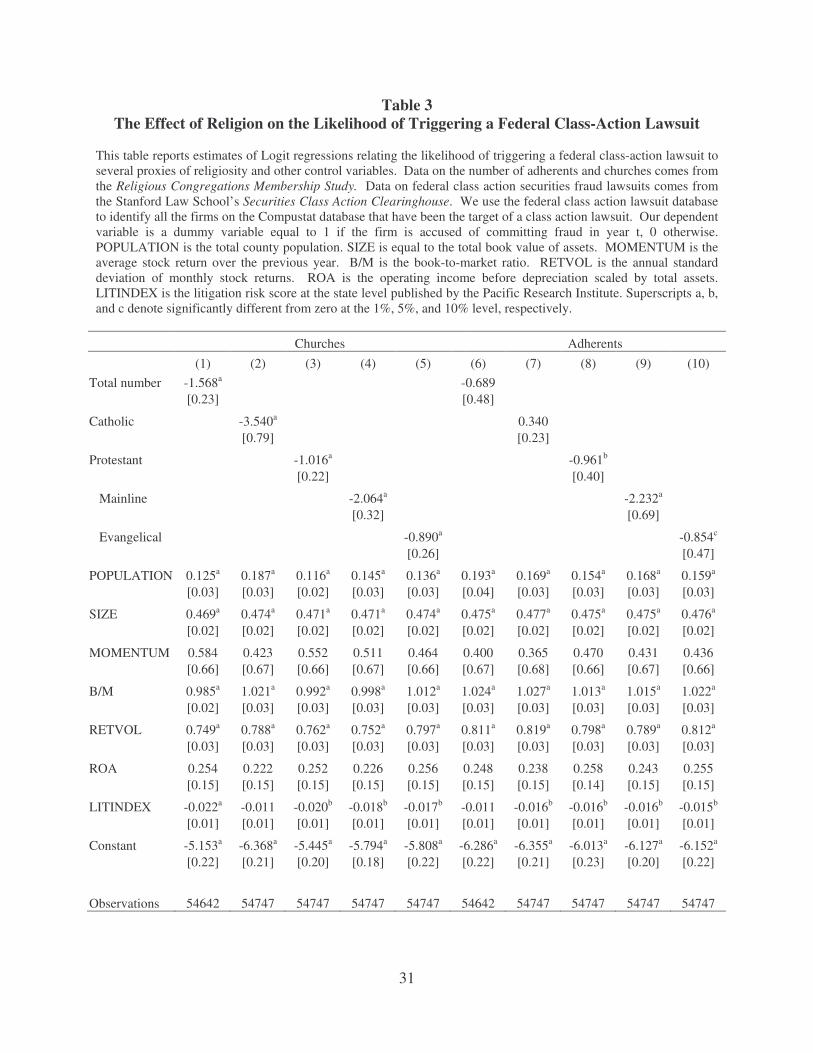
Table 3 presents the results of the multivariate logit regressions. Using the number of
churches as a measure of community religiosity, we find that total, Protestant, and Catholic
religiosity all lead to a lower probability of a lawsuit. These results are also economically
meaningful. For example, consider a one unit change in the log of the number of churches
(roughly a doubling of the number of churches per capita around the mean). The large negative
coefficient estimate of -1.568 (Table 3, Column 1) translates to an odds ratio of about 0.20 which
implies a five-fold reduction in the probability of a class action lawsuit. While a doubling of per
16
capita churches would certainly be a large increase in religiosity, the magnitude of the impact
shows that even more modest changes in religiosity are associated with economically meaningful
effects.
In columns 6 and 7 of Table 3, the coefficient estimates on religiosity suggest that there is
little evidence that either the total number of adherents or Catholic adherents affect the
probability of a lawsuit. However, the number of Protestant adherents does have a statistical and
economically significant effect. For example, the coefficient estimate of -0.961 (Table 3,
column 8) suggests that a ten percent change in the number of Protestant adherents decreases the
probability of fraud by 1.4 percent. Columns 9 and 10 present similar results for both Mainline
and Evangelical Protestants separately.
Apart from the religiosity measures, the regressions are generally well-specified and
stable. Control variables that have been used in past studies are generally significant with the
predicted sign. For example, the probability of a class action lawsuit increases with county
population, firm size, past returns, book-to-market, return variance, and profitability.
3.C Option Backdating
In this subsection we present regression-based tests of the hypothesis that community
religiosity affects the incidence of option backdating. For this analysis we split the sample into
two time periods surrounding the 2002 amendment to Section 16 of the Securities and Exchange
Act of 1934 requiring firms to report stock option grants within two days of the grant date. Table
4 presents two sets of multivariate logit regressions where the dependent variable represents a
dummy for whether or not the firm backdated executive stock options over periods 1996-2001
(Table 4, Panel A) and 2002-2006 (Table 4, Panel B).
17
To control for potential confounding effects, we also include in our regressions firm size,
return-on-assets, past stock returns, volatility of stock returns, market-to-book ratio, and county
population. The results in Table 4 indicate that the probability of option backdating increases
with county population, book-to-market, past profitability (ROA), and return variance. The
probability decreases with firm size while past stock market performance is negative but
generally not significant. These effects are generally consistent across both sub-samples,
although there is stronger statistical significance in the earlier sub-sample when backdating was
more prevalent.
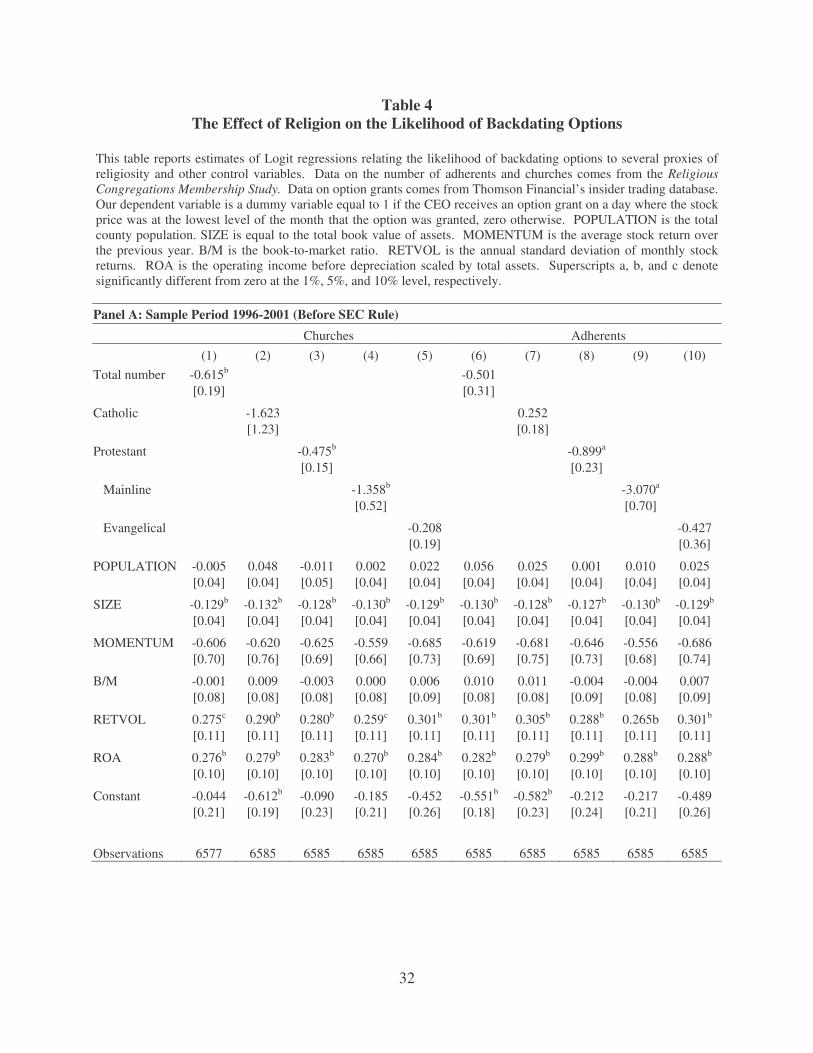
As in section 3.A, we sequentially include our measures of religiosity in columns 1
through 10. Overall, there is strong evidence that county-level religiosity affects the probability
of option backdating in the pre-SEC rule change period. The total number of both adherents and
churches per capita has a negative effect on backdating, although only churches per capita are
statistically significant. It should be noted that the somewhat weak results for aggregate
religiosity appear to be driven by Catholic adherents and churches, which are insignificant.
Protestant (and especially Mainline Protestant) adherents and churches have a large effect
on the probability of option backdating. For example, consider a change in the number of
Protestant adherents per capita from the 25th percentile (roughly 11%) to the 75th percentile
(roughly 30%). This change would translate into roughly a one unit change in the log of
Protestant adherents per capita (ln(0.30)-ln(0.11))=1. The coefficient estimate of -0.899 (Table
4, Column 8), translates into an odds ratio of 0.40 which implies that a unit increase in religiosity
would make the probability of option backdating roughly 2.5 times less likely.
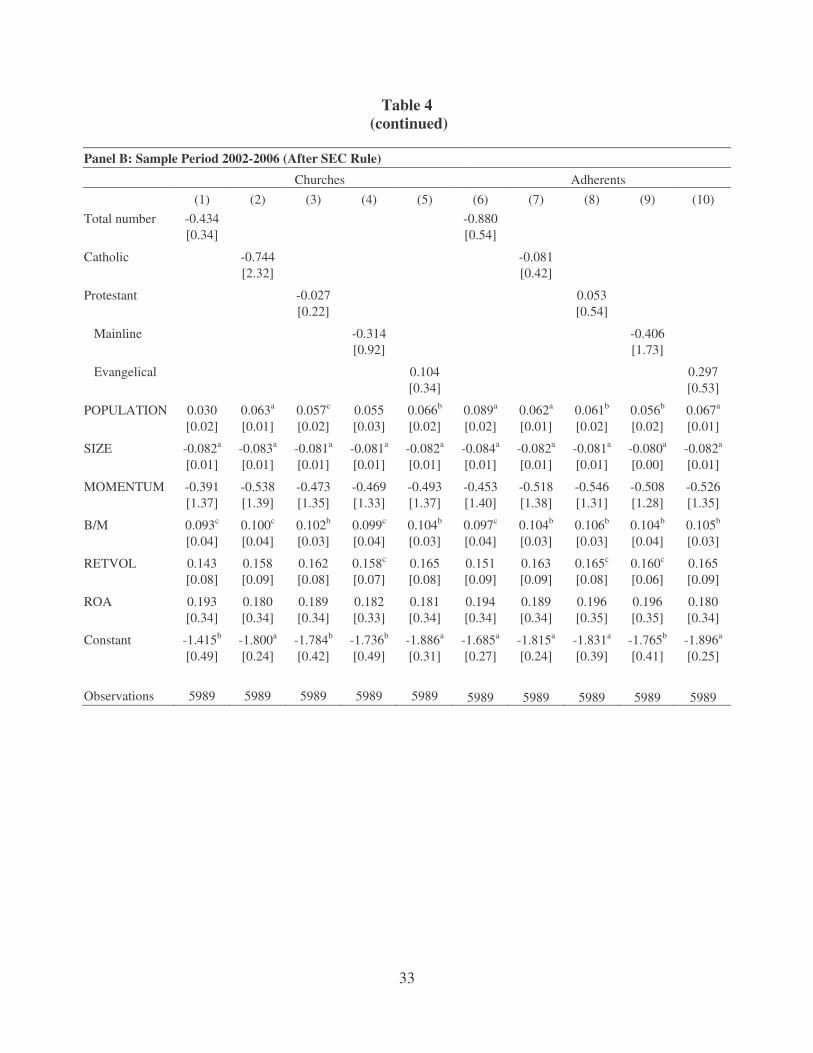
However, Table 4, Panel B presents a different story for the post-SEC rule change period.
The very strong effect of county level religiosity on backdating does not appear at all. In fact,
18
none of the religiosity proxy variables are significant. This change does not stem solely from a
lack of statistical power. While the standard errors do not change much in the post-SEC rule
change period, the coefficient estimates are all closer to zero. It appears that the effect of
religiosity is substantially mitigated by the increased government regulation.
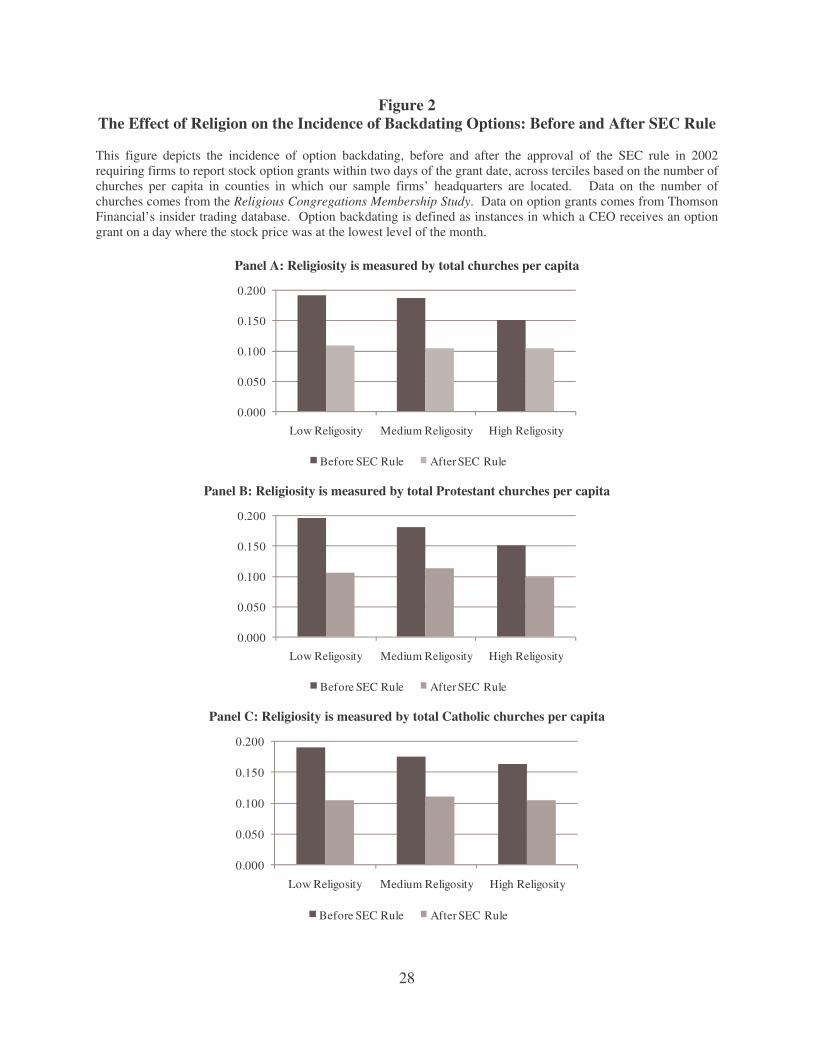
We also investigate in this sub-section whether religiosity affects firms’ reaction to the
2002 regulatory change aimed at curbing the practice of option backdating. Our hypothesis is
that if religion has a mitigating effect on unethical behavior, then this regulatory change should
have mainly affected firms headquartered in non-religious counties. To investigate this issue,
we examine the incidence of option backdating before and after the regulatory change across
portfolios based on proxies for religiosity. The results from this analysis are depicted in Figure
2. Consistent with our hypothesis, we find that firms headquartered in non-religious counties
(low religiosity) experience a larger decline in the incidence of option backdating than firms
headquartered in religious counties (high religiosity). This effect is significant not only
statistically, but also economically. While the propensity to backdate options declined after 2002
from approximately 15% to 10% among firms headquartered in religious counties, the incidence
of backdating options declined from approximately 19% to 10% among firms headquartered in
non-religious counties. In general, these results support the idea that religion is a substitute for
regulation in mitigating undesirable corporate behavior.
3.D Executive Compensation
In this sub-section we present regression based tests of the hypothesis that community
religiosity affects executive compensation. Our approach is similar to past studies on the cross-
sectional determinants of executive pay. For example, following Bebchuk and Grinstein (2005),
among others, we control for firm size, profitability, stock returns, investment opportunities, and

19
volatility. Further, we also include in the regressions the total county population and the county
median income to control for systematic differences in salaries across counties (e.g., adjustment
for cost of living, urban vs. rural areas, etc.).
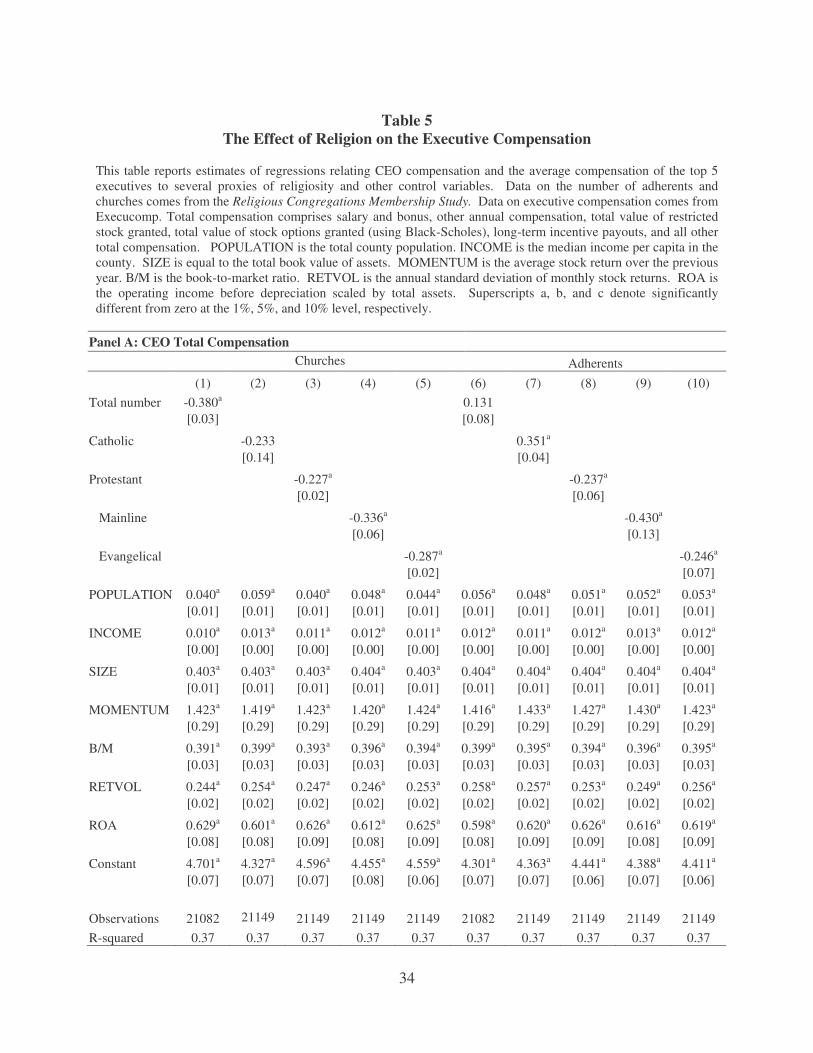
Table 6 presents our results for CEO total compensation. Consistent with our results on
securities fraud lawsuits and option backdating, we again find that community-level religiosity
has a significant effect. For all denominations, we find that the number of churches has a strong
negative association with executive pay. While the effect of number of Catholic churches is not
significant, results are strong for the Protestant denominations. For the number of adherents, we
find similar results with the exception that Catholic adherents (again) stand out as having no
substantial effect.
The economic size of the effect is large; for example, consider a change in the total
number of churches per capita. Since both the dependent and independent variables are in logs,
the coefficient estimates can be directly interpreted as elasticities. For instance, the coefficient of
-0.38 on the total number of churches per capita suggests that a one percent increase in the total
number of churches per capita would drop CEO pay by 0.38 percent. A larger one-standard
deviation change in the total number of churches per capita would decrease CEO pay by 3
percent.
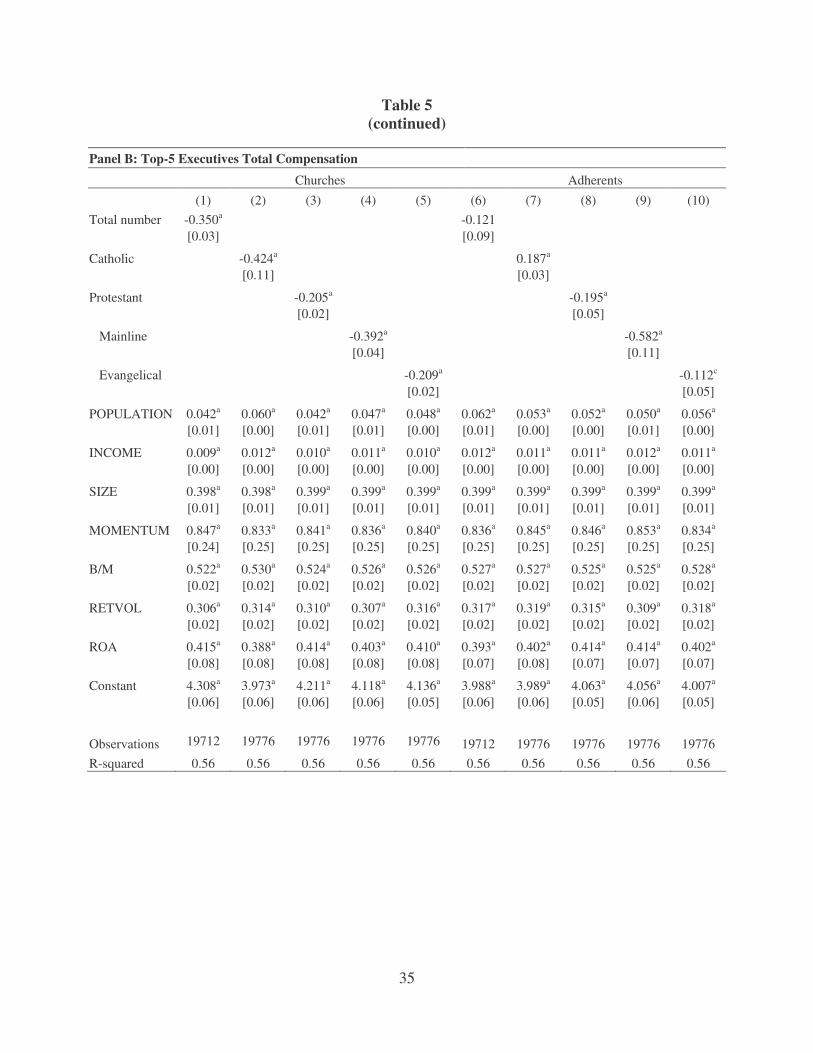
The effect of community religiosity on executive pay is not limited to the CEO. In Table
5, Panel B we show results for the top-5 management team that are very similar to the findings
for CEO pay. We again find that religiosity has a strong negative effect on executive
compensation, with a stronger effect coming from the Protestants. Once again, we find mixed
results for Catholics.

20
3.E Earnings Management
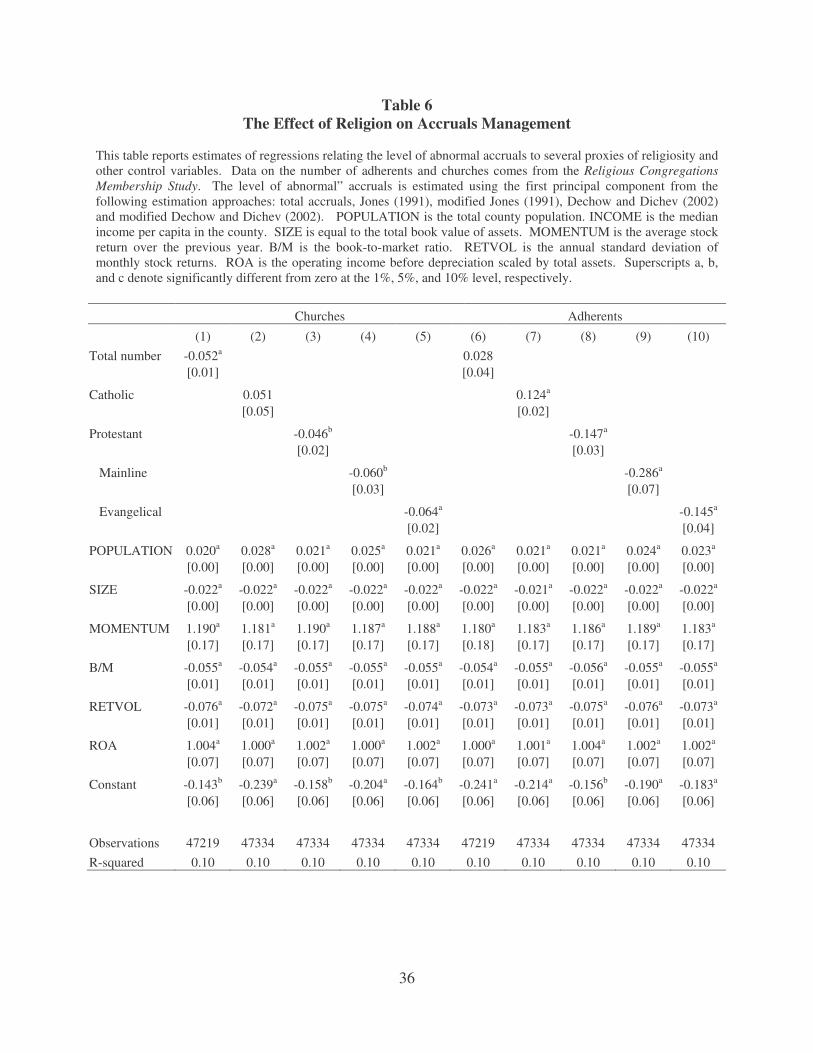
Table 6 presents our regression results for earnings management and discretionary
accruals. The results presented in this table are for our comprehensive measure of discretionary
accruals but the results are similar if we use any of the various measures proposed in section 2.4
above.
Overall, our regression results support the univariate analysis presented above. While the
total number of churches per capita is not a significant determinant of the abnormal accruals, this
result again appears to be driven by the number of Catholic adherents --- total Protestant,
Mainline, and Evangelical adherents are all negative and significant determinants of abnormal
accruals. Results are similar for the number of adherents, though somewhat weaker.
Again, these results are economically meaningful. For example, consider an increase in
the number of Mainline churches per capita from the 25th percentile (about 0.12) to the 75th
percentile (0.24). Based on the coefficient estimate of 0.046 (Table 6, column 3), such a change
would imply a decrease in abnormal accruals of roughly 6 percent – an effect similar in
economic magnitude to the book-to-market. Overall, the results suggest that community level
religiosity is a meaningful mitigating factor on decisions to smooth earnings, with the effects
being strongest for Protestant denominations.
4. Robustness
Overall our results are not sensitive to the particular tests we use. In unreported analysis,
we have confirmed that the basic results remain qualitatively unchanged with the following
changes:
1. Methodology. While all of our reported results are based on Fama-Macbeth regressions,
we also estimate coefficients using panel data methods with clustered standard errors.

21
Panel data estimation yields similar results. The advantage of the Fama-Macbeth is that
it allows dynamic specification of the coefficients on the control variables.
2. Alternative control variables. In addition to the control variables included in all four
samples, we also include census-level demographic information such as age of the county
population, urban dummy variables, average level of education, percentage of minorities,
etc. Inclusion or exclusion of various sets of these controls does not alter our results or
conclusions in any meaningful way.
3. Subsamples. We also conduct sensitivity analysis by splitting our samples by median
firm size and county population. Overall, our results hold for large and small firms and
for rural and urban counties.
4. Alternative denomination definitions. While we follow the general denomination
definitions outlined in the ARDA guidelines, we also test whether small changes to the
definitions make any difference. For example, whether or not we include Judaism to
either Catholic or Protestant definition (a Judeo-Christian group) does not change our
results. Similarly inclusion or exclusion of Latter Day Saints does not alter our results.
This is perhaps not surprising because adherents of Judaism or Latter Day Saints are not
generally large enough to make a statistical difference overall (both are less than 2.5% of
total population). However, because both denominations are geographically
concentrated, it is important to verify that our results are not sensitive to these definitions.
5. Conclusion
We study the effect of social culture on economic decisions and outcomes. In particular,
we examine whether the strength of a community’s moral code has a mitigating effect on
22
unethical behavior by locally headquartered firms. To capture a broad interpretation of
“unethical”, we use four different samples of behavior that, at the minimum, firms would not
want made public --- securities fraud lawsuits filed against the firm, aggressive earnings
manipulation, option back-dating, and seemingly excessive executive compensation. Across all
four samples, we find a strongly significant and consistent set of results --- greater religiosity in
the community reduces the likelihood of such behavior in locally headquartered firms.
Separating religiosity into Protestant and Catholic measures, we find the strongest results for
Protestants and for Mainline Protestants in particular.12 It seems that either the latter have a more
stringent moral code, or it is for some reason the moral code most readily transferrable into
corporate culture.
With regard to executive compensation, our paper shows that a non-economic factor ---
cultural norms --- plays a significant role in how managers are compensated. This result is
important because it may be a factor in explaining why cross-sectional differences in managerial
compensation cannot be completely explained by firms’ fundamentals (Bebchuk and Grinstein
(2005)). Our paper also makes a significant contribution to the literature on corporate fraud by
providing evidence that executives bring their communities’ moral values to their workplace, and
that these values are important predictors of the likelihood of unethical managerial behavior.
12 These results provide some support, albeit indirect, to studies that have interpreted the evidence linking Protestantism to higher economic growth and development, due to its incorporation of the “Protestant work ethic” into its moral code.
23
REFERENCES
Akerlof, George, and Rachel E. Kranton, 2000, “Economics and Identity,” Quarterly Journal of Economics 115, 715-733.
Banfield, Edward C., 1958, The Moral Basis of a Backward Society, New York: The Free Press. Barro, Robert J., and Rachel M. McCleary, 2003, “Religion and Economic Growth across
Countries,” American Sociological Review 68, 760-781. Bebchuk, Lucian A., and Yaniv Grinstein, 2005, “The Growth of Executive Pay,” Oxford Review
of Economic Policy 21, 283-303. Bebchuk, Lucian A., Yaniv Grinstein, and Urs Peyer, 2009, “Lucky CEOs and Lucky Directors,”
Journal of Finance, forthcoming. Bernile, Gennaro, and Gregg A. Jarrell, 2009, “The Impact of the Options Backdating Scandal
on Shareholders,” Journal of Accounting and Economics 47, 2-26. Dechow, Patricia M. and Ilia D. Dichev, 2002, “The Quality of Accruals and Earnings: The Role
of Accrual Estimation Errors,” The Accounting Review 77, 35-59. Field, Laura, Michelle Lowry, and Susan Shu, 2005, “Does Disclosure Deter or Trigger
Litigation?” Journal of Accounting and Economics 29, 487-507. Grier, Robin, 1997, “The Effects of Religion on Economic Development: A Cross National
Study of 63 Former Colonies,” Kyklos 50, 47-62. Guiso, Luigi, Paola Sapienza, and Luigi Zingales, 2003, “People’s Opium? Religion and
Economic Attitudes,” Journal of Monetary Economics 50, 225-282. Guiso, Luigi, Paola Sapienza, and Luigi Zingales, 2004, “The Role of Social Capital in Financial
Development,” American Economic Review 94, 526-556. Guiso, Luigi, Paola Sapienza, and Luigi Zingales, 2006, “Does Culture Affect Economic
Outcomes?” Journal of Economic Perspectives 20, 23-48. Harrison, Lawrence E., 1985, Underdevelopment is a State of Mind, Lanham: Madison Books. Heron, Randall A., and Erik Lie, 2006, “What Fraction of Stock Option Grants to Top
Executives Have Been Backdated or Manipulated?, Working Paper, Indiana University.
Heron, Randall A., and Erik Lie, 2007, “Does Backdating Explain the Stock Price Pattern around Executive Stock Option Grants?” Journal of Financial Economics 83, 271-295.

24
Hilary, Gilles, and Kai Wai Hui, 2009, “Does religion matter in corporate decision making in America?” Journal of Financial Economics, forthcoming.
Hout. Michael, and Andrew Greeley, 1998, “What Church Officials' Reports Don't Show:
Another Look at Church Attendance,” American Sociological Review 63, 113-119. Jones, Jennifer, 1991, “Earnings Management during Import Relief Investigations,” Journal of
Accounting Research 29, 193-228. Jones, Keith L., Gopal V. Krishnan, and Kevin Melendrez, 2008, “Do Models of Discretionary
Accruals Detect Actual Cases of Fraudulent and Restated Earnings? An Empirical Evaluation,” Contemporary Accounting Research, forthcoming. �
Kanatas, George, and Chris Stefanadis, 2008, “Ethics, Culture, and Economic Development”
Working Paper, Rice University Kaplow, Louis, and Steven Shavell, 2007, “Moral Rules, the Moral Sentiments, and Behavior:
Toward a Theory of an Optimal Moral System,” Journal of Political Economy 115, 494-514.
Karpoff, Jonathan M., John R. Lott, Jr., and Eric W. Wehrly, 2005, “The Reputational Penalties
for Environmental Violations: Empirical Evidence,” Journal of Law and Economics 48, 653-675.
Landes, David, 1998, The Wealth and Poverty of Nations, New York : Norton & Company. La Porta, Rafael, Florencio López-de-Silanes, Andrei Shleifer, and Robert Vishny, 1999, “The
Quality of Government,” Journal of Law, Economics and Organization 1999, 222-279. Lie, Erik, 2005, “On the Timing of CEO Stock Option Awards,” Management Science 51, 802-
812. Mead, Frank S., and Samuel S. Hill, 1995, Handbook of Denominations in the United States,
Nashville, Abingdon Press, 10th edition. Melton, Gordon, 1998, Encyclopedia of American Religions, Detroit: Gale Group, 6th edition. Narayanan, M. P., and Hasan N. Seyhun, 2006, “Effect of Sarbanes-Oxley on the Influencing of
Executive Compensation,” Working Paper, University of Michigan. Pritchard, Adam C., and Stephen P. Ferris, 2001, “Stock Price Reactions to Securities Fraud
Class Actions under the Private Securities Litigation Reform Act,” Michigan Law and Economics Research Paper, No. 01-009.
Smith, Adam, 1790, The Theory of Moral Sentiments, New York: August M. Kelly Publishers
(originally published 1759).
25
Steensland, Brian, Jerry Z. Park, Mark D. Regnerus, Lynn D. Robinson, W. Bradford Wilcox,
and Robert D. Woodberry, 2000, “The Measure of American Religion: Toward Improving the State of the Art,” Social Forces 79, 291-318.
Stulz, Rene M., and Rohan Williamson, 2003, “Culture, Openness, and Finance,” Journal of
Financial Economics 70, 313-349. Treisman, Daniel, 2000, “The Causes of Corruption: A Cross-National Study,” Journal of Public
Economics 76, 399-457. Weber, Max, 1905, 1956, The Protestant Ethic and The Spirit of Capitalism. London, Unwin. Woessmann, Ludger, and Sascha O. Becker, “Was Weber Wrong? A Human Capital Theory of
Protestant Economic History,” Quarterly Journal of Economics, forthcoming.
�

26
Appendix A This appendix provides a list of the denominations included in each of the major religious groups used in this study.
Catholics Catholic Church
Mainline Protestant Evangelical Lutheran in America (various) Reformed Church in America
American Baptist Churches in the USA Friends (Quakers) United Church of Christ
Christian Church (Disciples of Christ) Intl. Council of Community Churches United Methodist Church
Congregational Christian (various) Moravian Church (various) Universal Fellow. of Metro. Community
Episcopal Church Presbyterian Church
Evangelical Protestant Church of the Lutheran Brethren Lutheran Church--Missouri Synod
Advent Christian Church Church of the Lutheran Confession Mennonite Church (various)
Baptist churches (expect under mainline) Church of the Nazarene Midwest Congregational Christian Fellow.
African Methodist Episcopal Zion Church Church of the United Brethren in Christ Missionary Church
Allegheny Wesleyan Methodist Connection Churches of Christ Netherlands Reformed Congregations
American Assoc. of Lutheran Churches Churches of God, Gen. Conference Old Order River Brethren
Amish Community of Christ Open Bible Standard Churches
Apostolic Christian Church (various) Conservative Congregational Orthodox Presbyterian Church
Assemblies of God Cumberland Presbyterian Church Pentecostal Church of God
Assoc. of Free Lutheran Congregations Evangelical Congregational Church, The Presbyterian Church in America
Associate Reformed Presbyterian Church Evangelical Covenant Church, The Primitive Advent Christian Church
Berean Fundamental Church Evangelical Free Church of America Primitive Methodist Church in the USA
Bible Church of Christ, Inc. Evangelical Lutheran Synod Protestant Reformed Churches in America
Brethren Church, The (Ashland, Ohio) Evangelical Methodist Church Reformed Church in the United States
Brethren In Christ Church Evangelical Presbyterian Church Reformed Episcopal Church
Bruderhof Communities, Inc. Fellowship of Evangelical Bible Churches Salvation Army
Calvary Chapel Fellowship Churches Fire Baptized Holiness Church Schwenkfelder Church
Christ Catholic Church Free Methodist Church of North America Seventh-day Adventist Church
Christian and Missionary Alliance Fundamental Methodist Conference, Inc. The Protestant Conference (Lutheran)
Christian Brethren Hutterian Brethren United Christian Church
Churches of Christ Independent Fundamental Churches United Reformed Churches in N. America
Christian Reformed Church in N. Am. Independent, Charismatic Churches Vineyard USA
Christian Union Independent, Non-Charismatic Wesleyan Church, The
Church of God (various) Intl. Church of the Foursquare Gospel Wisconsin Evangelical Lutheran Synod
Church of the Brethren International Pentecostal (various)
27
Figure 1 The Effect of Religion on Inappropriate Behavior
This figure depicts several proxies of inappropriate behavior across terciles based on the total number of churches per capita in counties in which our sample firms’ headquarters are located. Data on the number of churches comes from the Religious Congregations Membership Study. Data on federal class action securities fraud lawsuits comes from the Stanford Law School’s Securities Class Action Clearinghouse. We use the federal class action lawsuit database to identify all the firms on the Compustat database that have been the target of a class action lawsuit. Data on option grants comes from Thomson Financial’s insider trading database. Option backdating is defined as an instance in which a CEO receives an option grant on a day where the stock price was at the lowest level of the month. Data on CEO compensation comes from Execucomp. Total compensation comprises salary and bonus, other annual compensation, total value of restricted stock granted, total value of stock options granted (using Black-Scholes), long-term incentive payouts, and all other total compensation. The level of abnormal accruals is estimated using the first principal component from the following estimation approaches: total accruals, Jones (1991), modified Jones (1991), Dechow and Dichev (2002) and modified Dechow and Dichev (2002).
Panel A: Incidence of Fed. Class-Action Lawsuits
����
����
����
����
����
����
Low Religosity
Medium Religosity
High Religosity
Panel B: Incidence of Option Backdating
����
����
����
����
����
����
����
Low Religosity
Medium Religosity
High Religosity
Panel C: Total CEO Compensation
����
����
����
����
����
����
����
Low Religosity
Medium Religosity
High Religosity
Panel D: Abnormal Accruals
����
����
����
����
����
����
����
Low Religosity
Medium Religosity
High Religosity
28
Figure 2 The Effect of Religion on the Incidence of Backdating Options: Before and After SEC Rule This figure depicts the incidence of option backdating, before and after the approval of the SEC rule in 2002 requiring firms to report stock option grants within two days of the grant date, across terciles based on the number of churches per capita in counties in which our sample firms’ headquarters are located. Data on the number of churches comes from the Religious Congregations Membership Study. Data on option grants comes from Thomson Financial’s insider trading database. Option backdating is defined as instances in which a CEO receives an option grant on a day where the stock price was at the lowest level of the month.
Panel A: Religiosity is measured by total churches per capita
0.000
0.050
0.100
0.150
0.200
Low Religosity Medium Religosity High Religosity
Before SEC Rule After SEC Rule
Panel B: Religiosity is measured by total Protestant churches per capita
0.000
0.050
0.100
0.150
0.200
Low Religosity Medium Religosity High Religosity
Before SEC Rule After SEC Rule
Panel C: Religiosity is measured by total Catholic churches per capita
0.000
0.050
0.100
0.150
0.200
Low Religosity Medium Religosity High Religosity
Before SEC Rule After SEC Rule
29
Table 1 Summary Statistics
This table reports summary statistics for the 1990 and 2000 surveys performed by the Association of Statisticians of American Religious Bodies (ASARB) on religious participation in the United States. We gather the data from the Religious Congregations Membership Study, which reports county-by-county data on the number of churches and total adherents by religious affiliation. This report is made available to the public through the Association of Religion Data Archives (ARDA) website. The appendix provides a list of the denominations included in each of the main religious groups.
Panel A: Summary Statistics for the 1990 Survey
Mean Std. Dev.
25th
Median
75th
Adherents as a % of County Population 59.5% 20.0% 44.8% 59.5% 73.0% Evangelical Protestants as a % of County Population 27.2% 19.8% 10.1% 19.8% 43.2% Mainline Protestants as a % of County Population 16.5% 12.4% 8.2% 12.8% 21.8% Catholics as a % of County Population 12.9% 15.2% 1.7% 7.7% 18.0% Churches per 1,000 people 2.39 1.41 1.37 2.16 3.11 Evangelical Protestant Churches per 1,000 people 1.24 0.96 0.55 1.00 1.75 Mainline Protestant Churches per 1,000 people 0.83 0.70 0.35 0.64 1.11 Catholic Churches per 1,000 people 0.21 0.35 0.05 0.11 0.26
Panel B: Summary Statistics for the 2000 Survey
Mean Std. Dev.
25th
Median
75th
Adherents as a % of County Population 53.0% 18.6% 39.4% 51.1% 64.7% Evangelical Protestants as a % of County Population 22.7% 16.9% 9.5% 17.7% 34.1% Mainline Protestants as a % of County Population 14.2% 11.4% 6.8% 10.8% 18.4% Catholics as a % of County Population 13.7% 14.9% 2.1% 8.9% 20.4% Churches per 1,000 people 2.20 1.31 1.22 1.95 2.87 Evangelical Protestant Churches per 1,000 people 1.17 0.85 0.53 0.94 1.65 Mainline Protestant Churches per 1,000 people 0.75 0.68 0.30 0.55 0.98 Catholic Churches per 1,000 people 0.19 0.31 0.04 0.10 0.21
30
Table 2 Summary Statistics for the Samples on Inappropriate Behavior
This table reports summary statistics for our different samples on inappropriate behavior. Data on federal class action securities fraud lawsuits comes from the Stanford Law School’s Securities Class Action Clearinghouse. Data on option grants comes from Thomson Financial’s insider trading database. Data on CEO compensation comes from Execucomp. LAWSUIT is a dummy variable equal to 1 if the firm is a plaintiff in a federal class-class action lawsuit in year t, zero otherwise. BACKDATING is a dummy variable equal to 1 if the CEO receives an option grant on a day where the stock price was at the lowest level of the month, zero otherwise. COMPENSATION is total CEO compensation, which comprises salary and bonus, other annual compensation, total value of restricted stock granted, total value of stock options granted (using Black-Scholes), long-term incentive payouts, and all other total compensation. ACCRUALS is a measure of abnormal accruals, which is estimated using the first principal component from the following estimation approaches: total accruals, Jones (1991), modified Jones (1991), Dechow and Dichev (2002) and modified Dechow and Dichev (2002). SIZE is equal to the logarithm of the total book value of assets. MOMENTUM is the average stock return over the previous year. B/M is the book-to-market ratio. RETVOL is the annual standard deviation of monthly stock returns. ROA is the operating income before depreciation scaled by total assets.
Panel A: Federal Class-Action Lawsuits Mean Std. Dev. 25th Median 75th LAWSUIT 0.035 0.183 0.000 0.000 0.000
SIZE 2.329 7.535 0.055 0.241 1.019
B/M 1.957 1.724 1.047 1.324 2.102
RETVOL 0.150 0.102 0.078 0.122 0.190
ROA 0.046 0.229 0.020 0.086 0.153
Panel B: Option Backdating Mean Std. Dev. 25th Median 75th BACKDATING 0.142 0.349 0.000 0.000 0.000
SIZE 3.182 10.615 0.089 0.363 1.460
B/M 2.126 1.743 1.106 1.491 2.395
RETVOL 0.160 0.105 0.086 0.131 0.203
ROA 0.049 0.212 0.022 0.095 0.160
Panel C: CEO Compensation Mean Std. Dev. 25th Median 75th COMPENSATION 4.424 10.622 1.024 2.081 4.596
SIZE 7.647 22.157 0.404 1.223 4.513
B/M 2.007 1.415 1.159 1.507 2.244
RETVOL 0.112 0.065 0.067 0.096 0.139
ROA 0.131 0.112 0.079 0.130 0.187
Panel D: Abnormal Accruals Mean Std. Dev. 25th Median 75th ACCRUALS 0.022 0.905 -0.31 0.078 0.403
SIZE 1.688 5.23 0.041 0.162 0.757
B/M 2.033 1.716 1.084 1.435 2.234
RETVOL 0.153 0.099 0.085 0.128 0.192
ROA 0.065 0.225 0.039 0.109 0.168
31
Table 3 The Effect of Religion on the Likelihood of Triggering a Federal Class-Action Lawsuit
This table reports estimates of Logit regressions relating the likelihood of triggering a federal class-action lawsuit to several proxies of religiosity and other control variables. Data on the number of adherents and churches comes from the Religious Congregations Membership Study. Data on federal class action securities fraud lawsuits comes from the Stanford Law School’s Securities Class Action Clearinghouse. We use the federal class action lawsuit database to identify all the firms on the Compustat database that have been the target of a class action lawsuit. Our dependent variable is a dummy variable equal to 1 if the firm is accused of committing fraud in year t, 0 otherwise. POPULATION is the total county population. SIZE is equal to the total book value of assets. MOMENTUM is the average stock return over the previous year. B/M is the book-to-market ratio. RETVOL is the annual standard deviation of monthly stock returns. ROA is the operating income before depreciation scaled by total assets. LITINDEX is the litigation risk score at the state level published by the Pacific Research Institute. Superscripts a, b, and c denote significantly different from zero at the 1%, 5%, and 10% level, respectively.
Churches Adherents (1) (2) (3) (4) (5) (6) (7) (8) (9) (10) Total number -1.568a -0.689 [0.23] [0.48]
Catholic -3.540a 0.340 [0.79] [0.23]
Protestant -1.016a -0.961b [0.22] [0.40]
Mainline -2.064a -2.232a [0.32] [0.69]
Evangelical -0.890a -0.854c [0.26] [0.47]
POPULATION 0.125a 0.187a 0.116a 0.145a 0.136a 0.193a 0.169a 0.154a 0.168a 0.159a [0.03] [0.03] [0.02] [0.03] [0.03] [0.04] [0.03] [0.03] [0.03] [0.03]
SIZE 0.469a 0.474a 0.471a 0.471a 0.474a 0.475a 0.477a 0.475a 0.475a 0.476a [0.02] [0.02] [0.02] [0.02] [0.02] [0.02] [0.02] [0.02] [0.02] [0.02]
MOMENTUM 0.584 0.423 0.552 0.511 0.464 0.400 0.365 0.470 0.431 0.436 [0.66] [0.67] [0.66] [0.67] [0.66] [0.67] [0.68] [0.66] [0.67] [0.66]
B/M 0.985a 1.021a 0.992a 0.998a 1.012a 1.024a 1.027a 1.013a 1.015a 1.022a [0.02] [0.03] [0.03] [0.03] [0.03] [0.03] [0.03] [0.03] [0.03] [0.03]
RETVOL 0.749a 0.788a 0.762a 0.752a 0.797a 0.811a 0.819a 0.798a 0.789a 0.812a [0.03] [0.03] [0.03] [0.03] [0.03] [0.03] [0.03] [0.03] [0.03] [0.03]
ROA 0.254 0.222 0.252 0.226 0.256 0.248 0.238 0.258 0.243 0.255 [0.15] [0.15] [0.15] [0.15] [0.15] [0.15] [0.15] [0.14] [0.15] [0.15]
LITINDEX -0.022a -0.011 -0.020b -0.018b -0.017b -0.011 -0.016b -0.016b -0.016b -0.015b [0.01] [0.01] [0.01] [0.01] [0.01] [0.01] [0.01] [0.01] [0.01] [0.01]
Constant -5.153a -6.368a -5.445a -5.794a -5.808a -6.286a -6.355a -6.013a -6.127a -6.152a [0.22] [0.21] [0.20] [0.18] [0.22] [0.22] [0.21] [0.23] [0.20] [0.22]
Observations 54642 54747 54747 54747 54747 54642 54747 54747 54747 54747
32
Table 4 The Effect of Religion on the Likelihood of Backdating Options
This table reports estimates of Logit regressions relating the likelihood of backdating options to several proxies of religiosity and other control variables. Data on the number of adherents and churches comes from the Religious Congregations Membership Study. Data on option grants comes from Thomson Financial’s insider trading database. Our dependent variable is a dummy variable equal to 1 if the CEO receives an option grant on a day where the stock price was at the lowest level of the month that the option was granted, zero otherwise. POPULATION is the total county population. SIZE is equal to the total book value of assets. MOMENTUM is the average stock return over the previous year. B/M is the book-to-market ratio. RETVOL is the annual standard deviation of monthly stock returns. ROA is the operating income before depreciation scaled by total assets. Superscripts a, b, and c denote significantly different from zero at the 1%, 5%, and 10% level, respectively. Panel A: Sample Period 1996-2001 (Before SEC Rule)
Churches Adherents (1) (2) (3) (4) (5) (6) (7) (8) (9) (10)
Total number -0.615b -0.501 [0.19] [0.31]
Catholic -1.623 0.252 [1.23] [0.18]
Protestant -0.475b -0.899a [0.15] [0.23]
Mainline -1.358b -3.070a [0.52] [0.70]
Evangelical -0.208 -0.427 [0.19] [0.36]
POPULATION -0.005 0.048 -0.011 0.002 0.022 0.056 0.025 0.001 0.010 0.025 [0.04] [0.04] [0.05] [0.04] [0.04] [0.04] [0.04] [0.04] [0.04] [0.04]
SIZE -0.129b -0.132b -0.128b -0.130b -0.129b -0.130b -0.128b -0.127b -0.130b -0.129b [0.04] [0.04] [0.04] [0.04] [0.04] [0.04] [0.04] [0.04] [0.04] [0.04]
MOMENTUM -0.606 -0.620 -0.625 -0.559 -0.685 -0.619 -0.681 -0.646 -0.556 -0.686 [0.70] [0.76] [0.69] [0.66] [0.73] [0.69] [0.75] [0.73] [0.68] [0.74]
B/M -0.001 0.009 -0.003 0.000 0.006 0.010 0.011 -0.004 -0.004 0.007 [0.08] [0.08] [0.08] [0.08] [0.09] [0.08] [0.08] [0.09] [0.08] [0.09]
RETVOL 0.275c 0.290b 0.280b 0.259c 0.301b 0.301b 0.305b 0.288b 0.265b 0.301b [0.11] [0.11] [0.11] [0.11] [0.11] [0.11] [0.11] [0.11] [0.11] [0.11]
ROA 0.276b 0.279b 0.283b 0.270b 0.284b 0.282b 0.279b 0.299b 0.288b 0.288b [0.10] [0.10] [0.10] [0.10] [0.10] [0.10] [0.10] [0.10] [0.10] [0.10]
Constant -0.044 -0.612b -0.090 -0.185 -0.452 -0.551b -0.582b -0.212 -0.217 -0.489 [0.21] [0.19] [0.23] [0.21] [0.26] [0.18] [0.23] [0.24] [0.21] [0.26]
Observations 6577 6585 6585 6585 6585 6585 6585 6585 6585 6585
33
Table 4 (continued)
Panel B: Sample Period 2002-2006 (After SEC Rule) Churches Adherents (1) (2) (3) (4) (5) (6) (7) (8) (9) (10) Total number -0.434 -0.880 [0.34] [0.54]
Catholic -0.744 -0.081 [2.32] [0.42]
Protestant -0.027 0.053 [0.22] [0.54]
Mainline -0.314 -0.406 [0.92] [1.73]
Evangelical 0.104 0.297 [0.34] [0.53]
POPULATION 0.030 0.063a 0.057c 0.055 0.066b 0.089a 0.062a 0.061b 0.056b 0.067a [0.02] [0.01] [0.02] [0.03] [0.02] [0.02] [0.01] [0.02] [0.02] [0.01]
SIZE -0.082a -0.083a -0.081a -0.081a -0.082a -0.084a -0.082a -0.081a -0.080a -0.082a [0.01] [0.01] [0.01] [0.01] [0.01] [0.01] [0.01] [0.01] [0.00] [0.01]
MOMENTUM -0.391 -0.538 -0.473 -0.469 -0.493 -0.453 -0.518 -0.546 -0.508 -0.526 [1.37] [1.39] [1.35] [1.33] [1.37] [1.40] [1.38] [1.31] [1.28] [1.35]
B/M 0.093c 0.100c 0.102b 0.099c 0.104b 0.097c 0.104b 0.106b 0.104b 0.105b [0.04] [0.04] [0.03] [0.04] [0.03] [0.04] [0.03] [0.03] [0.04] [0.03]
RETVOL 0.143 0.158 0.162 0.158c 0.165 0.151 0.163 0.165c 0.160c 0.165 [0.08] [0.09] [0.08] [0.07] [0.08] [0.09] [0.09] [0.08] [0.06] [0.09]
ROA 0.193 0.180 0.189 0.182 0.181 0.194 0.189 0.196 0.196 0.180 [0.34] [0.34] [0.34] [0.33] [0.34] [0.34] [0.34] [0.35] [0.35] [0.34]
Constant -1.415b -1.800a -1.784b -1.736b -1.886a -1.685a -1.815a -1.831a -1.765b -1.896a [0.49] [0.24] [0.42] [0.49] [0.31] [0.27] [0.24] [0.39] [0.41] [0.25]
Observations 5989 5989 5989 5989 5989 5989 5989 5989 5989 5989
34
Table 5
The Effect of Religion on the Executive Compensation
This table reports estimates of regressions relating CEO compensation and the average compensation of the top 5 executives to several proxies of religiosity and other control variables. Data on the number of adherents and churches comes from the Religious Congregations Membership Study. Data on executive compensation comes from Execucomp. Total compensation comprises salary and bonus, other annual compensation, total value of restricted stock granted, total value of stock options granted (using Black-Scholes), long-term incentive payouts, and all other total compensation. POPULATION is the total county population. INCOME is the median income per capita in the county. SIZE is equal to the total book value of assets. MOMENTUM is the average stock return over the previous year. B/M is the book-to-market ratio. RETVOL is the annual standard deviation of monthly stock returns. ROA is the operating income before depreciation scaled by total assets. Superscripts a, b, and c denote significantly different from zero at the 1%, 5%, and 10% level, respectively.
Panel A: CEO Total Compensation Churches Adherents (1) (2) (3) (4) (5) (6) (7) (8) (9) (10) Total number -0.380a 0.131 [0.03] [0.08]
Catholic -0.233 0.351a [0.14] [0.04]
Protestant -0.227a -0.237a [0.02] [0.06]
Mainline -0.336a -0.430a [0.06] [0.13]
Evangelical -0.287a -0.246a [0.02] [0.07]
POPULATION 0.040a 0.059a 0.040a 0.048a 0.044a 0.056a 0.048a 0.051a 0.052a 0.053a [0.01] [0.01] [0.01] [0.01] [0.01] [0.01] [0.01] [0.01] [0.01] [0.01]
INCOME 0.010a 0.013a 0.011a 0.012a 0.011a 0.012a 0.011a 0.012a 0.013a 0.012a [0.00] [0.00] [0.00] [0.00] [0.00] [0.00] [0.00] [0.00] [0.00] [0.00]
SIZE 0.403a 0.403a 0.403a 0.404a 0.403a 0.404a 0.404a 0.404a 0.404a 0.404a [0.01] [0.01] [0.01] [0.01] [0.01] [0.01] [0.01] [0.01] [0.01] [0.01]
MOMENTUM 1.423a 1.419a 1.423a 1.420a 1.424a 1.416a 1.433a 1.427a 1.430a 1.423a [0.29] [0.29] [0.29] [0.29] [0.29] [0.29] [0.29] [0.29] [0.29] [0.29]
B/M 0.391a 0.399a 0.393a 0.396a 0.394a 0.399a 0.395a 0.394a 0.396a 0.395a [0.03] [0.03] [0.03] [0.03] [0.03] [0.03] [0.03] [0.03] [0.03] [0.03]
RETVOL 0.244a 0.254a 0.247a 0.246a 0.253a 0.258a 0.257a 0.253a 0.249a 0.256a [0.02] [0.02] [0.02] [0.02] [0.02] [0.02] [0.02] [0.02] [0.02] [0.02]
ROA 0.629a 0.601a 0.626a 0.612a 0.625a 0.598a 0.620a 0.626a 0.616a 0.619a [0.08] [0.08] [0.09] [0.08] [0.09] [0.08] [0.09] [0.09] [0.08] [0.09]
Constant 4.701a 4.327a 4.596a 4.455a 4.559a 4.301a 4.363a 4.441a 4.388a 4.411a [0.07] [0.07] [0.07] [0.08] [0.06] [0.07] [0.07] [0.06] [0.07] [0.06] Observations 21082 21149 21149 21149 21149 21082 21149 21149 21149 21149 R-squared 0.37 0.37 0.37 0.37 0.37 0.37 0.37 0.37 0.37 0.37
35
Table 5 (continued)
Panel B: Top-5 Executives Total Compensation Churches Adherents
(1) (2) (3) (4) (5) (6) (7) (8) (9) (10) Total number -0.350a -0.121 [0.03] [0.09]
Catholic -0.424a 0.187a [0.11] [0.03]
Protestant -0.205a -0.195a [0.02] [0.05]
Mainline -0.392a -0.582a [0.04] [0.11]
Evangelical -0.209a -0.112c [0.02] [0.05]
POPULATION 0.042a 0.060a 0.042a 0.047a 0.048a 0.062a 0.053a 0.052a 0.050a 0.056a [0.01] [0.00] [0.01] [0.01] [0.00] [0.01] [0.00] [0.00] [0.01] [0.00]
INCOME 0.009a 0.012a 0.010a 0.011a 0.010a 0.012a 0.011a 0.011a 0.012a 0.011a [0.00] [0.00] [0.00] [0.00] [0.00] [0.00] [0.00] [0.00] [0.00] [0.00]
SIZE 0.398a 0.398a 0.399a 0.399a 0.399a 0.399a 0.399a 0.399a 0.399a 0.399a [0.01] [0.01] [0.01] [0.01] [0.01] [0.01] [0.01] [0.01] [0.01] [0.01]
MOMENTUM 0.847a 0.833a 0.841a 0.836a 0.840a 0.836a 0.845a 0.846a 0.853a 0.834a [0.24] [0.25] [0.25] [0.25] [0.25] [0.25] [0.25] [0.25] [0.25] [0.25]
B/M 0.522a 0.530a 0.524a 0.526a 0.526a 0.527a 0.527a 0.525a 0.525a 0.528a [0.02] [0.02] [0.02] [0.02] [0.02] [0.02] [0.02] [0.02] [0.02] [0.02]
RETVOL 0.306a 0.314a 0.310a 0.307a 0.316a 0.317a 0.319a 0.315a 0.309a 0.318a [0.02] [0.02] [0.02] [0.02] [0.02] [0.02] [0.02] [0.02] [0.02] [0.02]
ROA 0.415a 0.388a 0.414a 0.403a 0.410a 0.393a 0.402a 0.414a 0.414a 0.402a [0.08] [0.08] [0.08] [0.08] [0.08] [0.07] [0.08] [0.07] [0.07] [0.07]
Constant 4.308a 3.973a 4.211a 4.118a 4.136a 3.988a 3.989a 4.063a 4.056a 4.007a [0.06] [0.06] [0.06] [0.06] [0.05] [0.06] [0.06] [0.05] [0.06] [0.05]
Observations 19712 19776 19776 19776 19776 19712 19776 19776 19776 19776 R-squared 0.56 0.56 0.56 0.56 0.56 0.56 0.56 0.56 0.56 0.56
36
Table 6 The Effect of Religion on Accruals Management
This table reports estimates of regressions relating the level of abnormal accruals to several proxies of religiosity and other control variables. Data on the number of adherents and churches comes from the Religious Congregations Membership Study. The level of abnormal” accruals is estimated using the first principal component from the following estimation approaches: total accruals, Jones (1991), modified Jones (1991), Dechow and Dichev (2002) and modified Dechow and Dichev (2002). POPULATION is the total county population. INCOME is the median income per capita in the county. SIZE is equal to the total book value of assets. MOMENTUM is the average stock return over the previous year. B/M is the book-to-market ratio. RETVOL is the annual standard deviation of monthly stock returns. ROA is the operating income before depreciation scaled by total assets. Superscripts a, b, and c denote significantly different from zero at the 1%, 5%, and 10% level, respectively.
Churches Adherents
(1) (2) (3) (4) (5) (6) (7) (8) (9) (10) Total number -0.052a 0.028 [0.01] [0.04]
Catholic 0.051 0.124a [0.05] [0.02]
Protestant -0.046b -0.147a [0.02] [0.03]
Mainline -0.060b -0.286a [0.03] [0.07]
Evangelical -0.064a -0.145a [0.02] [0.04]
POPULATION 0.020a 0.028a 0.021a 0.025a 0.021a 0.026a 0.021a 0.021a 0.024a 0.023a [0.00] [0.00] [0.00] [0.00] [0.00] [0.00] [0.00] [0.00] [0.00] [0.00]
SIZE -0.022a -0.022a -0.022a -0.022a -0.022a -0.022a -0.021a -0.022a -0.022a -0.022a [0.00] [0.00] [0.00] [0.00] [0.00] [0.00] [0.00] [0.00] [0.00] [0.00]
MOMENTUM 1.190a 1.181a 1.190a 1.187a 1.188a 1.180a 1.183a 1.186a 1.189a 1.183a [0.17] [0.17] [0.17] [0.17] [0.17] [0.18] [0.17] [0.17] [0.17] [0.17]
B/M -0.055a -0.054a -0.055a -0.055a -0.055a -0.054a -0.055a -0.056a -0.055a -0.055a [0.01] [0.01] [0.01] [0.01] [0.01] [0.01] [0.01] [0.01] [0.01] [0.01]
RETVOL -0.076a -0.072a -0.075a -0.075a -0.074a -0.073a -0.073a -0.075a -0.076a -0.073a [0.01] [0.01] [0.01] [0.01] [0.01] [0.01] [0.01] [0.01] [0.01] [0.01]
ROA 1.004a 1.000a 1.002a 1.000a 1.002a 1.000a 1.001a 1.004a 1.002a 1.002a [0.07] [0.07] [0.07] [0.07] [0.07] [0.07] [0.07] [0.07] [0.07] [0.07]
Constant -0.143b -0.239a -0.158b -0.204a -0.164b -0.241a -0.214a -0.156b -0.190a -0.183a [0.06] [0.06] [0.06] [0.06] [0.06] [0.06] [0.06] [0.06] [0.06] [0.06]
Observations 47219 47334 47334 47334 47334 47219 47334 47334 47334 47334 R-squared 0.10 0.10 0.10 0.10 0.10 0.10 0.10 0.10 0.10 0.10