Embed Size (px)
Citation preview
Religare Invesco Mid N Small Cap FundAn Open‐Ended Equity Scheme
Suitable for investors who are seeking*:Capital appreciation over long termInvestment predominantly in equity and equity‐related instruments of Mid and Small Cap companies
*Investors should consult their financial advisers if in doubt about whether the product is suitable for them

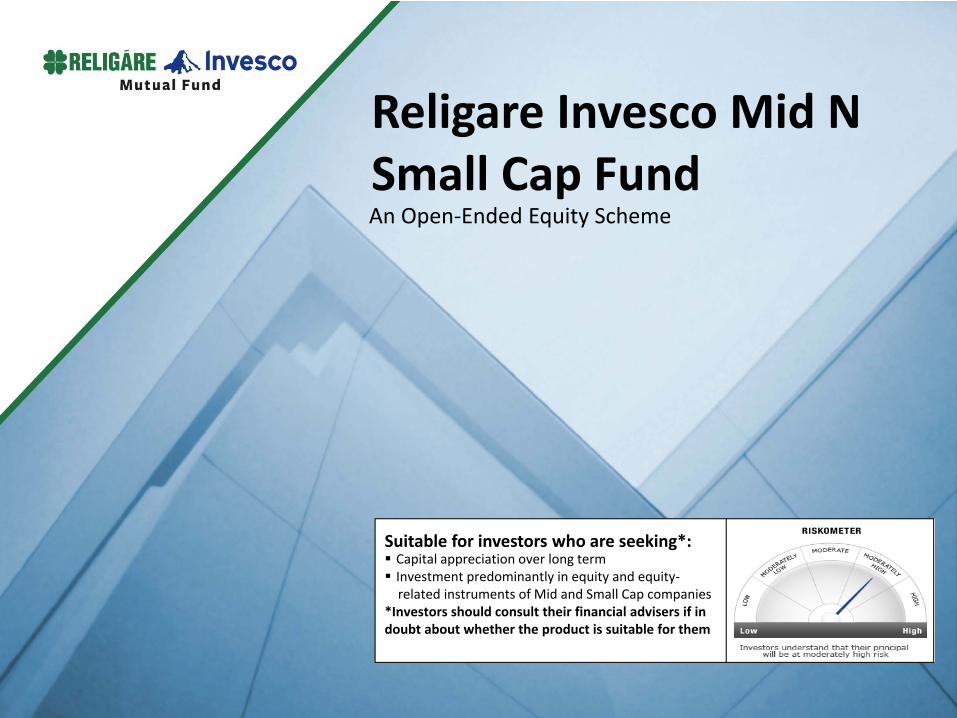
Why Midcaps?
Our bottom‐up stock picking strategy is well
suited to capitalize on this opportunity
Why Midcaps?
Midcaps are better compounding machines than large cap companies to grow capital over the long term
Midcaps are ideal way to gain exposure to some of the rapidly growing industries and business that are being driven by the structural changes in the economy
The widening pool of entrepreneurial talent in India is best tapped in mid cap stocks
Midcap companies provide an interesting investment opportunity whereby investors can benefit from earning growth and P/E multiples expansion in the future
3
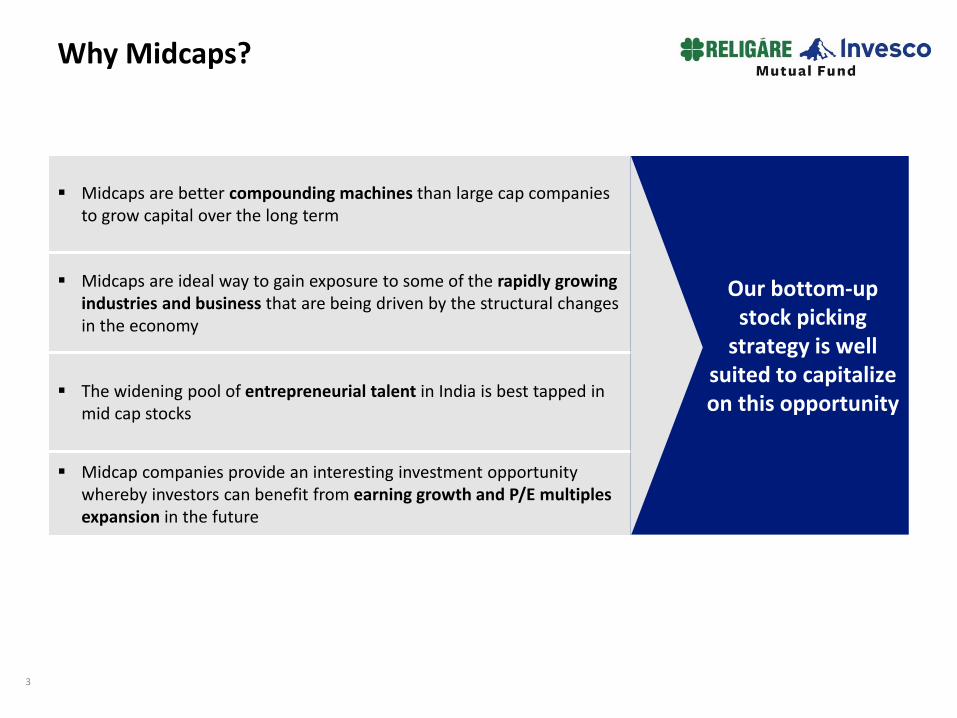
Midcaps – Wealth creators over the long term
Past performance may or may not be sustained in future. Data as on 30th June 2015. Source: MFIE. The base date of CNX Midcap is January 01, 2003. Mid caps and Large caps are representedby CNX Midcap Index & CNX Nifty Index respectively. The values has been rebased to 100 at the beginning of the period. The above simulation is for illustration purpose only and should not beconstrued as a promise on minimum returns and safeguard of capital. The AMC / Mutual Fund is not guaranteeing or forecasting any returns. Data Period (30th June, 2003 – 30th June, 2015).CAGR: Compounded Annualised Growth Rate.
Over the last 12 years Midcaps has outperformed the Large capsThe risks (as explained by price volatility) in midcaps are also higher relative to large capsMid cap companies should continue to deliver better returns relative to large caps in the medium term,albeit with higher risks
80
280
480
680
880
1080
12802003
2004
2005
2006
2007
2008
2009
2010
2011
2012
2013
2014
2015
CNX MidcapCNX Nifty Index
Large Cap = 18.11% CAGR
Std DeviationCNX Mid Cap: 8.40%CNX Nifty: 7.18%
Period: 30th June, 2003 – 30th June, 2015
4
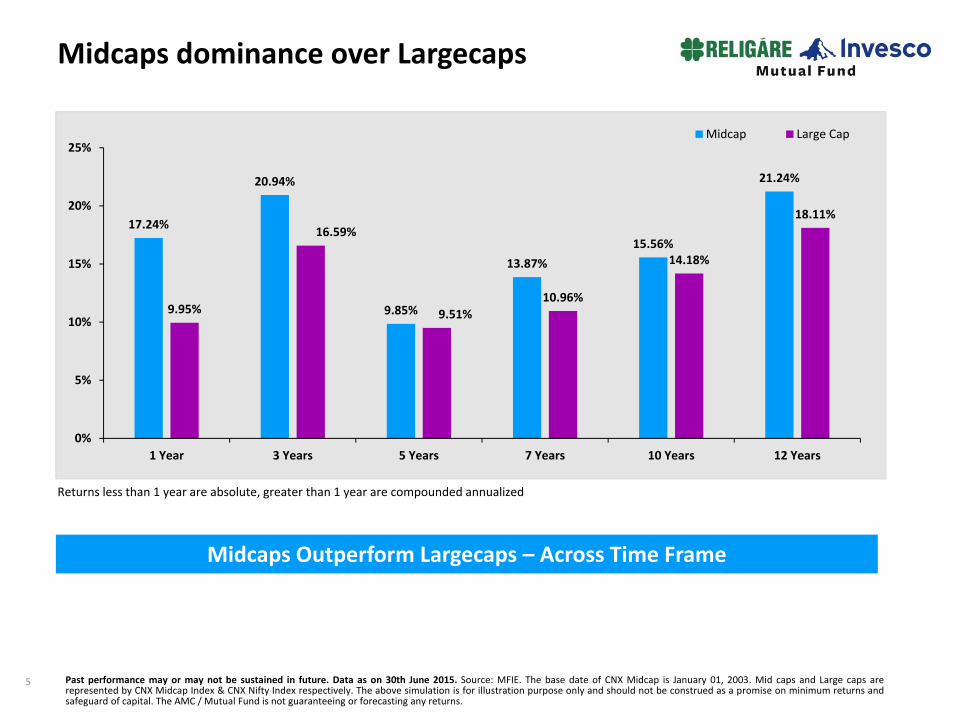
Midcaps dominance over Largecaps
17.24%
20.94%
9.85%
13.87%15.56%
21.24%
9.95%
16.59%
9.51%10.96%
14.18%
18.11%
0%
5%
10%
15%
20%
25%
1 Year 3 Years 5 Years 7 Years 10 Years 12 Years
Midcap Large Cap
Past performance may or may not be sustained in future. Data as on 30th June 2015. Source: MFIE. The base date of CNX Midcap is January 01, 2003. Mid caps and Large caps arerepresented by CNX Midcap Index & CNX Nifty Index respectively. The above simulation is for illustration purpose only and should not be construed as a promise on minimum returns andsafeguard of capital. The AMC / Mutual Fund is not guaranteeing or forecasting any returns.
Returns less than 1 year are absolute, greater than 1 year are compounded annualized
Midcaps Outperform Largecaps – Across Time Frame
5
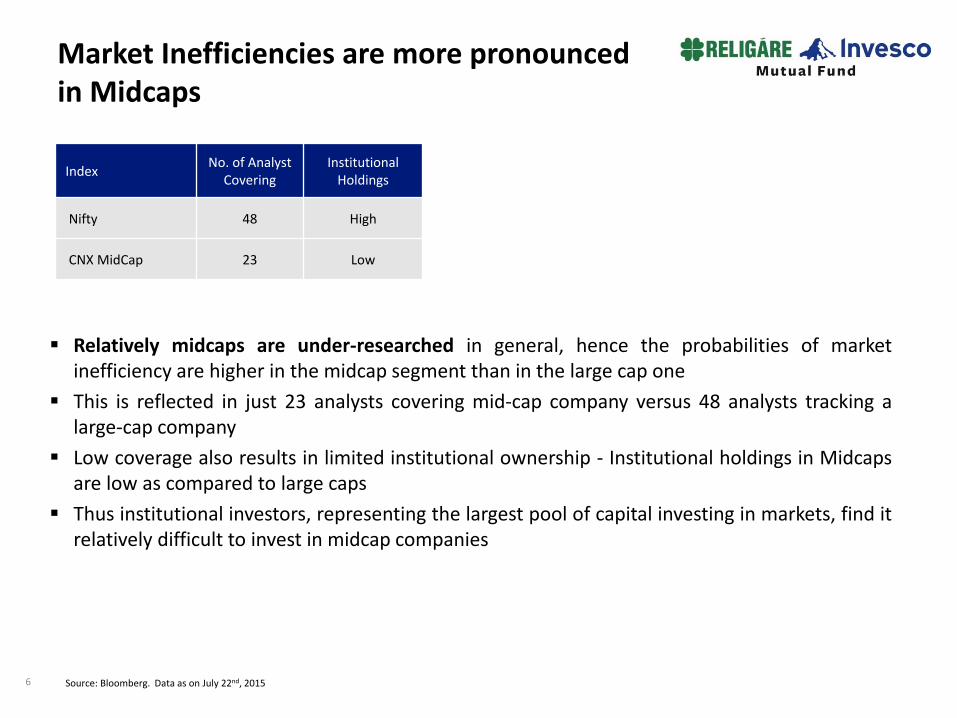
Market Inefficiencies are more pronounced in Midcaps
Relatively midcaps are under‐researched in general, hence the probabilities of marketinefficiency are higher in the midcap segment than in the large cap oneThis is reflected in just 23 analysts covering mid‐cap company versus 48 analysts tracking alarge‐cap companyLow coverage also results in limited institutional ownership ‐ Institutional holdings in Midcapsare low as compared to large capsThus institutional investors, representing the largest pool of capital investing in markets, find itrelatively difficult to invest in midcap companies
Index No. of Analyst Covering
Institutional Holdings
Nifty 48 High
CNX MidCap 23 Low
Source: Bloomberg. Data as on July 22nd, 20156
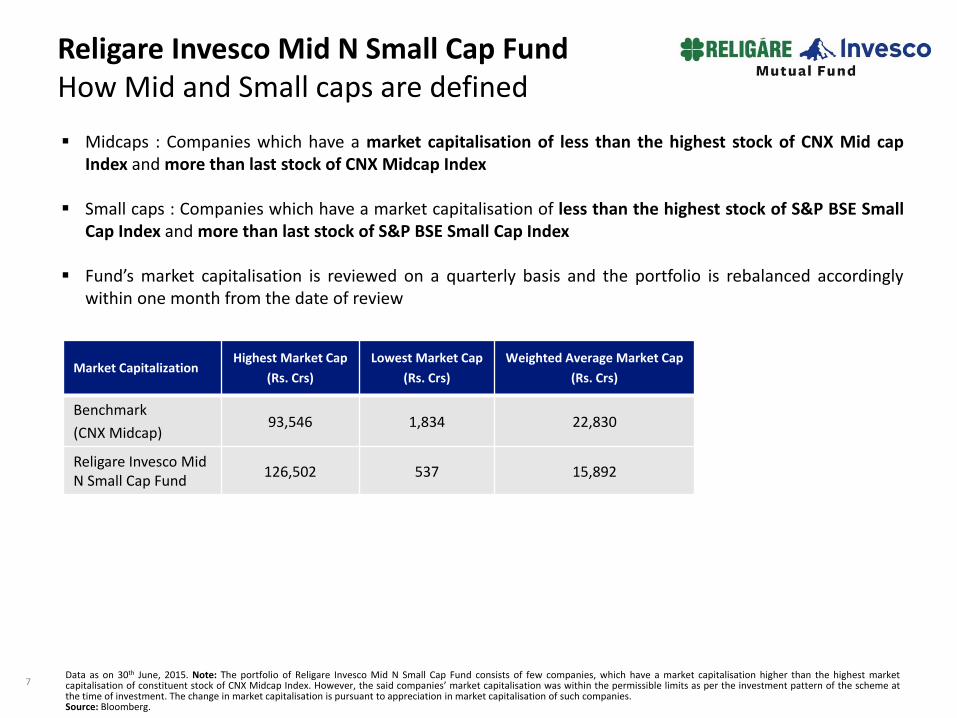
Religare Invesco Mid N Small Cap FundHow Mid and Small caps are defined
Midcaps : Companies which have a market capitalisation of less than the highest stock of CNX Mid capIndex andmore than last stock of CNX Midcap Index
Small caps : Companies which have a market capitalisation of less than the highest stock of S&P BSE SmallCap Index andmore than last stock of S&P BSE Small Cap Index
Fund’s market capitalisation is reviewed on a quarterly basis and the portfolio is rebalanced accordinglywithin one month from the date of review
Market CapitalizationHighest Market Cap
(Rs. Crs)Lowest Market Cap
(Rs. Crs)Weighted Average Market Cap
(Rs. Crs)
Benchmark (CNX Midcap)
93,546 1,834 22,830
Religare Invesco Mid N Small Cap Fund 126,502 537 15,892
Data as on 30th June, 2015. Note: The portfolio of Religare Invesco Mid N Small Cap Fund consists of few companies, which have a market capitalisation higher than the highest marketcapitalisation of constituent stock of CNX Midcap Index. However, the said companies’ market capitalisation was within the permissible limits as per the investment pattern of the scheme atthe time of investment. The change in market capitalisation is pursuant to appreciation in market capitalisation of such companies.Source: Bloomberg.
7
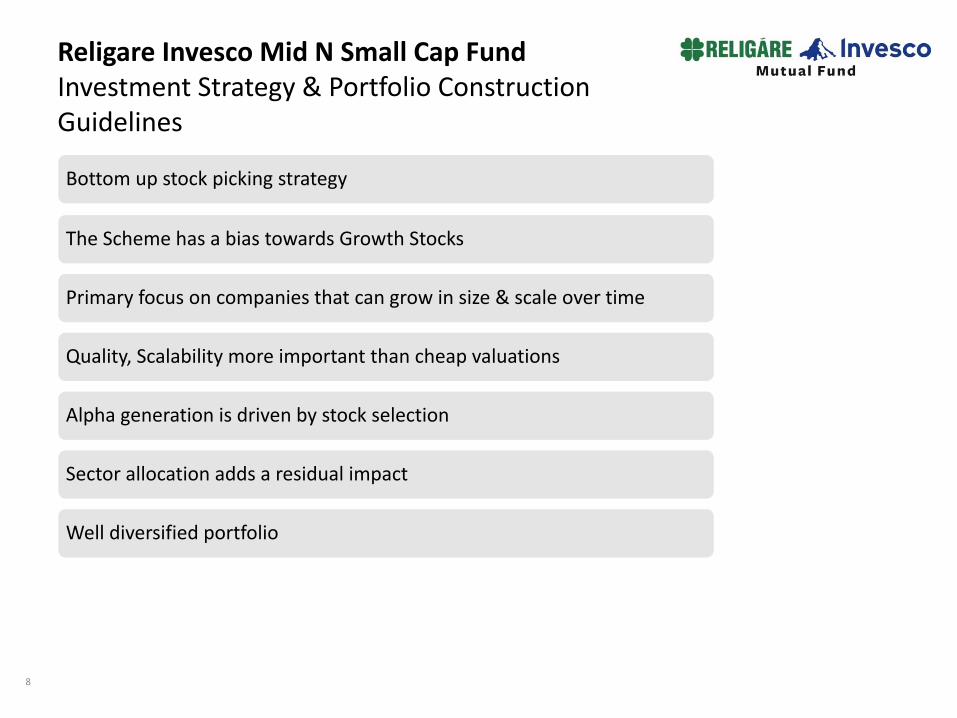
Religare Invesco Mid N Small Cap FundInvestment Strategy & Portfolio Construction Guidelines
Bottom up stock picking strategy
The Scheme has a bias towards Growth Stocks
Primary focus on companies that can grow in size & scale over time
Quality, Scalability more important than cheap valuations
Alpha generation is driven by stock selection
Sector allocation adds a residual impact
Well diversified portfolio
8
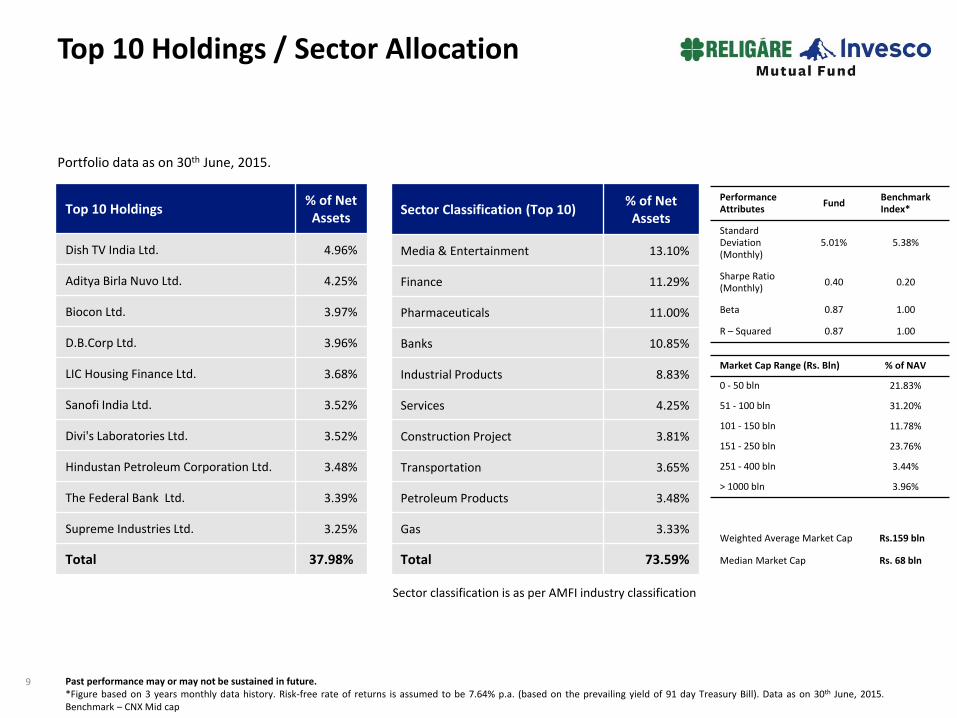
Top 10 Holdings / Sector Allocation
Portfolio data as on 30th June, 2015.
Sector classification is as per AMFI industry classification
Top 10 Holdings % of Net Assets
Dish TV India Ltd. 4.96%
Aditya Birla Nuvo Ltd. 4.25%
Biocon Ltd. 3.97%
D.B.Corp Ltd. 3.96%
LIC Housing Finance Ltd. 3.68%
Sanofi India Ltd. 3.52%
Divi's Laboratories Ltd. 3.52%
Hindustan Petroleum Corporation Ltd. 3.48%
The Federal Bank Ltd. 3.39%
Supreme Industries Ltd. 3.25%
Total 37.98%
Sector Classification (Top 10) % of Net Assets
Media & Entertainment 13.10%
Finance 11.29%
Pharmaceuticals 11.00%
Banks 10.85%
Industrial Products 8.83%
Services 4.25%
Construction Project 3.81%
Transportation 3.65%
Petroleum Products 3.48%
Gas 3.33%
Total 73.59%
Performance Attributes Fund Benchmark
Index*
Standard Deviation (Monthly)
5.01% 5.38%
Sharpe Ratio(Monthly) 0.40 0.20
Beta 0.87 1.00
R – Squared 0.87 1.00
Past performance may or may not be sustained in future.*Figure based on 3 years monthly data history. Risk‐free rate of returns is assumed to be 7.64% p.a. (based on the prevailing yield of 91 day Treasury Bill). Data as on 30th June, 2015.Benchmark – CNXMid cap
Market Cap Range (Rs. Bln) % of NAV
0 ‐ 50 bln 21.83%
51 ‐ 100 bln 31.20%
101 ‐ 150 bln 11.78%
151 ‐ 250 bln 23.76%
251 ‐ 400 bln 3.44%
> 1000 bln 3.96%
Weighted Average Market Cap Rs.159 bln
Median Market Cap Rs. 68 bln
9
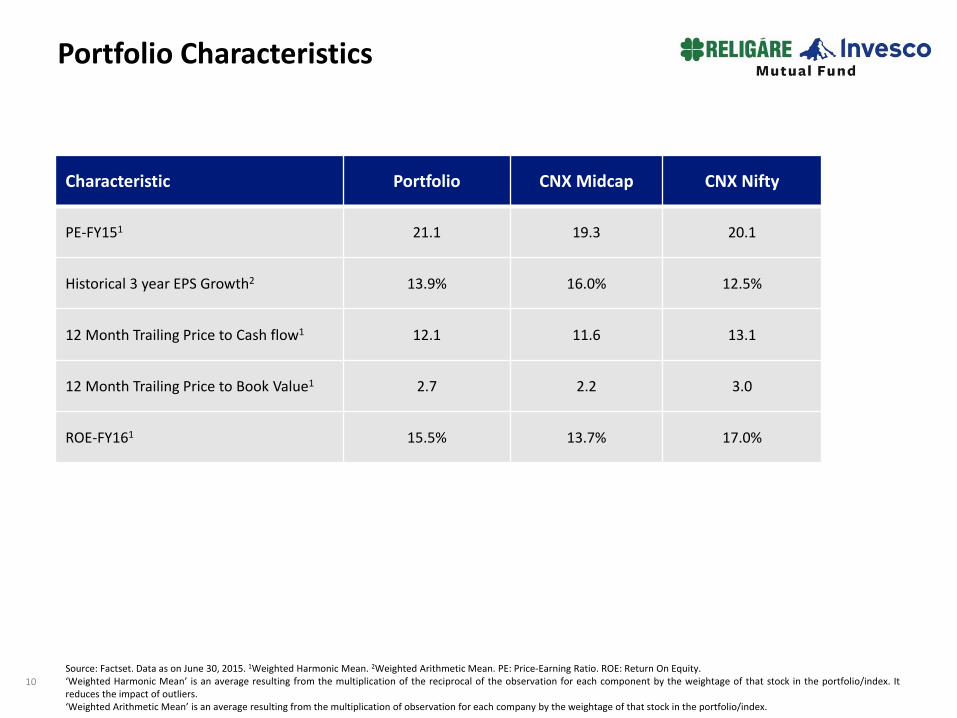
Portfolio Characteristics
Characteristic Portfolio CNX Midcap CNX Nifty
PE‐FY151 21.1 19.3 20.1
Historical 3 year EPS Growth2 13.9% 16.0% 12.5%
12 Month Trailing Price to Cash flow1 12.1 11.6 13.1
12 Month Trailing Price to Book Value1 2.7 2.2 3.0
ROE‐FY161 15.5% 13.7% 17.0%
Source: Factset. Data as on June 30, 2015. 1Weighted Harmonic Mean. 2Weighted Arithmetic Mean. PE: Price‐Earning Ratio. ROE: Return On Equity.‘Weighted Harmonic Mean’ is an average resulting from the multiplication of the reciprocal of the observation for each component by the weightage of that stock in the portfolio/index. Itreduces the impact of outliers.‘Weighted Arithmetic Mean’ is an average resulting from the multiplication of observation for each company by the weightage of that stock in the portfolio/index.
10
35,260
22,02118,584
0
5000
10000
15000
20000
25000
30000
35000
40000
Mar‐08
Jun‐08
Sep‐08
Dec‐08
Apr‐09
Jul‐0
9
Oct‐09
Jan‐10
Apr‐10
Jul‐1
0
Oct‐10
Jan‐11
May‐11
Aug‐11
Nov
‐11
Feb‐12
May‐12
Aug‐12
Nov
‐12
Feb‐13
May‐13
Sep‐13
Dec‐13
Mar‐14
Jun‐14
Sep‐14
Dec‐14
Mar‐15
Jun‐15
Religare Invesco Mid N Small Cap Fund ‐ Growth
CNX Midcap
CNX NIFTY
1Past performance may or may not be sustained in future. 2Scheme Benchmark. 3Additional Benchmark. Please refer to the slide on ‘Performance of other scheme managed’ by Vinay Paharia.Returns are of Growth Option. For calculating returns since inception, NAV as on date allotment is taken at Face Value i.e. Rs. 10. Returns above 1 year are Compounded Annualised Growth Rate(CAGR). Since inception returns for Direct Plan is not given as it has not completed 3 years. June 30 and June 29 being non business days, performance as on June 29 and June 28 has been given,wherever applicable.
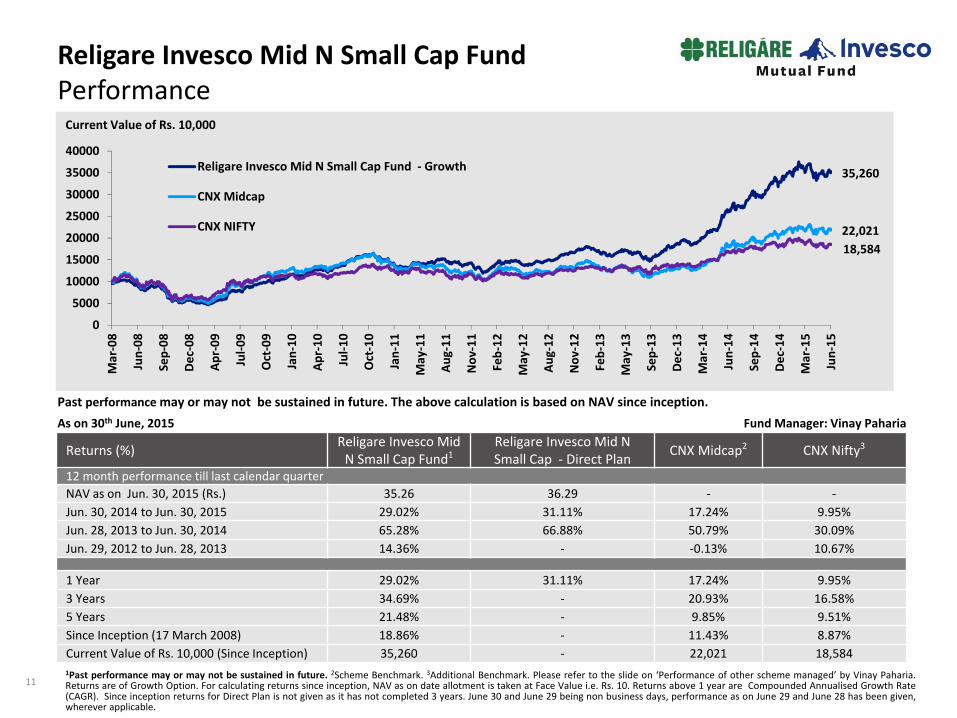
Religare Invesco Mid N Small Cap FundPerformance
Past performance may or may not be sustained in future. The above calculation is based on NAV since inception.As on 30th June, 2015
Returns (%) Religare Invesco Mid N Small Cap Fund1
Religare Invesco Mid N Small Cap ‐ Direct Plan CNX Midcap2 CNX Nifty3
12 month performance till last calendar quarterNAV as on Jun. 30, 2015 (Rs.) 35.26 36.29 ‐ ‐Jun. 30, 2014 to Jun. 30, 2015 29.02% 31.11% 17.24% 9.95%Jun. 28, 2013 to Jun. 30, 2014 65.28% 66.88% 50.79% 30.09%Jun. 29, 2012 to Jun. 28, 2013 14.36% ‐ ‐0.13% 10.67%
1 Year 29.02% 31.11% 17.24% 9.95%3 Years 34.69% ‐ 20.93% 16.58%5 Years 21.48% ‐ 9.85% 9.51%Since Inception (17 March 2008) 18.86% ‐ 11.43% 8.87%Current Value of Rs. 10,000 (Since Inception) 35,260 ‐ 22,021 18,584
Fund Manager: Vinay Paharia
Current Value of Rs. 10,000
11
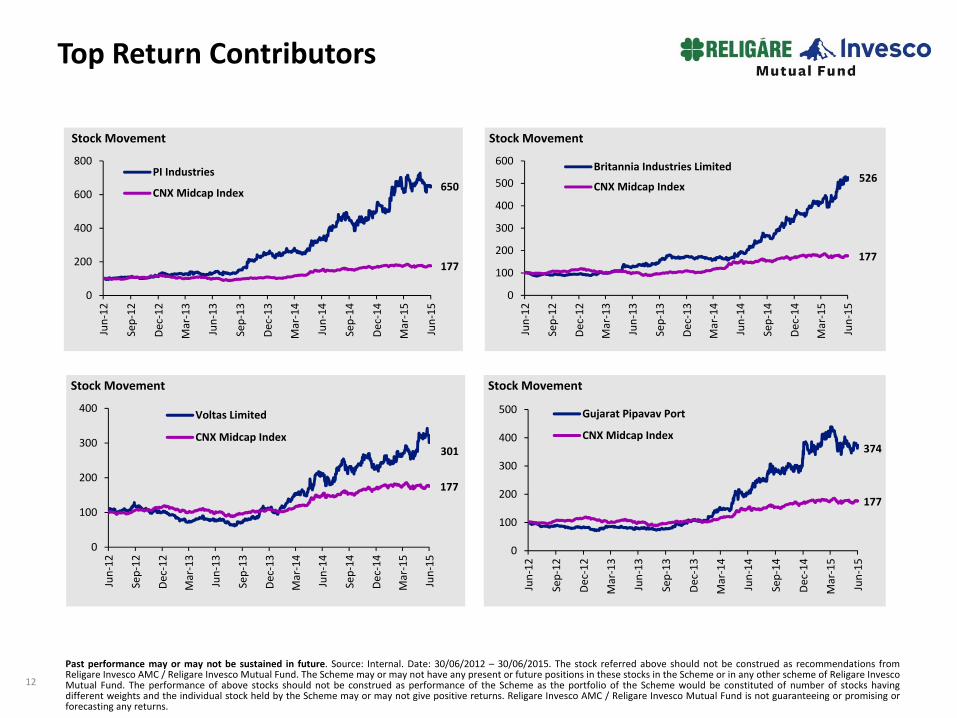
Top Return Contributors
650
177
0
200
400
600
800
Jun‐12
Sep‐12
Dec‐12
Mar‐13
Jun‐13
Sep‐13
Dec‐13
Mar‐14
Jun‐14
Sep‐14
Dec‐14
Mar‐15
Jun‐15
Stock Movement
PI Industries
CNX Midcap Index526
177
0
100
200
300
400
500
600
Jun‐12
Sep‐12
Dec‐12
Mar‐13
Jun‐13
Sep‐13
Dec‐13
Mar‐14
Jun‐14
Sep‐14
Dec‐14
Mar‐15
Jun‐15
Stock Movement
Britannia Industries Limited
CNX Midcap Index
301
177
0
100
200
300
400
Jun‐12
Sep‐12
Dec‐12
Mar‐13
Jun‐13
Sep‐13
Dec‐13
Mar‐14
Jun‐14
Sep‐14
Dec‐14
Mar‐15
Jun‐15
Stock Movement
Voltas Limited
CNX Midcap Index374
177
0
100
200
300
400
500
Jun‐12
Sep‐12
Dec‐12
Mar‐13
Jun‐13
Sep‐13
Dec‐13
Mar‐14
Jun‐14
Sep‐14
Dec‐14
Mar‐15
Jun‐15
Stock Movement
Gujarat Pipavav Port
CNX Midcap Index
Past performance may or may not be sustained in future. Source: Internal. Date: 30/06/2012 – 30/06/2015. The stock referred above should not be construed as recommendations fromReligare Invesco AMC / Religare Invesco Mutual Fund. The Scheme may or may not have any present or future positions in these stocks in the Scheme or in any other scheme of Religare InvescoMutual Fund. The performance of above stocks should not be construed as performance of the Scheme as the portfolio of the Scheme would be constituted of number of stocks havingdifferent weights and the individual stock held by the Scheme may or may not give positive returns. Religare Invesco AMC / Religare Invesco Mutual Fund is not guaranteeing or promising orforecasting any returns.
12
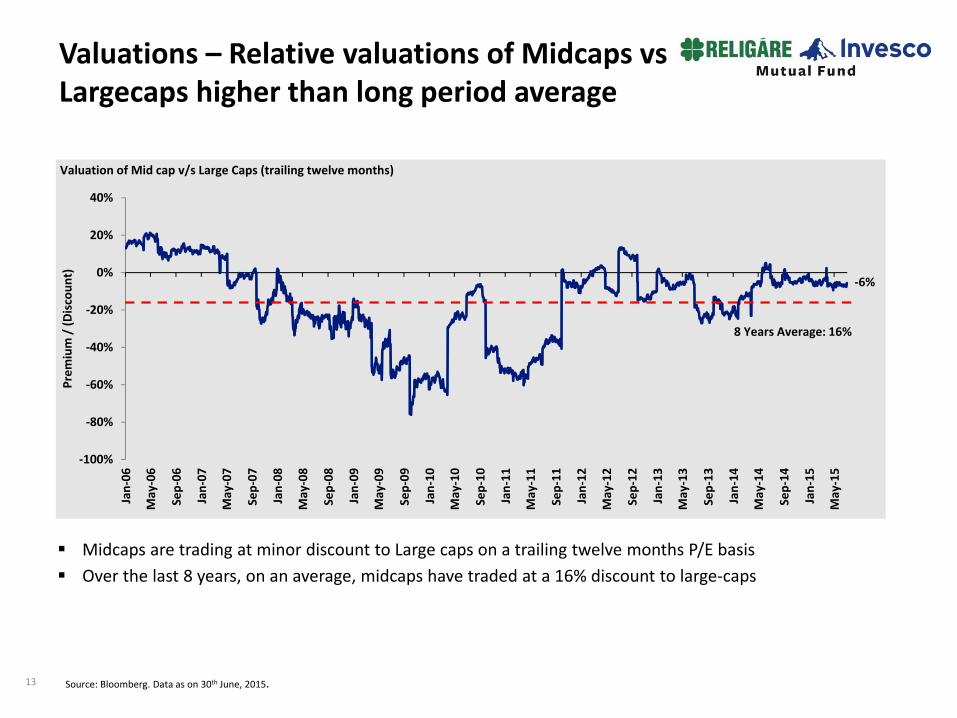
Valuations – Relative valuations of Midcaps vs Largecaps higher than long period average
Source: Bloomberg. Data as on 30th June, 2015.
Midcaps are trading at minor discount to Large caps on a trailing twelve months P/E basisOver the last 8 years, on an average, midcaps have traded at a 16% discount to large‐caps
‐6%
‐100%
‐80%
‐60%
‐40%
‐20%
0%
20%
40%
Jan‐06
May‐06
Sep‐06
Jan‐07
May‐07
Sep‐07
Jan‐08
May‐08
Sep‐08
Jan‐09
May‐09
Sep‐09
Jan‐10
May‐10
Sep‐10
Jan‐11
May‐11
Sep‐11
Jan‐12
May‐12
Sep‐12
Jan‐13
May‐13
Sep‐13
Jan‐14
May‐14
Sep‐14
Jan‐15
May‐15
Prem
ium / (D
iscoun
t)
Valuation of Mid cap v/s Large Caps (trailing twelve months)
8 Years Average: 16%
13
Portfolio Update and Outlook
The fund is growth biased and hence large proportion of the fund is invested in businesseswhere the intrinsic value is compounding at a pace faster than economic growth
The fund has a balanced exposure across companies with businesses exposed to consumptiondemand and investment demand
Midcaps are trading at a minor discount to Large caps on a trailing twelve months P/E basis1
Earnings growth for Midcap companies is expected to improve with a recovery in domesticgrowth and a more benign monetary environment
Note: 1For details kindly refer to slide 13.14
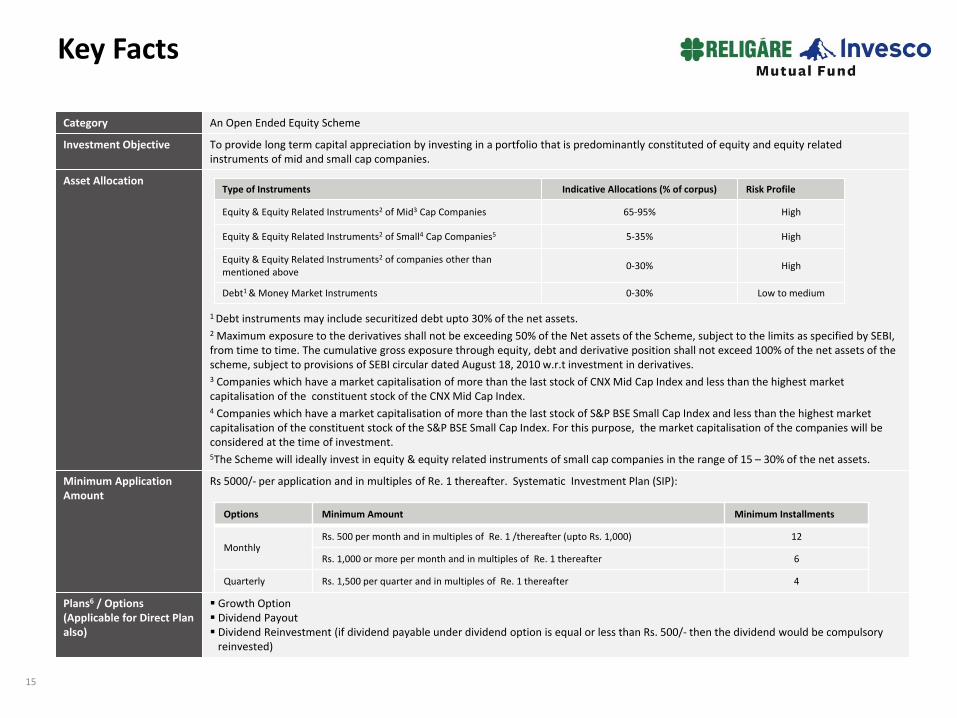
Category An Open Ended Equity Scheme
Investment Objective To provide long term capital appreciation by investing in a portfolio that is predominantly constituted of equity and equity related instruments of mid and small cap companies.
Asset Allocation
1 Debt instruments may include securitized debt upto 30% of the net assets.2 Maximum exposure to the derivatives shall not be exceeding 50% of the Net assets of the Scheme, subject to the limits as specified by SEBI, from time to time. The cumulative gross exposure through equity, debt and derivative position shall not exceed 100% of the net assets of the scheme, subject to provisions of SEBI circular dated August 18, 2010 w.r.t investment in derivatives.3 Companies which have a market capitalisation of more than the last stock of CNX Mid Cap Index and less than the highest market capitalisation of the constituent stock of the CNX Mid Cap Index.4 Companies which have a market capitalisation of more than the last stock of S&P BSE Small Cap Index and less than the highest market capitalisation of the constituent stock of the S&P BSE Small Cap Index. For this purpose, the market capitalisation of the companies will be considered at the time of investment.5The Scheme will ideally invest in equity & equity related instruments of small cap companies in the range of 15 – 30% of the net assets.
Minimum Application Amount
Rs 5000/‐ per application and in multiples of Re. 1 thereafter. Systematic Investment Plan (SIP):
Plans6 / Options (Applicable for Direct Plan also)
Growth Option Dividend PayoutDividend Reinvestment (if dividend payable under dividend option is equal or less than Rs. 500/‐ then the dividend would be compulsory reinvested)
Type of Instruments Indicative Allocations (% of corpus) Risk Profile
Equity & Equity Related Instruments2 of Mid3 Cap Companies 65‐95% High
Equity & Equity Related Instruments2 of Small4 Cap Companies5 5‐35% High
Equity & Equity Related Instruments2 of companies other than mentioned above 0‐30% High
Debt1 & Money Market Instruments 0‐30% Low to medium
Options Minimum Amount Minimum Installments
MonthlyRs. 500 per month and in multiples of Re. 1 /thereafter (upto Rs. 1,000) 12
Rs. 1,000 or more per month and in multiples of Re. 1 thereafter 6
Quarterly Rs. 1,500 per quarter and in multiples of Re. 1 thereafter 4
Key Facts
15
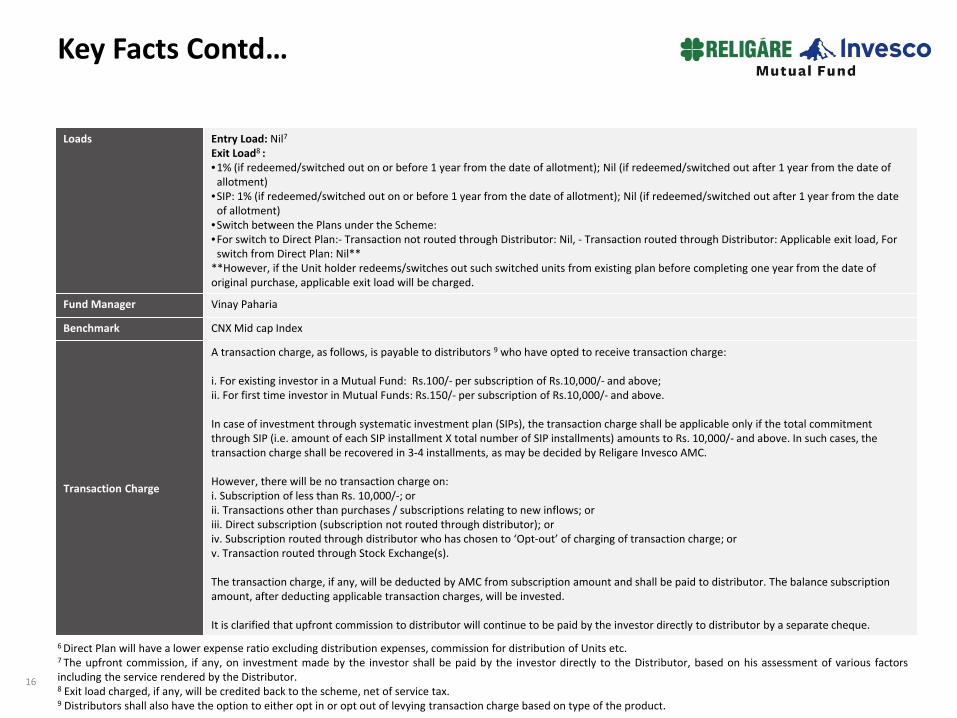
Loads Entry Load: Nil7Exit Load8 :•1% (if redeemed/switched out on or before 1 year from the date of allotment); Nil (if redeemed/switched out after 1 year from the date of allotment)
•SIP: 1% (if redeemed/switched out on or before 1 year from the date of allotment); Nil (if redeemed/switched out after 1 year from the date of allotment)
•Switch between the Plans under the Scheme:•For switch to Direct Plan:‐ Transaction not routed through Distributor: Nil, ‐ Transaction routed through Distributor: Applicable exit load, For switch from Direct Plan: Nil****However, if the Unit holder redeems/switches out such switched units from existing plan before completing one year from the date of original purchase, applicable exit load will be charged.
Fund Manager Vinay Paharia
Benchmark CNX Mid cap Index
Transaction Charge
A transaction charge, as follows, is payable to distributors 9 who have opted to receive transaction charge:
i. For existing investor in a Mutual Fund: Rs.100/‐ per subscription of Rs.10,000/‐ and above;ii. For first time investor in Mutual Funds: Rs.150/‐ per subscription of Rs.10,000/‐ and above.
In case of investment through systematic investment plan (SIPs), the transaction charge shall be applicable only if the total commitment through SIP (i.e. amount of each SIP installment X total number of SIP installments) amounts to Rs. 10,000/‐ and above. In such cases, the transaction charge shall be recovered in 3‐4 installments, as may be decided by Religare Invesco AMC.
However, there will be no transaction charge on: i. Subscription of less than Rs. 10,000/‐; orii. Transactions other than purchases / subscriptions relating to new inflows; oriii. Direct subscription (subscription not routed through distributor); oriv. Subscription routed through distributor who has chosen to ‘Opt‐out’ of charging of transaction charge; orv. Transaction routed through Stock Exchange(s).
The transaction charge, if any, will be deducted by AMC from subscription amount and shall be paid to distributor. The balance subscription amount, after deducting applicable transaction charges, will be invested.
It is clarified that upfront commission to distributor will continue to be paid by the investor directly to distributor by a separate cheque.
6 Direct Plan will have a lower expense ratio excluding distribution expenses, commission for distribution of Units etc.7 The upfront commission, if any, on investment made by the investor shall be paid by the investor directly to the Distributor, based on his assessment of various factorsincluding the service rendered by the Distributor.8 Exit load charged, if any, will be credited back to the scheme, net of service tax.9 Distributors shall also have the option to either opt in or opt out of levying transaction charge based on type of the product.
Key Facts Contd…
16
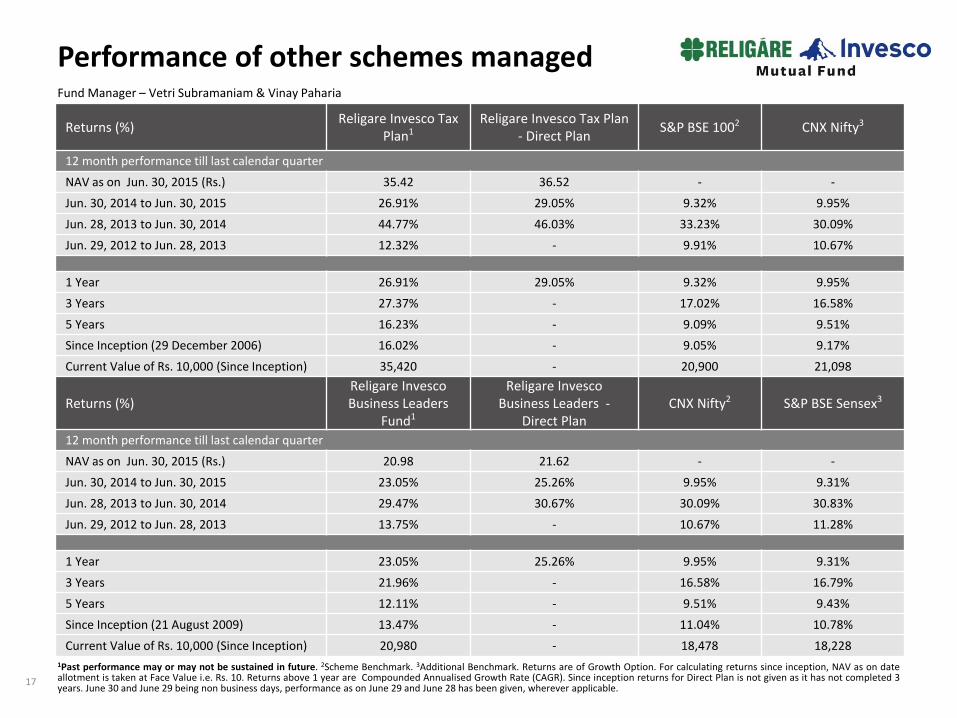
Performance of other schemes managedFund Manager – Vetri Subramaniam & Vinay Paharia
1Past performance may or may not be sustained in future. 2Scheme Benchmark. 3Additional Benchmark. Returns are of Growth Option. For calculating returns since inception, NAV as on dateallotment is taken at Face Value i.e. Rs. 10. Returns above 1 year are Compounded Annualised Growth Rate (CAGR). Since inception returns for Direct Plan is not given as it has not completed 3years. June 30 and June 29 being non business days, performance as on June 29 and June 28 has been given, wherever applicable.
Returns (%) Religare Invesco Tax Plan1
Religare Invesco Tax Plan ‐ Direct Plan S&P BSE 1002 CNX Nifty3
12 month performance till last calendar quarter
NAV as on Jun. 30, 2015 (Rs.) 35.42 36.52 ‐ ‐
Jun. 30, 2014 to Jun. 30, 2015 26.91% 29.05% 9.32% 9.95%
Jun. 28, 2013 to Jun. 30, 2014 44.77% 46.03% 33.23% 30.09%
Jun. 29, 2012 to Jun. 28, 2013 12.32% ‐ 9.91% 10.67%
1 Year 26.91% 29.05% 9.32% 9.95%
3 Years 27.37% ‐ 17.02% 16.58%
5 Years 16.23% ‐ 9.09% 9.51%
Since Inception (29 December 2006) 16.02% ‐ 9.05% 9.17%
Current Value of Rs. 10,000 (Since Inception) 35,420 ‐ 20,900 21,098
Returns (%)Religare Invesco Business Leaders
Fund1
Religare Invesco Business Leaders ‐
Direct PlanCNX Nifty2 S&P BSE Sensex3
12 month performance till last calendar quarter
NAV as on Jun. 30, 2015 (Rs.) 20.98 21.62 ‐ ‐
Jun. 30, 2014 to Jun. 30, 2015 23.05% 25.26% 9.95% 9.31%
Jun. 28, 2013 to Jun. 30, 2014 29.47% 30.67% 30.09% 30.83%
Jun. 29, 2012 to Jun. 28, 2013 13.75% ‐ 10.67% 11.28%
1 Year 23.05% 25.26% 9.95% 9.31%
3 Years 21.96% ‐ 16.58% 16.79%
5 Years 12.11% ‐ 9.51% 9.43%
Since Inception (21 August 2009) 13.47% ‐ 11.04% 10.78%
Current Value of Rs. 10,000 (Since Inception) 20,980 ‐ 18,478 18,228
17
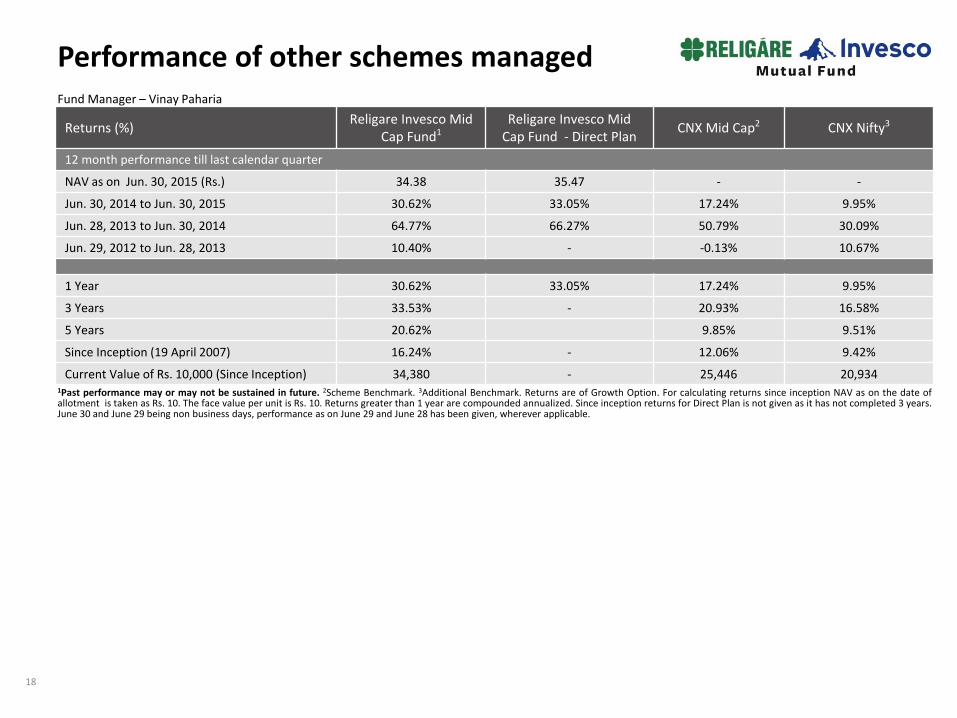
Performance of other schemes managedFund Manager – Vinay Paharia
1Past performance may or may not be sustained in future. 2Scheme Benchmark. 3Additional Benchmark. Returns are of Growth Option. For calculating returns since inception NAV as on the date ofallotment is taken as Rs. 10. The face value per unit is Rs. 10. Returns greater than 1 year are compounded annualized. Since inception returns for Direct Plan is not given as it has not completed 3 years.June 30 and June 29 being non business days, performance as on June 29 and June 28 has been given, wherever applicable.
Returns (%) Religare Invesco Mid Cap Fund1
Religare Invesco Mid Cap Fund ‐ Direct Plan CNX Mid Cap2 CNX Nifty3
12 month performance till last calendar quarter
NAV as on Jun. 30, 2015 (Rs.) 34.38 35.47 ‐ ‐
Jun. 30, 2014 to Jun. 30, 2015 30.62% 33.05% 17.24% 9.95%
Jun. 28, 2013 to Jun. 30, 2014 64.77% 66.27% 50.79% 30.09%
Jun. 29, 2012 to Jun. 28, 2013 10.40% ‐ ‐0.13% 10.67%
1 Year 30.62% 33.05% 17.24% 9.95%
3 Years 33.53% ‐ 20.93% 16.58%
5 Years 20.62% 9.85% 9.51%
Since Inception (19 April 2007) 16.24% ‐ 12.06% 9.42%
Current Value of Rs. 10,000 (Since Inception) 34,380 ‐ 25,446 20,934
18
MKTG
/ M
id N
Sm
all Cap
FU
ND
PPT/
0615/
C03104
Disclaimer
Disclaimer: This document alone is not sufficient and shouldn’t be used for the development or implementation of an investment strategy.The companies/sectors referred in this presentation should not be construed as recommendations from Religare Invesco Asset ManagementCompany Pvt. Ltd. (Religare Invesco AMC) / Religare Invesco Mutual Fund. The Fund may or may not have any present or future positions inthese stocks. It should not be construed as investment advice to any party. All figures, charts/graphs and data included in this document are ason date and are subject to change without notice. The data used in this document is obtained by Religare Invesco AMC from the sources whichit considers reliable. While utmost care has been exercised while preparing this document, Religare Invesco AMC does not warrant thecompleteness or accuracy of the information and disclaims all liabilities, losses and damages arising out of the use of this information. Thecontent of this document is intended solely for the use of the addressee. If you are not the addressee or the person responsible for deliveringit to the addressee, any disclosure, copying, distribution or any action taken or omitted to be taken in reliance on it is prohibited and may beunlawful. The recipient(s) before acting on any information herein should make his/their own investigation and seek appropriate professionaladvice.
Mutual Fund investments are subject to market risks, read all scheme related documents carefully.
19

Get in touchCorporate Office:Religare Invesco Asset Management Company Private Limited3rd Floor, GYS Infinity, Paranjpe ‘B’ Scheme, Subhash Road,Vile Parle (E), Mumbai – 400057T +91 22 67310000 F +91 22 28371565
To invest:Call 1800-209-0007 ∆ sms ‘Invest’ to 56677Invest Online www.religareinvesco.com
Follow us on