Embed Size (px)
Citation preview

Investors understand that their principal will be at Moderately High risk
This product is suitable for investors who are seeking*
· Long term capital growth.
· Investment in equity and equity related securities.
*Investors should consult their financial advisors if in doubt about whether the product issuitable for them.
Mutual Fund investments are subject to market risks, read all scheme related documents carefully.
• Claim Deduction upto ` 1,50,000 u/s 80C#
(An open ended equity linked saving scheme witha statutory lock in of 3 years and tax benefit)
Ab Tax BachaoAur Growth potential Bhi Pao!
#To save tax upto `46,800: Individual and HUF having taxable income of less than `50 lakhs can invest upto `1.5 lakhs under the ELSS scheme during the FY 2018-19 as per provision of Section 80C of the Income Tax Act 1961 (Includes applicable cess). Tax saving will be proportionately reduced subject to the taxable income and investments. Further, Investment in ELSS schemes is subject to lock in period of 3 years from the date of allotment of units. Long Term capital gain, if any on ELSS scheme investment is subject to applicable tax at the time of redemption. The tax benefits are as per the current income tax laws and rules. Investors are advised to consult their tax advisor before investing in such schemes. Common Source: RMF Internal Research
One Lakh Fifty Thousand Only
Reliance Tax Saver ( ELSS) Fund
*Source: 3 years CAGR returns as on March 28, 2018 - from CRISIL. The above comparison has been given for the purpose of the general information only. Investments in mutual funds should not be construed as a guarantee of any minimum returns. ELSS invests in equity and there is no capital protection guarantee or assurance of any return in mutual fund investment. Kindly consult your financial advisor before investing. Past performance may or may not be sustained in future.
^Ministry of Finance, **GOI, IndiaPost, @Leading Bank
Contact your Financial Advisor | Call 1800 300 11111 | SMS ‘ELSS’ to 561617 | www.reliancemutual.com
“001231” 3001231
SMS
char
ges
appl
y.
“latest available data”
Investment Option
Public Provident Fund
National Saving Certificate
Bank Tax Saving Fixed Deposits
Average IndustryEquity Linked Saving Scheme
Lock-in Period
15 Years
5/10 Years
5 Years
3 Years
Returns
7.6%^
7.6%**
6.75%@
8.41%*
Wealth Sets You Free
Reliance Tax Saver (ELSS) Fund
2
SCHEME DETAILS
Inception Date • 21st September 2005
Fund Size • Month end AUM: Rs. 9545.47 Crs (June 2018)
Scheme Type• An open ended equity linked saving scheme
with a statutory lock in of 3 years and tax benefit
Benchmark • S&P BSE 100
Fund Managers • Ashwani Kumar
Entry Load/ Exit Load
• Not Applicable
PORTFOLIO DETAILS
TOP 10 STOCKS WEIGHTAGE (%)
State Bank of India 10.03
Tata Steel Limited 8.74
TVS Motor Company Limited 5.99
Tata Motors Limited 5.74
Honeywell Automation India Limited 3.89
Ambuja Cements Limited 3.67
ABB India Limited 3.46
SBI Life Insurance Company Limited 2.91
Bharat Petroleum Corporation Limited 2.77
Canara Bank 2.42Note: For complete portfolio, please refer website www.reliancemutual.com. Current Portfolio Alloca-tion is based on the prevailing market conditions and is subject to changes depending on the fund manager’s view of the equity markets. Sector(s) / Stock(s) / Issuer(s) mentioned above are for the pur-pose of disclosure of the portfolio of the Scheme(s) and should not be construed as recommendation.
TOP 5 SECTORS
Banks 18.7%
IndustrialCapital Goods 16.1%
Auto 11.7%
Ferrous Metals 9.9%
Industrial Products 7.1%
CURRENT INVESTMENT PHILOSOPHY
• Seeks to maintain balance between large cap companies and mid cap companies.
• Endeavors to invest in potential leaders. Invest in companies with potential of high growth prospects over medium term (2-3 years).
• Generally, the fund has two or three sector calls at a time.• They are mostly in-line of emerging market trends. Small percentage
of portfolio is invested in contrarian calls. • Significant percent of outstanding equity of the scheme is invested in
high conviction mid-cap companies. • Significant allocation/exposure is taken in Multinational Companies
(MNC’s). • Attempt to have a balanced portfolio on a macro basis, allocating to
themes like Domestic, Consumption & Defensive.
WHY INVEST
• Fund endeavors to generate sustained long term alpha• Portfolio offers optimal mix of cyclical & defensive themes.• Tax benefit as per Section 80C*
*Note: Please refer Scheme Information Document (SID) for details.
Lumpsum Performance
Note: As TRI data is not available since inception of the scheme, benchmark performance is calculated using composite CAGR of S&P BSE 100 PRI values from date 21/09/2005 to date 29/06/2007 and TRI values since date 29/06/2007. Please Refer Page 3 for detailed Scheme Performance
The performance details provided herein are of Growth Plan (Regular Plan). Please refer Page 4 for detailed SIP Performance
Dividend History
The scheme's Dividend Plan has given 23 dividends in last 22 quarters!
Record Date Rate (Re/ Unit) Cum Dividend NAV *EX Dividend NAV
26-Jun-18 0.53 19.4235 18.8235
14-Mar-18 0.60 22.2716 21.6716
28-Dec-17 0.60 25.9583 25.3583
29-Sep-17 0.60 23.2492 22.6492
30-Jun-17 0.60 23.1274 22.5274
23-Mar-17 0.60 21.9299 21.3299
23-Dec-16 0.45 19.0755 18.6255
15-Sep-16 0.45 21.3909 20.9409
15-Jun-16 0.45 19.6784 19.2284
11-Mar-16 0.45 18.2183 17.7683
28-Dec-15 0.45 20.6670 20.2170
21-Sep-15 0.45 19.8841 19.4341
29-Jun-15 0.45 21.7955 21.3455
13-Mar-15 0.35 23.7821 23.4321
24-Dec-14 1.00 23.2342 22.2342
22-Sep-14 0.45 21.9523 21.5023
27-Jun-14 0.36 20.2727 19.9127
7-Mar-14 0.30 14.1956 13.8956
26-Dec-13 0.30 13.8827 13.5827
20-Sep-13 0.25 11.7342 11.4842
28-Jun-13 0.25 12.5391 12.2891
15-Mar-13 0.70 13.5195 12.8195
25-Jan-13 0.70 15.2853 14.5853
29-Mar-12 1.50 14.9833 13.4834
11-Feb-11 1.50 14.9209 13.8581
28-Aug-09 1.50 13.5493 12.0493
21-Feb-07 1.00 14.6877 13.5152
2-Nov-07 1.00 17.0834 16.0835
Disclaimer pertaining to SIP Returns: Past performance may or may not be sustained in the future. Returns on SIP and Benchmark are annualised and cumulative investment return for cash flows resulting out of uniform and regular monthly sub-scriptions have been worked out on excel spreadsheet function known as XIRR. It is assumed that a SIP of Rs. 10,000/- each executed on 10th of every month for Growth Plan (Regular Plan) has been taken into consideration including the first install-ment. It may please be noted that load has not been taken into consideration. The amounts invested in SIP and the market values of such investments at respective periodic intervals thereof are simulated for illustrative purposes for understanding the concept of SIP. This illustration should not be construed as a promise, guarantee on or a forecast of any minimum returns. The Mutual Fund or the Investment Manager does not assure any safeguard of capital and the illustrated returns are not neces-sarily indicative of future results and may not necessarily provide a basis for comparison with other investments. SIP does not guarantee or assure any protection against losses in declining market conditions.
Disclaimer pertaining to Dividend History: Dividend distribution is subject to availability & adequacy of distributable surplus. The Mutual Fund is not assuring that it will make periodical dividend distributions, though it has every intention of doing so. After the payment of dividend, the per unit NAV falls to the extent of the dividend payout and distribution taxes, if any. Performance of dividend plan/option would be net of applicable statutory levy , if any. Face value of Rs.10. * NAV on the 1st transaction day after Record Date, which includes the mark to market impact also. The above table provides dividend details of Dividend Plan (Regular Plan).
General Disclaimer: Data as on 30th June, 2018. Past Performance may or may not be sustained in future. Sector(s)/ Stock(s)/ Issuer(s) mentioned above are for the purpose of disclosure of the portfolio of the scheme(s) and should not be con-strued as a recommendation. The Fund manager(s) may or may not choose to hold the stock mentioned, from time to time. Investors are requested to consult their financial, tax and other advisors before taking any investment decision(s).
1.0
5.4
1.0
4.9
0.0
1.0
2.0
3.0
4.0
5.0
6.0
Sep 2005 Jun 2018
Reliance Tax Saver (ELSS) Fund
S&P BSE 100 (TRI)
Rs. 1 lac invested at the time of inception is worth Rs. 5.4 lac in the scheme compared to Rs. 4.9 lac in the Benchmark.
1.2 3.6 6.0 12.0 15.41.1 3.8 8.0
27.140.9
0.0
20.0
40.0
60.0
1 Year 3 Years 5 Years 10 Years Since Inception
SIP Performance
Total Amount Invested (Rs. Lakhs) Market Value (Rs. Lakhs)
0%
20%
40%
60%
more than Rs. 29,255 crs Rs. 8,580 crs to Rs.
29,255 crs less than Rs. 8,580 crs
50%
26%23%
Portfolio Market Capitalization
Reliance Tax Saver (ELSS) Fund
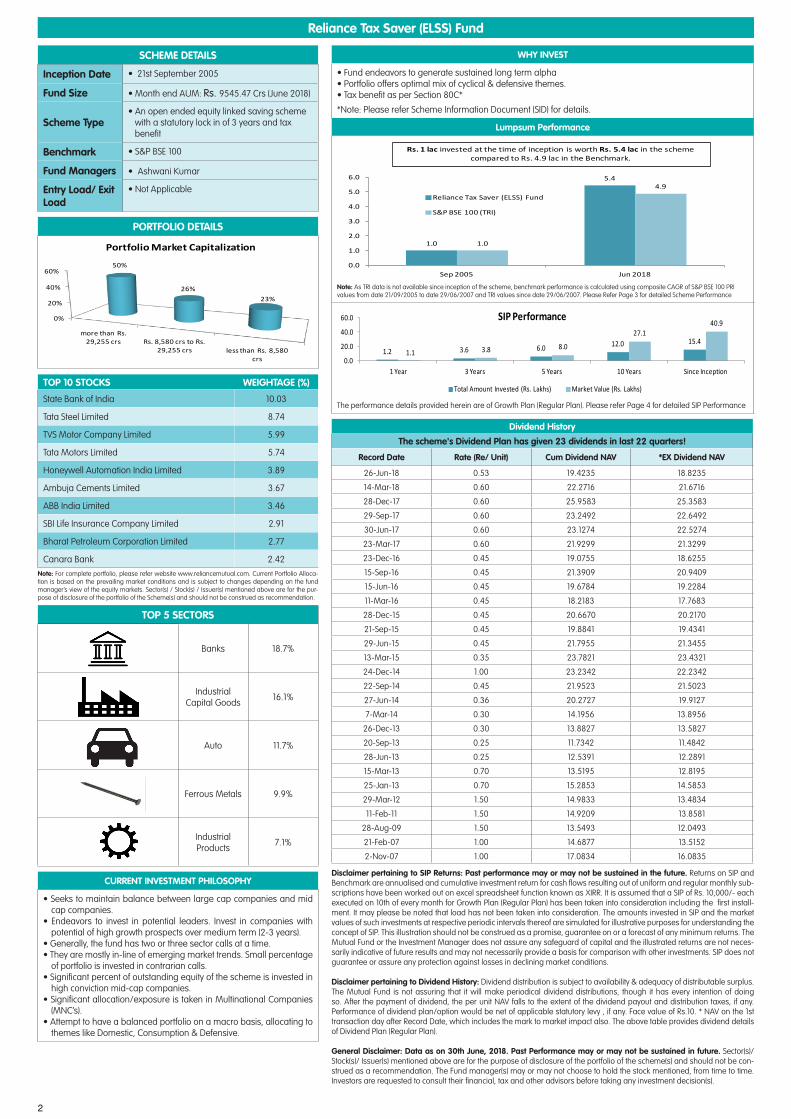
SCHEME PERFORMANCE SUMMARY
Reliance Tax Saver (ELSS) Fund (RTSF)NAV as on Jun 29, 2018: Rs 54.4649
Particulars CAGR %
1 Year 3 Years 5 Years Since InceptionReliance Tax Saver (ELSS) Fund -5.84 6.07 19.97 14.18B: S&P BSE 100 (TRI) 12.98 10.58 15.19 13.22AB: S&P BSE Sensex (TRI) 16.00 9.90 14.36 13.23Value of Rs.10000 InvestedReliance Tax Saver (ELSS) Fund 9,418 11,934 24,881 54,465B: S&P BSE 100 (TRI) 11,294 13,523 20,297 48,868AB: S&P BSE Sensex (TRI) 11,596 13,275 19,572 48,922Inception Date: Sep 21, 2005Fund Manager: Ashwani Kumar (Since Sep 2005)
Note: Different plans shall have a different expense structure. The performance details provided herein are of Growth Plan (Regular Plan).
As TRI data is not available since inception of the scheme, benchmark performance is calculated using composite CAGR of S&P BSE 100 PRI values from date 21/09/2005 to date 29/06/2007 and TRI values since date 29/06/2007.
As TRI data is not available since inception of the scheme, benchmark performance is calculated using composite CAGR of S&P BSE Sensex PRI values from date 21/09/2005 to date 31/05/2007 and TRI values since date 31/05/2007.
PERFORMANCE OF OTHER OPEN ENDED SCHEMES MANAGED BY THE SAME FUND MANAGERS (as on June 30, 2018)
Fund Manager: Ashwani Kumar
Scheme Name/sCAGR %
1 Year Return 3 Years Return 5 Years ReturnScheme Benchmark Scheme Benchmark Scheme Benchmark
Reliance Vision Fund -3.47 12.56 5.32 11.38 15.52 16.52
Mr. Ashwani Kumar has been managing Reliance Vision Fund since Jun 2003.
Note: a. Mr. Ashwani Kumar manages 2 open-ended schemes of Reliance Mutual Fund .b. In case the number of schemes managed by a fund manager is more than six, in the performance data of other schemes, the top 3 and bottom 3 schemes
managed by fund manager has been provided herein.c. Period for which scheme’s performance has been provided is computed basis last day of the month-end preceding the date of advertisementd. Different plans shall have a different expense structure. The performance details provided herein are of Growth Plan (Regular Plan).
Note: Performance as on 30th June, 2018
B: Benchmark, AB: Additional Benchmark, TRI: Total Return Index
Past performance may or may not be sustained in future and the same may not necessarily provide the basis for comparison with other investment. Performance of the schemes (wherever provided) are calculated basis CAGR for the past 1 year, 3 years, 5 years and since inception. Dividends (if any) are assumed to be reinvested at the prevailing NAV. In case, the start/end date of the concerned period is non-business day (NBD), the NAV of the previous date is considered for computation of returns. Schemes which have not completed one year, performance details for the same are not provided. Performance details of closed ended schemes are not provided since these are not comparable with other schemes. TRI - Total Returns Index refl ects the returns on the index arising from (a) constituent stock price movements and (b) dividend receipts from constituent index stocks, thereby showing a true picture of returns. In the perf ormance of other open ended schemes managed by the fund managers, the performance of the equity schemes is benchmarked to the Total Return variant of the Index.
PRODUCT LABELS
Name of Scheme This product is suitable for investors who are seeking*:
Reliance Vision Fund(An open ended equity scheme investing in both large cap and mid cap stocks)
• Long term capital growth• Investment in equity and equity related instruments of
large cap & mid cap companies through a research based approach
*Investors should consult their financial advisors if in doubt about whether the product is suitable for them.
3
Investors understand that their principalwill be at Moderately High risk
Reliance Tax Saver (ELSS) Fund
4
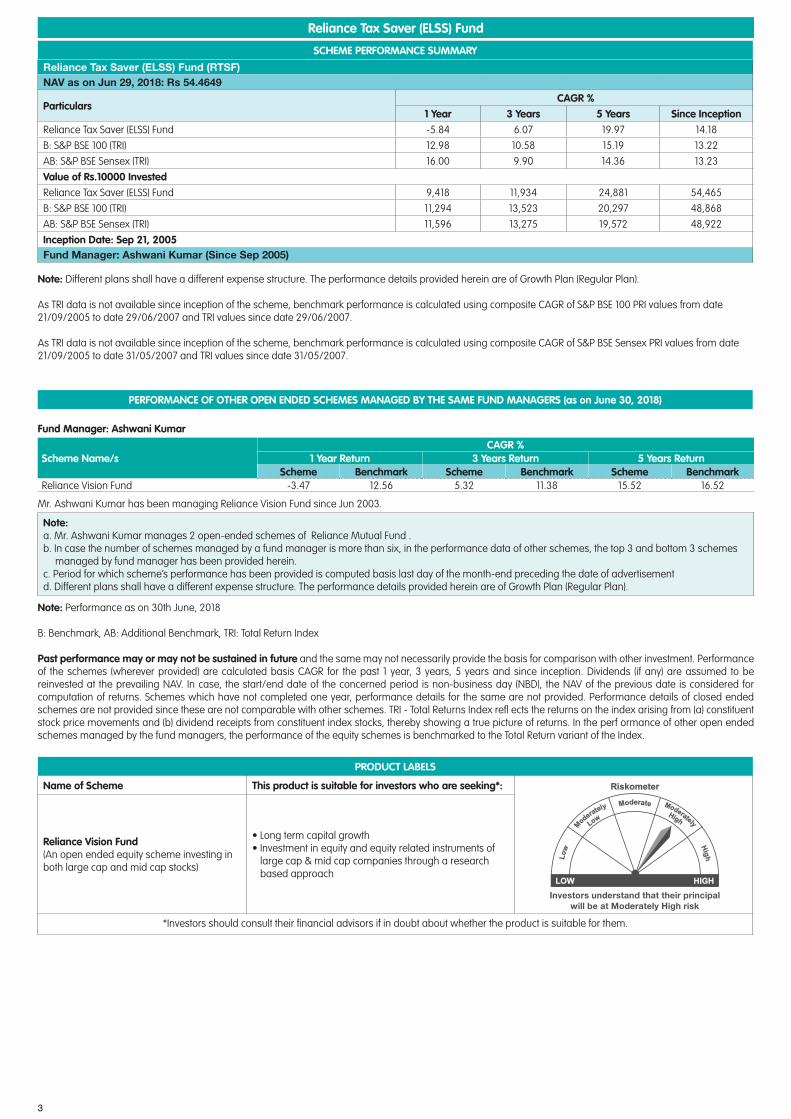
SIP PERFORMANCE OF EQUITY SCHEMES (as on 30th June, 2018)
Reliance Tax Saver (ELSS) FundPeriod Since Inception 15 Years 10 Years 5 Years 3 Years 1 YearTotal Amount Invested (Rs.) 1,540,000 - 1,200,000 600,000 360,000 120,000Market Value (Rs.) 4,088,381 - 2,706,039 796,764 382,496 105,417Scheme Return (%) 14.26 - 15.61 11.42 4.06 -22.88B: S&P BSE 100 (TRI) Return (%) N.A. - 13.13 13.28 14.42 7.04AB: S&P BSE Sensex (TRI) Return (%) N.A. - 12.83 13.06 15.59 14.06N.A: Since TRI data is not available prior to 29/06/2007 & 31/05/2007 for S&P BSE 100 & S&P BSE Sensex, performance for such period is not provided.
Reliance Vision FundPeriod Since Inception 15 Years 10 Years 5 Years 3 Years 1 YearTotal Amount Invested (Rs.) 2,730,000 1,800,000 1,200,000 600,000 360,000 120,000Market Value (Rs.) 38,418,523 5,200,339 2,140,926 761,407 384,487 107,885Scheme Return (%) 19.53 13.07 11.21 9.57 4.41 -19.15B: S&P BSE 250 LargeMidcap (TRI) Return (%) N.A. N.A. 13.93 14.31 14.66 5.55AB: S&P BSE Sensex (TRI) Return (%) N.A. N.A. 12.83 13.06 15.59 14.06N.A : Since TRI data is not available prior to 29/02/2008 & 31/05/2007 for S&P BSE 250 LargeMidcap & S&P BSE Sensex respectively, performance for such period is not provided.
Inception Dates: Reliance Tax Saver (ELSS) Fund - 21/09/2005, Reliance Vision Fund - 08/10/1995.
B: Benchmark, AB: Additional Benchmark, TRI: Total Return Index
TRI - Total Returns Index reflects the returns on the index arising from (a) constituent stock price movements and (b) dividend receipts from constituent index stocks, thereby showing a true picture of returns.
Disclaimer: Past performance may or may not be sustained in the future. Returns on SIP and Benchmark are annualised and cumulative investment return for cash flows resulting out of uniform and regular monthly subscriptions have been worked out on excel spreadsheet function known as XIRR. It is assumed that a SIP of Rs. 10,000/- each executed on 10th of every month for Growth Plan (Regular Plan) has been taken into consideration including the first installment. It may please be noted that load has not been taken into consideration. The amounts invested in SIP and the market values of such investments at respective periodic intervals thereof are simulated for illustrative purposes for understanding the concept of SIP. This illustration should not be construed as a promise, guarantee on or a forecast of any minimum returns. The Mutual Fund or the Investment Manager does not assure any safeguard of capital and the illustrated returns are not necessarily indicative of future results and may not necessarily provide a basis for comparison with other investments. SIP does not guarantee or assure any protection against losses in declining market conditions.
Mutual Fund Investments are subject to market r isks, read al l scheme related documents careful ly.