Embed Size (px)
Citation preview

Reliable Two-Dimensional Phase Unwrapping MethodUsing Region Growing and Local Linear Estimation
Kun Zhou,1,2 Maxim Zaitsev,2 and Shanglian Bao1*
In MRI, phase maps can provide useful information about pa-rameters such as field inhomogeneity, velocity of blood flow,and the chemical shift between water and fat. As phase isdefined in the (��,�] range, however, phase wraps often occur,which complicates image analysis and interpretation. This workpresents a two-dimensional phase unwrapping algorithm thatuses quality-guided region growing and local linear estimation.The quality map employs the variance of the second-orderpartial derivatives of the phase as the quality criterion. Phaseinformation from unwrapped neighboring pixels is used to pre-dict the correct phase of the current pixel using a linear regres-sion method. The algorithm was tested on both simulated andreal data, and is shown to successfully unwrap phase imagesthat are corrupted by noise and have rapidly changingphase. Magn Reson Med 62:1085-1090, 2009. © 2009 Wiley-Liss, Inc.
Key words: MRI; phase unwrapping; two dimensional; quality-guided
An MRI signal is composed of real and imaginary compo-nents. Mathematically, a complex image can be expressedas s(m,n) � �s(m,n)�exp(i�(m,n)), where �s(m,n)� denotesthe magnitude image and �(m,n) denotes the phase image.Magnitude images are widely used, while the phase com-ponents are often discarded. However, phase images canprovide useful information about field inhomogeneity(1,2), velocity of blood flow (3), or the chemical shiftbetween water and fat (4). Unfortunately, extracting thevalues of physical parameters from phase images is nottrivial because phase �(m,n) is defined in the range (��,�].If the values of physical parameters vary across a widerrange, the corresponding phase values will be outside thisinterval and are wrapped back into the range, resulting inso-called phase wrapping. Thus, the main difficulty ofutilizing phase information is that the relationship be-tween the physical parameters and the wrapped phasevalues is unknown. To obtain this information, a proce-dure called phase unwrapping is needed. A variety ofdifferent phase unwrapping algorithms have been devel-oped. Most of them make the assumption that the truephase difference between two adjacent pixels is smallerthan �. If this condition is satisfied, the unwrapped phasecan be easily determined. However, in MRI this condition
may be violated by noise, rapidly varying phase values, oreven phase discontinuity. Phase discontinuity may be en-countered in velocity-encoded imaging and field mapping(5). In this case, phase unwrapping becomes a difficultproblem.
Existing phase unwrapping methods (some of which are3D) can be classified into four different categories: path-following (5–10), cost function optimization (11–14),Bayesian (15), and parametric modeling methods (16).Since the presented method belongs to the first category, abrief introduction of path-following methods follows.
Path-following methods apply line integration over aphase gradient map. If there are no poles (17), the integra-tion path is arbitrary. Otherwise, the phase unwrappingresult is dependent on the integration path. Most path-following methods attempt to handle this inconsistency byoptimizing the integration path: Goldstein’s branch cutalgorithm (6), for example, identifies the poles and con-nects them with branch cuts. The phase can then be un-wrapped along any path that does not cross the branchcuts according to the residue theorem. Buckland (10) useda minimum-cost-matching method to find the set of cutsthat minimizes the total cut length. Chavez et al. (5) de-veloped a method that detects “cutlines” and distin-guishes between noise-induced poles and signal under-sampling poles based on the length of the “fringelines.”Quality-guided algorithms rely on quality maps to guidethe integration path; they unwrap the high-quality pixelsfirst and avoid the low-quality pixels until the end of theintegration procedure. In MRI phase unwrapping, phasederivative variance is a useful quality map in practice, butin some cases classifies as “low quality” the areas that haverapidly changing phase, but high signal-to-noise ratio(SNR). Several hybrid quality maps are also available butthey suffer from similar problems (7).
Xu and Cumming (8) proposed a region-growing algo-rithm for interferometric synthetic aperture radar phaseunwrapping. This method uses the phase informationfrom unwrapped neighbor pixels to predict the correctphase of the new pixel to be unwrapped. A reliabilitycheck is also applied to make sure that the phase unwrap-ping follows a robust path. Based on this, Zhu et al. (9)presented a quality-guided fitting plane algorithm, whichuses phase derivative variance as a quality map. Planefitting in a 3 � 3 window also reduces computation timeand increases the reliability.
This work presents a phase unwrapping algorithmcalled UNwrapping using Region grOwing and Local Lin-ear estimation (UNROLL). This algorithm combines a re-gion-growing technique using pixel stacks, used for imagedomain phase correction (18,19), with the local plane fit-ting scheme mentioned above. The variance of the second-order partial derivatives of the phase, rather than the phase
1Beijing Key Lab of Medical Physics and Engineering, Peking University, P.R.China.2Department of Diagnostic Radiology, Medical Physics, University HospitalFreiburg, Germany.Grant sponsor: National Natural Science Foundation of China; Grant number:10527003.*Correspondence to: Shanglian Bao, Institute of Heavy Ion Physics, PekingUniversity, 100871, Beijing, P.R. China. E-mail: [email protected] 13 June 2008; revised 7 February 2009; accepted 9 April 2009.DOI 10.1002/mrm.22074Published online 1 July 2009 in Wiley InterScience (www.interscience.wiley.com).
Magnetic Resonance in Medicine 62:1085-1090 (2009)
© 2009 Wiley-Liss, Inc. 1085

derivative variance, is applied as a quality map. As followsfrom the results presented and discussed below, this qual-ity map is able to correctly classify the areas with a rapidlychanging phase, but a high SNR, as “high quality.” Whenthis is combined with the region-growing strategy usingpixel stacks, unwrapping can be done pixel-by-pixel andthe fitting plane can be extended to an n � n window,which is important to improve reliability in the presenceof strong noise.
MATERIALS AND METHODS
Quality Map
A quality map is an array of values that define the qualityparameter of each pixel of the given phase data. Note thatin this article quality maps indicate the badness ratherthan the goodness of the phase data. The quality mappresented here uses the variance of the second-order par-tial derivatives of the phase as the quality criteria, which isdefined as follows:
q�m,n� �����i,j
xx � �m,nxx �2 � ����i,j
yy � �m,nyy �2
k2 [1]
where for each sum the indexes (i,j) range over the k � k(k � 3 in this work) window centered at the pixel (m,n).The terms �xx
i,j and �yyi,j are the second-order partial de-
rivatives wrapped into the (��,�] interval and �xxm,n and
�yym,n are the averages of these partial derivatives in the k
� k windows. In high SNR areas the quality value is closeto zero, even when phase changes rapidly, while in lowSNR regions the quality value is larger. At the borderwhere phase discontinuities exist the quality value alsobecomes larger. Therefore, this quality criterion can detectlow SNR and discontinuity areas.
Linear Regression Prediction
The true phase of pixels can be considered a parametricsurface and over a small region (an mwin � mwinwindow),the phase values can be approximated by a fitted plane.Here we use the pixels within the window that have al-ready been unwrapped to fit the plane. Assuming thatthere are N pixels that have been unwrapped in the mwin �mwin small window centered at the current pixel, we cansolve the linear model:
unwrapped � Xunwrapped̂ � E [2]
using a least squares fit to return the estimated �̂, where�unwrapped, Xunwrapped, and � are the phases, coordinates,and residual errors of the N unwrapped pixels, respec-tively. As a result, the true phase of the current pixel canbe estimated using:
�est � Xcurrent pixel̂ [3]
Here Xcurrent pixel is the coordinate of the current pixel.Then the unwrapped phase of the current pixel is com-puted as:
�unwrapped � � � 2� � round ��est � �
2� � [4]
where � is the wrapped phase of the current pixel andround(x) is the integer closest to x.
Unwrapping Procedure
In the present work we use pixel stacks to optimize thegrowing path following Ma (18,19), who used this methodin his phase correction algorithm. The first step is to cal-culate the quality map of the image as described above.Then nstack pixel stacks are created and initialized to zero.The rationale for choosing a particular number of pixelstacks is discussed later. The quality value range is splitinto nstack steps: each step has a quality value range of(Qmax � Qmin)/nstack and corresponds to one pixel stack.Here, Qmax and Qmin are the maximum and minimum val-ues of the quality map, respectively. These pixel stacks arepopulated and depopulated during the region-growingstage and aid the determination of an optimal growth path.Additionally, two mask flags, Chk and Vst, are created andset to zero for each pixel of the image. To start regiongrowing, an initial seed is selected from a high-quality areaand placed onto the first pixel stack. Then we begin theregion growing by iterating through the following steps:
Step 1: A seed pixel is selected from the pixel stack thathas the lowest stack order and is not empty. When thepixel stack contains more than one pixel, the seed isselected on a first-in, first-out basis.Step 2: The four nearest neighbors of the seed pixel aresequentially “visited.” Any of the four neighbors thathave not been visited before are marked as visited bysetting their Vst flag. Additionally, each of these pixelsis placed on one of the nstack stacks, according to itsquality value. Pixels with smaller quality values will beplaced on a lower stack and pixels with greater qualityvalues will be placed on a higher stack.Step 3: The phase of the current seed pixel is unwrappedusing the linear regression prediction mentioned above.Then this pixel is marked as “checked” by setting itsChk flag. For the initial seed pixel the unwrapped phasesimply takes the wrapped phase. After the seed pixel ischecked a new seed is selected from the pixel stacks asin Step 1. This three-step process is repeated until all thepixel stacks are empty.
Implementation and Testing
The UNROLL method was implemented in MatLab (Math-Works, Natick, MA). Both simulated data and acquiredMRI data were used to test the algorithm. For comparison,the phase region expanding labeler for unwrapping dis-crete estimates (PRELUDE) algorithm (13) was also used tounwrap the same datasets. PRELUDE uses a region-merg-ing technique to optimize a cost function that penalizesphase differences across boundaries. Since it has beenwidely used and shown to be robust and fast, we havechosen it to compare with UNROLL. PRELUDE can oper-ate on n-dimensional datasets and here it was used in a 2Dmode. Masks were not applied to the data for either
1086 Zhou et al.
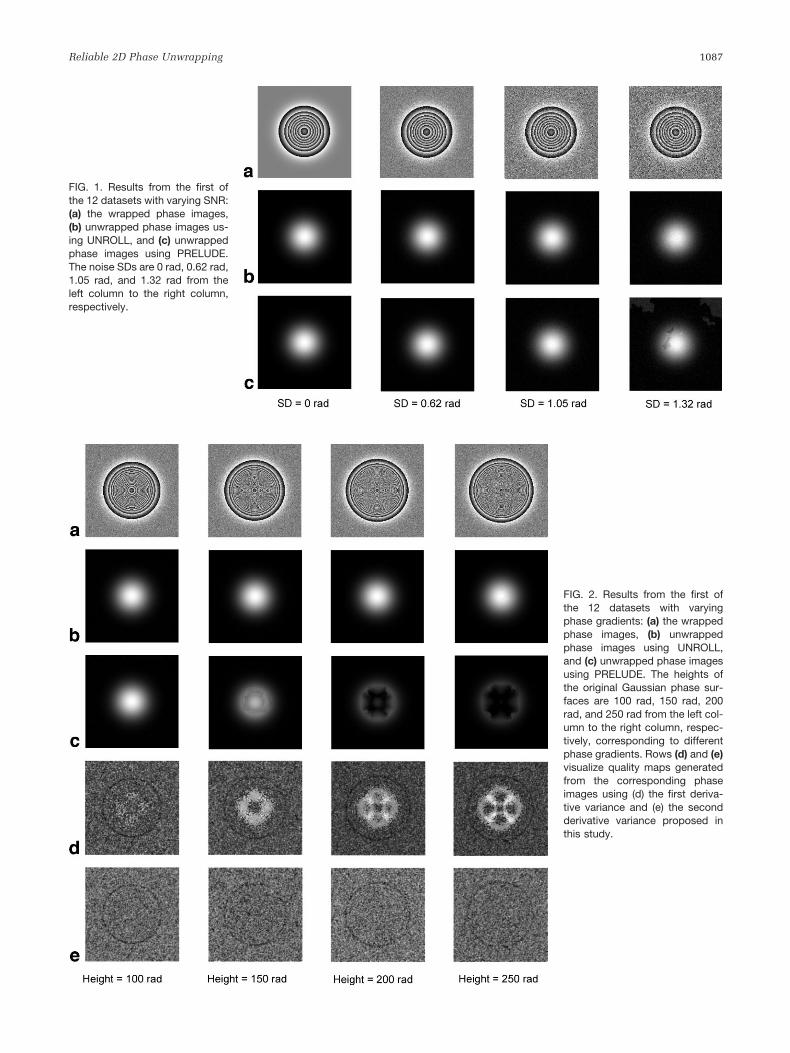
FIG. 1. Results from the first ofthe 12 datasets with varying SNR:(a) the wrapped phase images,(b) unwrapped phase images us-ing UNROLL, and (c) unwrappedphase images using PRELUDE.The noise SDs are 0 rad, 0.62 rad,1.05 rad, and 1.32 rad from theleft column to the right column,respectively.
FIG. 2. Results from the first ofthe 12 datasets with varyingphase gradients: (a) the wrappedphase images, (b) unwrappedphase images using UNROLL,and (c) unwrapped phase imagesusing PRELUDE. The heights ofthe original Gaussian phase sur-faces are 100 rad, 150 rad, 200rad, and 250 rad from the left col-umn to the right column, respec-tively, corresponding to differentphase gradients. Rows (d) and (e)visualize quality maps generatedfrom the corresponding phaseimages using (d) the first deriva-tive variance and (e) the secondderivative variance proposed inthis study.
Reliable 2D Phase Unwrapping 1087

method. The test was performed on a Linux PC with anIntel Pentium 4 1.6 GHz CPU.
The simulated datasets were Gaussian phase surfaces,which are usually used as a means of evaluating phaseunwrapping algorithms under controlled conditions(14,15). They were used to quantitatively compare UN-ROLL and PRELUDE.
To test the performance in the presence of noise, aGaussian phase surface (256 � 256) with height of 50 radand standard deviation (SD) of 30 pixels was generatedand then wrapped into the range of (��,�]. Gaussian noisewith SD varying from 0.62 rad to 1.52 rad was then addedto the wrapped phase, generating a set of images withdifferent SNR levels. The phase images without noise andwith noise SDs of 0.62 rad, 1.05 rad, and 1.32 rad areshown in the first row of Fig. 1.
To test the performance when an image contains rapidphase changes, Gaussian phase surfaces (256 � 256) withSDs of 30 pixels and heights from 100 rad to 250 rad weregenerated and then wrapped into the range of (��,�].Gaussian noise with an SD of 0.62 rad was then added tothe wrapped phases, generating a set of phase images withthe same noise level but with different phase gradients.These images are displayed in Fig. 2a. Note that in someregions of the Gaussian phase surfaces with heights of 200rad and 250 rad, phase differences between two adjacentpixels are larger than �.
For quantitative comparison, the misclassification ratio(MCR) was calculated and the computation time was re-corded for both of the two methods. MCR is the number ofpixels that were incorrectly unwrapped divided by thetotal number of pixels, as defined in Ref. (13).
MR data were acquired from the head of a healthy vol-unteer using a 3T Siemens Trio scanner (Siemens MedicalSolutions, Erlangen, Germany) and a gradient echo se-quence. Sequence parameters were TR � 100 ms, TE �25 ms, and a matrix size of 256 � 256. The magnitude andphase images are shown in Fig. 3a,b, respectively.
RESULTS
Twelve noisy sets of test data were generated and un-wrapped. Quantitative results are given in Table 1, andunwrapped phase images for the first dataset are shown inFig. 1b,c for UNROLL and PRELUDE, respectively. ForUNROLL, nstacks � 5 in this case. The window sizes forphase prediction were optimized for each SNR value andwere 7, 11, 15, 17, 19, 21, 21, and 21. Both methods gavesatisfactory results when the noise standard deviationswere not larger than 1.05 rad, while UNROLL gave a lowerMCR. When the noise SDs were 1.20 rad and 1.32 rad, themean MCR for the two methods was similar. UNROLLfailed for one of the 12 test sets when SD � 1.20 rad andSD � 1.32 rad and the MCR reached 27.43% and 39.60%,respectively. This is why the average MCR of the twomethods is similar but the SD of the MCR of UNROLL ishigher than that for PRELUDE. For even stronger noise, theMCR of UNROLL was higher than PRELUDE, but in factboth algorithms failed to deliver any usable results at SD �1.32 rad.
Table 2 gives a comparison of results obtained by un-wrapping the 12 datasets containing phase images with
different gradients; the unwrapped images from the firstdataset are also displayed in Fig. 2b,c. It is clear thatUNROLL has a lower MCR than PRELUDE when the phasechanges rapidly: unwrapping was accurate even when thephase difference between two adjacent pixels was largerthan � (the third and fourth columns). The properties ofthe quality map based on the second-order derivative vari-ance used to guide UNROLL are also visualized in Fig. 2eand compared to the commonly used first derivative vari-ance (Fig. 2d). UNROLL quality map treats areas of rapidlybut smoothly changing phase as high quality and is insen-sitive to “phase aliasing effects,” seen in Fig. 2e.
Figure 3c,d displays the results of unwrapping the phaseimage obtained by scanning the human subject. These twomethods gave the same result in most areas of the image.However, in the image produced by PRELUDE some phasewrapping is still visible in areas where the phase is chang-ing rapidly, while UNROLL gave a better result. The phaseunwrapping algorithm by Zhu et al. (9) was also imple-mented in MatLab and tested using the simulated and invivo data. The unwrapping result using this algorithm is
FIG. 3. In vivo results: (a) magnitude image, (b) wrapped phaseimage, (c) unwrapped phase image using UNROLL, (d) unwrappedphase image using PRELUDE, and (e) unwrapping result using thealgorithm of Zhu et al. (9). The image (e) demonstrates poor perfor-mance in the low SNR areas. Some residual wrapping exists in thePRELUDE result (panel (d), see arrows). Note that masks created bythresholding the magnitude image were not used to facilitate com-parison of the results of both methods over the entire image.
1088 Zhou et al.

shown in Fig. 3e. As seen, it provides satisfying results inhigh-SNR regions but fails when noise appears and errorspropagate to other regions. UNROLL shows a superiorperformance in low SNR regions as it uses a larger plane-fitting window.
DISCUSSION
A 2D phase unwrapping algorithm, called UNROLL, ispresented here. It can cope with relatively high levels ofnoise and is robust against regions containing rapid phasechanges.
The calculation time of PRELUDE depends on the SNR.This also applies to UNROLL: the SNR affects the choice ofthe window size that is used to predict the phase of thecurrent pixel and this window size affects calculationtime. At certain noise levels the UNROLL method is fasterthan PRELUDE. However, if the phase image is of highquality, PRELUDE is much faster than UNROLL (see thefirst column in Table 1).
Significant performance differences between PRELUDEand UNROLL appeared for images containing rapid phasechanges. This is because PRELUDE makes the assumptionthat the true phase difference between two adjacent pixelsis smaller than �. If this condition is not satisfied, PRE-LUDE will fail (see the third and fourth columns in Fig. 2and the arrows in Fig. 3). On the other hand, UNROLL isbased on local fitting, which for a smooth phase evolutioncan predict the true phase of the current pixel using thephase change trend of the unwrapped phase. Note that inthese cases the seed point of UNROLL should be selectedto lie in areas where phase changes reasonably slowly.
The selection of nstack (the number of pixel stacks) andmwin (the size of the window used for phase prediction) isnot automatic, which is a weakness of the present algo-rithm. For most cases, nstack � 5 is suitable, while the sizeof the window mwin used for phase prediction depends onthe SNR of the phase image. For high SNR phase images,using mwin � 7 produces satisfactory results, while for lowSNR cases larger windows are needed. As mentioned
above, the maximum window size used in this study was21. The assumption that the local phase can be representedas a plane is limited by both the window size of the linearfit and the smoothness of the data. Larger window size canimprove the unwrapping reliability, but it might not sat-isfy the plane assumption and so cause failure. This wasobserved upon increasing of the window size larger than11 when unwrapping Gaussian phase surfaces shown inFig. 2.
A significant difference between first-order and second-order phase derivative variance appears when phase gra-dient is high. As can be seen from Fig. 2d,e, high values areassigned to areas with high phase gradient, while actuallythe phase map has a uniform noise level. As shown in Fig.2e, the second-order phase derivative variance provides amore faithful quality criterion.
Compared to PRELUDE, a commonly used phase un-wrapping algorithm, the UNROLL method produces moreaccurate results and performs faster at certain noise levelsand in cases when phase changes rapidly. The main dis-advantage of the method is that it is not yet fully auto-mated, as parameters must be chosen manually. It is alsoslower than PRELUDE for low noise levels. ExtendingUNROLL to 3D is conceptually simple and a 3D, fast, andfully automatic implementation of this algorithm isplanned.
CONCLUSION
In this work, UNROLL, a quality-guided region-growingmethod for phase unwrapping is presented. The varianceof the second-order partial derivatives of the phase is usedto detect high-quality and low-quality areas. Linear regres-sion is applied to predict the true phase of the currentpixel. The use of these methods allows the unwrapping ofphase maps that are corrupted by noise and have rapidlychanging phase. Such phase maps were previously con-sidered to be difficult for phase unwrapping. UNROLLmay potentially be applied to phase images from echo-
Table 1Test Results in the Presence of Noise
Standard deviation ofphase noise (rad)
0 0.62 0.86 1.05 1.20 1.32 1.42 1.52
% MCR for UNROLL 0 0 0 0 0.04 0.01 0.34 0.02 3.87 7.59a 7.43 10.50b 22.51 16.49 39.38 21.31% MCR for PRELUDE 0 0 0 0 0.11 0.01 0.73 0.04 3.60 2.25 7.60 2.69 16.91 6.64 26.64 7.07Time for UNROLL (s) 74 1 112 6 155 15 191 27 218 31 238 28 240 24 233 30Time for PRELUDE (s) 2.4 0.2 200 4 345 4 425 6 483 8 528 8 554 10 575 5
a,bUnwrapping failed for only 1 out of 12 test images in these two noise levels, but the incorrectly unwrapped datasets deviated dramaticallyfrom the original.
Table 2Test Results Using Different Phase Gradients
Height of Gaussiansurface (rad)
100 150 200 250
% MCR for UNROLL 0 0 0 0 0.06 0.07 1.47 1.56% MCR for PRELUDE 0.36 1.23 7.13 0.31 11.31 0.17 14.23 0.14Time for UNROLL (s) 111 11 109 9 107 6 107 6Time for PRELUDE (s) 218 4 238 2 251 6 256 3
Reliable 2D Phase Unwrapping 1089

planar imaging, phase contrast MR angiography, and otherphase-sensitive methods in MRI.
ACKNOWLEDGMENT
The authors thank Dr. Julian Maclaren for help with thepreparation of the article.
REFERENCES
1. Jezzard P, Balaban RS. Correction for geometric distortion in echoplanar images from B0 field variations. Magn Reson Med 1995;34:65–73.
2. Cusack R, Papadakis N. New robust 3-D phase unwrapping algorithms:application to magnetic field mapping and undistorting echoplanarimages. Neuroimage 2002;16:754–764.
3. Nayler GL, Firmin DN, Longmore DB. Blood flow imaging by cinemagnetic resonance. J Comput Assist Tomogr 1986;10:715–722.
4. Szumowski J, Coshow WR, Li F, Quinn SF. Phase unwrapping in thethree-point Dixon method for fat-suppression MR-imaging. Radiology1994;192:555–561.
5. Chavez S, Xiang QS, An L. Understanding phase maps in MRI: a newcutline phase unwrapping method. IEEE Trans Med Imaging 2002;21:966–977.
6. Goldstein RM, Zebker HA, Werner CL. Satellite radar interferometry:two-dimensional phase unwrapping. Radio Sci 1988;23:713–720.
7. Ghiglia DC, Pritt MD. Two-dimensional phase unwrapping: theory,algorithms, and software. New York: John Wiley & Sons; 1998.
8. Xu W, Cumming I. A region-growing algorithm for InSAR phase un-wrapping. IEEE Trans Geosci Remote Sens 1999;37:124–134.
9. Zhu YJ, Liu L, Luan Z, Li A. A reliable phase unwrapping algorithmbased on the local fitting plane and quality map. J Optic Pure ApplOptic 2006;8:518–532.
10. Buckland JR. Unwrapping noisy phase maps by use of a minimum-cost-matching algorithm. Appl Optic 1995;34:5100–5108.
11. Song SMH, Napel S, Pelc NJ, Glover GH. Phase unwrapping of MRphase images using Poisson equation. IEEE Trans Image Process 1995;4:667–676.
12. Flynn TJ. Two-dimensional phase unwrapping with minimumweighted discontinuity. J Opt Soc Am Optic Image Sci Vis 1997;14:2692–2701.
13. Jenkinson M. Fast, automated, N-dimensional phase-unwrapping algo-rithm. Magn Reson Med 2003;49:193–197.
14. Bioucas-Dias JM, Valadao G. Phase unwrapping via graph cuts. IEEETrans Image Process 2007;16:698–709.
15. Nico G, Palubinskas G, Datcu M. Bayesian approaches to phaseunwrapping: theoretical study. IEEE Trans Signal Process 2000;48:2545–2556.
16. Liang ZP. A model-based method for phase unwrapping. IEEE TransMed Imaging 1996;15:893–897.
17. Huntley JM. Noise-immune phase unwrapping algorithm. Appl Optic1989;28:3268–3270.
18. Ma JF. Breath-hold water and fat imaging using a dual-echo two-pointDixon technique with an efficient and robust phase-correction algo-rithm. Magn Reson Med 2004;52:415–419.
19. Ma JF. Multislice and multicoil phase-sensitive inversion-recovery im-aging. Magn Reson Med 2005;53:904–910.
1090 Zhou et al.

![Four dimensional phase unwrapping of dynamic objects in ...omni/4D_Unwrapping_OEx2018.pdfcombined angular-spatial phase unwrapping algorithm [11]. Practically, we can use this previous](https://img.pdfslide.us/doc/110x75/6066139f9b8e370def1cbe20/four-dimensional-phase-unwrapping-of-dynamic-objects-in-omni4dunwrapping.jpg)