Embed Size (px)
Citation preview

The Growth Story of Indian Multinationals
ISB and VCC release the first ever ranking of Indian multinationals investing abroad
Hyderabad and New York, April 9, 2009
The Indian School of Business (ISB) and the Vale Columbia Center on Sustainable International Investment (VCC), a joint Columbia Law SchoolThe Earth Institute center at Columbia University in New York, are releasing the results of the first ever survey of outwardinvesting Indian multinational enterprises (MNEs) today. The survey is part of a longterm study of the rapid global expansion of MNEs in BRIC countries: Brazil, Russia, India and China. The results released today document the growth of Indian MNEs in particular. The Survey starts with 2006 data as a base period. Future surveys will cover the growth of Indian MNEs in 2007, the effects of the downturn in 2008, and subsequent developments in 2009 and thereafter.
The survey ranks Indian multinationals on the basis of their foreign assets (Table 1 below). The 24 selected MNEs held over USD 15 billion in foreign assets in 2006, with the Oil and Natural Gas Corporation (ONGC), which ranked first, accounting for just over USD 4.7 billion and the Tata Group following with nearly USD 4.2 billion. Together, these 24 companies had nearly USD 13 billion in foreign sales in 2006 and employed 60,000 workers abroad. India was the fifth largest outward investor among emerging markets in 2006, after the other three BRIC countries and Hong Kong (China). The focus of India’s overseas investment up to 2006 has been on oil and gas, pharmaceuticals, IT and metals.
“The emergence of multinational enterprises from developing countries is an inevitable byproduct of globalization,” says Ajit Rangnekar, Dean, ISB. “The longterm impact of such investments cannot be measured by taking snap shots of share prices during growth or recessionary times. We are delighted to collaborate with Columbia University on this study as the true story of growth unfolds only when progress is studied over a long period and is compared to MNEs in other countries.”
Adds Karl P. Sauvant, Executive Director of VCC: “Indian multinationals are new players in the world foreign direct investment market; together with their other BRIC counterparts, they are bound to transform it rapidly.”
Table 1 ranks 24 Indian multinationals − companies headquartered in India that have management control over at least one foreign affiliate in another country − by the size of their foreign assets. As not all candidate companies responded to the survey and

Page 2 of 19
reliable public information was not always available, the 24 listed below cannot be described as the largest outward investors from India. However, they are certainly among the largest.
Table 1. ISBVCC ranking of 24 selected Indian multinationals, 2006 (millions of USD) a
Rank Name Industry Foreign assets
1 Oil and Natural Gas Corporation (ONGC) Oil & gas operations 4,724
2 Tata Group of companies Conglomerate 4,169 3 Videocon Industries Limited Conglomerate 1,626 4 Ranbaxy Laboratories Limited Pharmaceuticals 1,077 5 Dr. Reddy’s Laboratories Limited Pharmaceuticals 869 6 HCL Technologies Limited IT services 777 7 Hindalco Industries Limited Aluminum manufacturer 581
8 Sun Pharmaceutical Industries Limited Pharmaceuticals 281
9 Reliance Industries Limited Oil & gas operations 250 10 Suzlon Energy Limited Power & energy 135 11 Larsen & Toubro (L&T) Limited Engineering & construction 130 12 Wipro Technologies IT services 128
13 Bharat Forge Limited Auto component solution provider ( forging) 106
14 Patni Computer Systems Limited IT services 81 15 Hexaware Technologies Limited IT services 69 16 Biocon Limited Pharmaceuticals 50 17 iGate Global Solutions Limited IT services 49 18 Max India Limited Conglomerate 37 19 Mahindra & Mahindra Limited Automobile manufacturer 35 20 NIIT Limited IT services 31 21 Piramal Healthcare limited Pharmaceuticals 26 22 Birlasoft (India) Limited IT services 21 23 Raymond Limited Fabric manufacturer 18 24 Infosys Technologies Limited IT services 9 Total 15,279
Source: Indian School of BusinessVale Columbia Center ranking of Indian multinationals.
a The original list included Satyam Computer Services Limited, indicating foreign assets worth USD 522 mn. However, due to a lack of certainty about the accuracy of the 2006 data, it has now been omitted.
The principal findings of the survey include the following:

Page 3 of 19
India’s 24 selected 1 MNEs – ranked by foreign assets in 2006 – had USD 15.3 billion (bn) 2 in assets abroad (Table 1), had nearly USD 13 bn in foreign sales and employed 60,000 persons abroad (Table 2). Foreign assets, sales and employment had increased by 122%, 65% and 43% respectively between 2005 and 2006 (Table 2). The largest concentration of foreign affiliates was in Europe (165 affiliates), representing 37% of all foreign affiliates. The Oil and Natural Gas Corporation (ONGC) contributed 31% of the total foreign assets of the selected 24, while The Tata Group – which includes Tata Steel, Tata Chemicals, Tata Consultancy Services (IT), Tata Motors and Tata Communications (telecoms), among other companies − contributed another 27%. Note that, as a percentage of the USD 30 billion in foreign stock held by Indian enterprises in 2006 – see Annex table 7 − the foreign assets of these 24 companies are about 50%.
It remains to be seen what impact the current crisis will have on Indian multinationals. Indian firms in a good financial position may take advantage of the low asset prices in world markets and make strategic acquisitions 3 . Other firms may need to put their foreign expansion on hold or even sell off foreign assets to support their balance sheets. Future surveys will reveal the impact of the crisis.
Profile of the 24
• Foreign assets exploded by 122% in 2006. The primary drivers of this rapid accumulation of foreign assets included the search for strategic and complementary locational assets in metals, oil and gas, and other raw materials, and the desire to diversify globally.
• Indian multinationals lagged behind their foreign counterparts. Only ONGC and the Tata Group of companies had over USD 2 bn in foreign assets, and only the Tata Group employed a significant number of people (over 24,600) abroad (annex table 1).
• Indian multinationals increased their foreign sales by 65%, to approximately USD 13 bn, from 2005 to 2006, and foreign employment by 43%, from 42,000 to 60,000 people (Table 2).
• Foreign assets and sales as a percentage of the total assets and sales of these companies were about 21% and 18% respectively, whereas foreign employment represented 13% of total employment (Table 2).
• Growth in foreign assets, employment and sales from 2005 to 2006 fueled the increase in total assets, employment and sales of the 24. The USD 8.4 bn rise in foreign assets represented 53% of the USD 15.9 bn increase in total assets, and the USD 5 bn increase in foreign sales accounted for 35% of the USD 14.4 bn increase in total sales (Table 2).
1 The Indian School of Business conducted several rounds of surveys with the largest Indian MNEs. In addition, extensive research was done from publicly available data to determine the level of foreign assets. The companies in this list are those that responded to the surveys or for which reliable public data could be found. As a result, some MNEs which own substantial foreign assets may not appear on the list.
2 The following Rupee/US Dollar exchange rates, based on the rates of the International Monetary Fund (http://www.imf.org), were used throughout: 44.23 (2006); 45.07 (2005); 43.58 (2004).
3 For an analysis of the impact of the crisis on FDI flows, see Karl P. Sauvant, "The FDI Recession has Begun", at www.vcc.columbia.edu.
Page 4 of 19
• The 24 selected companies had 441 foreign affiliates in 75 countries. The Tata Group of Companies was present in 44 foreign countries, with 157 foreign affiliates, followed by Ranbaxy Pharmaceutical Limited, 31 countries and 47 foreign affiliates, and HCL Technologies Limited, 17 countries and 31 foreign affiliates (annex table 1).
• These 441 foreign affiliates were concentrated in Europe (37%), Asia (21%) and North America (19%), as indicated by the Regionality Index (annex table 2) and as seen in the distribution of foreign affiliates (annex figure 1). However, since 2006, they have been moving rapidly to markets in Africa, the Middle East, Australia and Latin America.
• The geographic distribution of foreign affiliates of the 24 Indian MNEs varied from sector to sector. For example, while Europe had the largest concentration of foreign affiliates in the power and energy sector, it had the smallest concentration in engineering and construction. The Middle East, on the other hand, had the largest concentration of foreign affiliates in the engineering and construction sector but had no foreign affiliates in the power and energy sector (annex figure 2). This diversity in the distribution of foreign affiliates was the result of the various drivers that influence outward FDI (annex figure3).
• Most of the investment from India in 2006 was being made by publicly listed companies. The only company in the list of 24 that was not publicly listed was Birlasoft, a private limited company with USD 0.02bn in foreign assets. Of the rest, one was a statecontrolled company with just over USD 4.7bn in foreign assets − ONGC, in which the Indian government holds a 74.14% equity stake. The remaining 22 together accounted for just over USD 10.5 bn in foreign assets.
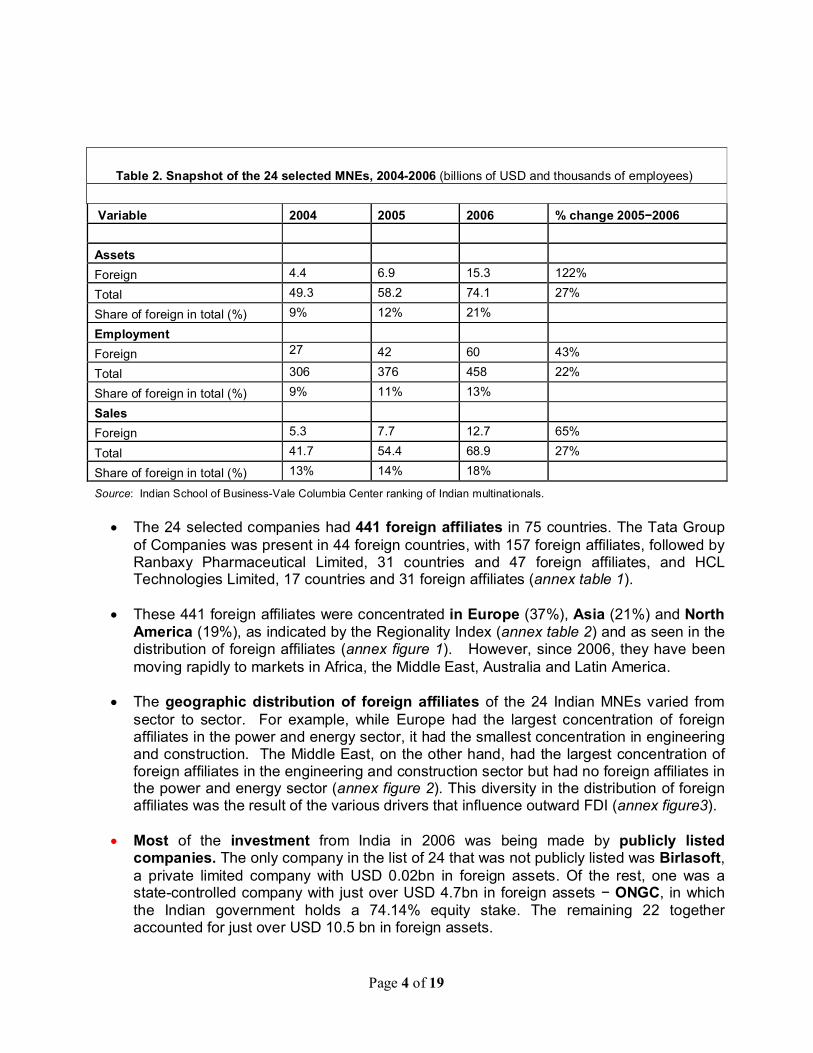
Table 2. Snapshot of the 24 selected MNEs, 20042006 (billions of USD and thousands of employees)
Variable 2004 2005 2006 % change 2005−2006
Assets Foreign 4.4 6.9 15.3 122%
Total 49.3 58.2 74.1 27%
Share of foreign in total (%) 9% 12% 21%
Employment Foreign 27 42 60 43%
Total 306 376 458 22%
Share of foreign in total (%) 9% 11% 13%
Sales Foreign 5.3 7.7 12.7 65%
Total 41.7 54.4 68.9 27%
Share of foreign in total (%) 13% 14% 18%
Source: Indian School of BusinessVale Columbia Center ranking of Indian multinationals.

Page 5 of 19
• The companies on the list were to be found in eight different industries – or nine, if conglomerates are counted as one. Judged by foreign assets, conglomerates dominate, with 37% of the aggregate assets. The oil & gas industry comes next, with 33% of the list’s assets, while pharmaceuticals are a somewhat distant third, with 15% (annex figure 4). Judged by numbers of companies, IT is the leading industry on the list, with eight companies, followed by pharmaceuticals with five, and then oil & gas and autos/auto parts with two each. Also represented are metals, power and energy, engineering and construction, and textiles. Given the number of IT companies on the list, it is of some interest to note that the conglomerate Tata Group includes Tata Consultancy Services (TCS), India’s leading IT firm (2008 revenue USD 5.7 billion), along with companies in steel, autos, power and telecoms among others. The other large conglomerate on the list, Videocon, has businesses in electronics, home appliances, petroleum and power.
• Ten of the 24 selected MNEs were, and continue to be, headquartered in Mumbai; four in Bangalore; and the rest in Aurangabad, Dehradun, Pune, Gurgaon, Noida and New Delhi (annex figure 5).
• Two of the 24 selected companies were listed on the London Stock Exchange, eight on the Luxembourg Stock Exchange, four on the New York Stock Exchange and the Singapore Stock Exchange. 23 out of 24 companies were also listed on an Indian Stock Exchange. One company, Birlasoft, was not listed anywhere.
• The official language of 23 of the 24 selected companies is English; the official language of ONGC is Hindi.
The Big Picture
Indian firms have been investing abroad for many years, but it is only since the late 1990s that OFDI flows have risen rapidly, albeit from low levels (annex figure 6). Outflows were predicted to stay above USD 16 bn over 2008 – 2011, but given the worldwide economic difficulties expected in 2009 and beyond, this figure now appears optimistic 4 .
As a result of the growth of outflows, the stock of outward FDI rose from about USD 0.1 bn in 1990 to about USD 2 bn in 2000, and then to USD 13 bn in 2006 (annex figure 7), taking India to 5th place among outwardinvesting emerging markets. Only Hong Kong (China), China, Brazil, and Russia had higher outflows in the year 2006. As evidenced by the high level of 2007 merger and acquisition (M&A) activity (annex table 3), Indian MNEs are taking increasing advantage of this mode of market entry. In fact, 20062007 saw a phenomenal rise in outward M&As, surging from USD 3.7 bn in 2006 to USD 24.7 bn in 2007, with the Tata Group alone accounting for USD 15.2 bn (200507) and Hindalco another USD 5.8 bn. Virtually all acquisitions were made in cash. As a result of their investment activity, four companies Essar Group, United Breweries Limited, JSW Steel Limited and Hindustan Petroleum Corporation Limited (HPCL) − are likely candidates to join the ranks of the top Indian outward investors. Also, several stateowned companies like Krishak Bharati CoOp and privately owned companies like United Phosphorus, Zee Telefilms Ltd., TransWorks Information Services, Essel Propack, Punj Lloyd, and Reliance Infocomm are most likely to have had, in 2006, foreign assets comparable to those of the 24 selected MNEs. However, due to a lack of information, they could not included in the present ranking. __________________________________________________________________________\

Page 6 of 19
4 Laza Kekic and Karl P. Sauvant, eds., World Investment Prospects to 2011: Foreign Direct Investment and the Challenge of Political Risk, at www.vcc.columbia.edu. Inputs from Jaya Prakash Pradhan, author of Outward Foreign Direct Investments from India: Recent Trends and Patterns (2005), are acknowledged.
Greenfield investment (annex table 4) also surged between 2006 and 2007. With USD 13.2 bn in projects being announced in 2007, and outward foreign direct investment in 2007/2008 booming, the size of foreign assets owned by India’s top MNEs could double 5 .

Page 7 of 19
5 The Reserve Bank of India recently announced that total outward foreign direct investment from Indian companies in the 2007/2008 fiscal year was USD 17.4 bn, a 29.6% increase from the USD 13.5 bn in the 2006/2007 fiscal year.

Page 8 of 19
For further information please contact:
Indian School of Business, Hyderabad
Rupa Panda Researcher, Indian School of Business [email protected] Ph: 919900604800
Mudit Kapoor Indian School of Business [email protected] Ph: 914023187130 Gachibowli, Hyderabad Andhra Pradesh500032 www.isb.edu
Vale Columbia Center on Sustainable International Investment
Karl P. Sauvant, Executive Director 16467245600 [email protected]
Vishwas P. Govitrikar, Research Director 12128547269 [email protected]
Emerging Markets Global Players Project
The ISBVCC ranking of Indian multinational enterprises was conducted in the framework of the Emerging Market Global Players Project, a collaborative effort led by the Vale Columbia Center on Sustainable International Investment. It brings together researchers on FDI from leading institutions in emerging markets to generate annual ranking lists of emerging market MNEs. Ranking lists for Brazil, Russia, Slovenia, Israel and China have already been released. Visit www.vcc.columbia.edu for further information, or contact [email protected].
Five Diamond Conference Series
Given the importance of the international expansion of companies from the BRIC countries, the Indian School of Business, together with Vale Columbia Center on Sustainable International Investment, Fudan University, Fundação Dom Cabral, and the SKOLKOVO Moscow School of Management, will organize a series of conferences to explore further that phenomenon. The next Five Diamond conference will take place in Nova Lima, Brazil, August 1819, 2009. For more information, please contact [email protected].
Indian School of Business (ISB)
The Indian School of Business (ISB), located in Hyderabad, Andhra Pradesh, India, is an international business School providing postgraduate programs (MBA) in management, post doctoral programs as well as executive education programs for business executives. It has a formal affiliation with three of the worlds leading business schools: Kellogg School of Management, The Wharton School and London Business School. The school is ranked 15th worldwide by FT rankings. For more information, see www.isb.edu
Vale Columbia Center on Sustainable International Investment
The Vale Columbia Center on Sustainable International Investment (VCC), headed by Dr. Karl P. Sauvant, is a joint undertaking of the Columbia Law School and The Earth Institute at Columbia University. It seeks to be a leader on issues related to FDI in the global economy, paying special attention to the sustainability dimension of this investment, VCC focuses on the analysis and teaching of the implications of FDI for public policy and international investment law. Its objectives are to analyze important, topical and policyoriented issues related to FDI, develop and disseminate practical approaches and solutions, and provide students with a challenging learning environment. For more information, see www.vcc.columbia.edu.

Page 9 of 19
Annex table 1. ISBVCC ranking of the 24 selected Indian multinationals, key variables, 2006 (millions of USD and number of employees) a
Ranking Assets f Sales f Employment
By foreign assets
By multi nation ality index b
Name Industry Foreign Total Foreign Total Foreign Total Multi nationality Index (%)
No. of foreign affiliates
No.of host countries
1 14 Oil and Natural Gas Corporation Oil & gas operations 4,724 21,031 1,645 17,115 NA 34,722 16% 4 3 2 9 Tata Group of companies c Conglomerate 4,169 8,199 3,576 9,752 24,682 118,416 32% 157 44 3 2 Videocon Industries Limited Conglomerate 1,626 2,297 966 1,632 NA 10,000 65% 16 11 4 1 Ranbaxy Laboratories Limited d Pharmaceuticals 1,077 1,566 859 918 NA 11,343 81% 47 31 5 5 Dr. Reddy’s Laboratories Limited Pharmaceuticals 869 1,390 362 549 2,000 7,525 52% 27 14 6 3 HCL Technologies Limited IT services 777 926 780 1,034 4,032 32,626 57% 31 17 7 16 Hindalco Industries Limited Aluminum manufacturer 581 4,272 147 2,577 NA 19,593 10% 5 1 8 10 Sun Pharmaceuticals Industries Pharmaceuticals 281 815 157 393 1,100 5,000 32% 11 9 9 24 Reliance Industries Limited e Oil & gas operations 250 21,901 414 20,560 22 12,540 1% 3 3 10 19 Suzlon Energy Power & energy 135 918 70 868 227 5,300 9% 14 7 11 21 Larsen & Toubro Limited Engg. & construction 130 3718 143 3,800 NA 22,175 4% 17 13 12 8 Wipro Technologies IT services 128 1,465 1,906 2,399 10,005 55,000 35% 14 8 13 7 Bharat Forge Limited Auto component solns. 106 570 473 682 1,650 5,650 39% 10 6 14 6 Patni Computer Systems Limited IT services 81 639 587 590 2,795 12,804 45% 5 3 15 4 Hexaware Technologies Limited IT services 69 145 184 192 1,056 5,829 54% 10 7 16 17 Biocon Limited Pharmaceuticals 50 291 23 178 2 2,542 10% 1 1 17 12 iGate Global Solutions Limited IT services 49 91 12 144 837 5,152 26% 7 6 18 23 Max India Limited Conglomerate 37 485 7 348 27 4,127 3% 5 4
19 22 Mahindra & Mahindra Limited Automobile manufacturer 35 883 74 2,061 NA 12,089 4% 26 11
20 13 NIIT Limited IT services 31 115 40 102 183 2,259 25% 9 8 21 15 Piramal Healthcare Limited Pharmaceuticals 26 319 77 358 341 6,931 12% 4 4 22 11 Birlasoft (India) Limited IT services 21 48 NA 133 582 3,248 31% 8 6 23 20 Raymond Limited Fabric manufacturer 18 457 24 318 NA 10,324 6% 6 6 24 18 Infosys Technologies Limited IT services 9 1,590 197 2,153 10,543 52,715 10% 4 4
TOTAL 15,279 74,131 12,723 68,856 60,084 457,910 441
Source: Indian School of BusinessVale Columbia Center survey of Indian multinationals. a As noted earlier, the original list included Satyam Computer Services Limited, indicating foreign assets worth USD 522mn. However, due to a lack of certainty about the accuracy of 2006 data, it has now been omitted. b The multinationality index is calculated as the average of the following three ratios: foreign assets to total assets, foreign sales to total sales, and foreign employment to total employment. c The Tata Group of companies is a conglomerate comprising Tata Steel, Tata Chemicals, Tata Consultancy Services, Titan Industries and Tata Communications, among others. d Ranbaxy acquired Terapia, a generic company in Romania, in June 2006, for USD 324 million. The company aims to make Romania its manufacturing hub in Europe. Daiichi Sankyo, a Japanese pharmaceutical company, in turn acquired a majority stake in Ranbaxy in 2008. e Reliance Industries Limited operates in oil & gas as well as textiles and retail trade. f INR/USD exchange rate: 44.23; USD/AUD exchange rate: 0.7913

Page 10 of 19
Annex table 2. The 24 selected Indian MNEs: Regionality Index, a 2006
Companies Europe Middle East Africa North
America Latin America Asia Australia
ONGC Limited 25 50 25 Tata Group of companies 36 1 6 12 11 28 6 Videocon Industries Limited 25 6 6 6 38 19 Ranbaxy Pharmaceuticals Limited 43 9 15 13 19 2 Dr. Reddy’s Laboratories Limited 52 4 22 15 7 HCL Technologies Limited 29 6 39 16 10 Hindalco Industries Limited 100 Sun Pharmaceuticals Industries Limited 27 18 45 9 Reliance Industries Limited 67 33 Suzlon Energy Limited 64 21 7 7 Larsen & Toubro Limited 6 35 18 12 29 Wipro Technologies 43 7 36 14 Bharat Forge Limited 70 10 20 Patni Computer Systems Limited 60 40 Hexaware Technologies Limited 40 40 10 10 Biocon Limited 100 iGate Global Solutions Limited 29 43 29 Max India Limited 60 20 20 Mahindra & Mahindra Limited 38 4 12 23 4 19 NIIT Limited 11 11 11 11 56 Piramal Healthcare Limited 25 50 25 Birlasoft ( India) Limited 38 38 12 12 Raymond Limited 67 17 17 Infosys Technologies Limited 25 25 25 25
Source: Indian School of BusinessVale Columbia Center survey of Indian multinationals.
a The Regionality Index is calculated by dividing the number of a firm’s foreign affiliates in a particular region of the world by its total number of foreign affiliates and multiplying the result by 100.

Page 11 of 19
Annex table 3. Top Indian outward merger and acquisition (M&A) transactions, 20052007
Rank Date Acquiror name Target name Target Industry Target Country
Deal Value (USD million)
% of shares acquired
1 04/02/2007 Tata Steel Limited Corus Group PLC Metals & mining United Kingdom 12,695 100 2 05/15/2007 Hindalco Industries Limited Novelis Inc. Metals & mining United States 5,766 100 3 06/20/2007 Essar Global Limited Algoma Steel Inc. Metals & mining Canada 1,467 100 4 06/272007 Tata Power Co Limited Kaltim Prima Coal PT Metals & mining Indonesia 1,300 30 5 05/16/2007 United Breweries Limited Whyte & Mackay Limited Food and beverage United Kingdom 1,176 100 6 08/22/2007 JSW Steel Limited Jindal United Steel Corp Metals & mining United States 940 90
7 09/21/2006 Mansarovar Energy Columbia Limited a
Omimex de Colombia Limited Oil & gas Colombia 850 100
8 09/13/2006 Videocon Industries Limited Daewoo Electonics Corp. Electronics Republic of Korea 729 97.50
9 09/24/2006 Tata Tea Limited Energy Brands Inc Food and beverage United States 677 30
10 09/18/2007 Wipro Technologies Infocrossing Inc Computers & peripherals United States 673 100
11 03/28/2007 Aban Offshore Limited Sinvest ASA Financials Norway 658 50 12 02/17/2006 Dr. Reddy's Labs Betapharm Pharmaceuticals Germany 597 100 13 03/17/2006 Suzlon Energy Hansen Group Energy Belgium 565 NA
14 07/26/2005 HPCL Kenya Petroleum Refinery Limited Oil & gas Kenya 500 NA
15 03/29/2006 Ranbaxy labs Terapia SA Pharmaceuticals Romania 324 96.70 16 02/17/2005 Tata Steel Natsteel Steel Singapore 293 NA 17 06/29/2005 Videocon Thomson SA Electronics France 290 100
18 07/26/2005 VSNL (Now Tata Communications) Teleglobe Electronics Canada 239 50.1
Source: Combined data from Thomson One Banker and ibef.org.
a Mansarovar Energy Columbia Limited is a 50:50 joint venture between ONGC Videsh Limited and Sinopec, China.

Page 12 of 19
Annex table 4. Top 10 Indian outward greenfield investments, 20062007 (billions of USD)
Date Company name Destination country Sector Value
Jul06 ONGC a Nigeria Coal, oil and natural gas 6.0
Nov07 GAIL (India) b Saudi Arabia Petrochemicals 4.2
Dec06 National Aluminium Company (NALCO) b Indonesia Metals 3.0
Jun06 Jindal Steel and Power Bolivia Metals 2.3
Jan07 Essar Group Iran Coal, oil and natural gas 2.0
May07 Videocon Industries Poland Consumer electronics 1.7
Oct07 Ispat Industries Philippines Metals 1.6
Feb07 Videocon Industries Italy Consumer electronics 1.6
Jun07 Ispat Industries Serbia & Montenegro
Coal, oil and natural gas 1.1
Aug07 Reliance Industries Egypt Petrochemicals 1.0
Source: fDi Intelligence, from the Financial Times Limited. Note: NALCO and Jindal Steel and Power had no foreign affiliates as reported in their Annual Report of 2006 (March 2006). Hence, they are not a part of the ranking list.
a ONGC reported this investment in June 2006. It is, however, not included in the foreign assets shown for ONGC in this report, as there was a lack of clarity about the exact value of ONGC’s actual investment in 2006.
b GAIL, formerly Gas Authority of India Ltd, and NALCO are both stateowned enterprises, as of course is ONGC.

Page 13 of 19
Annex figure 1. Foreign affiliates of the 24 selected Indian multinationals, by region, 2006 (number of affiliates)
Source: Indian School of BusinessVale Columbia Center survey of Indian multinationals.

Page 14 of 19
Annex figure 2. The geographic distribution of Indian foreign affiliates, by sector, 2006 (Percentage of foreign affiliates)
Healthcare and Pharmaceuticals
42.2
5.6 18.9
17.8
14.4 1.1 Europe Africa North America Latin America Asia Australia
IT Services
33.0
4.5 35.2
2.3
19.3
5.7 Europe Africa North America Latin America Asia Australia
Conglomerate
36.0
1.7 5.6 11.8
13.5
26.4
5.1 Europe Middle East Africa North America Latin America Asia Australia
Manufacturing
44.7
2.1 6.4 17.0
2.1
17.0
10.6 Europe Middle East Africa North America Latin America Asia Australia
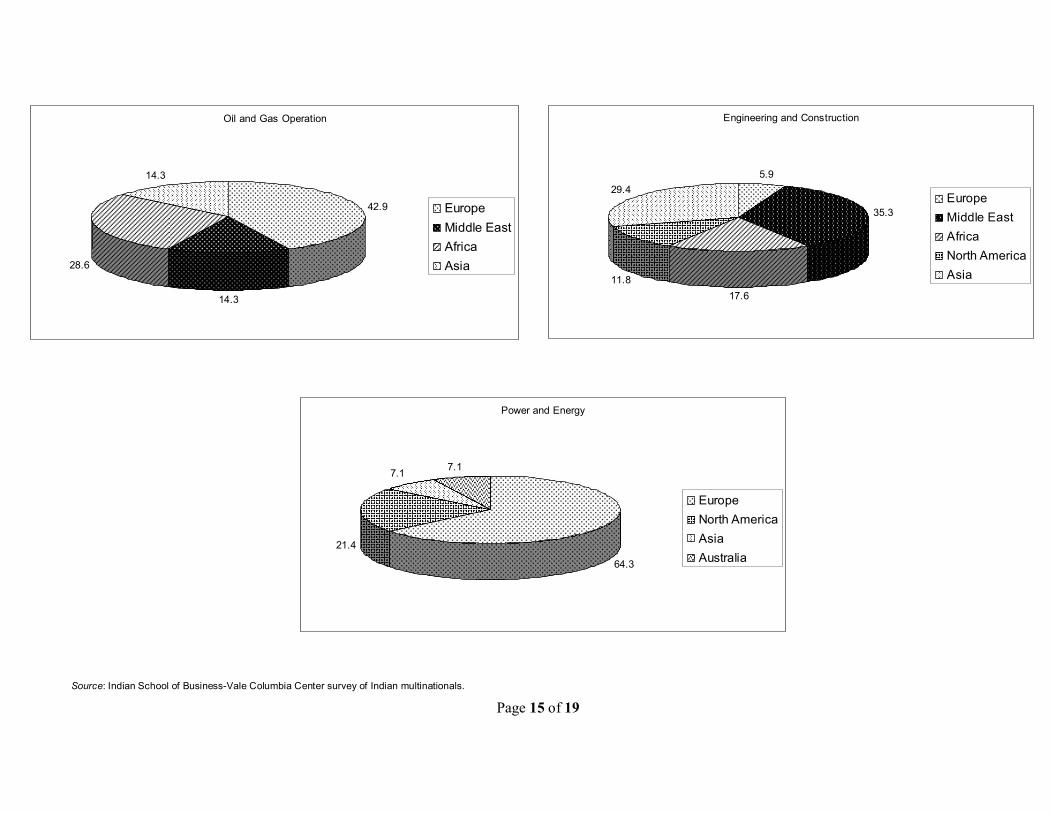
Page 15 of 19 Source: Indian School of BusinessVale Columbia Center survey of Indian multinationals.
Oil and Gas Operation
42.9
14.3
28.6
14.3
Europe Middle East Africa Asia
Engineering and Construction
5.9
35.3
17.6 11.8
29.4 Europe Middle East Africa North America Asia
Power and Energy
64.3
21.4
7.1 7.1
Europe North America Asia Australia

Page 16 of 19
Annex figure 3. The drivers of Indian outward FDI
Market seeking: Investment that aims at either penetrating new markets or maintaining existing ones.
Resource seeking: Investment that seeks to acquire factors of production, mainly in natural resources.
Efficiency seeking: Investment that firms expect will increase their efficiency by, for example, giving them access to cheap labor or exploiting the benefit of economies of scale and scope, and also those of common ownership.
Asset seeking: Investments made to augment or protect existing firmspecific advantages, such as knowledge and skills, trademarks or R&D facilities.
Source: Indian School of BusinessVale Columbia Center ranking of Indian multinationals.

Page 17 of 19
Annex figure 4. Breakdown of the foreign assets of the 24 selected Indian multinationals, by industry, 2006
Industry Foreign assets USD mn Companies Conglomerates 5,832 (3) Tata Group Of Companies, Videocon Industries Limited, Max India Limited Oil & gas operations 4,974 (2) ONGC Limited, Reliance Industries Limited
Pharmaceuticals & healthcare 2,303 (5) Ranbaxy Pharmaceuticals Limited, Dr. Reddy's Laboratories, Sun Pharmaceutical Industries Limited, Piramal Healthcare Limited, Biocon Limited
IT services 1,165
(8) Wipro Technologies, Patni Computer Systems, Hexaware Technologies Limited, i Gate Global Solutions Limited, NIIT Limited, Birlasoft Limited, Infosys Technologies Limited, HCL Technologies Limited
Manufacturing 740 (4) Hindalco Industries Limited, Bharat Forge Limited, Mahindra & Mahindra Limited, Raymond Limited
Power & energy 135 (1) Suzlon Energy Limited Engineering & construction 130 (1) Larsen & Toubro Limited
Source: Indian School of BusinessVale Columbia Center survey of Indian multinationals.
Conglomerate 37%
Oil & Gas Operations 33%
Healthcare 15%
IT Services 8%
Manufacturing 5%
Engineering & Construction 1%
Power & Energy 1%

Page 18 of 19
Annex figure 5. Head office locations of the 24 selected Indian multinationals, 2006
Source: Indian School of BusinessVale Columbia Center survey of Indian multinationals
7 3
8
1
5
2
1
2
Max India
4
5 6
7
8
Biocon iGate Global Solutions
4
1.Mumbai – Tata Group, Sun Pharmaceuticals, Reliance, Patni, Hexaware, Piramal Healthcare, Mahindra and Mahindra, Raymond, Hindalco, Larsen & Toubro
2.Bangalore – Biocon. iGate, Infosys, Wipro
Pune
Dehradun
5
4
4
Aurangabad
9
3.New Delhi – Max India
4.Dehradun – Oil and Natural Gas Corporation
5.Hyderabad – Dr. Reddy’s Laboratories
6.Pune – Bharat Forge, Suzlon Energy
8.Noida – Birlasoft, HCL Technologies
9.Auranagabad– Videocon Industries
7.Guragaon– Ranbaxy, NIIT Limited

Page 19 of 19
Annex figure 6. FDI inflows to and outflows from India, 19802007 (millions of USD)
Source: UNCTAD, World Investment Report, 2007, p. 253, for figures for 2004; and World Investment Report, 2008, p. 255, for figures for 2005, 2006 & 2007.
Annex figure 7. Stock of inward and outward FDI, 19802007 (millions of USD)
Source: UNCTAD, World Investment Report, 2008, p. 259.
FDI: Inward & Outward flows
0
5000
10000
15000
20000
25000
1980 1990 2000 2001 2002 2003 2004 2005 2006 2007
Year
FDI F
lows (in
$mn)
Inward flows (in $mn) Outward flows (in $mn)
FDI stock (in $mn)
0 10000 20000 30000 40000 50000 60000 70000 80000 90000
1980 1990 2000 2006 2007
Year
FDI s
tock in
$mn
FDI inward stock FDI outward stock