Embed Size (px)
Citation preview

IEEE TRANSACTIONS ON SOFTWARE ENGINEERING 1
Reliable Effects Screening:A Distributed Continuous Quality Assurance Process for Monitoring Performance
Degradation in Evolving Software Systems
Cemal Yilmaz�, Adam Porter
�, Arvind S. Krishna
�, Atif Memon
�, Douglas C. Schmidt
�, Aniruddha Gokhale
�,
Balachandran Natarajan�
�IBM T. J. Watson Research Center, Hawthorne, NY, 10532�
Dept. of Computer Science, University of Maryland, College Park, MD 20742�Dept. of Electrical Engineering and Computer Science, Vanderbilt University, Nashville, TN 37235
Abstract— Developers of highly configurable performance-intensive software systems often use in-house performance-o-riented “regression testing” to ensure that their modificationsdo not adversely affect their software’s performance acrossits large configuration space. Unfortunately, time and resourceconstraints can limit in-house testing to a relatively small numberof possible configurations, followed by unreliable extrapolationfrom these results to the entire configuration space. As a result,many performance bottlenecks escape detection until systems arefielded.
In our earlier work, we improved the situation outlined aboveby developing an initial quality assurance process called “maineffects screening”. This process (1) executes formally designedexperiments to identify an appropriate subset of configurationson which to base the performance-oriented regression testing,(2) executes benchmarks on this subset whenever the softwarechanges, and (3) provides tool support for executing these actionson in-the-field and in-house computing resources. Our initialprocess had several limitations, however, since it was manuallyconfigured (which was tedious and error-prone) and relied onstrong and untested assumptions for its accuracy (which madeits use unacceptably risky in practice).
This paper presents a new quality assurance process called“reliable effects screening” that provides three significant im-provements to our earlier work. First, it allows developers toeconomically verify key assumptions during process execution.Second, it integrates several model-driven engineering tools tomake process configuration and execution much easier and lesserror prone. Third, we evaluate this process via several feasi-bility studies of three large, widely-used performance-intensivesoftware frameworks. Our results indicate that reliable effectsscreening can detect performance degradation in large-scalesystems more reliably and with significantly less resources thanconventional techniques.
Index Terms— Distributed continuous quality assurance,performance-oriented regression testing, design-of-experimentstheory
I. INTRODUCTION
The quality of service (QoS) of many performance-intensivesystems, such as scientific computing systems and distributedreal-time and embedded (DRE) systems, depend heavily onvarious environmental factors. Example dependencies includethe specific hardware and operating system on which sys-tems run, installed versions of middleware and system li-brary implementations, available language processing tools,specific software features that are enabled/disabled for a givencustomer, and dynamic workload characteristics. Many of
these dependencies are not known until deployment and somechange frequently during a system’s lifetime.
To accommodate these dependencies, users often need totune infrastructure and software applications by (re)adjustingmany (i.e., dozens to hundreds) of compile- and run-timeconfiguration options that record and control variable softwareparameters. These options are exposed at multiple systemlayers, including compiler flags and operating system, middle-ware, and application feature sets and run-time optimizationsettings. For example, there are � 50 configuration options forSQL Server 7.0, � 200 initialization parameters for Oracle 9,and � 90 core configuration options for Apache HTTP ServerVersion 1.3.
Although designing performance-intensive systems to in-clude such configuration options promotes code reuse, en-hances portability, and helps end users improve their QoS,it also yields an enormous family of “instantiated” systems,each of which might behave differently and thus may needquality assurance (QA). The size of these system familiescreates serious and often under-appreciated challenges forsoftware developers, who must ensure that their decisions,additions, and modifications work across this large (and oftendynamically changing) space. For example, consider that:� Option settings that maximize performance for a par-
ticular environment may be ill-suited for different ones.Failures can and do manifest in some configurations, butnot in others. Similarly, individual code changes can havedifferent runtime effects in different configurations.� Individual developers, especially those in smaller compa-nies or in open-source projects, may not have access tothe full range of hardware platforms, operating systems,middleware, class library versions, etc. over which thesystem must run. In these situations, individual QA effortswill necessarily be incomplete.� Limited budgets, aggressive schedules, and rapidlychanging code bases mean that QA efforts frequentlyfocus on a relatively small number of system configu-rations, often chosen in an ad hoc fashion. Developersthen unreliably extrapolate from this data to the entireconfiguration space, which allows quality problems toescape detection until systems are fielded.
In summary, resource constraints and the large numberof possible system configurations make exhaustive evalua-
IEEE TRANSACTIONS ON SOFTWARE ENGINEERING 2
tion infeasible for performance-intensive systems. Developerstherefore need (1) ways to identify a small core set ofconfigurations whose QA results can be reliably generalizedacross all configurations and (2) support for executing QAactivities across a sufficiently rich and diverse set of computingplatforms. To address these needs, our research [33], [31],[20], [32] has focused on system support and algorithms fordistributed continuous quality assurance (DCQA) processes.DCQA helps improve software quality iteratively, opportunis-tically, and efficiently by executing QA tasks continuouslyacross a grid of computing resources provided by end-usersand developer communities.
In prior work [20], we created a prototype DCQA supportenvironment called Skoll that helps developers create, exe-cute, and analyze their own DCQA processes, as describedin Section II. To facilitate DCQA process development andvalidation, we also developed model-driven engineering toolsfor use with Skoll. We then used Skoll to design and executean initial DCQA process, called “main effects screening” [33],whose goal was to estimate performance efficiently acrossall system configurations (hereafter called the “configurationspace”).
Main effects screening borrows ideas from statistical qualityimprovement techniques that have been applied widely inengineering and manufacturing, such as Exploratory DataAnalysis [27], Robust Parameter Design [30], and StatisticalQuality Control [23]. A central activity of these techniquesis to identify aspects of a system or process that contributesubstantially to outcome variation. We use similar ideas toidentify important configuration options whose settings definethe distribution of performance across all configurations bycausing the majority of performance variation. Evaluating allcombinations of these important options (and randomizingthe other options), thus provides an inexpensive, but reliableestimate of performance across the entire configuration space.
Although our initial work on main effects screening pre-sented in [33] showed promise, it also had several limitations.For example, the definition and execution of the process hadmany manual steps. To improve this, we have extended andbetter integrated several model-driven engineering (MDE) [25]tools, including the Options Configuration Modeling Language(OCML) [28], which models configuration options and inter-option constraints, and the Benchmark Generation ModelingLanguage (BGML) [13], which models the QA tasks thatobserve and measure QoS behavior under different configu-rations and workloads. These MDE tools precisely capturecommon and variable parts of DCQA processes and thesoftware systems to which they are applied. They also helpreduce development and QA effort by generating configurationfiles and many other supporting code artifacts [2] needed tomanage and control process execution across heterogeneouscomputing resources.
Another limitation with our initial main effects screeningprocess was its dependence on strong and untested assump-tions regarding the absence of interactions among certaingroups of options. If these assumptions do not hold in practice,our results could be wildly incorrect. Moreover, we had noway to assess the validity of the assumptions without resorting
to exhaustive testing, whose avoidance motivated our DCQAprocess in the first place.
To remedy these problems, this paper describes furtherenhancements to our earlier work that significantly broadensits applicability with little additional operating costs. Our newDCQA process, called “reliable effects screening” is imple-mented using Skoll and its MDE tools, and relies on design-of-experiments (DOE) techniques called “screening designs” [30]and “D-optimal designs” [22]. Our reliable effects screeningprocess first identifies a small subset of the most important per-formance-related configuration options by creating formally-designed experiments and executing them across the Skollgrid. Whenever software changes occur thereafter, reliableeffects screening then uses a far smaller amount of computingresources to estimate system performance across the entireconfiguration space by exhaustively exploring all combinationsof the important options, while randomizing the rest. Thissubsequent analysis can even be run completely in-house,assuming appropriate computing platforms are available, sincethe reduced configuration space is much smaller than the orig-inal, and thus more tractable using only in-house resources.
In addition to describing our new reliable effects screeningDCQA process, this paper also evaluates this process empir-ically on ACE, TAO, and CIAO (dre.vanderbilt.edu),which are three widely-used, production-quality, performance-intensive software frameworks. This evaluation indicates that(1) our reliable effects screening process can correctly andreliably identify the subset of options that are most importantto system performance, (2) monitoring only these selectedoptions helps to detect performance degradation quickly withan acceptable level of effort, and (3) alternative strategieswith equivalent effort yield less reliable results. These resultssupport our contention that reliable effects screening caninexpensively and quickly alert performance-intensive systemdevelopers to changes that degrade QoS, as well as providethem with much greater insight into their software’s perfor-mance characteristics.
The remainder of this paper is organized as follows: Sec-tion II summarizes the Skoll DCQA environment; Section IIIdescribes how we extended Skoll to implement the new reli-able effect screening DCQA process to conduct performance-oriented regression testing efficiently; Section IV presents thedesign and results of a feasibility study using ACE, TAO, andCIAO;
Section V further discusses our empirical results and eval-uates threats to the validity of our experiments; Section VIpresents guidelines on how to use reliable effects screening;Section VII compares our research on reliable effect screen-ing with related work; and Section VIII presents concludingremarks and outlines future directions of our DCQA processand tool research.
II. AN OVERVIEW OF THE SKOLL DCQA ENVIRONMENT
To improve the quality of performance-intensive systemsacross large configuration spaces, our work focuses on dis-tributed continuous quality assurance (DCQA) processes [20]that evaluate various software qualities, such as portabil-ity, performance characteristics, and functional correctness

IEEE TRANSACTIONS ON SOFTWARE ENGINEERING 3
Computing Nodes Cluster #1
Computing Nodes Cluster #2
Skoll CoordinatorSite
Computing NodesCluster #3
Subtask 1.1 Subtask 1.2
Subtask 1.3
Task 1
QA Task 1 is split into three subtasks (1.1, 1.2, 1.3) and allocated to computing node clusters 1, 2, and 3respectively.
Fig. 1. The Skoll Distributed Continuous Quality Assurance Architecture
“around-the-world and around-the-clock.”1 To support thismethodology, we developed Skoll, which is a model-drivenengineering (MDE)-based DCQA environment (www.cs.umd.edu/projects/skoll). Skoll divides QA processesinto multiple tasks, each of which is implemented as a genericprocess parametrized by one of several alternative configura-tions expressed via MDE tools. Example tasks might includerunning regression tests in one of many system configurations,evaluating system response time under one of several differentinput workloads, or measuring code execution coverage usingone of several instrumentation schemes. As shown in Figure 1,these tasks are then intelligently and continuously distributedto – and executed by – clients across a grid of computingresources contributed by end-user and developer communities.The results of individual tasks are returned to servers at centralcollection sites, where they are merged and analyzed to steersubsequent iterations and ultimately to complete the overallQA process.
This section summarizes Skoll’s key components and ser-vices, which include MDE tools for modeling system con-figurations and their constraints, a domain-specific modelinglanguage (DSML) to describe these models, algorithms forscheduling and remotely executing tasks via planning technol-ogy that analyzes task results and adapts the DCQA processin real time, a DSML to package the subtasks, and techniquesto interpret and visualize the results.QA task space. Performance-intensive systems, such as theACE+TAO+CIAO QoS-enabled middleware, provide a range(i.e., � 500) of configuration options that can be used to tune itsbehavior.2 To be effective, DCQA processes must keep track ofthese options, in addition to other environmental information,such as OS platform, build tools used, and desired versionnumbers. This information is used to parameterize genericQA tasks and aids in planning the global QA process, e.g.,by adapting the process dynamically and helping interpret theresults.
In Skoll, tasks are generic processes parameterized by
1Naturally, DCQA processes can also be executed effectively in moreconstrained and smaller-scale environments, such as company-wide intranets.
2All the ACE+TAO+CIAO’s configuration options are described atwww.dre.vanderbilt.edu/˜schmidt/DOC_ROOT/TAO/docs/Options.html.
QA task options. These options capture information that is(1) varied under QA process control or (2) needed by thesoftware to build and execute properly. These options aregenerally application-specific, including workload parameters,operating system, library implementations, compiler flags, orrun-time optimization controls. Each option must take its valuefrom a discrete number of settings. For example, in otherwork, our QA task model includes a configuration optioncalled OperatingSystem so Skoll could select appropriatebinaries and build code for specific tasks [32].QA task modeling. The QA task model underlies the DCQAprocess. Our experience [20], [13], [31] with the initial Skollprototype taught us that building these models manually wastedious and error-prone. We therefore developed and integratedinto Skoll the Options Configuration Modeling Language(OCML) [28]. OCML is an MDE tool that provides a DSMLfor modeling software configurations. For example, OCMLdefines a numeric option type for middleware options thatcan have numeric values, e.g., cache, buffer, or thread poolsizes. OCML is built atop the Generic Modeling Environment(GME) [16], which provides a meta-programmable frameworkfor creating DSMLs and generative tools via metamodels andmodel interpreters. For the feasibility study in Section IV, weused the OCML MDE tool to define the configuration modelvisually and generate the low-level formats used by other Skollcomponents.Exploring the QA task space. Since the QA task spacesof many systems can be enormous, Skoll contains an In-telligent Steering Agent (ISA) [20] that uses AI planningtechniques [21] to distribute QA tasks on available Skollclients. When clients become available they send a messageto the Skoll server. Skoll’s ISA then decides which taskto assign it by considering many factors, including (1) theQA task model, which characterizes the subtasks that canbe assigned legally, (2) the results of previous tasks, whichcapture what tasks have already been done and whether theresults were successful, (3) global process goals, such astesting popular configurations more than rarely used ones ortesting recently changed features more heavily than unchangedfeatures, and (4) client characteristics and preferences, e.g.,the selected configuration must be compatible with the OSrunning on the client machine or users can specify preferencesthat configurations must run with user-level – rather thansuperuser-level – protection modes.
After a valid configuration is chosen, the ISA packagesthe corresponding QA task into a job configuration, whichconsists of the code artifacts, configuration parameters, buildinstructions, and QA-specific code (e.g., developer-suppliedregression/performance tests) associated with a software pro-ject. Each job configuration is then sent to a Skoll client, whichexecutes the job configuration and returns the results to theISA. By default, the ISA simply stores these results.
In some experiments, however, we want to learn fromincoming results. For example, when some configurationsprove faulty, it makes no sense to retest them. Instead, weshould refocus resources on other unexplored parts of the QAtask space. When such dynamic behavior is desired, DCQAprocess designers develop customized adaptation strategies

IEEE TRANSACTIONS ON SOFTWARE ENGINEERING 4
Fig. 2. Associating QoS with an Operation in BGML
that Skoll uses to monitor the global process state, analyzeit, and modify future task assignments in ways that improveprocess performance. One example of an adaptation strategy isthe nearest neighbor search strategy, which allows a processto target failing QA task subspaces by preferentially testingthe “neighbors” of a failing configuration, (i.e., other similarconfigurations that differ in one configuration option value) tosee if they also fail [20].Packaging QA tasks. With the initial Skoll prototype, devel-opers who wanted to evaluate QoS issues had to provide hand-written benchmark programs. For example, ACE+TAO+CIAOdevelopers creating such benchmarks to measure latency andthroughput for a particular workload had to write (1) theheader files and source code that implement the measurements,(2) the configuration and script files that tune the underlyingORB and automate running tests and output generation, and(3) project build files (e.g., makefiles) required to generateexecutable binaries from source code. Our initial feasibilitystudy [20] revealed that this process was tedious and error-prone.
To address these problems, we developed the Bench-mark Generation Modeling Language (BGML) [14], whichis an MDE tool that automates key QoS evaluation con-cerns of QoS-enabled middleware and applications, such as(1) modeling how distributed system components interactwith each other and (2) representing metrics that can beapplied to specific configuration options and platforms. Mid-dleware/application developers can use BGML to graphicallymodel interaction scenarios of interest. BGML automates thetask of writing repetitive source code to perform benchmarkexperiments and generates syntactically and semantically validsource and benchmarking code.
Figure 2 depicts how QA engineers can visually configurean experiment that measures end-to-end latency. As shownin the figure, the latency metric was associated with an op-eration (WorkOrderResponse()) using BGML. BGML’sTaskSet element was also used to create background tasksthat invoked the WorkOrderResponse() operation contin-uously for a fixed number of iterations.Analysis of results. Since DCQA processes can be complex,Skoll users often need help to visualize, interpret, and leverageprocess results. Skoll therefore supports a variety of pluggableanalysis tools, such as Classification Tree Analysis (CTA) [4].In previous work [20], [31], we used CTA to diagnose optionsand settings that were the likely causes of specific test failures.For the work presented in this paper, we developed statisticaltools to analyze data generated by the formally-designed
experiments described next.
III. PERFORMANCE-ORIENTED REGRESSION TESTING
As software systems evolve, developers often run regressiontests to detect unintended functional side effects. Developersof performance-intensive systems must also detect unintendedside effects on end-to-end QoS. A common way to detectthese effects is to run benchmarks when the system changes.As described in Section I, however, these efforts can beconfounded for systems with many possible configurationsbecause time and resource constraints (and often high changefrequencies) severely limit the number of configurations thatcan be examined using only in-house resources.
For example, our earlier experiences applying Skoll toACE+TAO [20] showed that ACE+TAO developers have alimited view of their software’s QoS since they routinelybenchmark only a small number of common configurations.QoS degradations not readily seen in these configurations,therefore, can and do escape detection until systems based onACE+TAO are fielded by end-users [20], [13]. The key prob-lem here is that the ACE+TAO developers are benchmarking asmall and unrepresentative sample of system configurations, sotheir extrapolations from this data are bound to be unreliable.
To address this problem we have developed and evaluatedthe reliable effects screening process, which uses “design ofexperiments” theory [11] to determine an appropriate subset ofsystem configurations to benchmark when the system changes.This section describes how we implemented the reliable effectsscreening process and applied it to ACE+TAO+CIAO anddiscusses several process choices developers must make whenapplying it.
A. The Reliable Effects Screening Process
Reliable effects screening (RES) is a process we devel-oped to detect performance degradation rapidly across a largeconfiguration space as a system changes. This process iden-tifies a small subset of “important” configuration options thatsubstantially affect variation in performance. Benchmarking a“screening suite” containing all combinations of these impor-tant option settings (with other options assigned randomly)should therefore provide a reliable estimate of performanceacross the entire configuration space at a fraction of the costand effort of exhaustive benchmarking.
At a high level the process involves the following steps:1) Compute a formal experimental design based on the
system’s QA task model.

IEEE TRANSACTIONS ON SOFTWARE ENGINEERING 5
2) Execute that experimental design across volunteeredcomputing resources in the Skoll computing grid byrunning and measuring benchmarks on specific config-urations dictated by the experimental design devised inStep 1.
3) Collect, analyze and display the data so that developerscan identify the most important options, i.e., the optionsthat affect performance most significantly.
4) Conduct supplementary analysis again on volunteeredcomputing resources to check the basic assumptionsunderlying Step 1 and to confirm the results of Step3.
5) Estimate overall performance (in-house, if possible)whenever the software changes by evaluating all combi-nations of the important options (while randomizing allother options).
6) Frequently recalibrate the important options by restart-ing the process since these effects can change over time,depending on how rapidly the subject system changes.
B. Screening Designs Background
The first step of reliable effects screening is to iden-tify options accounting for the most performance vari-ation across the system’s QA task space. We do thisby executing and analyzing formally-designed experiments,called screening designs, which are described in Ko-larik [11], Wu and Hamada [30], or the NIST Engineer-ing Statistics Handbook (www.itl.nist.gov/div898/handbook/index.htm). Screening designs are highly eco-nomical plans for identifying important low-order effects, i.e.,first-, second-, or third-order effects (where an ���� -order effectis an effect caused by the simultaneous interaction of �factors).
To better understand screening designs, consider a fullfactorial (i.e., exhaustive) experimental design involving independent binary factors. The design’s run size (numberof experimental observations) is therefore � � . Although suchdesigns allow all ��� � - through �� -order effects to be com-puted, they quickly become computationally expensive to run.Screening designs, in contrast, reduce costs by observing onlya carefully selected subset of a full factorial design. Thetradeoff is that they cannot compute most higher-order effectsbecause the selection of observations aliases the effects ofsome lower-order interactions with some higher-order ones,i.e., it conflates certain high- and low-order effects.
Which effects are conflated depends on the design’s reso-lution. In resolution � designs, no effects involving � factorsare aliased with effects involving less than ����� factors. Forinstance, a resolution III design is useful to evaluate “clear”(no two aliased together) � � � -order effects, where all highereffects are negligible. Here all � � � -order effects will be clear,but they may be aliased with ����� - or higher-order effects. Thisconflation is justified only if the high-order effects are indeednegligible. If these assumptions are patently unreasonable,then a higher resolution may be needed.
In practice, statistical packages are used to compute spe-cific screening designs. We used the SAS/QC [1] package
TABLE I����� �!#" DESIGN (BINARY OPTION SETTINGS ARE ENCODED AS (-) OR (+))
A B C D- - - -+ - - +- + - ++ + - -- - + ++ - + -- + + -+ + + +
in this work, but many other packages, such as MINITABand SPSS, are also applicable. These packages will producea screening design, assuming one can be found, given thefollowing application-specific information: (1) a list of optionsand their settings, (2) a maximum run size, and (3) the design’sresolution.
Since we already build our QA task model graphically usingSkoll’s MDE tools (see Section II), we can just use a translatorto convert it into the list of options and settings expectedby our statistical package. The second and third items areintertwined and must be chosen by developers. In particular,higher resolution designs will yield more accurate estimates(assuming some higher-level effects exist), but require moreobservations. It is also often advisable to run more thanthe minimum number of observations needed for a givenresolution to improve precision or to deal with noisy processes.Developers must balance these competing forces.
C. Computing a Screening Design
To demonstrate these choices, consider a hypothetical soft-ware system with 4 independent binary configuration options,$
through % , each with binary settings + and -. A fullfactorial design for this system involves 16 ( ��& ) observations.We assume that our developers can only afford to gather 8observations. With so few observations, there is no design withclear � � � - and ����� -order effects. Developers must thereforeeither allow more observations or limit themselves to capturingonly the 4 � � � -order effects, i.e., the effect of each option byitself. We assume they choose to stay with a run size of 8 andto use a resolution IV design.
Given these choices, the developers generate one acceptabledesign using a statistical package. The design (which appearsin Table I) is identified uniquely as a � &('*)+-, design, whichmeans that the total number of options is 4, that they willobserve a �/.�� ( �0'*)213��.4� ) fraction of the full factorial design,and that the design is a resolution IV screening design.
The design tool also outputs the aliasing structure %51$7698. We can see this aliasing in Table I where the setting of
option % is the product of the settings of options$
,6
and8
(think of + as 1 and - as � 1). This dependence explains whythe effect of option % cannot be untangled from the interactioneffect of options
$,6
, and8
.
D. Executing and Analyzing Screening Designs
After defining the screening design, developers will executeit across the computing resources comprising the Skoll grid.
IEEE TRANSACTIONS ON SOFTWARE ENGINEERING 6
In our later feasibility studies, each experimental observationinvolves measuring a developer-supplied benchmark programwhile the system runs in a particular configuration. Our QAengineers use BGML to generate workload and benchmarkcode. Once the data is collected we analyze it to calculatethe effects. Since our screening designs are balanced andorthogonal by construction (i.e., no bias in the observed data),the effect calculations are simple. For binary options (withsettings - or +), the effect of option
$, :3;=< $?> , is
:3;=< $@> 1�A < $ � > ��A < $CBC> (1)
where AD< $ � > and AD< $@BC> are the mean values of the observeddata over all runs where option
$is (-) and where option
$is (+), respectively.
If required, ����� -order effects can be calculated in a similarway. The interaction effect of options
$and
6, E�FHGI< $IJK6L>
is:
E FMGI< $NJ�6L> 13��.4�0O/:3;=< 6QP $@BC> �R:3;S< 6QP $ � >�T (2)13��.4�0O/:3;=< $LP 69BC> �R:3;S< $LP 6 � >�T (3)
Here :3;=< 6QP $@BC> is called the conditional effect of6
at the +level of
$. The effect of one factor (e.g.,
6) therefore depends
on the level of the other factor (e.g.,$
). Similar equationsexist for higher order effects and for designs with non-binaryoptions. See Wu and Hamada [30] for further details.
Once the effects are computed, developers will want todetermine which of them are important and which are not.There are several ways to determine this, including usingstandard hypothesis testing. We do not use formal hypothesistests primarily because they require strong assumptions aboutthe standard deviation of the experimental samples. Instead,we display the effects graphically and let developers usetheir expert judgment to decide which effects they considerimportant. While this approach has some downsides (seeSection VIII), even with traditional tests for statistical signifi-cance, experimenters must still judge for themselves whethera significant effect has any practical importance.
Our graphical analysis uses half-normal probability plots,which show each option’s effect against their correspondingcoordinates on the half-normal probability scale. If
P UDP )WVP UDP X VZY[Y\Y]V P UDP + are the ordered set of effect estimations,the half-normal plot then consists of the points
<_^ '*) <` Y a B ` Ybadc �e�R` Yba/f .�E >�JgP UDP hi>kjml/n �o1p� J Y[Y[Y J E (4)
where ^ is the cumulative distribution function of a standardnormal random variable.
The rationale behind half-normal plots is that unimportantoptions will have effects whose distribution is normal andcentered near 0. Important effects will also be normallydistributed, but with means different from 0.3 Options whoseeffects deviate substantially from 0 should therefore be consid-ered important. If no effects are important, the resulting plotwill show a set of points on an approximate line near qr1�` .
3Since the effects are averages over numerous observations, the central limittheorem guarantees normality.
E. Conducting Supplementary Analysis
At this point developers have a candidate set of importantoptions. One potential problem, however, is that we arrived atthese options by making the following assumptions:
1) The low-order effects identified as being important reallyare; while the higher-order effects they are aliased to arenot.
2) Monitoring only low-order effects is sufficient to pro-duce reliable estimates.
Since these are only assumptions, it is important to checkthem before proceeding since the reliability of our results willbe severely compromised if they do not hold. We thereforevalidate these assumptions using two types of follow-up ex-periments:
1) We first examine additional configurations to disam-biguate any effects aliased to our purported low-levelimportant options.
2) We then examine additional configurations to look forother higher-order effects.
In these follow-up experiments we rely on another class ofefficient experimental designs called D-optimal designs [22],which are again computer-aided designs. Given a configurationspace and a model the experimenter wishes to fit, a D-optimaldesign uses search-based computer algorithms (e.g., hill climb-ing or simulated annealing) to select a set of configurations thatsatisfy a particular optimality criterion. Unlike more commonfractional factorial designs, therefore, the size of D-optimaldesigns need not be a perfect fraction of full factorial designs.D-optimal designs are preferable to standard classical designswhen (1) the standard designs require more observations thancan be tested with available time and resources and (2) theconfiguration space is heavily constrained (i.e., when notall the configurations are valid). Both factors are frequentlypresent in modern software systems. Full details of D-optimaldesigns are beyond the scope of this paper, but can be foundin books and articles (See Kolarik [11] and Mitchell [22]).
Based on the results of this D-optimal design analysis,developers may modify the set of important options. At thispoint developers have a working set of important options thatthey can use to create a screening suite of configurations tobenchmark whenever the system changes.
IV. FEASIBILITY STUDY
This section describes a feasibility study that assesses theimplementation cost and the effectiveness of the reliableeffects screening process described in Section III on a suite oflarge, performance-intensive software frameworks.
A. Experimental Design
Hypotheses. Our feasibility study explores the following threehypotheses:
1) Our MDE-based Skoll environment cost-effectively sup-ports the definition, implementation, and execution ofour reliable effects screening process described in Sec-tion III.

IEEE TRANSACTIONS ON SOFTWARE ENGINEERING 7
TABLE IISOME ACE+TAO OPTIONS
Option Index Option Name Option Settings Option DescriptionA ReactorThreadQueue s FIFO, LIFO t Order in which incoming requests
are processed in the ORB ReactorB ClientConnectionHandler s RW, MT t Client side connection handlerC ReactorMaskSignals s 0, 1 t Enable/disable signals
during request processingD ConnectionPurgingStrategy s LRU, LFU t ORB connection purging strategyE ConnectionCachePurgePercent s 10, 40 t % of the ORB connection cache purgedF ConnectionCacheLock s thread, null t Enable/disable locking of
the ORB connection cacheG CorbaObjectLock s thread, null t Enable/disable locking while
synchronizing object stateH ObjectKeyTableLock s thread, null t Type of lock to be used
within ORB for retrievingobject keys
I InputCDRAllocator s thread, null t Enable/disable locking duringcreating CDR streams
J Concurrency s reactive, ORB concurrencythread-per-connect t reactive or thread per connection
K ActiveObjectMapSize s 32, 128 t Map size for holding objectsL UseridPolicyDemuxStrategy s linear, dynamic t Demultiplexing strategy
when user-id policy is usedM SystemPolicyDemuxStrategy s linear, dynamic t Demultiplexing strategy
when system id policy is usedN UniquePolicyRevDemuxStrategy s linear, dynamic t Specify the reverse demultiplexing
lookup strategy to beused with the unique id policy
2) The screening designs used in the reliable effects screen-ing correctly identifies a small subset of options whoseeffect on performance is important.
3) Exhaustively examining just the options identified bythe screening design gives performance data that (a) isrepresentative of the system’s performance across theentire configuration space, but less costly to obtain and(b) is more representative than a similarly-sized randomsample.
Subject applications. The experimental subject applicationsfor this study were based on three open-source softwareframeworks for performance-intensive systems: ACE v5.4 +TAO v1.4 + CIAO v0.4, which can be downloaded viawww.dre.vanderbilt.edu. ACE provides reusable C++wrapper facades and framework components that implementscore concurrency and distribution patterns [26] for distributedreal-time and embedded (DRE) systems. TAO is a highlyconfigurable Real-time CORBA Object Request Broker (ORB)built atop ACE to meet the demanding QoS requirements ofDRE systems. CIAO extends TAO to support components,which enables developers to declaratively provision QoS poli-cies end-to-end when assembling DRE systems.
ACE+TAO+CIAO are ideal subjects for our feasibility studysince they share many characteristics with other highly con-figurable performance-intensive systems. For example, theycollectively have over 2M+ lines of source code, functionalregression tests, and performance benchmarks contained in� 4,500 files that average over 300 CVS commits per weekby dozens of developers around the world. They also run on awide range of OS platforms, including all variants of Windows,most versions of UNIX, and many real-time operating systems,
Fig. 3. Using BGML to Generate Benchmarking Code
such as LynxOS and VxWorks.Application scenario. Due to recent changes made to the ACEmessage queuing strategy, the developers of ACE+TAO+CIAOwere concerned with measuring two performance criteria: (1)the latency for each request and (2) total message through-put (events/second) between the ACE+TAO+CIAO client andserver. For this version of ACE+TAO+CIAO, the developersidentified 14 binary run-time options they felt affected latencyand throughput. The entire configuration space therefore has��)u&?13�gv J�w�x4y different configurations. To save space, we referto these options by their one letter indices, A-N (see Table IIfor more details on the mapping of letters to options).

IEEE TRANSACTIONS ON SOFTWARE ENGINEERING 8
Fig. 4. Using OCML to Capture Experiment Configuration
Using MDE tools to model experiment scenario. To easeexperiment creation and generation, we used the Skoll MDEtools to compose the experiment visually. In particular, weused BGML to generate the platform-specific benchmarkingcode needed to evaluate the QoS of the ACE+TAO+CIAOsoftware framework configurations. Figure 3 shows how weused BGML to model the benchmark.
For the experiment, we modeled the operation exchangedbetween the client and server using BGML’s operation ele-ment. We then associated this element with BGML’s latencymetric to compute the end-to-end measurements for our exper-iments. The number of warm up iterations and the data typeexchanged between client and server were all set as attributesto the operation and latency elements provided by BGML.As shown in the figure, BGML code generators generated thebenchmarking code to measure and capture the latency for ourexperiment.
Another step in designing our experiment involved modelingthe ACE+TAO+CIAO framework configurations. We used theOCML MDE tool to ensure that the configuration were bothsyntactically and semantically valid, as shown in Figure 4.
As shown in the figure, OCML was used to enter theACE+TAO+CIAO configurations we wanted to measure.OCML’s constraint checker first validated the configurationswe modeled, while the code generator produced the frameworkconfiguration files.Experimental process. Our experimental process used Skoll’sMDE tools to implement the reliable effects screening processand evaluate our three hypotheses above. We executed thereliable effects screening process across a prototype Skoll gridof dual processor Xeon machines running Red Hat 2.4.21with 1GB of memory in the real-time scheduling class. Theexperimental tasks involved running a benchmark applicationin a particular system configuration, which evaluated per-formance for the application scenario outlined above. Thebenchmark created an ACE+TAO+CIAO client and serverand then measured message latency and overall throughputbetween the client and the server.
In our experiment, the client sent 300K requests to theserver. After each request the client waited for a responsefrom the server and recorded the latency measure in mi-croseconds. At the end of 300K requests, the client computedthe throughput in terms of number of requests served persecond. We then analyzed the resulting data to evaluate our
0.0 0.5 1.0 1.5
05
1015
20
Half−Normal Probability Plot for Latency (Full−Factorial)
half−normal quantiles
optio
n ef
fect
s
H E K D G A N L MI C F
J
B
0.0 0.5 1.0 1.5
050
010
0015
0020
00
Half−Normal Probability Plot for Throughput (Full−Factorial)
half−normal quantiles
optio
n ef
fect
s
H G A D E K N L M C I F
J
B
Fig. 5. Option Effects Based on Full Data
hypotheses. Section VIII describes the limitations with ourcurrent experimental process.
B. The Full Data Set
To provide a baseline for evaluating our approach, we firstgenerated and analyzed performance data for all 16,000+valid configurations of ACE+TAO+CIAO.4 We refer to theseconfigurations as the “full suite” and the performance data asthe “full data set.”
We examined the effect of each option and judged whetherthey had important effects on performance. Figure 5 plots theeffect of each of the 14 ACE+TAO+CIAO options on latencyand throughput across the full data set. We see that options
6and z are clearly important, whereas options E ,
8, and { are
arguably important. The remaining options are not important.
4We would not do this step in practice since it required about two daysof CPU time, which would be prohibitively expensive in most productionsoftware development environments with scores of such experiments runningdaily.

IEEE TRANSACTIONS ON SOFTWARE ENGINEERING 9
0.0 0.5 1.0 1.5
05
1015
20Half−Normal Probability Plot for Latency (Resolution IV, 32−run)
half−normal quantiles
optio
n ef
fect
s
K M G I D L A F N C H E
J
B
Half−Normal Probability Plot for Latency (Resolution IV, 64−run)
half−normal quantiles
0.0 0.5 1.0 1.5
G N M K H E D F L C A I
J
B
Half−Normal Probability Plot for Latency (Resolution IV, 128−run)
half−normal quantiles
0.0 0.5 1.0 1.5
H K N E L M G A D C I F
J
B
Fig. 6. Option Effects Based on Screening Designs
0.0 0.5 1.0 1.5 2.0 2.5
0.0
0.1
0.2
0.3
0.4
0.5
0.6
Half−Normal Probability Plot for Latency (Full−Factorial)
half−normal quantiles
seco
nd−o
rder
effe
cts
IJ
AFFG
BF
FJ
BC
CJ
BJ
0.0 0.5 1.0 1.5 2.0 2.5
0.0
0.1
0.2
0.3
0.4
0.5
Half−Normal Probability Plot for Latency (Resolution VI, 2048−run)
half−normal quantiles
seco
nd−o
rder
effe
cts
DL
EGBF
FJ
BC
CJ
BJ
Fig. 7. Pairwise Effects Based on Full and Screening Suite
C. Evaluating Screening Designs
We now walk through the steps involved in conducting thereliable effects screening process, to see whether the remotelyexecuted screening designs can correctly identify the sameimportant options discovered in the full data set.
To perform these steps, we calculated and executed severaldifferent resolution IV screening designs of differing run sizes.The specifications for these designs appear in the Appendix.The first set of designs examined all 14 options using increas-ingly larger run sizes (32, 64, or 128 observations) to identifyonly important � � � -order effects. We refer to these screeningdesigns as |k} ng~ X , |k} ng� & and |k} n ) X�� , respectively. We alsocalculated and executed a second set of designs that attemptedto capture important � � � - and �4��� -order effects.
Figure 6 shows the half-normal probability plots obtainedfrom our first set of screening designs. The figures show thatall screening designs correctly identify options
6and z as
being important. |�} n ) XK� also identifies the possibly importanteffect of options
8, E , and { . Due to space considerations in
the paper we only present data on latency (throughput analysis
showed identical results unless otherwise stated).
D. Higher-Order Effects
The Resolution IV design only calculates clear � � � -ordereffects, which appears to work well for our subject applicationand scenario, but might not be sufficient for other situations.Figure 7 shows the effects of all pairs of options based on thefull data set and the same effects captured via a ResolutionVI screening design using 2,048 observations. From the figurewe see several things: (1) the screening design correctlyidentifies the 5 most important pairwise interactions at �/. x ��the cost of exhaustive testing and (2) the most importantinteraction effects involve only options that are already consid-ered important by themselves, which supports the belief thatmonitoring only first-order effects will be sufficient for oursubject frameworks.
E. Validating Basic Assumptions
To compute the important options, we used a resolution IVscreening design, which according to the definition given in

IEEE TRANSACTIONS ON SOFTWARE ENGINEERING 10
TABLE IIIPARTIAL ALIASING STRUCTURE FOR THE IMPORTANT OPTION IN THE
�/����0�!#" , 128-RUN DESIGN
Partial Aliasing StructureB = ACH = CGKM = CKLN = DGHL = DHMN = EFHK = HIJK = ADEI = ADFJJ = EFI = ACIK = BHIK = CDFH = DEGM = DELN = FGKN = FKLM = ABDF
C = ABH = ADMN = AIJK = BGKM = BKLN = DEHI = DFHJ = AEFK = ADGLF = EIJ = BEHK = CDHJ = DGIM = DILN = GJKN = JKLM = ABDJ = ACEK
I = EFJ = ACJK = BHJK = CDEH = DFGM = DFLN = EGKN = EKLM = ABDE
B J F I C
GLM
N
EIK
LM
FGIK
L
BC
DM
N
BH
KLN
Type III Sum of Squares for Effecta Screening
Effects
Sum
of S
quar
es
0
30000
60000
120000
150000
178078178078
3427
9.29
207
.09
181
.42
180
.12
11
.07
10
.85
10
.71
10
.31
9
.73
(a)
B J F I C
AC
H
EFI
EFJ
AB
H
EIJ
Type III Sum of Squares for Effect Screening
Effects
Sum
of S
quar
es
0
3000
6000
12000
15000
1736917369
2936
.792
26.
872
18.
100
8.
483
5.
176
3.
561
1.
219
1.
149
0.
762
(b)Fig. 8. (a) Complete Dealiasing Experiment and (b) Up to and Including ����� -order Effects Dealiasing Experiment.
Section III, means that (1) we aliased some � � � -order effectswith some
w�� � -order or higher effects and some ����� -ordereffects with other ����� -order or higher effects, and (2) weassume that
w � � -order or higher effects are negligible. If theseassumptions do not hold however performance estimations willbe incorrect. Therefore, at this stage we perform two furtheranalyses to validate these assumptions.
In the remainder of this section we analyze the data from our� )u&�'m�+-, , 128-run experiment. We did this experiment because itwas the only one where we identified five important optionsrather than two. The analysis presented in this section isreadily applicable to any screening experiment.
1) Breaking Aliases: In the � )u&(' �+-, , 128-run experiment, weidentified options
6and z as being clearly important and
options8
, { , and E as being arguably important (see TableII for the list of options). In that design, some � � � -order effectswere aliased with some
w�� � -order or higher effects. Table IIIshows the aliasing structure for the important options up toy �� -order effects. Note that the complete aliasing structure forthe important options contains a total of 640 aliases.
Consider the alias6 1 $@8C�
for the important option6
;the effect of option
6is aliased with the interaction effect of
options$
,8
, and�
. Since the experimental analysis cannotdistinguish
6from
$@8C�, there is an ambiguity whether
6or$?8C�
is really important. If$@8C�
, not6
, is the important ef-
fect then our performance estimations would obviously suffer,as would the rest of the aliases. Ambiguities involving aliasedeffects for the important options should therefore be resolvedto ensure the reliability of the performance estimations.
To resolve the ambiguity in this experiment, we first for-mally modeled the important effects and their 640 aliases bythe following linear formula:
q 1���� B � ���D� B �m��� � B �D�o� � B � �o�D� B � + � +B �D�*���7�D���D���D� B � h � h J�� ���M|���O $?8C�RT (5)
where | is the set of all 640 aliased effects, � � is the interceptterm, � � 1��]� J � according to the level of option B (thedefinitions for the other � ’s are similar), � ’s are the modelcoefficients, etc.
Note that since the � � � -order effects other than6
, z ,8
,{ , and E are negligible (Section IV-C), we excluded themfrom the model. We then augmented our 128-run screeningexperiment using the D-optimal design approach. This search-based technique determined an appropriate design which re-quired benchmarking an additional 2,328 configurations. Wethen collected the results and analyzed them together with theresults of the original screening experiments.
Figure 8(a) plots the Type III sum of squares for the factorialeffects. In this figure, the effects are ordered in descendingorder. Due to space limitations, only the top 10 effects are

IEEE TRANSACTIONS ON SOFTWARE ENGINEERING 11
given. The higher the sum of squares, the more important theeffects are.
As can be seen from this figure, options6
, z ,8
, { ,and E are important, while the higher-order interactions towhich they are aliased are not, i.e., the low-order effectexplains roughly 10 times the variance of its higher-order alias.Further statistical analysis also showed that these options arestatistically significant at 99.99% confidence level or better.
Although this analysis confirmed our earlier results, itrequired benchmarking an additional 2,000+ configuration,which in large-scale systems might too expensive. To furtherreduce costs, instead of a complete dealiasing of importantoptions, one might consider dealiasing them up to a certainlevel of order (e.g., up to
w � � -order ory �� -order effects) or
dealiasing only suspected aliases based on developer’s domainknowledge.
To see how much savings partial dealiasing might yield, werepeated the evaluation process by dealiasing the importantoptions only up to and including
w � � -order effects. Thisrequired us to benchmark only an additional 64 configurations.As can be seen in Figure 8(b), in this particular example,we were able to reach the same conclusions as the completedealiasing experiment.
2) Checking for Higher-Order Effects: As described earlierin this Section, our second assumption was that monitoringonly � � � -order effects was sufficient for our subject frame-works. Below, we investigate the validity of that assumption.Without loss of generality, we will look for important effectsup to and including
w � � -order effects. Developers can chooseup to which level to examine, keeping in mind that as thelevel increases, the number of observations needed convergesto exhaustive testing.
Just as in Section IV-E.1, we augmented the � )u&�'m�+-, , 128-run experiment using the D-optimality criterion. This time,however, our generalized linear model consisted of all the � � � -,�4��� -, and
w�� � -order effects. This design required only an ad-ditional 381 configurations. Figure 9 shows the results of thisstudy. We identified the top 6 effects:
6, z , { , E ,
6 z , and8
,as statistically significant at 99.9% confidence level or better.Among these important options we have only one interactioneffect:
6 z . Since this interaction involves only options thatare already considered important by themselves, we concludethat monitoring only first-order effects was sufficient for oursubject frameworks.
The results presented above suggest that screening designscan detect important options at a small fraction of the cost ofexhaustive testing and that techniques exist to economicallycheck key assumptions underlying the technique. The smallerthe effect, however, the larger the run size needed to identifyit. Developers should therefore be cautious when dealing withoptions that appear to have an important, but relatively smalleffect, as they may actually be seeing normal variation ( |k} n ~ Xand |k} n � & both have examples of this).
F. Estimating Performance with Screening Suites
Our experiments thus far have identified a small set ofimportant options. We now evaluate whether benchmarking all
B J F I
BJ C
GIK DH
EFG
BD
G
Type III Sum of Squares for Effect Screening
Effects
Sum
of S
quar
es
0
5000
20000
2500025647
25647
4407
.143
51.
689
24.
299
16.
699
16.
446
10.
182
7.
755
7.
645
6.
423
Fig. 9. Looking for Higher-order Effects Upto and Including �(��� -orderEffects.
combinations of these most important options can be used toestimate performance quickly across the entire configurationspace we are studying. The estimates are generated by exam-ining all combinations of the most important options, whilerandomizing the settings of the unimportant options.
In the Section IV-C, we determined that options6
and zwere clearly important and that options
8, E , and { were
arguably important. Developers therefore made the estimatesbased on benchmarking either 4 (all combinations of options6
and z ) or 32 (all combinations of options6
, z ,8
, E , and{ ) configurations. We refer to the set of 4 configurations asthe “top-2 screening suite” and the set of 32 configurations asthe “top-5 screening suite.”
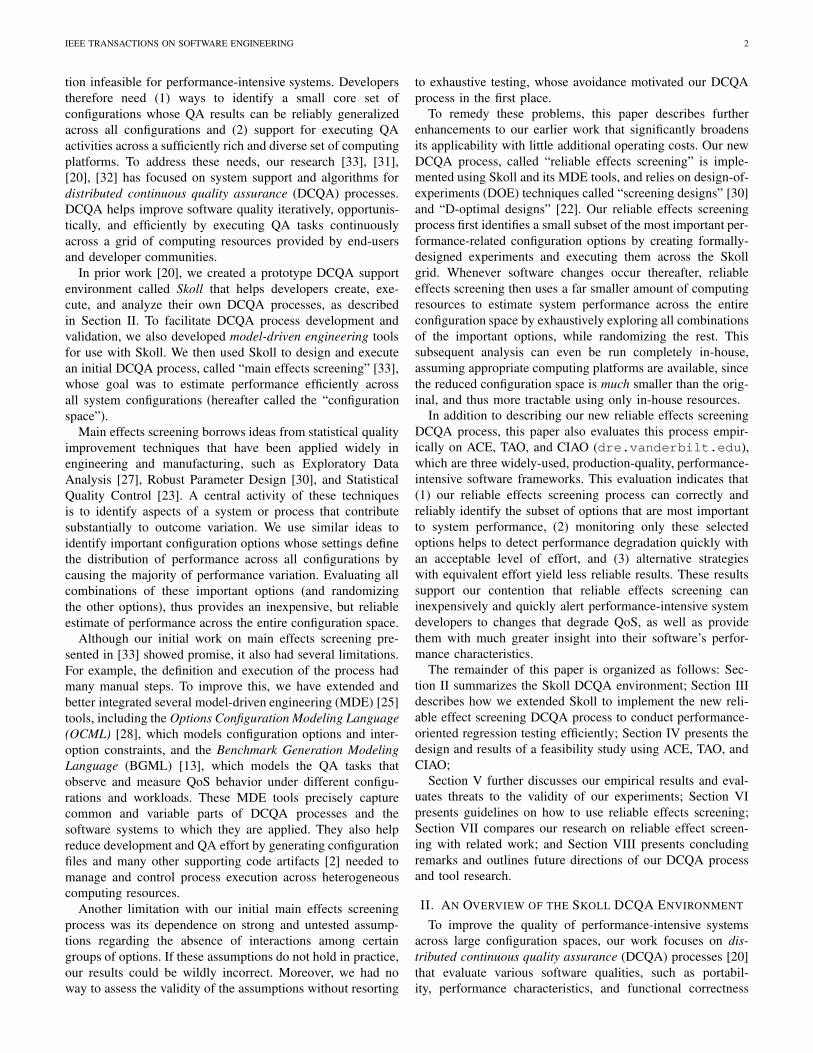
Figure 10 shows the distributions of latency for the fullsuite vs. the top-5 screening suite and for the full suite vs. thetop-2 screening suite. The distributions of the top-5 and top-2 screening suites closely track the overall performance data.Such plots, called quantile-quantile (Q-Q) plots, are used tosee how well two data distributions correlate by plotting thequantiles of the first data set against the quantiles of the seconddata set. If the two sets share the same distribution, the pointsshould fall approximately on the ��1�q line.
We also performed Mann-Whitney non-parametric tests [3]to determine whether each set of screening data (top-2 and top-5 suites) appears to come from the same distribution as the fulldata. In both cases we were unable to reject the null hypothesisthat the top-2 and top-5 screening suite data come from thesame distribution as the full suite data. These results suggestthat the screening suites computed at Step 4 of the reliableeffects screening process (Section III) can be used to estimateoverall performance in-house at extremely low time/effort, i.e.,running 4 benchmarks takes 40 seconds, running 32 takes 5minutes, running 16,000+ takes two days of CPU time.
IEEE TRANSACTIONS ON SOFTWARE ENGINEERING 12
60 70 80 90 100 110 120 130
6070
8090
100
110
120
130
Q−Q Plot for Latency
full suite
top−
2 sc
reen
ing
suite
60 70 80 90 100 110 120 130
6070
8090
100
110
120
130
Q−Q Plot for Latency
full suite
top−
5 sc
reen
ing
suite
Fig. 10. Q-Q plots for the Top-2 and Top-5 Screening Suites
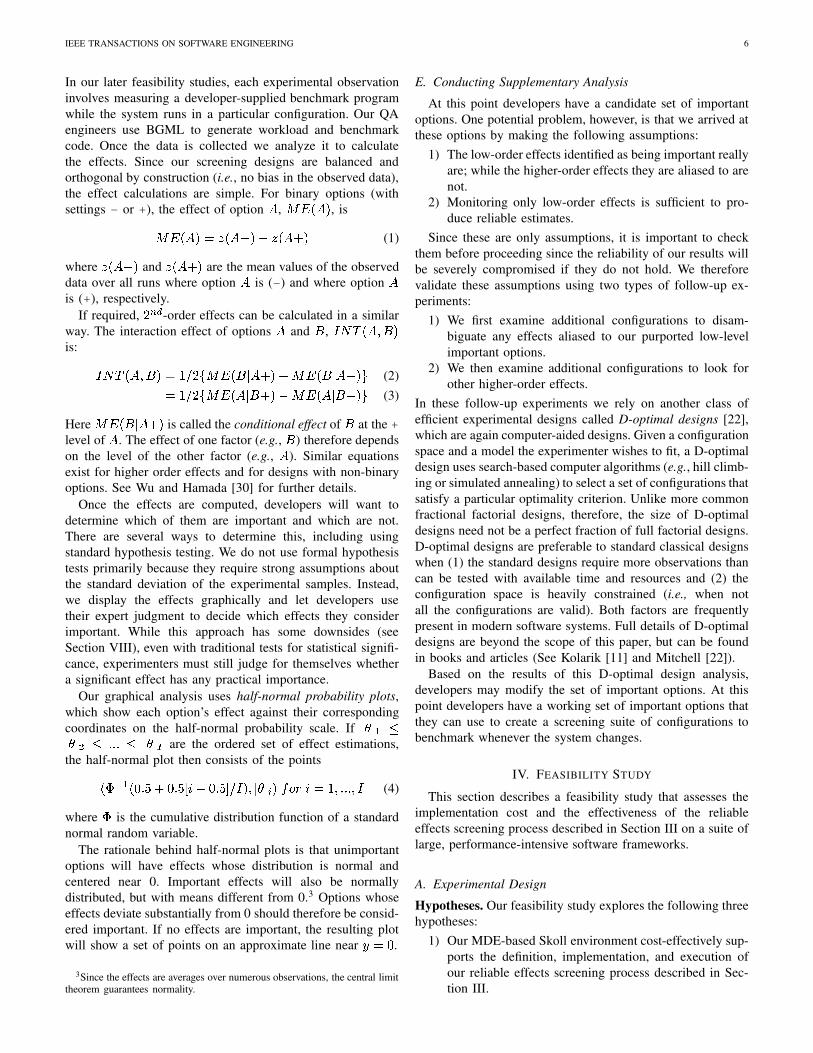
G. Screening Suites vs. Random SamplingAnother question we addressed is whether our reliable
effects screening process was better than other low-cost es-timation processes. In particular, we compared the latencydistributions of several random samples of 4 configurationsto that of the top-2 screening suite found by our process. Theresults of this test are summarized in Figure 11. These box
full
suite
top−
2 su
ite
rand
1
rand
2
rand
3
rand
4
rand
5
rand
6
rand
7
rand
8
90
100
110
120
Latency Distributions
test suite
late
ncy
Fig. 11. Latency Distribution from Full, Top-2, and Random Suites
plots show the distributions of latency metric obtained fromexhaustive testing, top-2 screening suite testing, and randomtesting. These graphs suggest the obvious weakness of randomsampling, i.e., while sampling distributions tend toward theoverall distribution as the sample size grows, individual smallsamples may show wildly different distributions.
H. Dealing with Evolving Systems
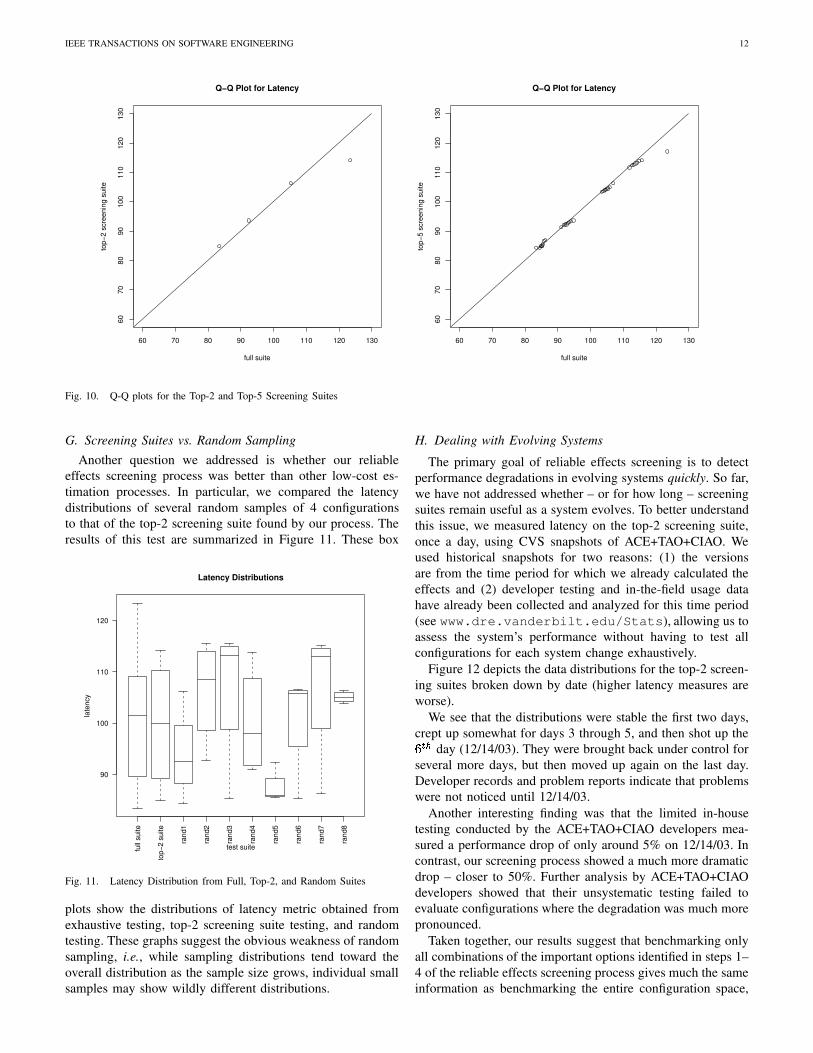
The primary goal of reliable effects screening is to detectperformance degradations in evolving systems quickly. So far,we have not addressed whether – or for how long – screeningsuites remain useful as a system evolves. To better understandthis issue, we measured latency on the top-2 screening suite,once a day, using CVS snapshots of ACE+TAO+CIAO. Weused historical snapshots for two reasons: (1) the versionsare from the time period for which we already calculated theeffects and (2) developer testing and in-the-field usage datahave already been collected and analyzed for this time period(see www.dre.vanderbilt.edu/Stats), allowing us toassess the system’s performance without having to test allconfigurations for each system change exhaustively.
Figure 12 depicts the data distributions for the top-2 screen-ing suites broken down by date (higher latency measures areworse).
We see that the distributions were stable the first two days,crept up somewhat for days 3 through 5, and then shot up thev4�� day (12/14/03). They were brought back under control forseveral more days, but then moved up again on the last day.Developer records and problem reports indicate that problemswere not noticed until 12/14/03.
Another interesting finding was that the limited in-housetesting conducted by the ACE+TAO+CIAO developers mea-sured a performance drop of only around 5% on 12/14/03. Incontrast, our screening process showed a much more dramaticdrop – closer to 50%. Further analysis by ACE+TAO+CIAOdevelopers showed that their unsystematic testing failed toevaluate configurations where the degradation was much morepronounced.
Taken together, our results suggest that benchmarking onlyall combinations of the important options identified in steps 1–4 of the reliable effects screening process gives much the sameinformation as benchmarking the entire configuration space,

IEEE TRANSACTIONS ON SOFTWARE ENGINEERING 13
X20
03.1
2.09
X20
03.1
2.10
X20
03.1
2.11
X20
03.1
2.12
X20
03.1
2.13
X20
03.1
2.14
X20
03.1
2.15
X20
03.1
2.16
X20
03.1
2.17
X20
03.1
2.18
X20
03.1
2.19
X20
03.1
2.20
X20
03.1
2.21
80
100
120
140
160
Screening 2 Options (4 cfgs) Over a Time Periodla
tenc
y
Fig. 12. Performance Estimates Across Time
but at a substantially reduced cost.
V. DISCUSSION OF FEASIBILITY STUDY
A. Threats to Validity
All empirical studies suffer from threats to their internal andexternal validity. For the experiments described in Section IV,we were primarily concerned with threats to external validitysince they limit our ability to generalize the results of ourexperiment to industrial practice. One potential threat is thatseveral steps in our process require human decision makingand input. For example, developers must provide reasonablebenchmarking applications and must also decide which effectsthey consider important.
Another possible threat to external validity concerns the rep-resentativeness of the ACE+TAO+CIAO subject applications,which are an integrated suite of software (albeit a very largesuite with over 2M+ lines of code). A related issue is that wehave focused on the subset of the entire configuration spaceof ACE+TAO+CIAO that only has binary options and has nointer-option constraints. While these issues pose no theoreticalproblems (screening designs can be created for much morecomplex situations), there is clearly a need to apply reliableeffects screening to larger and richer configuration spaces infuture work to understand how well the process scales.
Another potential threat is that for the time period westudied, the ACE+TAO+CIAO subject frameworks were in afairly stable phase. In particular, changes were made mostly tofix bugs and reduce memory footprint, but the software’s corefunctionality was relatively stable. For time periods where thecore software functionality is in greater flux, e.g., in responseto new requirements from sponsors or efforts to port thesoftware to new and different platforms, it may be harder todistinguish significant performance degradation from normalvariation.
B. Hypotheses
Despite the limitations described in Section V-A, we believethe study presented in Section IV supports our basic hypothe-ses presented in Section IV-A. We reached this conclusionby noting that our study suggests that the (1) MDE-basedSkoll system allows QA engineers to quickly construct com-plex DCQA processes; (2) reliable effects screening processprovides developers with fast, cheap and reliable estimatesof performance across a system’s entire configuration space;and (3) developers of ACE+TAO+CIAO believe the techniqueprovides them with important development information.Benefits from applying our MDE tools. Our MDE toolshelped improve the productivity of QA engineers by allowingthem to create QA task models and to compose benchmark-ing experiments visually rather than wrestling with low-levelformats and source code. These tools thus resolve tediousand error-prone accidental complexities associated with writ-ing correct code by auto-generating them from higher levelmodels. For example, Table IV summarizes the BGML codegeneration metrics for a particular configuration.
TABLE IVGENERATED CODE SUMMARY FOR BGML
Files Number Lines of Code Generated (%)IDL 3 81 100
Source (.cpp) 2 310 100Header (.h) 1 108 100Script (.pl) 1 115 100
This table shows how BGML automatically generates 8 of10 required files that account for 88% of the code requiredfor the experiment. Since these files must capture specificinformation for each configuration, these tools imply largeimprovements in productivity for performing benchmarkingQA tasks. Similarly, OCML enabled us to generate bothsyntactically and semantically correct middleware configura-tions, thereby eliminating accidental complexity in generatingmiddleware configurations.Reliable effects screening. Our experiments showed thatthe reliable effects screening process was fast, cheap, andeffective. We came to this conclusion by noting that:
1) Screening designs can correctly identify important op-tions (Sections IV-C – IV-E).
2) These options can be used to produce reliable estimatesof performance quickly across the entire configurationspace at a fraction of the cost of exhaustive testing(Section IV-F).
3) The alternative approach of random or ad hoc samplingcan give highly unreliable results (Section IV-G).
4) The reliable effects screening process detected perfor-mance degradation on a large and evolving softwaresystem (Section IV-H).
5) The screening suite estimates were significantly moreprecise than the ad hoc process currently used by thedevelopers of ACE+TAO+CIAO (Section IV-H).
User acceptance. Informally, we found that ACE+TAO+CIAOdevelopers have been quite happy with the results of our

IEEE TRANSACTIONS ON SOFTWARE ENGINEERING 14
experiments described in Section IV. As we move towardsfully integrating reliable effects screening into their devel-opment processes they continue to find new ways in whichthis information can help them improve their developmentprocesses, including:Using option importance to prioritize work. Our quantitativeresults showed that options � , : , and F did not have a strongeffect on latency and throughput. These findings surprisedsome ACE+TAO+CIAO developers, who had spent consid-erable time optimizing code affected by these options. Furtherinvestigation showed that the options can have a somewhatlarger effect, but only in very specific circumstances. Thedevelopers now see reliable effects screening as a meansto better understand how widespread the effects of differentpending changes may be.Using changes in option importance to detect bugs. Priorto the release of an ACE+TAO+CIAO beta, developers noteda significant ( � 25%) drop in performance. Since reliableeffects screening had not yet been fully integrated into theirdevelopment processes, the ACE+TAO+CIAO developers fellback on traditional ad hoc QA and debugging techniques.When they failed to identify the problem’s cause, they frozetheir CVS repository and used an exhaustive QA approachto painstakingly narrow down the change that had degradedperformance.
Ultimately they found the change that caused the degra-dation was a feature addition that enabled TAO+CIAO tosupport the IPv6 protocol. Specifically, they observed thata modification to TAO’s connection handler had degradedperformance. Interestingly, this code is controlled by option6
. In retrospect, a reliable effects screening would haveshown a dramatic change in the importance of option
6,
thus enabling the ACE+TAO+CIAO developers to localizethe problem quickly, i.e., because one setting of option
6triggered the buggy code, option
6’s effect would have been
2.5 times greater after the change than before it. Based on thisexperience, the developers now see added value in frequentlyrecalibrating the important options to alert them to changes inoption importance.
VI. USAGE GUIDELINES
This section focuses on providing some guidelines on howto use the Skoll-based reliable effects screening process. Weexamine how to select an appropriate resolution and size forthe screening designs, how to identify the important options,and how to validate the basic assumptions in identifying theimportant options. We also summarize on our experiencein applying this process on the ACE+TAO+CIAO softwareframeworks.Step 1: Choose the resolution. Leverage a priori knowledgeof the software being tested, if it is available, to decide theresolution of the screening experiment, i.e., which high-ordereffects are considered important vs. negligible. If no or limiteda priori information is available, use screening experimentsin an iterative manner (e.g., going from lower resolutionsto higher ones) to obtain this information. Section IV-Aillustrated how we did this for the ACE+TAO+CIAO software
frameworks, where we selected 14 specific options to explorebased on prior knowledge of a recent change.Step 2: Choose the size. Depending on available resourcesand how fast the underlying software changes, determine themaximum number of observations allowed in the screeningexperiment. Note that the resolution of the experiment chosenin Step (1) may dictate the minimum size of the experiment.If this size is not feasible, consider lowering the resolution ofthe experiment by carefully choosing the aliasing structure sothat no potentially important higher-order effects are aliasedwith lower-order ones. Sections IV-C and IV-D illustrate howwe did this for the ACE+TAO+CIAO software frameworks,where we created three resolution IV designs with run sizesof 32, 64, and 128, and where we created one resolution VIdesign with a run size of 2,048.Step 3: Identify the important options. After the screeningdesign is computed, conducted, and analyzed, use the half-normal probability plots described in Section IV-C to identifyimportant options. If no effects are important, these plotswill show a set of points on a rough line near q�1 ` . Anysubstantial deviations from this line indicate important options.Depending on the benchmarking test and the desired precisionof the performance estimates, decide how large effects mustbe to warrant attention. Section IV-C shows how we did thisfor the ACE+TAO+CIAO software frameworks, where weidentified 2 important and 3 arguably important options.Step 4: Validate the basic assumptions. If needed, validatethe assumptions imposed by the choice of the resolution.Use D-optimal designs described in Section IV-E to augmentthe screening experiment to (1) dealias the important optionsand (2) identify remaining higher-order effects. Section IV-Eillustrated how we did this for the ACE+TAO+CIAO softwareframeworks and showed that our basic assumptions helped andthat our initial analysis was therefore reliable.Step 5: Estimate performance after changing software.Focusing on important options allows developers to reducethe effective configuration space significantly by evaluatingall combinations of the important options, while randomizingthe rest. Section IV-F illustrated how we did this for theACE+TAO+CIAO software frameworks and showed that ourapproach gave reliable estimates of performance across theentire configuration space using only 40 seconds (for top-2suite) or 2 minutes (for top-5 suite) of CPU time.Step 6: Frequently recalibrate important options. Theimportance of different options may change as software in asystem changes. We therefore recommend frequent recalibra-tion of the important effects. Although our feasibility study inSection IV does not show the need for recalibration, our expe-rience applying reliable effects screening to ACE+TAO+CIAOover time indicates that recalibration is essential.
VII. RELATED WORK
This section compares our work on reliable effects screeningand performance evaluation techniques in Skoll with otherrelated research efforts, including (1) applying design-of-experiments (DOE) testing to software engineering, (2) large-scale testbed environments for conducting experiments using

IEEE TRANSACTIONS ON SOFTWARE ENGINEERING 15
heterogeneous hardware, OS, and compiler platforms, (3)evaluating the performance of layered software systems, and(4) feedback-based optimization techniques that use empiricaldata and mathematical models to identify performance bottle-necks.Applying DOE to software engineering. As far as weknow, we are the first to use screening designs to assesssoftware performance. The use of DOE theory within softwareengineering has focused mostly on interaction testing, largelyto compute and sometimes generate minimal test suites thatcover all combinations of specified program inputs. Mandl [19]first used orthogonal arrays, a special type of covering array inwhich all ¡ -sets occur exactly once, to test enumerated types inADA compiler software. This idea was extended by Brownlieet al. [5] who developed the orthogonal array testing system(OATS). They provided empirical results to suggest that theuse of orthogonal arrays is effective in fault detection andprovides good code coverage.
Dalal et al. [8] argue that the testing of all pairwiseinteractions in a software system finds a large percentage ofthe existing faults. In further work, Burr et al. [6], Dunietz etal. [9] and Kuhn et al. [15] provide more empirical results toshow that this type of test coverage is effective. These studiesfocus on finding unknown faults in already tested systems andequate covering arrays with code coverage metrics. Yilmaz etal. [31] used covering arrays as a configuration space samplingtechnique to support the characterization of failure-inducingoption settings.Large-scale benchmarking testbeds. EMULab [29] is atestbed at the University of Utah that provides an environmentfor experimental evaluation of networked systems. EMULabprovides tools that researchers can use to configure the topol-ogy of their experiments, e.g., by modeling the underlyingOS, hardware, and communication links. This topology is thenmapped to � 250 physical nodes that can be accessed via theInternet [24] . The EMULab tools can generate script files thatuse the Network Simulator (NS) (www.isi.edu/nsnam/ns/) syntax and semantics to run the experiment.
The Skoll infrastructure provides a superset of EMULab thatis not limited by resources of a particular testbed, but insteadcan leverage the vast end-user computer resources in the Skollgrid. Moreover, the Skoll’s MDE-based tools described inSection II can generate NS scripts to integrate our benchmarkswith experiments in EMULab.Feedback-driven optimization techniques. Traditionalfeedback-driven optimization techniques can be divided intoonline, offline, and hybrid analysis. Offline analysis hascommonly been applied to program analysis to improvecompiler-generated code. For example, the ATLAS [34]numerical algebra library uses an empirical optimizationengine to decide the values of optimization parameters bygenerating different program versions that are run on varioushardware/OS platforms. The output from these runs are usedto select parameter values that provide the best performance.Mathematical models are also used to estimate optimizationparameters based on the underlying architecture, thoughempirical data is not fed into the models to refine it.
Like ATLAS, Skoll’s MDE tools use an optimization engine
to configure/customize software parameters in accordance toavailable OS platform characteristics (such as the type ofthreading, synchronization, and demultiplexing mechanisms)and characteristics of the underlying hardware (such as thetype of CPU, amount of main memory, and size of cache).This information can be used to select optimal configurationsahead of time that maximize QoS behavior.
Online analysis is commonly used for feedback control toadapt QoS behaviors based on dynamic measures. An exampleof online analysis is the ControlWare middleware [35], whichuses feedback control theory by analyzing the architectureand modeling it as a feedback control loop. Actuators andsensors then monitor the system and affect server resourceallocation. Real-time scheduling based on feedback loops hasalso been applied to Real-time CORBA middleware [18] toautomatically adjust the rate of remote operation invocationtransparently to an application.
Though online analysis enables systems to adapt at run-time, the optimal set of QoS features are not determined atsystem initialization. Using the MDE tools, QoS behavior andperformance bottlenecks on various hardware and softwareconfigurations can be determined offline and then fed intothe models to generate optimal QoS characteristics at modelconstruction time. Moreover, dynamic adaptation can incurconsiderable overhead from system monitoring and adaptation,which may be unacceptable for performance-intensive DREsystems.
Hybrid analysis combines aspects of offline and onlineanalysis. For example, the continuous compilation strategy [7]constantly monitors and improves application code using codeoptimization techniques. These optimizations are applied infour phases including (1) static analysis, in which informationfrom training runs is used to estimate and predict optimizationplans, (2) dynamic optimization, in which monitors apply codetransformations at run-time to adapt program behavior, (3)offline adaptation, in which optimization plans are actuallyimproved using actual execution, and (4) recompilation, wherethe optimization plans are regenerated.
Skoll’s MDE-based strategy enhances conventional hy-brid analysis by tabulating platform-specific and platform-independent information separately using the Skoll framework.In particular, Skoll does not incur the overhead of systemmonitoring since behavior does not change at run-time. Newplatform-specific information obtained can be fed back intothe models to optimize QoS measures.Generative Benchmarking Techniques. There have beenseveral initiatives that use generative techniques similar toour approach for generating test-cases and benchmarking forperformance evaluation. The ForeSight [17] tool uses em-pirical benchmarking engine to capture QoS information forCOTS based component middleware system. The results areused to build mathematical models to predict performance.This is achieved using a three pronged approach of (1) createa performance profile of how components in a middlewareaffect performance, (2) construct a reasoning framework tounderstand architectural trade-offs, i.e., know how differentQoS attributes interact with one another and (3) feed thisconfiguration information into generic performance models

IEEE TRANSACTIONS ON SOFTWARE ENGINEERING 16
to predict the configuration settings required to maximizeperformance.
The SoftArch/MTE [10] tool provides a framework for sys-tem architects to provide higher level abstraction of the systemspecifying system characteristics such as middleware, databasetechnology, and client requests. The tool then generates animplementation of the system along with the performance teststhat measure system characteristics. These results are thendisplayed back, i.e., annotated in the high level diagrams, usingtools such as Microsoft Excel, which allows architects to refinethe design for system deployment.
Our MDE approach closely relates to the aforementionedapproaches. Both the ForeSight and SoftArch tools, how-ever, lack DCQA environments to help capture QoS vari-ations accurately on a range of varied hardware, OS, andcompiler platforms. Rather than using generic mathematicalmodels to predict performance, MDE tools use a feedback-driven approach [13], wherein the DCQA environment isused to empirically evaluate the QoS characteristics offline.This information can then be used to provide QA engineerswith accurate system information. Moreover, platform- andapplication-specific optimization techniques [12] can then beapplied to maximize QoS characteristics of the system.
VIII. CONCLUDING REMARKS
This paper presents a new distributed continuous qualityassurance (DCQA) process called “reliable effects screening”that uses in-house and in-the-field resources to efficientlyand reliably detect performance degradation in performance-intensive systems that have large configuration spaces. Thenovelty of our approach stems from its application of statisticalquality control techniques to efficiently identify a subset ofsystem configurations that accurately represents the perfor-mance of the entire configuration space. Benchmarking thissubset after a change provides a reliable estimate of the distri-bution of performance across all configurations. Unexpectedchanges in this distribution signal unintended side effects thatmust be examined further.
To evaluate the reliable effects screening process, we in-tegrated it with the Skoll DCQA environment and appliedit to three large software projects (ACE, TAO, and CIAO)using a grid of computing resources managed by the SkollDCQA environment. Skoll’s reliable effects screening processis also supported by model-driven engineering (MDE) toolsthat control and manage its execution across a grid of in-house and in-the-field computing resources. The results of ourexperiments in this environment indicated that:� The reliable effects screening process helped developers
detect and understand performance bottlenecks acrosslarge configuration spaces.� The ACE+TAO+CIAO developers used the informationprovided by this process as a scalable defect detectionaid, i.e., when the important options change unexpect-edly (at recalibration time), developers re-examined theframeworks to rapidly identify possible problems withsoftware updates.
� ACE+TAO+CIAO developers also used information pro-vided by the reliable effects screening process to un-derstand and arbitrate disputes about subtle changes inframework and application performance characteristics.
In conclusion, we believe that this line of research isnovel and fruitful, though much R&D remains to be done.We are therefore continuing to develop enhanced MDE-basedSkoll capabilities and use them to create and validate moresophisticated DCQA processes that overcome the limitationsand threats to external validity described in Section V. Inparticular, we are exploring the connection between design-of-experiments theory and the QA of other software systems withlarge software configuration spaces. We are also incorporatingthe tools in the Skoll environment and the reliable effectsscreening process into open-source software repositories, suchas ESCHER (www.escherinstitute.org). Finally, weare conducting a much larger case study using Skoll andreliable effect screening to orchestrate the ACE+TAO+CIAOdaily build and regression test process with 200+ machinescontributed by users and developers worldwide, as shown onour online DCQA scoreboard at www.dre.vanderbilt.edu/scoreboard.
APPENDIX
The screening designs used in Section IV-C were calculatedusing the SAS statistical package (www.sas.com).|k} ng~ X is a � )u&(' ¢+-, with design generators {Z1 $7698
, £Z1$76 % ,� 1 $?8 % , EW1 698 % , z¤1 $?6 ; , ¥¦1 $@8 ; ,�§1 698 ; , :¨1 $ %=; , F©1 6 %S; .|k} n � & is a � )�&(' �+-, with design generators £ª1 $?6L8
,� 1$76 % , EH1 $76 ; , z«1 $?8 %=; , ¥¬1 $76 { , �1 $@8 %={ ,:®1 $?8 ;I{ , F¯1 $ %S;N{ .|k} n ) X�� is a � )u&�'m�+-, with design generators
� 1 $?6L8, E§1$76 %=; , z°1 $76 %={ , ¥51 $@8 ;N{ , � 1 $@8 %=£ , : 1$76 ;N{]£ , F©1 698 %=;N{]£ .
The screening designs used in Section IV-D were calculatedusing the SAS statistical package (www.sas.com).It is a � )�&(' ~,e+ (2048-run) design with design generators�ª1 $7698 %=;N{]£ � E�ze¥ , : 1¬;N{]£ � E�ze¥ , and F±18 %=£ � E�ze¥ .
ACKNOWLEDGMENT
This material is based on work supported by the USNational Science Foundation under NSF grants ITR CCR-0312859, CCF-0447864, CCR-0205265, and CCR-0098158,as well as funding from BBN, Cisco, DARPA, LockheedMartin Advanced Technology Lab and Advanced TechnologyCenter, ONR, Qualcomm, Raytheon, and Siemens. We thankthe anonymous reviewers for their comments that helpedimprove this paper.
REFERENCES
[1] “SAS Institute,” www.sas.com/.[2] K. Balasubramanian, A. Gokhale, G. Karsai, J. Sztipanovits, and
S. Neema, “Developing applications using model-driven design envi-ronments,” IEEE Computer, vol. 39, no. 2, pp. 33–40, 2006.
[3] G. E. P. Box, W. G. Hunter, and J. S. Hunter, Statistics for Experi-menters. New York: John Wiley & Sons, 1978.

IEEE TRANSACTIONS ON SOFTWARE ENGINEERING 17
[4] L. Breiman, J. Freidman, R. Olshen, and C. Stone, Classification andRegression Trees. Monterey, CA: Wadsworth, 1984.
[5] R. Brownlie, J. Prowse, and M. S. Padke, “Robust testing of AT&TPMX/StarMAIL using OATS,” AT&T Technical Journal, vol. 71, no. 3,pp. 41–7, 1992.
[6] K. Burr and W. Young, “Combinatorial test techniques: Table-basedautomation, test generation and code coverage,” in Proceedings of theIntl. Conf. on Software Testing Analysis & Review, 1998.
[7] B. Childers, J. Davidson, and M. Soffa, “Continuous Compilation: ANew Approach to Aggressive and Adaptive Code Transformation,” inProceedings of the International Parallel and Distributed ProcessingSymposium, Apr. 2003.
[8] S. R. Dalal, A. Jain, N. Karunanithi, J. M. Leaton, C. M. Lott, G. C.Patton, and B. M. Horowitz, “Model-based testing in practice,” inProceedings of the Intl. Conf. on Software Engineering, (ICSE), 1999,pp. 285–294.
[9] I. S. Dunietz, W. K. Ehrlich, B. D. Szablak, C. L. Mallows, andA. Iannino, “Applying design of experiments to software testing,” inProceedings of the Intl. Conf. on Software Engineering, (ICSE ’97),1997, pp. 205–215.
[10] J. Grundy, Y. Cai, and A. Liu, “Generation of Distributed SystemTest-beds from High-level Software Architecture Description,” in 16²_³
International Conference on Automated Software Engineering, LinzAustria. IEEE, Sept. 2001.
[11] W. Kolarik, Creating Quality: Systems, Concepts, Strategies and Tools.McGraw-Hill Education, 1995.
[12] A. S. Krishna, A. Gokhale, D. C. Schmidt, V. P. Ranganath, andJ. Hatcliff, “Model-driven Middleware Specialization Techniques forSoftware Product-line Architectures in Distributed Real-time and Em-bedded Systems,” in Proceedings of the MODELS 2005 workshop onMDD for Software Product-lines, Half Moon Bay, Jamaica, Oct. 2005.
[13] A. S. Krishna, D. C. Schmidt, A. Porter, A. Memon, and D. Sevilla-Ruiz,“Improving the Quality of Performance-intensive Software via Model-integrated Distributed Continuous Quality Assurance,” in Proceedingsof the 8th International Conference on Software Reuse. Madrid, Spain:ACM/IEEE, July 2004.
[14] A. S. Krishna, N. Wang, B. Natarajan, A. Gokhale, D. C. Schmidt, andG. Thaker, “CCMPerf: A Benchmarking Tool for CORBA ComponentModel Implementations,” in Proceedings of the 10th Real-time Technol-ogy and Application Symposium (RTAS ’04). Toronto, CA: IEEE, May2004.
[15] D. Kuhn and M. Reilly, “An investigation of the applicability of designof experiments to software testing,” Proceedings 27th Annual NASAGoddard/IEEE Software Engineering Workshop, pp. 91–95, 2002.
[16] A. Ledeczi, A. Bakay, M. Maroti, P. Volgysei, G. Nordstrom, J. Sprinkle,and G. Karsai, “Composing Domain-Specific Design Environments,”IEEE Computer, pp. 44–51, Nov. 2001.
[17] Y. Liu, I. Gorton, A. Liu, N. Jiang, and S. Chen, “Designing a Test Suitefor Empirically-based Middleware Performance Prediction,” in 40
²µ´International Conference on Technology of Object-Oriented Languagesand Systems, Sydney Australia. Australian Computer Society, Aug.2002.
[18] C. Lu, J. A. Stankovic, G. Tao, and S. H. Son, “Feedback Control Real-Time Scheduling: Framework, Modeling, and Algorithms,” Real-TimeSystems Journal, vol. 23, no. 1/2, pp. 85–126, July 2002.
[19] R. Mandl, “Orthogonal Latin squares: an application of experimentdesign to compiler testing,” Communications of the ACM, vol. 28, no. 10,pp. 1054–1058, 1985.
[20] A. Memon, A. Porter, C. Yilmaz, A. Nagarajan, D. C. Schmidt, andB. Natarajan, “Skoll: Distributed Continuous Quality Assurance,” in Pro-ceedings of the 26th IEEE/ACM International Conference on SoftwareEngineering. Edinburgh, Scotland: IEEE/ACM, May 2004.
[21] A. M. Memon, M. E. Pollack, and M. L. Soffa, “Hierarchical guitest case generation using automated planning,” IEEE Transactions onSoftware Engineering, vol. 27, no. 2, pp. 144–155, February 2001.
[22] T. Mitchell, “An algorithm for the construction of the ’d-optimal’experimental designs,” Technometrics, vol. 16, no. 2, pp. 203–210, 1974.
[23] D. C. Montgomery, Introduction to Statistical Quality Control, 3rd ed.New York: John Wiley & Sons, 1996.
[24] Robert Ricci and Chris Alfred and Jay Lepreau, “A Solver for theNetwork Testbed Mapping Problem,” SIGCOMM Computer Commu-nications Review, vol. 33, no. 2, pp. 30–44, Apr. 2003.
[25] D. C. Schmidt, “Model-driven engineering,” IEEE Computer, vol. 39,no. 2, pp. 25–31, 2006.
[26] D. C. Schmidt, M. Stal, H. Rohnert, and F. Buschmann, Pattern-OrientedSoftware Architecture: Patterns for Concurrent and Networked Objects,Volume 2. New York: Wiley & Sons, 2000.
[27] J. W. Tukey, Exploratory Data Analysis. Reading, Massachusetts:Addison-Wesley, 1977.
[28] E. Turkay, A. Gokhale, and B. Natarajan, “Addressing the MiddlewareConfiguration Challenges using Model-based Techniques,” in Proceed-ings of the 42nd Annual Southeast Conference. Huntsville, AL: ACM,Apr. 2004.
[29] B. White and J. L. et al, “An Integrated Experimental Environmentfor Distributed Systems and Networks,” in Proceedings of the FifthSymposium on Operating Systems Design and Implementation. Boston,MA: USENIX Association, Dec. 2002, pp. 255–270.
[30] C. F. J. Wu and M. Hamada, Experiments: Planning, Analysis, andParameter Design Optimization. Wiley, 2000.
[31] C. Yilmaz, M. Cohen, and A. Porter, “Covering arrays for efficient faultcharacterization in complex configuration spaces.” in ISSTA, 2004, pp.45–54.
[32] C. Yilmaz, M. B. Cohen, and A. Porter, “Covering arrays for efficientfault characterization in complex configuration spaces,” IEEE Transac-tions on Software Engineering, vol. 31, no. 1, pp. 20–34, Jan. 2006.
[33] C. Yilmaz, A. S. Krishna, A. Memon, A. Porter, D. C. Schmidt,A. Gokhale, and B. Natarajan, “Main effects screening: a distributedcontinuous quality assurance process for monitoring performance degra-dation in evolving software systems,” in ICSE ’05: Proceedings of the27th international conference on Software engineering. New York, NY,USA: ACM Press, 2005, pp. 293–302.
[34] K. Yotov, X. Li, G. Ren, M. Cibulskis, G. DeJong, M. Garzaran,D. Padua, K. Pingali, P. Stodghill, and P. Wu, “A Comparison of Empir-ical and Model-driven Optimization,” in Proceedings of ACM SIGPLANconference on Programming Language Design and Implementation, June2003.
[35] R. Zhang, C. Lu, T. Abdelzaher, and J. Stankovic, “Controlware: A Mid-dleware Architecture for Feedback Control of Software Performance,”in Proceedings of the International Conference on Distributed Systems2002, July 2002.
Cemal Yilmaz Cemal Yilmaz earned his B.S. andM.S. degrees in Computer Engineering and Infor-mation Science from Bilkent University, Ankara,Turkey in 1997 and 1999, respectively. In 2002and 2005 he earned his M.S. and Ph.D. degrees inComputer Science from the University of Marylandat College Park.
He is currently a post-doctoral researcher atthe IBM Thomas J. Watson Research Center,Hawthorne, New York, where he works in the fieldof software quality assurance.
His current research interests include automated fault localization, perfor-mance modeling and optimization, distributed and adaptive quality assurance,formal methods in testing, and highly configurable systems.
Dr. Yilmaz is a member of the ACM and IEEE Computer Society.
Adam Porter Adam A. Porter earned his B.S.degree summa cum laude in Computer Science fromthe California State University at Dominguez Hills,Carson, California in 1986. In 1988 and 1991 heearned his M.S. and Ph.D. degrees from the Univer-sity of California at Irvine.
Currently an associate professor, he has beenwith the department of Computer Science and theInstitute for Advanced Computer Studies at theUniversity of Maryland since 1991. He is a winnerof the National Science Foundation Faculty Early
Career Development Award and the Dean’s Award for Teaching Excellencein the College of Computer, Mathematics, and Physical Sciences.
His current research interests include empirical methods for identifyingand eliminating bottlenecks in industrial development processes, experimentalevaluation of fundamental software engineering hypotheses, and developmentof tools that demonstrably improve the software development process.
Dr. Porter is a senior member of the ACM and IEEE.

IEEE TRANSACTIONS ON SOFTWARE ENGINEERING 18
Arvind S. Krishna Arvind S. Krishna is a se-nior engineer at Qualcomm where he is currentlyworking on wireless broadband networks. Prior toQualcomm, Arvind has worked on building dis-tributed object computing middleware and tech-niques for middleware customization. His interestsinclude design patterns, design of flexible and cus-tomizable middleware and model driven develop-ment techniques. He received Masters and PhD inComputer Science from University of California,Irvine and Vanderbilt University. Contact him at
Atif Memon Atif M. Memon is an Assistant Pro-fessor at the Department of Computer Science,University of Maryland. He received his BS, MS,and Ph.D. in Computer Science in 1991, 1995,and 2001 respectively. He was awarded a GoldMedal in BS. He was awarded Fellowships from theAndrew Mellon Foundation for his Ph.D. research.He received the NSF CAREER award in 2005. Hisresearch interests include program testing, softwareengineering, artificial intelligence, plan generation,reverse engineering, and program structures. He is a
member of the ACM and the IEEE Computer Society.
Douglas C. Schmidt Dr. Douglas C. Schmidt isa Professor of Computer Science and AssociateChair of the Computer Science and Engineeringprogram at Vanderbilt University. He has publishedover 300 technical papers and 8 books that covera range of research topics, including patterns, op-timization techniques, and empirical analyses ofsoftware frameworks and domain-specific modelingenvironments that facilitate the development of dis-tributed real-time and embedded (DRE) middlewareand applications running over high-speed networks
and embedded system interconnects.
Aniruddha Gokhale Dr. Aniruddha S. Gokhale([email protected]) is an Assistant Professorin the Electrical Engineering and Computer ScienceDepartment, and a Senior Research Scientist at theInstitute for Software Integrated Systems (ISIS),both at Vanderbilt University, Nashville, TN, USA.Dr. Gokhale received his Bachelor of Engineering(B.E., Computer Engineering) from University ofPune, Pune, India in 1989; Masters of Science (M.S.,Computer Science) from Arizona State University,Tempe, AZ in 1992; and Doctor of Science (D. Sc.,
Computer Science) from Washington University, St. Louis, MO in 1998. Dr.Gokhale’s research interests are in real-time component middleware opti-mizations, model-driven engineering applied to component middleware-basedapplications, and distributed resource management. Dr. Gokhale is heading theR&D efforts on an open source model driven engineering framework calledCoSMIC (www.dre.vanderbilt.edu/cosmic). He is a member of the ACM andIEEE Communications Society.
Balachandran Natarajan Balachandran Natarajanis a Senior Principal Software Engineer at Syman-tech, India. Prior to his current position, he was aSenior Staff Engineer with the Institute for Soft-ware Integrated Systems at Vanderbilt University,Nashville, TN. Mr. Natarajan has also worked asa software consultant developing software and toolsfor CAD, CAM and CAE applications. He has a M.Sin Computer Science from Washington University inSt. Louis, MO, USA.