Embed Size (px)
Citation preview

Reliabilityweb.com® and Uptime® Magazinepresent
vibrationViB
motortesting
Mt
ultrasounduS
infraredthermalimaging
iR
oil analysisOa
Asset Health
Management
Kpireliability
performancemetrics
reliabilitycentered
maintenance
Rcmroot cause
analysis
Rca
pm
optimization
PmO
reliability
engineering
Reoperator
driven
reliability
OdR
planning andscheduling
Pshuman
asset
managment
HaM
maintenance
managementMm
maintenancesupervision
Ms
mro-spares
management
MrO
Reliability Engineering
for Maintenance
Work Execution
Management
Foundational Elements
for Reliabilityalignment and
balancing
A/B
lubricationLu
computerized
maintenance
management system
cMms
competency based
training
CbT
decision support
software
Dss
failure modes effects analysis
FmEA
integrityINt
executive reliability
leadership
ErL
Elements™
MacBook Air
and
a 70" HDTV
During conference
all IMC-2012 attendees
have a chance to win a
Updated
Register
3 get the
4th FREE
Hurry offer expires October 31st
Uptime Elements – your system for
high-performance reliability. Learn it at IMC-2012!
The 27th International Maintenance Conference
December 4-7, 2012Hyatt Regency Coconut Point Resort • Bonita Springs, FL • www.imc-2012.com
Buy 3 get 1 FREE
and all 4 get an
Apple TV
Click Here to Download
16-page Brochure

oct/
nov1
2
the magazine for maintenance reliability professionals
uptimemagazine.com
®
Top 5List
Take Charge... Get on Your CEO’s
ISO-55000 Asset Management Standard
Are You Ready?


The Emerson logo is a trademark and a service mark of Emerson Electric Co. © 2012 Emerson Electric Co.
Integrated protection and prediction so you can trust your start-up decisions.While other systems take snapshots of events, the CSI 6500 Machinery Health Monitor continuouslymonitors your critical turbomachinery and provides predictive diagnostics to improve availability. Feelconfident that you will never miss an event. The CSI 6500 is fully compliant with API 670. Scan the codebelow or visit EmersonProcess.com/Protect to learn more.
I trust my protection system with mypersonnel and equipment every day.When it trips, I need to be confidentthat I can bring the unit back up safely.
Seatbelt_PrintAd_08May12_9x10.875_AD 5/8/2012 11:21 PM Page 1

Contents oct/nov12
[email protected] • www.SoltecCorp.comTel: (800) 423-2344 Ext. 411 • (818) 365-0800 Ext. 4118) 365-0800 Ext. 411
Infrared
New ReleaseThermal Imager with
Enhanced Performance
4 & 8 Channel Plus Logic High-Speed Portable Data Acquisition
• Measures up to 1500°C (2,732°F)• Resolution: 0.04°C • Radiometric Infrared Video Recording (G120EX)
• Vibration Alarm (G120EX)
• Panoramic Thermal Images (G120EX)
G100EX/G120EX IR Camera
• Voltage, Temperature & Logic• Data Sampling to 1μs/sample
• AC, DC & Internal Battery Power • Built Tough for Temp/Dust/Drop/Shock
• Color Touch Screen• Onboard SD Card Memory
Sensor
TheEnha
• Measures up to 1500°C (2,732°F)
IR CamG100EX/G120EX I
an NEC Group Company
RM1100Data
Acquisition & Recorder

3oct/nov12
Contents oct/nov12
14ISO-55000 Viewpoint and Top 10 Reasons
Why We Should Rethink the Use and Purpose of Asset Management Standards
18 Case Study: Cintas Discovers Keys
to Organizational Change Through CMMS Rollout
22Understanding Infrared (IR)
Windows and Their Effects on IR Readings
327 days to Better
Equipment Reliability
36How to Develop a Spare Parts
Stocking Strategy
40Improving the Reliability of a
Turbofan Jet Engine Part 2
42DOs & DON’Ts of Effective
Maintenance Planning
Questions to Ask....
46 Modernizing Maintenance
Practices - What We Can Learn from Marine Applications
4810 Steps to Pump Reliability - Part 1
52The True Cost of Poor
Lubrication
56Understanding the Rate of Change
Dangers with Alarms
60Nine Drops Are for Cooling
Elements
Features4 Editorial
8 Take Charge... Get On Your
CEO’s Top 5 List! Expert Drew Troyer explains why reliability is good business.
28Operator-Driven Reliability Best
Practices Series: “We only want operators who ALREADY know how to do their job.” 8
Work Execution
Management
computerized maintenancemanagement system
cMms
Asset Health
Management
infraredthermal imaging
iR
Work Execution
Management
mro-sparesmanagement
MrO
Reliability
Engineering for
Maintenance
reliabilityengineering
Re
Work Execution
Management
planning andscheduling
Ps
Asset Health
Management
alignment and balancing
A/B
Work Execution
Management
maintenancemanagement
Mm
lubrication
LuAsset Health
Management
Asset Health
Management
oil analysis
Oa
Asset Health
Management
vibration
ViB
Taking the CMRP Exam? See Page 59 for the 5 Must-Have Books to Get You Prepared !
22
60
Work Execution
Management
maintenancemanagement
Mmasset health
management
AhM
62Q&A Uptime Magazine’s
Steve Thomas recently caught up with Henry Ellmann to discuss his keynote address at IMC-2012.
64Book Review
Centered on Excellence

4 oct/nov12
PUBLISHER/EDITOR Terrence O’Hanlon
CO-PUBLISHER Kelly Rigg O’Hanlon
EDITOR Jenny Brunson
CONTRIBUTING WRITERS Tom Dabbs, Shane Daniel,
Robert Eisenmann, Grahame Fogel, Kris Goly, Tim Goshert,
Tony Holliday, Jeff Keen, Jason Kopschinsky, Paul Michalicka,
Gene Pargas, Dan Pereira, Ricky Smith, Matt Spurlock, Dave Staples, Steve Thomas,
Drew Troyer, Larry Tyson
VP OF SALES AND PUBLISHING Bill Partipilo
ART DIRECTOR Nicola Behr
DESIGNERS Justine Lavoie
Sara Soto
SUBSCRIPTIONS/CIRCULATON Lili Black
EDITORIAL INFORMATION
Please address submissions of case studies, procedures, practical tips and other
correspondence to Terrence O’Hanlon
SUBSCRIPTIONS To subscribe to Uptime Magazine, log on to
www.uptimemagazine.com For subscription updates
Uptime Magazine PO Box 60075, Ft. Myers, FL 33906
1-888-575-1245 • 239-333-2500 • Fax: 309-423-7234 www.uptimemagazine.com
Uptime Magazine is a founding member of
Uptime® (ISSN 1557-0193) is published bimonthly by Reliabilityweb.com, PO Box 60075, Ft. Myers, FL 33906, 888-575-1245. In the U.S., Uptime is a registered trademark of Reliabilityweb.com. No part of Uptime may be reproduced in any form by any means without prior written consent from Reliabilityweb.com. Uptime is an independently produced publication of Reliabilityweb.com. The opinions expressed herein are not necessarily those of Reliabilityweb.com. Copyright© 2012 by Reliabilityweb.com. All rights reserved.
POSTMASTER: Send address changes to: Uptime Magazine, PO Box 60075, Ft. Myers, FL 33906
®
Where Is Reliability Made?
In China of course! Isn’t everything made in China these days?
Fortunately or unfortunately, cheap imported reliability is NOT flooding the market from China. The strategies, tech-niques, technologies, tactics and tools for high performance maintenance reliabil-ity are well documented for the past 30 years, yet many companies still struggle with the reliability journey.
You cannot buy reliability, or your com-pany would have written the check long ago because everyone wants it. The fact is, you have to earn reliability. It takes do-ing the right kind of work on the right equipment at the right time in the right way, which is very difficult when you have complex machinery and systems. Add the normal human elements of the people in your workforce and it gets even more challenging.
Over the past 10 years, we have seen a strong correlation between Executive Reliability leadership that has communi-cated the company mission, vision, plans and goals, and high performance reliabil-ity programs.
Inspired by the breakthrough work of Werner Erhard, we define integrity as a state or condition of being whole, com-plete, unbroken, unimpaired, sound, per-fect condition. We distinguish integrity as a matter of a person’s (or an organiza-tion’s) word being whole and complete. One’s word is whole and complete when one honors one’s word. There is a differ-ence between keeping one’s word and honoring one’s word. Honoring your word means you either keep your word, or as soon as you know you will not, you say that you will not and clean up any mess you cause by not keeping your word. Thus, even when you do not keep your word, you have a way to maintain your integrity.
Integrity is an important aspect of reli-ability. You are reliable when you do what you say you are going to do. You are unre-liable when you don’t.
Reliability is not possible when Execu-tive Leadership does not have the integ-rity of their word. Watch for more on this topic from me soon…
For another interesting take on the relationship of your company executives
to reliability, please check out the cover feature by thought leader extraordinaire, Drew Troyer. With the business case he makes, you may be able to get reliability on your CEO’s priority list, or at least his radar screen.
On another note, I am desperately seeking proof that anyone ever reads my thoughts in this editorial. In order to in-validate my fears that my copy editor is the only one reading this, I am offering a free iPad to the first person who emails me the correct sum of all numbers included in article titles in this issue of Uptime Maga-zine. (Copy editors are prohibited from en-tering.) If you win, you are required to send us a photo of you smiling and holding your new iPad in one hand and Uptime Maga-zine in the other for publication in the next issue so everyone knows who won. The next 24 people who email me the correct reply will get an Uptime Magazine hat (USA only). Good luck. I am not holding my breath that anyone will read this, but I secretly hope you do.
For all of you who have been following my progress as I recover from Guillain-Barre Syndrome, I am feeling great and have a renewed focus on the Reliabilityweb.com mission of making maintenance reliability leaders safer and more successful. I hope my best contributions are yet to come.
Thank you to everyone who joins me and supports Reliabilityweb.com in its mission to make maintenance reliability professionals safer and more successful.
Warmest regards,
Terrence O’Hanlon, CMRPCEO/PublisherUptime® MagazineReliabilityweb.comReliability Performance Institute
Editorial

Bringing more to the tableGE Energy’s Bently Nevada* business has added Commtest to its growing portfolio of innovative condition monitoring technologies, offering customers an extended menu of products and services that will enhance an already robust lineup.
Commtest is a leading supplier and designer of machinery health information systems that provide highly reliable and accurate condition monitoring throughout your plant—a natural fit with GE’s Bently Nevada product line of world-class condition monitoring instrumentation and machinery protection for refineries, petrochemical plants, power plants, wind farms, and more.
From upgraded capabilities in portable data collection and vibration analysis to new possibilities in software applications and wireless technology, GE can now provide a fully integrated condition monitoring solution across your entire plant—and our combined offering is backed by more than 70 years of industry expertise.
Visit www.ge-mcs.com/bently to see our recipe for condition monitoring success.
GE Measurement & Control
*Trademark of the General Electric Company.

MaintenanceForums.com
Posted 21 August 2012 09:51 AM - We ran a 300 Hp gearbox for approx 1.5 hours without oil. Some babitt material melted and the gears were black and deep purple. The gears were plasma nitrided from the mfg. Do you think we have a chance re-using the gears or have they been tempered and softend? I am sending them out for hardness test after we do a magnaflux crack check. Engle
Posted 21 August 2012 10:23 AM - Have the gear set inspected. Check the tooth profile, etc. Good luck. Jfrench
Posted 21 August 2012 10:41 AM - Where do you send the gears out to? Is it to the OEM for possible refurbishment? Josh
Posted 22 August 2012 07:44 AM - Bill who would be the expert in this case? The gearbox OEM? Myself as the engineer charged with getting this unit re-paired or replaced. Or my boss (the man with the money)? This unit was supposed to be lubricated with oil but the pump was not turned on. The safety system was also disabled allowing the machine (dynamometer) to run without oil. We are not a 24/7 heavy industrial mfg, we are an automotive powertrain mfg with a few dynos---we dont have a dedicated staff to look after our equipment. We have a very rudimentary PM program in infant stage. Engle
Posted 21 August 2012 11:02 AM - OEM is best choice for inspection, although many are no longer in business. Very dependent on location, here in the States we have several quality gear establishments and even OEM’s that will work on and reverse engineer gears made by other vendors. Having said all that, if anything is marginal most gear houses will say to replace the gearing rather than stick their neck out by saying it is OK. You are doing the right thing in having the gears checked for hardness. You might also put the casing on a machined surface and check bores for parallelism, etc. Do this especially if the casing is a weldment. You may have suffered some distortion. John from PA
Posted 22 August 2012 05:44 AM - On this new oil free gear, get the expert input and see that the correct call is made. The correct call may be tough economically, but someone gets paid to make these decisions. This decision may not be made at your level. Bill
Posted 23 August 2012 09:56 PM - This was an epicyclic gearbox in the star configuration. There was a 0-3000 rpm AC motor driving the low speed side and the output was 0-15,000 rpm. Results from the materials lab....gears are down to 52HRC. They started at HRC62. We are going to scrap the gearbox. Engle
Posted 22 August 2012 09:48 AM - The OEM may be best in this list or yourself. Outside experts? Materials and processing engineers, in house? Sounds like the job for an electrical type?? ‘The safety system was also disabled’ Not the first time this hard learned leason was taught. Bill
20+ years of providing over 25,000 maintenance professionals a place to share knowledge, discuss issues and ask questions.
Here is just one recent discussion: The gearbox that ran without oil...
Copyright © 2012 Reliabilityweb.com • All rights reserved.
Join Today! MaintenanceForums.com
Deepest knowledge sharing site on the web for maintenance-focused information. Some of the best in the industry involved in discussions and offering advice.
#1 maintenance focused web site in the world in terms of web traffic.

MaintenanceForums.com

8 oct/nov12
Top 5List
Take Charge... Get on Your CEO’s
HR: “Skilled workers
are so hard to find.”
New Division Vice President:
“I can make deep cuts in the maintenance budget and look
like a hero.”
Sustainability Manager:
“We have done all the easy things to save energy. Now what?”
Operations Manager:
“I’ll never meet my production goals with so much downtime.”
1. Stock Price
2. Stock Price
3. Stock Price
4. Stock Price
5. Stock Price
5. Reliability

9oct/nov12
Drew D. Troyer
I spent the first half of my career as a reliability engineer focused on the nuts and bolts: condition monitoring, precision maintenance, etc. About 12 years ago, I dusted off my MBA (circa 1989) and began to focus on the real hurdle - getting the CEO and CFO on board to identify equipment as-set reliability management (EARM) as a strategy and a valuable and con-trollable differentiating factor for the business.
In some respects, I’ve morphed into a “reliability economist” because I had figured out if EARM doesn’t rise to a policy level, our time is spent bit-ing around at the edges of the true opportunity to produce lackluster and often fleeting benefits for the organization.
CFO: "I wish we could find a way to lower costs and increase production." Purchasing:
“Our spare parts cost is
out of control.”
Maintenance Manager:
"I need to learn to speak business."
CEO: "I hope I can find a way to move the stock price up and make my bonus."
executive reliability
leadership
ErLFoundational
Elements for
Reliability

10 oct/nov12
EARM – Effects on Your Income Statement, Balance Sheet and Share Price
At some level, a majority of manufacturing and process industry companies are imple-menting productive and efficient business strat-egies, which are an adaptation of the famed Toyota Production System (TPS). In a nutshell, productive and efficient business is simply the act of maximizing production and minimizing costs over the lifecycle of the business process and avoiding stupid things that compromise ei-ther goal. Productive and efficient business has many tentacles – some are simple and some are complex – but at its core, it has the following objectives:• Maximize Availability – Expressed as a per-
centage, availability is the number of hours the plant or the machines are operating di-vided by the number of available hours. If a manufacturing line runs 7,000 hours in a year and there are 8,760 hours in the year, the availability factor is 79.9 percent.
• Maximize Yield – Also expressed as a percent-age, yield is the average production rate divided by the design rate or the best dem-onstrated rate. So, if the manufacturing line is running at 800 widgets per hour and it’s designed to make 1,000 per hour, the yield factor is 80 percent.
• Maximize Quality – Also expressed as a per-centage, quality is the percentage of produc-tion that’s first-pass “A” quality, meaning it can be sold at list price without any rework or scrap. It’s measured simply as the number of first-pass “A” quality production divided by total production. So if, on average, 750 of the 800 items produced per hour are “A” quality, the quality factor is 93.8 percent.
• Minimize Inventory – Inventory is a method to mitigate the risk of unreliable operations and supply chain. Inventory is wasteful and costly. Whether the inventory is raw material, work in process (WIP), finished goods, maintenance and repair parts, critical spares, or redundant systems inventory, carry costs range from 20 percent to 30 percent of inventory value per year. Carrying costs include the costs of capital, space, handling, insurance, degradation, pilfer-age, obsolescence, etc. – it really adds up.
W hether you make paper, generate power, process chemicals, produce food and beverages, or manufacture steel, aluminum, tires, or other products, if you depend on equipment as-sets to deliver value to your shareholders and other stakeholders, the reliability of that
equipment must be on your top five executive priority list. Here, we’ll discuss how EARM system de-ployment enables productive and efficient manufacturing and business strategies from the perspec-tive of the CEO and CFO. More specifically, we’ll link EARM to a healthy income statement, a lean balance sheet and managed risk, which in turn drives maximized return on net assets (RONA) and
eventually, share price. Lastly, we’ll discuss the framework you need for achieving success in language that’s familiar to your CEO, CFO and other non-technical stakeholders in the process.
Figure 1: Income statement comparison of lower quartile, average and upper quartile EARM performers. EBITDA - Earnings Before Interest, Taxes, Depreciation and Amortization (net profit before all the accounting adjustments for tax purposes).
Figure 2: The upper quartile performer produces even when sales are constrained.

11oct/nov12
• Minimize Transfer and Conveyance – Transfer and conveyance fail to add any value to pro-duction, but add a lot of cost in the form of manpower requirements, increased likeli-hood of mistakes, time as inventory, paper-work, overhead, etc.An important metric in productive and effi-
cient manufacturing is overall equipment effec-tiveness (OEE), which is the product of availabil-ity x yield x quality. Simply stated, OEE represents our performance compared to perfection. So if our availability factor is 79.9 percent, our yield factor 80 percent and our quality factor 93.8 percent, our OEE equals 60 percent.
So what’s it worth to you to increase the OEE of your manufacturing or process plant? And, what’s reliability got to do with it? The answer to these questions is simple – A LOT! The Aberdeen Group completed a benchmark study1 about equipment asset management. They bench-marked lower, average and upper quartile per-formers on equipment asset availability, yield and maintenance costs as a percentage of sales. They found that leading companies enjoyed an 8.5 percent increase in production availability, a 6.3 percent increase in production yield and a 26.8 percent reduction in maintenance costs as a percentage of sales compared to lagging com-panies. Their results are summarized in Figure 1. Intrigued, I wondered what would happen to the firm’s income statement if a lower (25th) percentile performer adopted the practices of an upper percentile (75th) performer. The results are impressive. If the lower quartile performer adopts the average performer’s business prac-tices, sales increase by about 10 percent, but profit increases by 72 percent. By adopting the upper quartile performer’s business practices, sales increase by 15 percent, but profit increases by 151 percent (Figure 1)! That’s the profit im-pact from more effectively leveraging a heavily fixed equipment asset dependent firm – that’s the impact of efficient and reliable operations!
Unfortunately, we can’t always sell every-thing we make. So what if your plant is not in a sold-out position? EARM is still a major success factor and market differentiator for your organi-zation. To illustrate the point, I fixed sales in my example model at $1 billion for the lower, aver-age and upper quartile performers. By lowering operating costs, the upper quartile performer produces nearly double the profits of the lower quartile performer under the sales-constrained scenario (Figure 2).
Occasionally, markets experience a major downturn. In these instances, not everyone survives. You’ve heard that only the strong survive. But when it comes to plants, strong is analogous to efficient and reliable. The efficient and reliable operator is much better positioned to survive a major downturn. For our last sce-nario, I fixed the sales at $600 million, which is just under the break-even point for the lower quartile performer in our simple analysis. Un-der these market conditions, the lower quartile performer generates a $1 million loss, while the upper quartile performer earns a $36 million profit (Figure 3). While this is a far cry from the $251 million profit during the good times, it sure beats bleeding red ink. Incidentally, in our
scenario, the upper quartile performer could see sales drop below $450 million before expe-riencing red ink. At this level, the lower quartile performer would be losing about $30 million.
Yes, the analysis is simple and very linear. And yes, it presumes we can linearly scale our opera-tions up and down to meet market demands. The simple point we are trying to illustrate is that the upper quartile performer makes more money during the good times and better en-dures the down markets. So, how does a sound
equipment asset reliability management policy result in a strong income statement? It’s really very simple: if the equipment assets aren’t reli-able, availability suffers. If they’re always break-ing down and in need of repair, the equipment assets can’t be producing as intended. Also, when the equipment assets aren’t reliable, we tend to be forced to run them at slower speeds, reducing throughput or yield. And, as you might imagine, if the equipment assets aren’t running and producing, they’re down getting repaired, so we’re spending more on maintenance labor and parts. Focusing on the proactive aspects of equipment asset reliability management un-leashes the production potential of our equip-ment assets and simultaneously reduces main-tenance costs – a winning combination on the income statement.
Upper quartile EARM practices surely make the income statement look good, but what about the balance sheet? Productive and ef-ficient operators run a lean balance sheet. It’s tough to maintain a lean balance sheet when the equipment assets aren’t reliable. A major tenet of productive and efficient manufactur-ing is “just-in-time” (JIT) inventory, where in-ventory arrives just as it’s required. When the equipment assets are unreliable, we see a swell-ing of JIT inventory. We maintain large stocks of raw material, work-in-process (WIP), finished goods, maintenance and repair parts, critical spares and redundant systems “just in case” something goes wrong. This practice, which is a by-product of poorly managing the inherent reliability of our manufacturing equipment as-sets and processes, leads to a swelling of the balance sheet, which negatively affects RONA.
An important metric in productive and efficient manufac-turing is overall equipment effectiveness (OEE), which is the product of availability x yield x quality. Simply stated, OEE
represents our performance compared with perfection.
Figure 3: The upper quartile performers remain profitable even though the market’s turned down.

12 oct/nov12
While not measured directly in the Aberdeen study, we can make a few assumptions in our simple analysis regarding the net operating asset in place (NOAP), which is the sum of the plant’s replacement asset value (RAV), inventory and cash. For our purposes, we’ve assumed that the average performer requires five percent less NOAP than the lower quartile performer. Like-wise, we’ve assumed that the upper quartile performer requires 10 percent less NOAP than the lower quartile performer. Based upon these assumptions, the upper quartile performer in our scenario has a RONA that’s nearly three times higher than that of the lower quartile per-former (Figure 4). Since RONA, sometimes called “management effectiveness,” is the primary driver in attracting investors to the firm’s stock and is typically utilized to calculate economic value add (EVA), which is commonly employed for determining payout in executive bonus and stock option schemes, this relationship should be very compelling.
Ultimately, it all comes down to share price. Share price is a function of earnings per share (EPS) multiplied by the price to earnings ratio (the multiple of earnings the market is willing to pay for a share of your company’s stock). In our scenario, we’ve assumed 25 million shares outstanding. The lower quartile performer pro-duces and EPS of $2.60. It’s $4.47 for the aver-age performer and $6.53 for the upper quartile performer. The price to earnings (P/E) ratio is assumed to be 12 for the lower quartile per-former. Because the P/E ratio is driven predomi-nantly by volatility, it’s assumed in our analysis
that the average performer achieves a P/E ra-tio of 12.5 and the upper quartile performer reaches 13. Based on these assumptions, the stock price for the upper quartile performer computes out at $85 per share in our scenario, versus $31 per share for the lower quartile per-former. Share price is where the rubber meets the road, so to speak.
The differences between the leaders and the laggards in terms of production availability and yield, and maintenance cost as a percent of sales are well researched, well established and clearly a function of the reliability of your equip-ment assets and production processes. In this
exercise, I’ve illustrated how adopting best-in-class equipment asset reliability management practices can influence the things that are re-ally important to you – profit, the balance sheet, RONA and share price. However, this is simply an illustrative exercise. I challenge you to fac-tor your OEE, maintenance costs, energy costs, inventory costs, etc., into an interactive version of your income statement and balance sheet. Then ask yourself, If we functioned as a top-tier efficient and reliable operator, how would it im-pact our income statement and balance sheet?
In turn, how would that impact RONA and our share price? I think you may be surprised by the results.
Now that we have a clear focus on the value proposition, let’s look at the practices that will enable you to achieve upper quartile perfor-mance in equipment asset reliability manage-ment.
Equipment Asset Reliability Management Best Practices
Overall equipment effectiveness (OEE) el-egantly measures the equipment asset-depen-dent firm’s performance relative to perfection. But how do we achieve the gains that separate the leaders from the laggards? Productive and efficient equipment asset reliability manage-ment isn’t a short-term, cost-cutting proposi-tion. Rather, it’s a cross-functional challenge that must be managed over the lifecycle of your equipment assets and manufacturing processes. In general terms, that life includes design, manufacturing, installation, commis-sion, operations, maintenance and disposal. We’re going to focus on design and commis-sion, operations and maintenance. To help illustrate the point, we’ll draw a parallel be-tween managing the health of equipment as-sets to managing the health of our own bod-ies –something with which we’re all familiar, including your CEO and CFO.• Design and Commission for Reliability – The in-
herent reliability, operability, maintainability, cleanability, flexibility and all the other “abili-ties” of an equipment asset are effectively defined during the design, manufacture, in-stallation and commissioning stages of the lifecycle. It’s the “DNA” of the machine. In the case of a human, DNA largely determines na-tive intelligence, how fast you can run, how tall you’ll be, your susceptibility to certain diseases and, ultimately, how long you’ll live. Sure, lifestyle management and the quality of
healthcare provided are important, but DNA is the major influencing factor in determining quantity and quality of life. We must design, manufacture, install and commission equip-ment to maximize value creation over the life-cycle of the asset. It’s easy to fall into the trap of “saving a buck” during this phase of the lifecycle, but we wind up spending multiples of what we saved in the form of increased maintenance and operations costs. Don’t fall into the trap of stepping over dollars to pick up pennies.
The simple point we are trying to illustrate is that the upper quartile performer makes more money during the
good times and better endures the down markets.
Figure 4: Reliability also drives return on net assets (RONA) and share price in a productive and efficient operation.

13oct/nov12
• Operate for Reliability – It may come as a sur-prise, but plants often operate equipment in ways that adversely affect its health and reli-ability. In humans, the risks associated with carrying excess weight, smoking, drinking too much, using dangerous drugs, etc., are very well publicized. Nevertheless, we contin-ue to get fatter and unhealthy practices con-tinue to persist. In the absence of knowledge, ignorance is an excuse. Here’s your wake-up call: improper operation of equipment assets has a deleterious effect on their performance and life expectancy, just as ignoring research
and warnings about obesity, smoking, exces-sive drinking and a sedentary lifestyle delete-riously affect the performance and life expec-tancy of a person. More often than not, we choose to operate equipment beyond its de-sign capabilities, defer maintenance, etc., just as we choose to carry extra weight, smoke, abuse our bodies and fail to seek out proac-tive healthcare support.
• Maintain for Reliability – We depend upon physicians and other healthcare profes-sionals to restore our bodies back to health when we’re sick, just as we depend upon maintenance professionals to repair bro-ken equipment. But there’s more. We also depend upon healthcare professionals to detect diseases early to reduce their impact and assure a speedy recovery. For instance, prostate cancer, if caught early, is very cor-rectable. If caught late however, it is deadly. In much the same way, we depend upon maintenance professionals to catch machine problems early, for the very same reasons – to minimize collateral damage and enable us to plan our actions. We also depend upon healthcare professionals to advise and help us maintain healthy cholesterol, blood pres-sure, weight, cardiovascular health and other conditions that, if left uncontrolled, increase the risk of disease. Similarly, we depend on maintenance professionals to do the same with our machines. If machines are properly balanced, aligned, tightened and lubricated with precision, the equipment enjoys a long, trouble-free life.Reliability engineering and management sys-
tems provide a time proven framework for man-aging the risk, reliability, availability, OEE and cost of operation of our machines and manufac-turing processes over the lifecycle. Conceived to ensure safety and reliability in commercial and military aviation, nuclear power plants and oth-er reliability-critical industries and applications, these systems are easily adapted and sized to fit
the needs of the manufacturing and process in-dustries, or any business for that matter. EARM system deployment enables you to transition your organization to the upper quartile of EARM performance. There are many tools, analytical methods and strategic frameworks associated with EARM system deployment (see Figure 5). Some will be applicable to your application, others will not. Details about the tools are be-yond the scope of this article, but suffice to say if these systems keep airplanes flying safely, they are sufficiently robust to meet your objectives for efficient, reliable and profitable operations.
ConclusionProductive and efficient equipment asset
reliability management (EARM) can materially affect your income statement, balance sheet, return on net assets (RONA) and share price. The difference in performance on key performance indicators is, according to research, stark by contrast. When one considers the implications of moving from lower quartile to upper quartile performance on the financial performance of an equipment asset-dependent manufacturing or process industry firm, management can’t stand idly by. Even a small improvement on overall equipment effectiveness (OEE) can dramati-cally improve your profitability. Moreover, the
improvements are gained by managing your current investment in plant by more effectively utilizing proven risk and reliability management tools and techniques. This results in a very cost-effective way to create distance between you and your competitors and satisfy the wants and requirements of your shareholders and other stakeholders. To achieve lasting benefits for EARM, your organization must raise the initia-tive to the policy level, much like quality and/or health, safety and environmental policies. To do so, you must convey the message to the CEO and CFO in their language – Dollars & $ense! Your challenge is to plug your current numbers into a financial model and then ask yourself what your income statement and balance sheet would look like if you closed the operational gaps that are preventing you from achieving top quartile performance. Give it a try; I think you’ll find the results startling!
Failure Repor,ng, Analysis and Correc,ve Ac,on System
(FRACAS)
Design for Reliability Operate for Reliability Maintain for Reliability
FMEA
Capability
Reliability
Operability
Maintainability
Lifecycle Cost Minimiza,on
Controlled Opera,on
Standardized Start-‐up/ Shutdown
Standardized Adjustment
Standardized Changeover
Single Minute Exchange of Die
Inspec,ons and Work ID
Precision Maintenance
Proac,ve Maintenance
Condi,on-‐Based Maintenance
Op,mimized Maintenance
Work Management
MRO Inventory Control
Productive and efficient equipment asset reliability management isn’t a short-term, cost-cutting proposition.
Drew D. Troyer, holds the CRE, CMRP and MBA qualifications to go along with more than 20 years in the trenches. Drew is the founding presi-dent of Sigma Reliability Solutions and the former co-founder and CEO of Noria Corporation. Drew currently
holds staff advisory positions as a reliability engi-neer in several manufacturing and process industry firms around the world. www.sigma-reliability.com
Reference:1. Shaw, M. and Littlefield, M. “Asset Performance Management: Aligning the Goals of CFOs and Maintenance Managers,” The Aberdeen Group, Boston, MA USA, 2009.
Figure 5: The tools of the trade for efficient and reliable manufacturing. In all instances, data and its systematic analysis drive decisions and policy.
The soon to be published International Standard for Asset
Management (ISO-55000) is based on the British Standards Institu-
tion PAS-55, which was originally developed to support asset man-
agers who deal in linear assets like rail systems, highways and bridges, water utilities and other infrastruc-
ture systems.
Before I write about what you can currently get from PAS-55 or what you can expect from ISO-55000, let’s explore how and
where maintenance reliability professionals can influence asset management. For the purpose of this article, physical assets are inferred unless noted.
Asset management is optimizing the lifecycle of an asset to deliver the performance specified by the asset owner in a safe, socially beneficial and environmentally responsible way. This by definition infers the management of both the upside and downside of asset related risk.
“The optimal combination of costs, asset re-lated risks and the performance and condition of assets and assets systems across the whole life cycle.” ISO-55000
Asset lifecycle can be simply defined1 as: 1. Create/acquire2. Utilize3. Maintain4. Renew/dispose
Create/Acquire Asset Management Phase
Maintenance reliability professionals should always participate in the needs analysis for new assets because they usually have a pretty good understanding of the capacity of existing assets. In many cases, existing assets are discovered to
be underutilized or are being operated under potential performance levels. Increasing per-formance of existing assets should always be in-vestigated prior to asking for scarce new capital investment.
Design engineers would do well to involve maintenance reliability professionals in the de-sign phase as well. Physical assets typically have an operate/maintain phase of 10 to 75 years, so a little extra effort to avoid poor quality and low maintainability will pay off.
Handoffs also should be carefully coordinat-ed so all asset information is captured in a for-mat that is useful to operators and maintainers.
Utilize/Maintain Phase“Delivering the best value for money in manage-
ment of physical assets is complex and involves careful consideration and trade offs between per-formance, risk and costs over all of the assets’ lifecy-cles. There are inherent conflicting drivers to man-age, such as short-term versus long-term benefits, expenditures versus performance levels, planned versus unplanned availability…“ ISO-55000
These two phases are parallel and good rela-tions between operations and maintenance are a must to avoid excessive downtime.
Renew PhaseMost companies are drowning in a sea of
data, but most of it is not used to support op-timal renewal or replacement. As time passes, most suffer asset information mortality because it is not accessible in a searchable format that is useful for people involved in other asset man-agement phases.
Modifications are often not well planned or well funded. They result only when a major safety issue is identified or if it will bottleneck operations.
Knowing asset condition in real time, or at least close to real time, is also missing from most organization’s decision support process.
Maintenance reliability professionals often have ideas and suggestions, but few rise to ac-
tion levels because they are not supported with business data. Support your input with data to gain support.
Disposal/Decommissioning PhaseAs technology progresses, many of your as-
sets become out-of-date and non-competitive. When there is no formal, continuous improve-ment program and data for decision support is missing, the only companies that can create profit are ones that have a monopoly or are in a very high demand cycle.
From a maintenance perspective, watch for signs of reduced maintenance budget as your company tries to react to high operating costs and reduced profits by hacking away large parts of the operations and maintenance budgets. Of course, there are short-term periods when belt tightening is appropriate; however a useful asset lifecycle will be greatly reduced with prop-er maintenance and care. If this is your compa-nies long-term asset management strategy, you may want to bring your resume up-to-date as your company will either be sold soon or will go out of business.
PAS-55 and ISO-55000 will help companies determine which elements should be in place to create an affective asset management “manage-ment systems;” however these fine standards will NOT tell you how to manage your assets and certainly not tell you anything about main-taining your assets. The asset maintenance plan, asset information management plan and asset health management practices are up to each in-dividual organization to define.
There is no need to wait for the new ISO-55000 standard to be published as any progress you make in the areas of asset maintenance, as-set information management and asset health management will roll up nicely into your com-pany’s efforts to meet ISO-55000 requirements. It is those companies that choose to wait that will be feeling the pressure.
References: 1. The Institute of Asset Management
What Maintenance Reliability Professionals Should Expect
Viewpoint by Uptime’s Terrence O’Hanlon, CMRP
ISO-55000 Asset Management Standard:
14 oct/nov12
asset health management
AhM

15oct/nov12
Grahame Fogel
Why We Should Rethink the Use and Purpose of Asset Management Standards
Asset management focuses on asset value realization...appropriate techniques, processes and methodologies should be used to deliver this need. (ISO 55000)
Reasons10Top
In the last number of years, much of the discussion surrounding asset management has been influenced by the emergence of formal PAS-55 and ISO-5000 standards. PAS-55, the publicly available asset manage-
ment specification, was drafted in a collaborative, multi-country effort in an attempt to create an international reference standard for implement-ing an “asset management system” for organizations that depended on the performance of the physical assets they owned. Many practitioners, although excited by the concept, have found ploughing through the ar-cane language and non-intuitive layout of PAS-55 difficult.
More recently, there has been a global collaborative effort to rewrite the standard in a more accessible format and publish it as a suite of Interna-tional Organization for Standardization (ISO) standards, which is on track for 2014. ISO-55000 is a suite of three standards that are entitled: asset management overview, 55001 asset management system requirements and 55002 guidelines for the application of 55001. The standards are “ap-
plicable to organizations where physical assets are a key or critical factor in achieving business objectives and effective service delivery.” (ISO-55000)
The goals of putting an asset management system in place are clear and hold common value. These are to:
a. Drive performance of the assets;
b. Cover the whole lifecycle;
c. Be in alignment with business goals;
d. Simultaneously manage the risks.
This article does not overview either of the standards, but argues that they are inevitably going to be part of the asset management landscape of the future. The goal of the new set of asset management standards is to provide the practitioner with an accepted structure around which an asset management system can be conformably implemented.
Given this background, I suggest the Top 10 reasons why the new suite of asset management standards should be seriously and strategically con-sidered.
Asset management enables the realization of value from holding the as-sets. (ISO-55000)
One could, of course, develop one’s own framework and structure, but why not take advantage of the combined thinking and intellectual capacity of some of the most experienced practitioners and professionals who have put together the standards? Their combined efforts represent a significant investment in standardizing a body of thought and knowledge that has ac-cumulated over our combined experience since the Industrial Revolution. The Top 10 Reasons are listed on the next double page spread.
Work Management
Reliability Management
Condition Management
Risk Management
Continuous Improvement
Whole Life O
rientation
Plant Reliability Optimization
Competencies
Organizational Alignment
Culture
Change Management
Outsourcing
Human Capital Readiness
Risk
Performance
Asset Management Review
Systematic Continuous
Improvement
Purpose
Organizational Readiness
Feedback & Sustainability
Organizational Learning
Grahame Fogel is an Asset Management Consultant with experi-ence covering 25 years around the world. He has been associated with many of the recognized benchmark programs, such as U.S. Steel, Pfeizer Pharmaceuticals, PJB Power, Boeing, and others. He has a depth of experience in the power, pharmaceutical, mining and chemical process industries. More recently, he has been on the forefront of implementing PAS-55.
The 27th International Maintenance Conference
Conference
Speaker

16 oct/nov12
1 Creates a Line of Sight between the business objectives and how we manage the asset
Strategy
Process
System
Creating a line
of sight between
the business
objectives and
the individual
asset
Component
Plan & Objectives
Business Objectives
Stakeholders Organizational Context Long Term
Objectives Legislation 3 Drives the concepts of whole life
management of the assets.
19 ISO 55000 Suite of Standards 4
Design
Acquisition
Installation
Commissioning
Operation
Disposal
Multiples of design, acquisition, installation
& commission cost
Reasons10TopWhy We Should Rethink the Use and Purpose of Asset Management Standards
Puts in place an internationally-recognized accountability system of direction and control, which risk manages the ownership of assets.
Creates a line of sight between the business objectives of an organization and how the asset is managed, creating connectivity of everything in between.
1 2Creates alignment and consistency across the organization, which in turn creates organizational purpose, which determines the culture of an organization. This, in turn, provides a framework for decision-making in alignment with objectives.
Drives the concepts of whole life ownership of the assets in alignment with business objectives. It structurally ensures that risk and investment decisions are made in terms of total costs of ownership, not transitory budget considerations.
3 4 5Embeds the concepts of making sure a process is both in place and in use, not just a paper exercise for another certificate on the wall.
Continued...

17oct/nov12
Top management commitment is demonstrated by:1. Engagement in setting the goals and measures of success for the people
responsible for the asset management system.2. Setting priorities for these goals.3. Allocating appropriate resources for achievement of these goals.4. Supporting a management development track that encourages and rewards
time spent in roles associated with asset management and operation of the asset management system.
5. Monitoring the asset management system performance and ensuring correc-tive or preventive actions, including opportunities for continual improvement.
6. Assuring asset management has the same level of importance as safety, quality and environment.
Why We Should Rethink the Use and Purpose of Asset Management Standards
9Provides an excellent roadmap for those starting out on the asset management journey, or alternatively, a great framework for implementing an operational excellence activity.
Drives performance of the assets (asset contribution) in line with the overall business needs.
8 10Has international recognition and proven credibility by those who have been the pioneer implementers.
7Anchors sustainability of gains into the future. The attempt is to move from the project (temporary) set of thinking into the management of an asset management system through the life of ownership of the assets.
Puts the responsibility for asset performance directly into the realm of “top management.”
6ISO 55002

18 oct/nov12
Changing the way a large corporation operates is a challenge under any circumstances. But Cintas, one of America’s largest providers of specialized business services, has discovered four keys to success that not only facilitated the launch of its first company-wide CMMS system, but could help others avoid costly delays and overcome crippling inertia.
These keys, says James Wagoner, Regional Field Engineer, can be summed up as:• Tap the field for ideas.• Encourage ‘positive discontent.’• Tackle the elephant one part at a time.• Pick your battles.
First, some background. Cintas is a publicly-held company that designs and implements corporate identity programs and other services for approximately 900,000 businesses. It operates out of 430
facilities and employs 30,000 people, with one of the largest contingents focused on uniform manufacturing, rental and cleaning.
The challenge that needed to be addressed back in the fall of 2006 was the lack of a corporate-wide, computerized maintenance manage-ment system (CMMS). The chief engineers at each of the 150 production facilities had, over time, developed their own method of tracking which equipment needed preventive maintenance, what parts needed to be or-dered when, how much time was lost due to malfunctions, etc. But too often, they relied on paper and pen, and any lessons learned were lost with employee turnover and retirement. Likewise, it was difficult -- if not impossible -- for managers like Wagoner at the regional and national level
to be able to accurately assess and compare plants’ performance.
“There was a time when all we did was build new facilities and scramble to expand capacity,” recalls Wagoner. “But now, with today’s tight economy, it is imperative to
preserve and optimize what we have. We need standardized operating proce-
dures based on what we know works most efficiently. And that’s not pos-sible if everyone is doing their own thing.”
Case Study: Cintas Discovers Keys
to Organizational Change Through CMMS Rollout
Gene Pargas
Work Execution
Management
computerizedmaintenancemanagement
system
cMms

19oct/nov12
It was clear that Cintas needed a corporate-wide CMMS solution. What happened next, however, is a common pitfall into which many companies stumble, no matter what the task, and that is the tendency to jump too quickly to whatever is familiar. Cintas chose a system made by one of the largest developers in the CMMS space -- the same system used in a previ-ous position by Cintas’ Vice President of Engineering.
There was just one problem: It wasn’t right for Cintas. It became clear before very long that it would require too much time and money to cus-tomize and introduce it to Cintas’ 150-plus uniform-laundering facilities. And that flew in the face of one of Cintas’ secrets to success: a “spartan (cost-effective) approach.” That’s when lesson No. 1 saved the day.
Tap the field for ideasWith the scrapping of the large ERP-type system
before it ever got started, the corporate committee charged with selecting a solution did what Wagoner now agrees it should have done to begin with: sur-vey the hundreds of plants to find out what was and was not working “in the trenches.” That’s when one clear finding trickled up: Although there were a va-riety of approaches, only one system -- used at a few plants in Alabama -- consistently received rave reviews. The surprise “winner” was X3, a CMMS system developed by eMaint Enterprises, a New Jersey-based player in the marketplace that Cin-tas’ upper management hadn’t even heard of.
Among the strengths of the system identified in the survey is its ability to:• Create a centralized database, facilitating
faster implementation of company-wide standardization and providing a broad range of data on the equipment in each and every individual plant.
• Track completion of and compliance with PM requirements at the national, regional and local levels.
• Ensure continuity and unhindered pro-ductivity during staff turnover.
• Provide on-de-mand employee training through “eMaint Univer-sity.”But most impor-
tant to customers like Cintas is its high degree of flexibility and functionality at a low cost. “The sys-tem is engineered to be fully adaptable. Everything from fields and forms, reports and work-flows can be modified to better align to the specific business require-ments of customers such as Cintas,” says Brian Samelson, eMaint CEO.
Wagoner agrees. “The most attractive thing to us, in addition to the good performance results we heard from Alabama, was its low cost and rapid ramp-up time. All we had to do to begin implementing the system is pay $40 a month per user. That meant there wasn’t a massive approval process required on our end.”
Not long after the survey’s findings were reported, Cintas’ Vice Presi-dent of Engineering attended one of the company’s “reliability conferenc-
es” in the southeastern region, where I was among the featured speakers. The rest, as they say, is history.
A successful rollout, however, required the practice of a few more “les-sons learned.”
Encourage positive discontentAfter the reliability conference, I was invited to Cintas’ Cincinnati,
Ohio, headquarters to further demonstrate and discuss the system. The first, immediate decision was to put the word out to all 150 production facilities in the field that X3 was a good option to consider. After more than 20 plants followed through on the recommendation and brought the system on board, Cintas’ management decided that if it wanted to standardize implementation, it had better step in sooner rather than
later. In 2010, a halt was placed on all new system purchases and the company’s CMMS committee was
charged with introduc-ing the system across
the enterprise.There was just one
problem. Joel Bell, Se-nior Director for Quality & Engineering at Cintas,
who was charged with this responsibility had many more urgent priori-
ties competing for his time. What was initially a one-
month window for plan-ning the rollout began to stretch into months beyond
that. Fortunately for Cintas, a core operating principle is “positive discontent.” In other
words, explains Wagoner, “be unhappy with the status quo.”
“Every employee at Cintas receives on Day 1 a booklet called ‘The Spirit is the Differ-
ence,’” he says. “Employees are treated as partners and you learn that if you see something that needs to be fixed, you can’t just moan and groan. You must seek a solution.”
And that’s what Wagoner did. Seeing the committee fall behind on its goal, he first talked to his own
direct manager to get his blessing, then stepped up to the plate and made an offer Bell couldn’t refuse: He would take on the responsibil-ity of launching a pilot designed to build buy-in, identifying best prac-tices and working out any problems prior to a national introduction of a CMMS.
“My perspective was that if there is one thing I could do right now that would have the most positive impact on my ability to do my job well, it was getting a CMMS system implemented across all of our plants,” explains Wagoner. “The system was head and shoulders above any other solution we had looked at. I was given a lot of autonomy to
“My perspective was that if there is one thing I could do right now that would have the most positive impact on my ability to do my job well, it was getting a CMMS system implemented across all of our plants,” explains Wagoner.

20 oct/nov12
“Metal packaging market forecasted to be worth $113.9 billion in 2012” Emerging market demand and consumer
trends drive metal packaging market growth.
Share your predictive maintenance management experience withmotivated buyers at the most important networking opportunity in the U.S. and Latin American metal packaging sector.For 17 years the LatinCan Conference has provided the most advanced technicalinformation to North and South American can makers in order to lower costs, enhance productivity and increase the bottom line.
• The Metal Packaging Industry is characterized by high production volume and extremely tight tolerances, where technology is the key to success.
• Increasing production demands require better predictive maintenance managementand machinery reliability.
For more information go to our website at: www.worldcanconferences.com/latincan or e-mail us at: [email protected]
LatinCan 2012 • Weston, Florida • Nov. 7-9, 2012
define success within the CMMS implementation committee and to de-cide when and how to move forward with both the pilot and the full rollout.”
Tackle the elephant one part at a time
Of course, Wagoner had a lot on his plate as well; in these economic times, many employees are faced with an ever-increasing workload.
Part of the solution is management prioritization and support. Wagoner and his immediate manager had the necessary conversation and imple-menting a CMMS became his No. 1 priority; other, non-emergency tasks were handed off to others or delayed.
The other part is how you approach and organize the project.
“The job in front of me did seem a little intimidating at first,” admit-ted Wagoner. “There are just so many phases to implementing any major change across such a large number of locations. The key for me was to remember that a journey of 1,000 miles starts with a single step. Don’t worry about everything all at once; worry about what is right in front of you -- the first step.”
The initial task of the implementation team Wagoner now led was to determine just what information and functions Cintas needed the CMMS software to collect and perform. Although a core strength of the system
is that it can be used quickly “out of the box,” Cintas also needed some custom-ization to fit the system to its unique needs. For example, Wagoner and his team wanted a checklist of lock-out/tag-out tasks to print out at the same time as a work order, thus ensuring that when engineers repaired a piece of equipment, they also took all necessary steps to pro-tect their own and others’ safety.
“The system is already easily custom-ized by adding or deleting fields, creat-ing drop-down menus, etc. But when we needed some adaptations beyond that, the eMaint team was very responsive,” says Wagoner. “Every time we’ve said, ‘We want this,’ they responded by say-ing, ‘Let’s figure out a way to do that.’ And they have.”
Wagoner and his committee chose a diverse group of 11 production facilities to participate in the pilot, rep-resenting veteran CMMS users as well as “newbies.” The decision also was made to limit the scope of the rollout initially to work orders and PM tasks, with the possibility of expansion later. After about four months, the pilot
Figure 1: One of 150 Cintas Wash Alleys located throughout the U.S. and Canada. Tiltable Washers (left), Dryers (right), Movable Shuttle Conveyor (background)
and Chute (overhead).

was declared complete on March 2, 2012. Now, Wagoner and his team are in the midst of the next challenge -- full rollout to all 150 facili-ties across the country. And that process is teaching Wagoner a final lesson.
Pick your battles“I attended a maintenance summit in Texas and I realized that al-
though some chief facility engineers were as excited as I am about the new CMMS process, others are not. They say it won’t work at their facil-ity, that they don’t have time to hassle with a change, etc.,” observes Wagoner. “I know this is bigger than any one individual and, ultimately, it will be coming to every location at some point. As we show success at more and more locations, that will create its own pressure. But we can’t mandate it; the system is only as good as the information that goes in. So, I focus my time on facilities that are ready and that want it.”
As of September 2012, Wagoner and his committee, with the help of Pargas and the larger team, have brought eMaint’s CMMS to more than 100 facilities. And Wagoner is already seeing the results he want-ed so much when he raised his hand and said, “I’ll do it!”
Users at each location have access to online training tools and are certified to ensure they have the knowledge necessary to utilize the system properly. Plant managers now have visibility to the work per-formed by each member of their staff. Changes to standard proce-dures are rolled out across all locations with ease, ensuring consis-tency. With the initial phase of implementation well underway, the committee is turning its attention to what’s next, including incorpo-rating mobile and bar coding technology.
Today, management knows the condition of the equipment at each of those facilities, at any moment in time. And with the razor-edge margins of the competitive uniform business, that means a healthier bottom line for Cintas.
Gene Pargas is Vice President of Strategic Accounts at eMaint Enterprises, LLC, headquartered in Marlton, NJ. A productivity expert, he has a passion for helping people and organiza-tions achieve their performance goals. Gene served 9+ years in the U.S. Navy, including Guided Missile Destroyers. www.emaint.com
James Wagoner PE, CPMM, is a Regional Field Engineer for Washington, Oregon, Idaho and Northern California in the Rental Production Division of Cintas Corp. He was recently awarded the Association of Washington Business Environ-
mental Excellence Award for Resource Conservation and Pollution Prevention and the National Pollution Prevention Roundtable’s Most Valuable Pollution Prevention Award. www.cintas.com
The 27th International Maintenance Conference
Conference
Speaker
Figure 2: Autosort Garment Sortation Machine. Barcode labels allow garments to be automatically sorted by Cintas Route Truck, Delivery Date, Customer and Employee.

This article explains the factors affecting transmission
through an infrared (IR) window (as used in a practical electrical
inspection application). Learn how different IR window types affect your
readings and how to correct for transmission losses.
GeneralInfrared thermography
is a proven technique for inspecting live electrical equipment. With the in-stallation of one or more IR windows, an infra-red thermographer can examine live electrical equipment without re-moving panel covers.
The use of IR windows has become increasingly common over the past 10 years. This is due primar-ily to the increase in elec-trical safety awareness resulting from the widespread implementation of safety standards, such as NFPA 70E and CSA Z462. The aim of this article is to introduce the theory behind infrared transmission.
There are two kinds of IR windows: crystal and reinforced polymer. How do these materials affect readings? What are the options available to thermographers that allow for correction and more accurate problem diagnosis?
IR windows are not 100 percent transmissive to infrared radiation and so the thermal imager will be inaccurate when viewing through an IR win-dow.
Thermographers want to measure temperature; if temperature mea-surement is not important, why buy a radiometric camera?
Let’s get started with IR Window Transmission 101
Infrared transmission can be defined as the proportion of infrared ra-diation emitted from a target that passes through the IR window and reaches the thermal imager, thus enabling a measurement.
IR window manufacturers are often asked the question: “What is the transmission of your IR window?” Unfortunately, there is no simple answer. Most, if not all IR windows used for electrical inspection are “spectral” in nature. This means the transmission of the IR window itself changes with wave-length and therefore targets temperature.
Additionally, the apparent transmission of the IR window depends, to some extent, on the spectral response of the camera. Since the majority of predictive mainte-nance (PdM) thermal imagers operate in the long wave (LW) band of 8-14µm, this ar-ticle will concentrate on the specific effect on this type of thermal imager.
Since it is not possible to achieve 100 percent transmission, where does the rest of the IR energy go?
Simple answer: It is reflected and ab-sorbed (emitted).
The total IR energy an imager “sees” is made up of three compo-nents: Reflected, Absorbed and Transmitted energy.
Anyone who has completed a Level 1 Infrared Thermography class should remember the RAT equation:
R + A + T = 1Thermographers are accus-
tomed to the first two as these are inputted into a thermal imager to obtain a valid reading. However, the third is only used when there is a medium between the target and the camera. In this case an IR window.
When setting up a thermal im-ager to take a reading without an IR window, we make an assump-
tion that there is zero transmission component because we have a direct line of sight to the target being measured. The energy measured by the imager (see Figure 4) is made up of:
Understanding Infrared (IR) Windows
and their Effects on IR Readings
Figure 1:
Figure 2:
Figure 3
Tony Holliday
Asset Health
Management
infraredthermal imaging
iR
22 oct/nov12

Why Automate Your Inspections?• Nomorepaperwork-runsonheavydutyhandheldcomputersand
InspectCE™firmware.• Nomorefirefighting-aproactiveapproachtooperationsandmaintenance.• Nomoredataerrors–makebetterdecisionswithaccuratedata.• Nomorebottlenecks–automaticallytransfermaintenancenotificationsto
yourworkordersystem.
MAINTelligence InspectCE™
Automate Your Inspections
design maintenance systems inc.+1.800.986.3674
Want to see the system for yourself...sign up for a web demo.ThewebdemowillofferyouaninsideviewatInspectCE™-designedforpreventingfailuresandcreatinginformationreliabilitywithinaprocessplantenvironment.Visithttp://www.desmaint.com/index1.html.
With the most flexible and comprehensive inspection system available.

• Energy reflected from the target,• Energy emitted by the target.
Again, Infrared 101: R+A+T=1.Figure 5 is a transmission schematic for a standard IR window. This sche-
matic shows the four signals received by the thermal imager as a result of the IR window’s “interference.”
To calibrate an IR window, the goal is to isolate all signals other than the emitted one by using a target signal, shown in green in Figure 5.
When we add an IR window to the system, we introduce additional ra-diation sources:• Energy reflected from the target and transmitted by the IR window.• Energy emitted by the target and transmitted by the IR window.• Energy emitted by the IR window.• Energy reflected from the IR window.
The sum of these four values is known as the total radiance and this is the amount of energy our thermal imager registers and converts into a temperature measurement value.
The overall effect can be either positive or negative depending upon the severity of the environment and the composition of the IR window.
With regard to crystal IR windows, this article refers to data taken us-ing CorDEX Instruments’ IW Series IR windows with HydroGARD coating, which have almost zero surface reflectivity. That means we can remove the “reflected by window signal” shown in Figure 5 as a purple line.
For real-time measurements, we require high emissivity targets. There-fore, we can remove the “reflected by target signal” shown as the orange line in Figure 5.
This leaves only the “emitted by target” and “emitted by window” sig-nals. As the IR window transmission value drops depending on material used or thickness for example, the effect of emitted energy on the imager becomes more relevant. This is particularly evident if the IR window optic temperature is relatively high.
So far, we have assumed that we have an uninterrupted path to our target, which is not always the case. Some IR viewing panes use a poly-mer/mesh combination as the “optic.” Let’s see how this combination af-fects the camera. In Figure 6, we can see that the opaque mesh (black) has totally different transmission characteristics to semi-opaque polymer (yellow). Inconsistency due to polymer/mesh combination, focus, target temperature and window temperature makes the polymer/mesh combi-nation impossible to calibrate over standard PdM range.
Crystal or Mesh?The polymer/mesh IR window transmission schematic in Figure 6
shows multiple signals received by the thermal imager. For this model, we separated the signals to the camera from polymer optic and opaque mesh grid. It is clear that there are now a minimum of six signals reaching the camera, four from the polymer optic and four from the mesh grid.
We can also see that the mesh and polymer behave very differently. The polymer allows some energy to pass, but also reflects and emits its own energy. The mesh, in contrast, is totally opaque, therefore the signals it transmits to the camera are reflected and emitted.
This behavior is repeated multiple times due to the mesh honeycomb. Additional problems arise when focus and angle are introduced into the model.
TIP: If the IR window is hotter than the original target, then the amount emitted by the IR window itself will be higher than the camera would originally have seen had the IR window not been present. Therefore, the camera will read HIGH.
Figure 6: Effect of polymer/mesh IR window on infrared signals
Figure 4: Effect of IR window on infrared signals
Figure 5: Effect of IR window on infrared signals
24 oct/nov12

Polymer/Mesh Optics• Multiple complex signals to thermal imager• Severely affected by focus and angle• Repeatable transmission correction is not possible• Suitable for qualitive (non-measurement) based thermography only
Crystal Optics• Suitable for quantitive (measurement) based thermography with trans-
mission correction algorithm• Simple, repeatable signals to thermal imager• Minimal surface reflection• Does not affect target focus
We have established it is not possible to correct through mesh, SO, WHAT NEXT?Calibration Basics
Standard instrument calibrations are performed at set points across the process variable (PV) range. Traditionally, IR window calibrations have been related to a single point calibration, also known as a ‘coffee cup’ cali-bration.
In order to obtain accurate readings across a range, a correction curve must be created. Typically, calibrations go across a range of: 0 percent, 20 percent, 40 percent, 60 percent, 80 percent and 100 percent. This allows the instrument to be accurate at multiple points.
Since a thermographer is interested in trending temperature over time to extrapolate a failure before it occurs, calibration over a range is the ulti-mate goal when it comes to accuracy.
Calibrating for TransmissionThe traditional coffee cup test procedure is:1. Insert the window between the cup and the camera and record the
reading.2. Alter the emissivity to bring the camera temperature reading back
to pre-window.3. Set the camera emissivity to 1.4. Point the camera at the hot cup of coffee, making sure it is in focus,
and record the temperature.5. Multiply the value shown by the emissivity of the next target and
that is the transmission of the window.
Results No window: e = 1. With window: e = 0.45.
To highlight the limitations of single point calibrations, we will apply the coffee cup test to a range and measure the results using an IW series intelligent IR window and long wave thermal imager. Try it for yourself!
Coffee Cup Test Results at a Higher TemperatureFigure 9 shows two sets of results. One shows the initial calibration tem-
perature where accuracy is 2 degrees. The second set of results shows the same calibration figure applied to a higher range, in this case 238 F. In this example, the camera returns a temperature of 272 F, which is high by 34 degrees.
• Coffee cup calibration is only accurate at single point.• Readings are inaccurate as temperatures change.• If tested above coffee cup test temperature, camera reads high, thus
meaning potential false alarms.• If tested below coffee cup test temperature, camera reads low, thus
meaning potential missed problems.Figure 10 shows the effect of a single point calibration over a range.
At the calibration point, the camera is accurate. However, as the same calibration factor is applied to increasing and decreasing target tempera-tures, significant errors occur.
Single point calibrations are inaccurate when applied to a range.
Multipoint Transmission CorrectionThe ultimate goal is to create a correction map that provides accurate
readings over a range of target temperatures. The aim is to achieve a ±5 degree target accuracy after calibration. While this is outside the standard camera accuracy, it is more than adequate for electrical inspections. When creating the map, it is essential to isolate erroneous signals that will affect the result.
Challenges:• All IR windows, even those using the same material at the same thick-
ness, will exhibit slightly different transmission results.• Transmission maps must be individual to each IR window. A typical
electrical PdM range of 85 F to 330 F requires a minimum of five calibra-tion points to be in line with standard instrument calibration protocol.
• Spectral responses of individual cameras change from one to another. This will always create an error, but generally will be within the ±5 de-gree target accuracy.
Figure 7 Figure 8
Figure 10: Single point calibration applied to a range
25oct/nov12
Figure 9: Transmission results across a range

Multipoint CalibrationTotal radiant energy detected by a thermal imager in the 8–14µm band
is the area under the curve that equates to temperature when the imager is calibrated.
With an IR window between the imager and the target, the amount of energy received by the thermal imager is, in this instance, shown in green in Figure 12. The calibration factor is the multiplication value required to increase the green area to orange.
The curve for hotter temperatures moves into the shorter wavelengths, whereas the curve for colder temperatures moves into the longer wave-lengths. The Planck curve “moves” along the IR spectrum depending on the target temperature.
Since the transmission of the IR window is better in the shorter wave-lengths, more energy is transmitted by the IR window from hotter targets than from colder targets, which transmit more on the longer wavelengths.
A material having the ability to change transmission rate as a function of target temperature is known as a spectral transmitter.
A camera monitors in the 8-14µm band, but energy changes within this band at different target temperatures. A spectral transmitter modulates the energy as a function of wavelength, which means a single point is insufficient to calibrate accurately.
Changes in Camera ResponseIndividual thermal imagers all have different spectral responses. This is
a characteristic of individual detectors as they come off the production line. These differences do not affect thermographers in general, as the camera is calibrated. The effected only become “visible” when a spectral transmitter is placed between the thermal imager and the target.
All three cameras “see” slightly different radiant energy levels for the same target temperature. The cameras all read the same, as they are calibrated to “understand” that this specific level of intensity equates to a specific temperature. However, this will cause an error when used with a spectrally transmitting IR window.
Putting it all togetherTo stand a chance at reasonably accurate transmission correction via an IR
window, a multipoint “map” must be created to take into account the chang-ing parameters and their corresponding impact on temperature readings.• A multipoint correction map is created across the identified PdM range
and made available to thermographers.• Distance to targets, ambient humidity and optic temperature are all
considered and corrected from within the map.• Multiple points are considered when creating the map, far exceeding
the standard five instrument calibration requirements.Previously, infrared thermographers have requested transmission
curves from IR window manufacturers. In reality, a transmission curve has little use because it doesn’t provide the thermographer with the informa-tion required to obtain an accurate reading.
What the thermog-rapher actually needs is a correction map, similar to the one shown in Figure 14. The curve correlates the in-dicated temperature as shown by the thermal imager and the actual temperature of the tar-get across a range.
Target accuracy of ±5 degrees is the goal, but does it work.....Figure 15 shows a series of results using a longwave thermal imager from
a leading manufacturer and a transmission map for an intelligent IR window.It is clear that without the correction, the error is severe. However, with
the correction map applied, far more accurate readings can be repeatedly obtained across the established CM range.
Mr. Tony Holliday currently serves as Managing Director at CorDEX Instruments Ltd. Tony served as IR Windows General Manager at Fluke Electronics Corporation until April 2011. A trained engineer and published author, Tony has been responsible for improving worker safety and reducing plant operational costs by developing new and innovative products and has presented electrical safety papers at key safety confer-ences across the United States. www.irwindows.com
Figure 14:. Typical IR window correction map
Figure 11
Figure 12
Figure 13
Figure 15: Corrected results vs. uncorrected results
26 oct/nov12
Reliabilityweb.com Presents
April 9 - 12, 2013
Las Vegas
Book by December 14, 2012 for Vegas Style Savings!
Las Vegas www.maintenanceconference.com (239) 333-2500 or (888) 575-1245 w
$200Save
Hotel & Conference: South Point Resort Las Vegas, NV

Reliabilityweb.com Presents
April 9 - 12, 2013
Las Vegas
Book by December 14, 2012 for Vegas Style Savings!
Las Vegas www.maintenanceconference.com (239) 333-2500 or (888) 575-1245 w
$200Save
Hotel & Conference: South Point Resort Las Vegas, NV

28 oct/nov12
Interesting thought, but really? Training is a very big topic and criti-cal to not only your implementation success, but also your long term operator-driven reliability (ODR) sustainability.
As your ODR program evolves and grows, processes will be improved, technology will evolve and personnel will come and go. The amount of time devoted to your training program, content and timing of exe-
cution can make or break your program. Training is the cornerstone to keep-ing ODR knowledge current.
If most companies agree about the importance of training, then why does it tend to be one of the first budgets that get whacked when times get tough? The rationale of training is simple; it ensures that craft people that actually perform ODR can do it well. The challenge is that training becomes part of the living ODR program, requiring regular updates and refresher training.
Plan for lots of customized ongoing training with annual updates captur-ing processes improvements and technology advancements. Also plan on many different training modules that are specific to different audiences. Don’t train them on topics they don’t need to know, like unused technology features. Keep the training short and specific. Only take training as in-depth as the audience requires. It’s obvious that operators, operations supervisors
and program administrators require ODR training. Often overlooked are the asset preparation team and the mechanics who repair assets. The asset prep team is the folks that make sure the assets are cleaned to like-new conditions, measurement and inspection points are clearly marked on assets, and asset identification technologies, like bar codes and RFID tags, are attached. They make sure inspection points are accessible, assess whether guards need to be modified, confirm gauges are working and ensure significant lighting is available to make the inspection or measurement. The repair team needs to be trained on the importance of the work the asset preparation team has completed so the condition of assets can be maintained, especially making sure inspection markings and asset identification technologies are properly put back on the assets after they are repaired and placed back in service.
Very important to a successful ODR implementation is program orientation training so people in all disciplines and levels understand the goals and objec-tives of the ODR program. That includes orientation for the executive team. It is also vital not to overlook the necessity of change management training for the implementation team. This training prepares the team to be ready to deal with a multitude of reasons to go back to the way operators used to work before ODR. Change management training is also vital to sustain ODR.
ODR training needs to focus on how to use mobile units, how to make inspections and measurements, how to use accessories like strobe lights, ultrasonic guns, vibration and temperature probes, and how to make cor-rective actions. Corrective actions can include tasks like minor adjustments, cleaning, changing filters, or topping off lubrication, all of which could re-quire some level of training.
Operator training should not stop with the technology. There should be training to raise operators’ level of competence of the assets they operate and awareness of the contribution those assets make to the process. They need to be trained on typical failure modes, specific symptoms to look for that indicate potential problems, consequences of failure and impact of downtime. Understanding the importance of the inspections they make helps them value the ODR tasks they perform and is invaluable to helping sustain ODR.
Training materials need to be updated regularly, accommodating new features and program expansion. Training materials will be reused a number of times throughout implementation and for refresher training. Make train-ing materials readily available on a reference site, like creating an ODR site on the company’s Intranet. Consider training materials in both print form and computer based. Use lots of graphics and videos. In fact, both graphics and videos can be loaded on mobile units for quick refresher training in the field. Make sure to include training materials that cover ODR technology trouble-shooting, repair and support procedures.
Training needs to go beyond the classroom. Take advantage of on-the-job training (OJT) opportunities by pairing up less experienced operators with more seasoned operators. Get operators involved with activities that rein-force OJT, such as equipment repairs and root cause analysis.
ODR offers significant contributions to a plant’s overall reli-ability. A detailed, living training plan helps ensure ODR con-tinues to contribute to the company’s bottom line.
Operator-Driven Reliability Best Practices Series:
Dave Staples, Business Development Manager, SKF Reliability Systems, has over 20 years of industrial experience specializing in asset reliability technologies and asset management services. For the past six years, Dave has been focused on helping cus-tomers implement and sustain Operator Driven Reliability programs. www.skf.com
“We only want operators who ALREADY know how to do their job.” Dave Staples
The 27th International Maintenance Conference
Conference Speaker
INDUSTRIAL PRESS INC.989 Avenue of the Americas, 19th Floor � New York, NY 10018
(212) 889-6330 � Toll-Free (888) 528-7852 �Fax (212) 545-8327 www.industrialpress.com � E-mail: [email protected]
ORDER ONLINE AND GET A 25% DISCOUNT ON ADVERTISED TITLES.*BE SURE TO PROVIDE SPECIAL OFFER #UP1011-12 AT CHECKOUT.
*OFFER EXPIRES 11/30/12 AND IS AVAILABLE TO U.S. RESIDENTS ONLY.
INDUSTRIAL PRESS INC.INDUSTRIAL PRESS INC.VISIT OUR BOOTH AT IMC IN DECEMBER
NEW AND RECENTLY PUBLISHED!MAINTENANCE AND RELIABILITY BEST PRACTICES SECOND EDITION
Ramesh Gulati 2012, 400 pages, Illus., ISBN 978-0-8311-3434-1, $49.95In the brief time since its publication, this book has becomea must-have guide and reference for everyone who wants toensure that their organization's assets are operating as and
when needed and at reasonable cost. THE RCM SOLUTION
A PRACTICAL GUIDE TO STARTING AND MAINTAINING A SUCCESSFUL RCM PROGRAM
Nancy Regan 2012, 256 pages, Illus., ISBN 978-0-8311-3424-2, $49.95A �how-to� generic approach for any type of organization.
Offers a basic, common sense approach to RCM. Majorcoverage of SAE JA1011 compliant RCM. Presents detailed
processes to use when RCM doesn�t apply.CASE STUDIES IN MAINTENANCE AND RELIABILITY
A WEALTH OF BEST PRACTICESNarayan, Wardhaugh, Das 2012, 360 pages, Illus., ISBN 978-0-8311-0221-0, $49.95The authors describe 42 on-the-job case studies taken from
their own work experience and from which they gainedinvaluable insights into a wealth of best practices in
maintenance and reliability. TO SEE ALL OF OUR MAINTENANCE TITLES GO TO WWW.INDUSTRIALPRESS.COM.
Uptime1011-12quarter.qxp 8/6/2012 3:15 PM Page 1
new ad
Work Execution
Management
operator driven reliability
OdR

Reliability and maintenance training for the manufacturing and process industry.
www.idcon.com 1-800-849-2041
We don’t sell engineering services, parts, tools, equipment or software...our independence translates into objective and credible advice and training.
TrainingFor on-site training please call1-800-849-2041
ing pleas041
call
Schedule for 2013Results Oriented Reliability and Maintenance Management January 15, 2013 Chicago, IL March 14, 2013 Baton Rouge, LA October 22, 2013 Seattle, WAPreventive Maintenance/Essential Care and Condition Monitoring February 25-26, 2013 Raleigh, NC June 20-21, 2013 Raleigh, NCPlanning and Scheduling of Maintenance February 27-March 1, 2013 Raleigh, NC June 17-19, 2013 Raleigh, NCRoot Cause Problem Elimination Training™ May 7-9, 2013 Raleigh, NC October 8-10, 2013 Raleigh, NCReliability & Maintenance Management April 22-26, 2013 Raleigh, NC November 4-7, 2013 Raleigh, NC(Processes & Precision Skill Sets)
(For Operations and Maintenance Management)
IDCON’s Best Practice Seminar Schedule for 2012Course Dates LocationMaintenance Planning and Scheduling / Reliability Based November 12-14, 2012 Raleigh, NCSpare Parts and Materials Management
Root Cause Problem Elimination Training™ November 15-16, 2012 Raleigh, NC

US & Canada: 1-800-999-5290International: +1-585-924-5900
Call CTC today to meet your most demanding requirements.
If any CTC Vibration Analysis Hardware Product should ever fail,
we will replace or repair it at no charge.
GOODThe WARRANTYAnd T
heSafety First! Don’t get wrapped up in your work. Add a Break-Away Safety Connector to your next data collector cable. Be Safe, Not Sorry!
BADThe
This data collector cable was caught in a machine, and the Break-Away Safety Connector disconnected as designed, leaving the broken cable, and not a broken data collector, or even worse, an injured vibration analyst.
www.ctconline.com
An example of a undamaged cable and Break-Away Safety Connector.
BADThe
Cable ripped off of connector after being caught in machine.
7939 Rae Boulevard - Victor, NY 14564
Break-Away Safety Connector disconnected, preventing damage to collector and potential harm to vibration analyst.
“ ”Worth every penny. One of my guy’s neck was saved today. The analyzer end cable is still PERFECT!
was saved today. The analyzer end cable is
Pedro Cortez General Manager
SCM, SA

32 oct/nov12
to Better Equipment Reliability
Ricky Smith
Does it seem like it’s the same old thing every day and although you try your
best to make improvements in equipment reliability, they never seem to stick?
I know the feeling, and it is frustrating. But what if you could improve equip-
ment reliability in seven days? I know what you are thinking: it will never work.
However, consider the following seven-day schedule. It lays out an approach
that you can use in your facility for improving your equipment reliability. Give
these ideas a chance to succeed and you will be amazed with the results.
The 27th International Maintenance Conference
Conference
Speaker
Days
Work Execution
Management
maintenancemanagement
Mm

33oct/nov12
Pre-WorkMeet with all your supervisors, planners, engineers and
key maintenance personnel. Let them know what is hap-pening and that you want this to be a department effort to improve everyone’s lives. This means you will need everyone to help.
I once learned from a wise man that one man cannot pull an elephant,
but if everyone pulls on the rope, we can pull the elephant around wherever we wish. Tomorrow, all hands need to be on the rope.
TIP: For the seven days, bring in donuts each morning. This will help make everyone more receptive to the concepts that will be tackled.
Day 1This is the first day of the rest of your life, so let’s make a dif-
ference beginning today. Have the donuts and coffee ready for everyone. Bring in all-day shift maintenance personnel: planners, storeroom personnel, engineers, supervisors, all of the maintenance crews and leadership.
Let them know you are going to implement a program titled “7 Days to Better Equipment Reliability.” In front of everyone, post a simple sign that reads: “7 Days to Better Equipment Reli-ability.” Tell them this is a journey and not a race. Don’t worry, they are going to be excited about these seven days.
On the first day, you want to focus on a simple task. Ask everyone to begin focusing their efforts on performing the following task, today and until the earth as we know it ends. Post a banner in the shop that resembles the banner shown in Figure 1.
Remind everyone that they are to perform all work to spec-ification. If a specification is not known, make sure they know to ask their supervisor or engineer for assistance. Also, tell them to keep in mind that they cannot maintain equipment that is not maintainable.
In front of your department, ask someone to post the “Guiding Principles of Maintenance” (shown in Figure 2). State each one for everyone to reflect on.
NOTE: To follow Principle 4, you may need to develop a stan-dard for closing work orders.
After this meeting, you must be seen in the field all day, helping people with problems and understanding the true challenges your team faces. Never correct them unless the task will damage equipment or injure personnel. (You can take care of your paperwork after the first shift leaves.)
As the maintenance staff is leaving, thank them for their work and shake each person’s hand, including your manage-ment team. Your management team is the key to success and they must begin acting as a team with you as their leader.
I know you are thinking that this will be one heck of a day, but feel good knowing that success never comes easy. Simple rewards, such as a mechanic smiling when he or she leaves work, should be enough reward for you.
Day 2Gather everyone for a five-minute meeting in the morning.
(Don’t forget the donuts!) Give everyone a universal thread file, including your electricians, or some other token of appre-ciation to thank them for their efforts yesterday.
Guiding Principles of MaintenancePrinciple 1 We will always repair equipment back to a
maintainable condition.
We will ensure that we do not make errors in the work we execute; we are not afraid to ask for help and will not rush the work when equipment reliability may be compromised.
When we perform Preventive Maintenance, we will ask ourselves, “Did I perform the inspection to a level where I know the equipment is left like new or maintain-able?” If not, we will write a work order to come back later and correct.
We will close out all work orders, complet-ing all the required fields to standard.
Principle 2
Principle 3
Principle 4
Figure 2: Guiding Principles of MaintenanceWe will follow the definition
of the word maintenance, “to maintain,” and accept nothing less.
Our New Approach
Figure 1: Our New Approach

34 oct/nov12
Ask how many of them are with you on this journey to maintenance excellence. Notice that a new word is introduced, “maintenance excel-lence.” You are slowly changing the culture in your facility.
All maintenance supervisors, managers, reliability engineers and me-chanical engineers should be on the floor assisting maintenance person-nel who are having problems grasping the concepts laid out on Day 1. No negative talk; this is a time of reflection, calmness and assistance.
When this meeting is over, you must be seen in the field all day, just like on Day 1.
Your leadership team will likely be feeling uncomfortable at this time. Take them to lunch, but no talking business allowed. Listen to what your leadership team is telling you and do not react, think about what they are telling you. If one person is a problem on the leadership team, take them in your office and talk to them in a calm voice. Think of yourself as a psychologist: good listener, no directive, no threats. Calmness is the key.
Again, as the maintenance staff is leaving, thank them for their work and shake each person’s hand.
As Day 2 ends, you will probably be stressed, but don’t give up yet! Remember, it’s a journey that will lead to great results.
Day 3Ask storeroom management to take you and your management team
on a walk-through of the storeroom. (It will be helpful for you and your staff to catch up on materials management at night. Remember, we are on a seven-day journey; I hope you warned your spouse or signifi-cant other that long days may be part of these seven days.) During the walk-through, look at how spare parts are stored, ask what the stock-out percentage is, and find out if the storeroom is performing PMs on large bearings and electric motors. Also identify parts that are not stored properly, such as V-belts, and make sure the thread files are set up in the storeroom.
At the end of the walk-through, ask the storeroom manager how long it would take to correct all the problems your team noted.
Let the storeroom manager know that you do not expect success overnight; however, you would like to see a plan within three days for the easy fixes. Assign a reliability or maintenance engineer to be the coach for the storeroom. If you do not own the storeroom, you should take the necessary measures to pull it under your control. Most of the stuff in the storeroom is maintenance; the value may be higher for pro-duction, but the volume is maintenance.
Afterwards, do not take a break, rather go into the mode of “All Hands on Deck.” The main focus is helping people do the right work at the right time, along with closing out work orders correctly with all the fields com-pleted.
As with the previous days, as the maintenance staff is leaving, thank them for their work and shake each person’s hand.
Day 4Stay in your office until everyone goes to work and then go about
your normal day and meetings. Sit down with your engineers, supervi-sors and planners after lunch to discuss what is working and what is not working. If there is a problem, ask the team for a solution. Go with their idea, even if you do not like it, as long as the idea is legal and ethical.
Set up a small group within your team to focus on work order close out and the metrics you want to track. Ask the group to identify four
key performance indicators (KPIs) that they want to measure. Make sure the KPIs will drive the correct behavior. Also, ensure that the inputs in your maintenance software will give you the outputs you want. Estab-lish a standard operating procedure (SOP) for work order close out. This should include a RACI Chart, similar to the one illustrated in Figure 3, that defines roles and responsibilities.
Once again, as the maintenance staff is leaving, thank them for their work and shake each person’s hand. As some of the last people are leav-ing, ask a few of them (about three or four) to stay for a minute or two and ask them how things are going. You may have to make an adjust-ment based on what you learn. Give them each a high-quality 6-inch electronic caliper or other token of appreciation and shake their hands, looking them in the eye, smiling and saying “thank you” with sincerity.
Day 5Host a short meeting with your maintenance and leadership teams
and tell them what a great job they are doing. Use some examples that you or your staff have seen of their great work. Bring those team members up and give them a handshake, look them in the eyes and say “thank you.”
Give each member of the maintenance and leadership team a pack of M&Ms or some other individual treat (make sure you have a variety of flavors and enough for everyone) to distribute to the staff in your de-partment.
Ask your team working on KPIs to begin producing the four chosen KPIs, even if they are not 100 percent accurate. Post them on large line graphs where everyone can see them. People understand line graphs, numbers do not mean anything. If the number looks bad or has high variation, consider it acceptable because this is where you truly are.
Ask your maintenance leadership team to be outside when the staff is leaving to thank them for their hard work and dedication. Shake the maintenance techs’ hands, looking them directly in the eye, smile and sincerely say “thank you.”
Tasks Maint Supervisors
Maint Analyst
Maint Planner
Maint Technician
Maint Manager
Rel Specialist
CMMS Proj Engr
Inputting Failure Data A C I R C C
Work Order Completion R C C C A I I
Work Order Close Out C R C I I A
QA of Failure Data Input C R I C I C A
Analyze Failure Records C C I C A R I
Maintenance Strategy Adjustments
C I I C A R R
Implementing New Strategies R I R C A I I
Responsibility: “The Doer” • Accountable: “The Buck Stops Here” • Consulted: “In the Loop” • Informed: “Kept in the Picture”
Figure 3: Maintenance Crew KPI RACI Chart

35oct/nov12
Day 6Have a meeting with all of the maintenance team, including leader-
ship. Ask the plant or site leader to say a few words (five minutes) about their hard work and dedication in the past few days.
Pass out different sized torque wrenches to each crew based on their needs, whether electrical or mechanical. Give them charts with the torque values listed as well. For each crew, give them a calibration test tool to validate that the torque values are accurate. Make each supervi-sor sign for the torque wrench and other items.
Next, you, as the maintenance manager, should tell everyone that from today on the team will step up the professionalism to a new level. The team will use the torque wrenches on all fasteners, both electrical and mechanical. After the fastener is torqued to the prescribed level, they should use a paint marker to mark the fastener across the nut and threads of the fastener. This will validate that the fastener has been torqued to standard and if the torque value changes, you will see the paint on the threads cracked.
At the end of the day, say goodbye and shake the hands of the people who stop by to say goodbye and thank them for their hard work.
Day 7Bring in the crew for Day 7 and ask if anything has changed in the
past seven days. Find out if the group believes they are moving toward maintenance excellence. List the successes and the mistakes. Make this a fun experience.
Have an outside lubrication expert or consultant come in and evalu-ate your lubrication practices and make suggestions for storage, con-tamination control, best known practices, etc. DO NOT call in the sales person from the oil company or their lubrication engineer. Develop an action plan with one supervisor or engineer as the lead on the project and make it happen, focusing on critical assets first. Lubrication is the number one killer of equipment reliability; all lube techs should be certi-fied and task qualified.
At the end of Day 7, state to everyone that your facility is the best and you will all prove it. Point out that they have already mastered the sim-ple tasks they were challenged with and succeeded in moving towards maintenance excellence. Don’t forget to thank them all once again be-fore they leave for the day.
Finally, remember that if it were easy, everyone would be doing it. The smiles on your maintenance techs’ faces will show you that it is all worth it. Good luck implementing these ideas within your facility and under-stand that deviating from this plan at any point could result in failure to achieve your goals.
I would like to know how this program works for you. If you use the ap-proach described here, please let me know what results you see. If you need ideas or more information, send me an email at [email protected].
energy that utilities use for billing. What an energy-measuring instrument mea-sures and computes is important, but how it measures can be critical. For example, some inexpensive low-resolution instruments may measure the basic parameters mentioned, but they can miss data and thereby produce false and misleading measurements.
Effective energy-analyzing instruments (Fig-ure 3) should provide a sampling rate that is appropriate for the application while also pro-viding the ability to take continuous readings. Power analyzers typically define sampling rate as the number of measurements taken per AC (60/50Hz) cycle. Because the instru-ment creates a digital representation of the analog voltage and current being measured, it is generally desirable to use an instrument that provides a higher number of samples per cycle, thus resulting in more accurate mea-surements of the data being collected.
Users are also encouraged to select an energy analyzer that can measure more than just the basic power parameters, since more advanced
parameters may be required to also help un-derstand the quality of the electrical supply, including: voltage and current total harmonic distortion (THD), transformer derating factor (TDF) and crest factor (CF). Additionally, with the advent of alternative-energy applications, parameters such as forward and reverse ener-gy that record the flow of power to and from the grid are often required.
Details of the survey can vary greatly accord-ing to the application. The goal of an energy audit is usually to determine the energy pro-file of the system being monitored. Regardless of application, it helps to know some of the information about what is being monitored, such as the type of load, process or facility. These details are essential for determining the duration of the energy survey.
To obtain a complete picture of the energy profile, it is recommended to monitor sev-eral business cycles of the load being audited. For example, an industrial process that cycles (start to finish) every 15 minutes may only need monitoring for approximately an hour to capture multiple cycles and to find out what is
ly by a variety of instruments, but the key ben-efit of using an energy analyzer is its ability to record and trend parameters over time. En-ergy analyzers also compute the demand and
With content that is focused 100% on Maintenance & Reliability, each month uptime delivers practical knowledge to tens of thousands of maintenance & reliability professionals around the globe.
Are you in?www.uptimemagazine.com
up
tim
e
delivers. Practical Plant Failure Analysis is a three-day, reasonably-priced, practical seminar for engineers and skilled plant personnel. In it we use hundreds of failed shafts, bearings, gears, belts, chains, and corrosion examples. As part of the class, small groups do hands-on analysis of a series of pieces, diagnosing how and why they failed, and how to prevent another.
Th e next public session will be on September 28th –30th in Syracuse, NY. Private plant sessions range from two to fi ve days and can be held at your site.
Training from the Reliability Professionals who “wrote the book on
practical failure analysis.”
For more details about failure analysis or training sessions, contact Dale Gamba
at 315-487-4390 or email us [email protected]
Sachs, Salvaterra & Associates, Inc6171 Airport Road
Syracuse, NY 13209
Lots of people talk about doing “Root Cause Failure Analysis”. With hundreds of hands-on
examples, we show you how to do it!
Figure 3 - Low-cost energy analyzers like the Dranetz EP1 Energy Platform offer users an un-precedented degree
of functionality and exibility for performing simple to sophisticated energy audits that can be exported
into popular software programs.
october/november 201042
Uptime Oct_Nov.indd 44 9/15/10 11:08:46 AM
Private plant sessions range from two to five days and can
be held at your site.
SPM®HD is implemented in the Intellinova® Compact, a new addition to the very
successful range of SPM Instruments on-line condition monitoring products.
Tel. 1-800-505-5636www.spmhd.com
Revolutionary Techniquefor Condition Monitoring
Particularly well suited for Low RPM bearing monitoring,SPM®HD can be utilized in bearings operating from 1– 20,000 RPM. For further information, please call or visit our website.
Ricky Smith, CMRP, CPMM, is the Senior Technical Advisor for GPAllied. Ricky has over 30 years experience in maintenance as a maintenance manager, maintenance supervisor, maintenance engineer, maintenance training specialist and maintenance consultant, and is a well-known published author. www.gpallied.com

36 oct/nov12
IntroductionIn recent decades, the manufacturing
and process industries have undergone fundamental changes with the presence of ever-increasing automation, sophisticated IT infrastructure, electronics and micropro-cessor-based equipment in every aspect of the business. These changes introduced a new, very complex class of equipment with random failure pattern (electronics fail at random and failure cannot be predicted) and a need for sophisticated troubleshoot-ing skills. Consequently, it is important to develop management strategies to ensure that the required levels of plant uptime, cost and business risk are met at the lowest possible cost.
Where to start?One of the first questions we need to an-
swer is what to repair and what to replace? This is a critical question as it will define “spare” and the way failures are handled. So, what should we repair? This will depend on the skills available in the maintenance/en-gineering organization, the time it takes to repair versus replace and the cost of down-time. To understand it better, let’s illustrate it with an example of a variable frequency drive (VFD).
Small VFDs are packaged in such a way that repairs in situ are not practical, so they are simply replaced with a spare. The situa-
tion becomes complicated however, when larger drives are involved because there are many failure modes – power module, interface boards and controller, to name a few. In such a case, management needs to make a decision: Do we repair the drive in situ or do we replace the entire drive? This decision will be based on a number of factors, the most important being on-site skills availability and time to repair versus replacement. Experience has shown that
even relatively large drives up to several hundreds of horsepowers should be re-placed instead of repaired in-service as it is a better, more economical option when factoring in downtime involved during the repair process.
This thought process should be applied to all installed equipment – mechanical,
electrical, electronics, hydraulics, pneu-matic. Once the repair strategy decision is made, the next steps involve performing operational and criticality analysis.
Criticality analysisThere are many models for conducting
criticality analysis and each company has its own system. These usually take into ac-count the impact of a failure on production, quality, safety and the environment, as well as probability of the failure and its predict-ability. In other words, it is a risk-ranking system that estimates consequences of a failure to the business and its probability. For the purpose of this article, we will as-sume that such a model would be used.
One of the most important steps is to develop an equipment list that includes all maintainable items as described earlier in this article. It can be accomplished in vari-ous ways. If a company has a good enter-prise asset management (EAM) or comput-erized maintenance management system (CMMS) with an up-to-date asset index, the list can be dumped directly from the index to an Excel spreadsheet. It is also possible that the criticality analysis has already been performed. In such a case, the effort to cre-ate the list and assign criticality is shortened significantly. However, there will be cases, such as with greenfield operations, where the list will need to be developed from scratch. It may be a lengthy, time-consum-
Kris Goly
One of the first questions we need to answer is
what to repair and what to replace? This is a
critical question as it will define “spare” and the
way failures are handled.
How to Develop a Spare Parts
Work Execution
Management
mro-sparesmanagement
MrO
Stocking Strategy

37oct/nov12
ing task, especially if only limited information is available and all information has to be verified in the field. This is especially true with mechani-cal systems.
However, automation and manufacturers of drives offer much quicker and more effec-tive solutions, such as programming software, which in most cases offer lists of all devices attached to the industrial network. This infor-mation includes name of the device, location, serial number and software/firmware revision. This is a quick and error-free process.
After the equipment master list has been de-veloped and criticality analysis has been final-ized, we can move on to the next step.
Critical spares – delivery lead time requirements
Now that we have assigned the critical-ity to the equipment, how does it affect our spares strategy? How can criticality be utilized in deciding spares strategy? Table 1 shows an example of such a strategy for the highest criticality category (Category 1). Because the equipment holds the highest risk to the busi-ness, all spares need to be stored on site. For Category 2, spares need to be available within a 24-hour time period, and so on for the lower criticality categories. Please note that Table 1 is just an example for illustration purposes only. Each individual plant/organization has to devel-op its own system. It will vary from the example shown, but what is important is applying it in a consistent manner.
After learning the required spares’ availabil-ity, the next step is to check for the delivery lead time and, in case of reparable items, repair time. Table 2 shows how these steps affect the estimated minimum quantity of the stock.
This process can be taken further by calculat-ing economic order quantity (EOQ), maximum levels and reordering points, thus creating a com-prehensive spare parts management process.
ExampleA paper-making plant invested in an infra-
structure upgrade project. As part of the proj-ect, a complex, medium voltage drive system
Easy-Laser® E710 Alignment System Highlights:• Versatile programs and functions necessary for rotating machines• Bluetooth® wireless connection – enables you to work more freely• Optional Barcode system for documentation – recall past measuring jobs instantly• EasyTurn™ function – o�ers a minimum of 20° between measuring points• Alignment “live mode” anywhere around the shaft (360°)• Expandable – adaptable to your needs, now and in the future• 2 year warranty (3 year with registration)
g p
Overall Criticality
Required lead time for spares
Category I Catastrophic on-site
Category II Critical 24 hrs
Category III Marginal 1 week
Category IV Minor 1 month
Table 1: Spares Required Lead Time

38 oct/nov12
was installed. The initial spare parts list was based on the OEM recommendations. A few months after commissioning, the plant man-agement decided to review the newly-installed equipment to mitigate downtime risk to the business. A team of process, maintenance and reliability specialists was formed to commence spares optimization work. The team followed the process described in this article and the re-sults surprised all participants.
First, the team learned that the plant did not have a repair strategy in place. It was not clear what should be repaired and what should be replaced based on available skill sets and time to repair. In addition, the plant did not have a comprehensive criticality assessment process in place and there was no knowledge regard-
ing how the equipment criticality should influ-ence spare parts stocking quantities.
The process identified 102 components that required various levels of spare parts. Only 60 spare parts were actually stocked on site, with quantities either below or above the recom-mended levels.
Out of 42 spares not stocked, approximately 50 percent had a required delivery lead time of 24 hours, while OEM delivery time was from one week to 16 weeks, thus exposing the plant to an unnecessary risk. The additional cost of spares was around $200,000 dollars, with a downtime cost for that particular production line of >$10,000/hr. Following the analysis, a business decision was made to replenish the spare parts stock as recommended.
Several weeks later, there was a drive fail-ure. The analysis showed that a $320 charge resistor failed. The delivery lead time? One week! Suffice to say that the resistor was add-ed to the stock as a result of the analysis.
ConclusionA spare parts stocking strategy is still a
somewhat mysterious and misunderstood process, yet it does not have to be. Following the simple process described in this article will allow any organization to minimize the risk to the business of not having the right spares, while simultaneously minimizing the capital invested in spares. It can be taken even further by working closely with parts suppli-ers, OEMs and repair shops, and designing a comprehensive program that would include their involvement and cooperation.
Kris Goly, business development manager for Siemens Asset Performance Management Services, has more than 30 years of engineering and management experience in the manufacturing and service industries. www.usa.siemens.com/services
Mark your calendar and join your colleagues in Jacksonville for the 2013 Vibration Institute Training Conference. The Conference will include:
• Two pre-conference training courses• Sessions on:
- Acceptance Testing - Basic Monitoring - Machine Condition Evaluation - Machine Vibrations Standards and Guidelines - Safety - Signal Processing - And much more . . .
• Exhibit Hall with vendors who will provide you with latest solutions
to take your predictive maintenance program to the next level • Academic Track with presentations from the future generation of
profession• Networking opportunities to meet and collaborate with your
colleagues Additional information and details for the 2013 Training Conference will be available in September.
June 18-21, 2013Wyndham Jacksonville RiverwalkJacksonville, FL
2013 Vibration Institute Training Conference
P: 630-654-2254 E: [email protected]
Save-the-Date!
Criticality Category
Required Lead Time
Delivery Lead Time (days)
Estimated Repair Time (for repairable item)
No. of Like Equipment
Estimated MIN Stock Quantity
1 0 1 2 15 3
2 1 10 7 15 2
3 7 10 8 15 2
4 30 10 8 15 0
Table 2: Example of Estimating Minimum Quantities of Spare Parts


40 oct/nov12
This is a follow-up article to one published in the June/July 2011 is-sue of Uptime magazine.1 Our com-
ponent of interest was the fuel con-trol (FC), with a failure mode (FM)
of “flameout,” where one of two engines shut down in flight. This is called in-flight abort (IFA) and has
a direct “safety of flight” impact on aircraft and aircraft missions, as well as the crew, and, of course,
is a very undesired consequence.
In Part 1 our fuel control, failure mode of flameout was discussed and it was document-ed that using the Weibull Distribution reduces
the number of failure modes by a considerable margin. This equipment condition is a safety-of-flight, so finding a solution as quickly as possi-ble became priority # 1. The process started out with 165 failure modes and was reduced to 7, and as stated these 7 failure modes are the start of the analysis process. You may perform RCM (Reliability Centered Maintenance), RCA (Root Cause Analysis), R&M (Reliability and Mainte-nance), and other processes that lead to a solu-
tion or more than one solution in order to im-prove you product’s reliability for the least cost. Since leaks was the primary failure mode, engi-neering found that the internal Seals were the root cause, so for $15.00 in parts the fuel control started the seal replacement Jan. 2009. Also discussed was the requirement to monitor your Legacy System or Components, this document shows the reduction in leaks, and also showed there were other growing problems (we call these hidden failures because the primary con-cern was the failure mode of flameouts).
The 2011 article showed that there were 165 possible failure modes for IFA events. Using the Weibull distribution, this was reduced to seven. This allowed the support team to arrive at a so-lution of changing out the fuel control seals at a cost of about $20 each.
It is evident that the change to the FC has worked. At this time, approximately 63 percent of the FC population, which is 1,650 units in our inventory (US Navy and Marine Corps), has incorporated the change. The model chosen is the Crow-AMSAA, IEC-61164 reliability growth management, specifically with the BETA (slope) being used for comparing baseline (Jan 03 - Dec 08; 72 months before technical change) to post baseline (Jan 09 - Jun 12; 42 months after tech-
nical change). In the 2011 Uptime article, it was stated that legacy systems and components must be continuously monitored to detect changes in FMs not only for monitoring the ef-fects of an incorporated change, but to deter-mine if other FMs are “moving to the forefront” in systems reliability and operational availabil-ity. When your primary FM effect is reduced, there is a secondary FM that always appears. There is a change in IFAs, as will be seen, and these causes are under investigation, but will probably result in about 80 percent of the inter-nal piece parts changed out*.
Failure Mode Definitions: 069-Flameout • 070-Broken, Burst, Ruptured 177-Fuel Flow Incorrect • 374-Internal Failure
The above FMs were combined and resulted in FM 690-Flameouts caused by Fuel Control (FC) internal failure and 177-Fuel Flow Incorrect. Engineering also came to the conclusion that 80 percent of the internal part of the fuel con-trol must be replaced. This study will continue through the end of 2012 and hopefully a First Article Testing (FAT) will be ready in the first half of 2013.
As previously mentioned, the fuel control flameouts were greatly reduced by our chang-
Improving the Reliability of a Turbofan Jet Engine
Larry TysonPART 2
Part 1 of this article appeared in the June/July 2011 issue of Uptime Magazine
40 oct/nov12
Lockheed SR-71 Blackbird, the world’s fasted jet airplane, used during the Cold War as a spy plane, now sitting in retirement.
Reliability
Engineering for
Maintenance
reliabilityengineering
Re
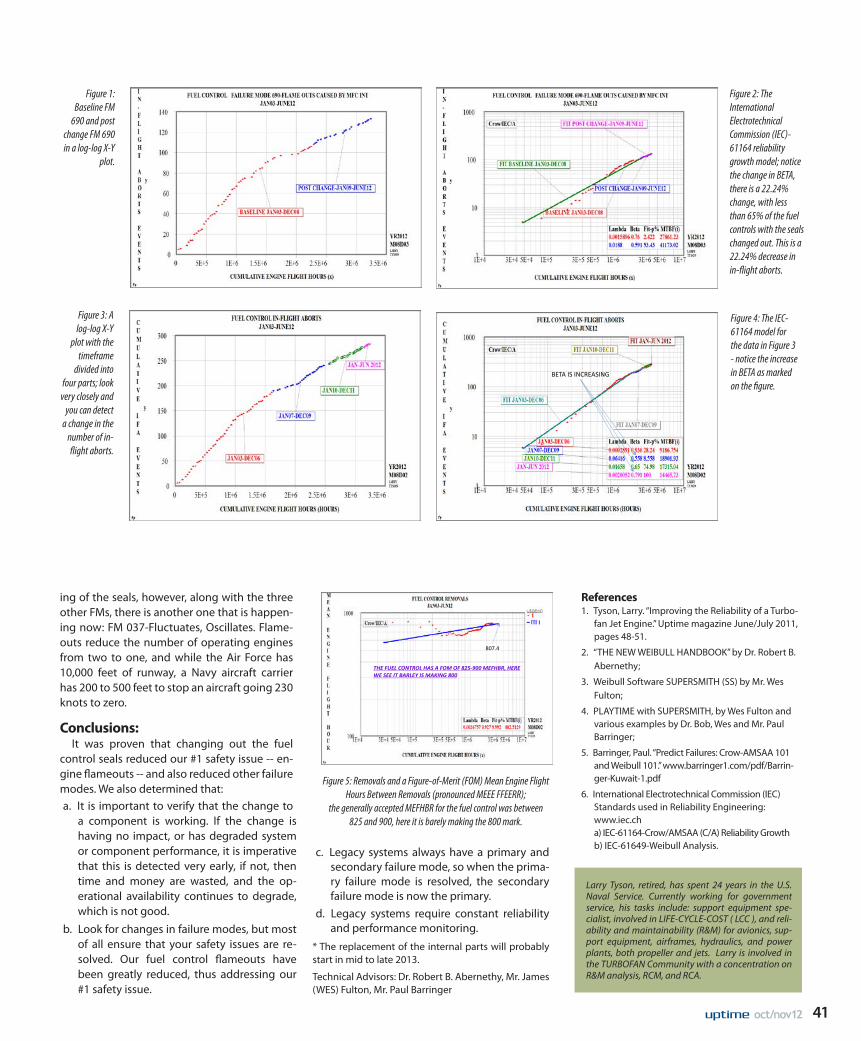
41oct/nov12
ing of the seals, however, along with the three other FMs, there is another one that is happen-ing now: FM 037-Fluctuates, Oscillates. Flame-outs reduce the number of operating engines from two to one, and while the Air Force has 10,000 feet of runway, a Navy aircraft carrier has 200 to 500 feet to stop an aircraft going 230 knots to zero.
Conclusions:It was proven that changing out the fuel
control seals reduced our #1 safety issue -- en-gine flameouts -- and also reduced other failure modes. We also determined that:a. It is important to verify that the change to
a component is working. If the change is having no impact, or has degraded system or component performance, it is imperative that this is detected very early, if not, then time and money are wasted, and the op-erational availability continues to degrade, which is not good.
b. Look for changes in failure modes, but most of all ensure that your safety issues are re-solved. Our fuel control flameouts have been greatly reduced, thus addressing our #1 safety issue.
c. Legacy systems always have a primary and secondary failure mode, so when the prima-ry failure mode is resolved, the secondary failure mode is now the primary.
d. Legacy systems require constant reliability and performance monitoring.
* The replacement of the internal parts will probably start in mid to late 2013.
Technical Advisors: Dr. Robert B. Abernethy, Mr. James (WES) Fulton, Mr. Paul Barringer
References1. Tyson, Larry. “Improving the Reliability of a Turbo-
fan Jet Engine.” Uptime magazine June/July 2011, pages 48-51.
2. “THE NEW WEIBULL HANDBOOK” by Dr. Robert B. Abernethy;
3. Weibull Software SUPERSMITH (SS) by Mr. Wes Fulton;
4. PLAYTIME with SUPERSMITH, by Wes Fulton and various examples by Dr. Bob, Wes and Mr. Paul Barringer;
5. Barringer, Paul. “Predict Failures: Crow-AMSAA 101 and Weibull 101.” www.barringer1.com/pdf/Barrin-ger-Kuwait-1.pdf
6. International Electrotechnical Commission (IEC) Standards used in Reliability Engineering: www.iec.ch a) IEC-61164-Crow/AMSAA (C/A) Reliability Growth b) IEC-61649-Weibull Analysis.
807.4
THE FUEL CONTROL HAS A FOM OF 825-‐900 MEFHBR, HERE WE SEE IT BARLEY IS MAKING 800
BETA IS INCREASING
Figure 3: A log-log X-Y
plot with the timeframe
divided into four parts; look
very closely and you can detect
a change in the number of in-flight aborts.
Figure 1: Baseline FM
690 and post change FM 690 in a log-log X-Y
plot.
Figure 2: The International Electrotechnical Commission (IEC)-61164 reliability growth model; notice the change in BETA, there is a 22.24% change, with less than 65% of the fuel controls with the seals changed out. This is a 22.24% decrease in in-flight aborts.
Figure 4: The IEC-61164 model for the data in Figure 3 - notice the increase in BETA as marked on the figure.
Figure 5: Removals and a Figure-of-Merit (FOM) Mean Engine Flight Hours Between Removals (pronounced MEEE FFEERR);
the generally accepted MEFHBR for the fuel control was between 825 and 900, here it is barely making the 800 mark.
Larry Tyson, retired, has spent 24 years in the U.S. Naval Service. Currently working for government service, his tasks include: support equipment spe-cialist, involved in LIFE-CYCLE-COST ( LCC ), and reli-ability and maintainability (R&M) for avionics, sup-port equipment, airframes, hydraulics, and power plants, both propeller and jets. Larry is involved in the TURBOFAN Community with a concentration on R&M analysis, RCM, and RCA.

42 oct/nov12
Most asset-intensive organiza-tions recognize that efficient and effective maintenance planning and scheduling is one of those cornerstone processes that can help ensure equipment reli-ability and assist with attaining excellence in operations.
The benefits of good maintenance planning and scheduling are numerous and include:• Increased productivity of tradespeople;• Reduced equipment downtime;• Lower spare parts holdings;• Less maintenance rework;• and many more.
Why do we plan maintenance work?Some answers may be:
• So that our customers and production/opera-tions get what they want.
• So everybody knows what we are doing and how we are going to do it.
• To minimize risk.• To provide solid estimates for budget and time.
Yet many organizations still struggle to make their maintenance planning and scheduling as effective as it should be. The following are a few “DOs and DON’Ts” based on years of observa-tions and experiences that should help you if you are in this situation.
Do you have the right person as your planner?
The planner position is one of the most criti-cal in the entire maintenance organization. Se-lecting the right person for this position with the right skills is essential to the success of the group. The planner is responsible for uplifting the utilization rate of the entire group.
To me, there are several key characteristics of a good planner:• Should be highly skilled and qualified craftspeo-
ple -- having 10 to 20 years of experience actually doing work makes them better planners;
• Have a sound knowledge of the principles and practices of planning and the skills for implementing those theories when planning and coordinating work activities;
• Able to establish and maintain effective work-ing relationships with all stakeholders (main-tenance, reliability and operations/process), including in general areas, such as econom-ics, finance, local state and federal laws, and other pertinent programs;
• Ask operators to clarify needs, deal with su-pervisors on a peer level, arrange materials and services through purchasing personnel and vendors, and encourage and interpret feedback from technicians;
• An ability to take an “integrated view;”• Able to write clear, concise and accurate work
descriptions in the job plan;• Has a structured and logical mind;• Seeks order in the world and places things in
a logical sequence;• Has a proactive nature.
DOs & DON’Ts of Effective Maintenance Planning
Questions to Ask.... Shane Daniel
Out in the Field
Work Execution
Management
planning andscheduling
Ps

43oct/nov12
Planners also must have excellent data skills. Planners can’t fall into the trap of planning every job from scratch. They must not only re-search information for new work, but also use past feedback and files to make job plans better. In addition, they must be able to use a comput-er to speed the flow of information.
Is your planner trained?Once you’ve selected the best person, with
the proper qualities and capabilities for the planner position, they still have much to learn. They need to know how to use your computer-ized maintenance management system (CMMS) properly. They need to know how to process work requests and plan them with the appropri-ate level of rigor and detail. They need to know how to extract data from the CMMS and gener-ate reports. Give your planners the type of train-ing that makes them both efficient and effective in their job. Remember, they are key to making the maintenance business unit effective and ef-ficient, and increasing the crew’s utilization.
Do you (and your planners) understand the difference between planning and scheduling?
A lot of so-called “planners” are not actually performing planning work. Instead, they are of-ten acting merely as schedulers. So what is the difference and why is it important? Put simply:
Planning is determining what you need to do, how you are going to do it, and what parts and other resources you need in order to do the work efficiently.
Scheduling, on the other hand, is simply de-termining when you are going to do a job.
It is important to plan work first and then schedule it. Results from DuPont Chemicals and Specialties showed that scheduling unplanned work actually reduces equipment uptime – if you are not going to plan work, then you are better not to schedule it.
Do your planners ever leave their desk?
Continuing on from the previous point, plan-ners must ALWAYS VISIT THE JOBSITE! There will always be things going on at the coalface that the planner may not be aware of and, conse-quently, would not be able to plan for, such as a safety issue, an access situation, etc. It is im-portant to remember that planning (as distinct from scheduling) is NOT a desk job. Generating a weekly schedule in your CMMS is NOT plan-ning – it is scheduling.
How much else do you get your planners to do?
Planners should be planners - ONLY. They should NOT be supervisors, logistics expedi-tors, go-fors, etc. You NEED to understand that a planner cannot be considered as a relief posi-tion of any kind, or be tasked with multiple job responsibilities. If a planner is doing all of the
things a planner should be doing, he or she will not have the time to be multi-tasking for other positions.
Do you use your planners for emergency or unscheduled work?
Planners should not be used for emergency or unscheduled work. As long as you keep pull-ing them into your reactive world instead of let-ting them prepare future work that can be done more efficiently and effectively, you will never get out of a reactive state.
Do your planners keep repeating old mistakes?
You should never ‘plan’ the same job twice. Do it once, properly, the first time and each time that task reoccurs. Dig out the existing ‘plan’ and refine, refine, refine. Nobody should expect it to be perfect the first time around, but over time with repetition and correction, it should get close. Most CMMSs have the capability to store previously planned jobs in a library, yet few or-ganizations use this capability. It should be a matter of habit to look in the library whenever a job arises for a previous plan for that job and only if it does not exist should a new plan be created from scratch. It should also be a matter of habit that any new plans created are stored back in the library for potential future modifica-tion and reuse.
Do your planners correctly schedule the tasks in a job?
How many times do you see technicians standing around waiting for someone else to finish a task before they can start their assigned job tasks? For example, electricians are discon-necting a motor while mechanics stand around waiting. Job sequencing must be an integral part of a planner’s job plan to help minimize lost time.
Do your planners correctly resource the tasks in a job?
Planners should ensure all small losses are removed to eliminate wasted time. Technicians need to concentrate on the tasks at hand, so planners need to ensure the right tools, mate-rials and everything needed to do the job are there on hand when needed. If everything is prepared properly, technicians should not have to search for anything. This includes informa-tion. Planners should not put jobs in a schedule without having everything (ALL materials and parts) prepared and ON SITE. They should never rely on delivery promises; that is a major pitfall to avoid.
Are the job plans or work packs complete, accurate and thorough?
Planners must ensure that technicians have enough information to do the job without hav-ing to stop for additional information. A task should be planned to the level that any compe-
305-591-8935 • www.ludeca.com
WatchVIDEOS
Online
ShaftAlignment
Rotalign® ULTRA
VIBXPERT® II
& GeometricMeasurement
VibrationAnalysis
& Balancing
Easy-to-usesolutions for your
maintenance needs!Sales • Rentals • Services

44 oct/nov12
tent technician can complete the required task steps, even if they have never been to the site or seen the equipment before.
Do your planners receive feedback from the tasks and act upon that feedback?
The planner should have prepared the work, providing tasks to be performed, durations, special tools, materials required, etc. The techni-cians must provide feedback on completion of the task. A simple ‘Done’ is NOT good enough. If there are any errors or omissions, the planner needs to know about them and MUST make the changes to the job plan. If the technician gets the same job plan month after month without any changes, he or she will quickly tire of pro-viding feedback – and that is a huge missed op-portunity.
Do your planners work with your operations department as partners?
The planner must build the needed partner-ships, especially with operations or the planner will continue to struggle and possibly fail. Every-thing possible must be done to communicate with operations in order to develop a schedule
to which everyone agrees. Failure to do this will result in technicians showing up for a job where the equipment has not been taken offline, pre-pared, cleaned, etc.
Does your operations department work with your planners as partners?
Conversely, your operations personnel must commit to doing what they say – making the equipment clean and available for when main-tenance is required. They MUST understand that maintenance IS required. Get them to think of ‘their’ plant as being like ‘their’ car. If they run it into the ground and never take it in for service, it will quickly deteriorate into a useless pile of junk. What on earth would make them think that the plant is any different?
Do your planners have too many KPIs and metrics?
You can measure yourself to death, but it won’t help your bottom line. Metrics should be used to tell you where you are and assist in finding opportunities for improvement. Choose only those that guide your decision-making process on how to properly run your part of the business.
Planners also need to remember that their team and managers do not have all day to sit around and read reports. Information should be concise, to the point and in an easily under-stood (preferably graphic) format. A manager should be able to look at the information and understand it in 30 seconds or less.
Using these steps will help you improve equipment reliability, reduce maintenance costs and operate more safely.
Shane Daniel, Senior Consultant with Assetivity, has had 20 years experience in the reliability and maintenance fields in a variety of roles and industries, which include Military, Oil and Gas, Mining, Mineral Processing and Reliability
Engineering. His ability to ‘think outside the box’ allows him to provide innovative, world’s best practice solutions, while his easy-going, light-hearted manner allows him to engage and in-volve clients and team members, providing them with a sense of ‘ownership’ - resulting in improve-ments that are willingly accepted, implemented and sustained. www.assetivity.com.au
... what industry listens to... what industry listens toUltrasound Solutions 1-800-667-5325
AffordableEnergy Conservationfor the Masses
www.sdthearmore.com/sdt200
Introducing the SDT200
An economy class ultrasound detector without compromise
Now Available!
First published in Assetivity Newsletter

www.uptimeawards.com | (239) 333-2500 | (888) 575-1245
And the Winners are..... Find out December 4th at IMC-2012! All IMC-2012 attendees are invited to the INFORMAL Black | White Uptime Award Presentations.
Join us as we celebrate excellence.
Awards for:Best LubricationBest Electrical ReliabilityBest Design for ReliabilityBest Condition MonitoringBest Maintenance ReliabilityBest Emerging Maintenance Reliability

46 oct/nov12
Advanced maintenance technologies en-able shipbuilders, ship operators and ma-rine maintenance departments to improve
rotating equipment reliability, modernize main-tenance practices and reduce the time vessels spend in docking and port facilities.
These technologies are well-suited for the unique demands of marine environments, where spare parts and expert assistance are often miles away and failures are extremely costly. The challenges also include harsh condi-tions, tight quarters, hard-to-access machinery and oversized components, such as propellers and long-drive shafts.
Installing Massive ComponentsThe huge size of many marine components
has spurred wider use of advanced installation methods, particularly oil injection. This technology efficiently mounts and dismounts large marine components, including propellers, couplings, gears and rudder assemblies.
Oil injection uses pressurized oil to drive large components onto shafts. The components are pressed onto shaft seatings via a hydraulic ring or nut. The newest oil injection systems typically feature built-in pressure gauges, oil reservoirs and high-pressure piping, producing maximum pressures in the range of 400 MPa.
Oil injection is more efficient for mounting large components than the main alternative, heat mounting. For example, a 50-ton propeller can be mounted in less than an hour using oil injection. The same propeller can be dismounted in less than 15 minutes. There are no special requirements for shaft machining or keyways.
New generation marine components, such as couplings, are often designed to accommodate oil injection mounting. One highly popular coupling, for example, comes equipped with a thin inner sleeve having a tapered outer diameter. The inner sleeve is positioned on the shaft. An outer sleeve with a matching tapered inner surface then fits over the inner sleeve. After oil is injected between the two sleeves, hydraulic pressure
drives the outer sleeve up the inner sleeve’s taper, forming a secure interference fit. The fit enables the couplings to transmit torque and axial load over the entire shaft circumference.
New coupling varieties that accommodate oil injection were recently introduced for marine shaft line applications. Here, they can potential-ly replace large flange couplings and eliminate the need for costly reinforcement sleeves.
Mounting Smaller ComponentsShipbuilders and operators around the world
often employ induction heating technology to mount small and medium size bearings and other components. Induction heating expands the inner rings of components, forming a tight fit when the components cool.
Many newer heaters are lightweight and por-table, making them ideal for the limited storage space and tight quarters aboard ships. For ex-ample, an induction heater weighing only 10 pounds, one of the smallest available, heats bearings with bores up to 100 mm and weigh-ing up to 11 pounds. Another, slightly larger device, can heat a 61.6-pound (28 kilogram) bearing in only 20 minutes.
Preventing MisalignmentThe long coupled shafts employed in marine propulsion systems can
be prone to misalignment, which increases wear on seals and often re-sults in premature bearing or coupling failure. Shaft misalignment also causes increased friction and vibration, reducing efficiency and wasting energy.
Manual alignment methods using straightedges are still widely used, but they are steadily losing ground to advanced alignment technologies with highly accurate laser sighting. These instruments require no special training and can be easily mastered by marine maintenance technicians in shipyards and aboard vessels.
One advanced laser-equipped system, for example, consists of a hand-held control unit linked to dual measuring units, which are each capable of projecting laser lines and detecting those produced by the other unit. During alignment procedures, maintenance technicians can view real-time values on the control unit’s screen, allowing them to gradually adjust the coupled shafts until they are properly aligned.
Belt alignment systems can be utilized to align pulley-driven appli-cations aboard ships, including galley machinery, laundry equipment,
Modernizing Maintenance Practices
What We Can Learn from Marine ApplicationsPaul Michalicka
Advanced maintenance technologies, ranging from
specialized coupling mounting tools to suitcase-sized grease analysis
kits, are seeing increased use. In this article, we will focus on the
lessons we can take from their use in marine applications.
Figure 1: Handheld condition-monitoring instruments, such as devices for detecting erosion in electric motors, can help spot problems early and
improve the reliability of rotating machinery aboard ships. (Photo courtesy of SKF USA Inc.)
Asset Health
Management
alignment and balancing
A/B

pumps and fans. They can detect horizontal, vertical and parallel misalign-ment between pulleys that are up to 20 feet apart. The most advanced systems accurately align the grooves of pulleys rather than their faces, allowing alignment of pulleys with unequal widths or dissimilar faces.
Monitoring VibrationCondition-based monitoring programs
utilizing advanced monitoring instruments are also becoming more popular in marine applications. The programs can detect rotat-ing equipment problems at an early stage and generally begin with detailed mapping of a ship’s critical machinery.
An application’s monitoring status is determined by evaluating its operational impact and maintenance complexity. The critical applications covered usually include engine room fans and blowers, cargo pumps, turbochargers, and main and auxiliary en-gine lubrication systems.
Recently, a ship operator developed a monitoring program for thrust-er applications aboard a drilling ship. The program equips maintenance workers with handheld detectors to record vibration levels at key machine points, including on the thrusters’ bearings and gears. After data is col-lected, it is transmitted off-site and reviewed by vibration analysts, who produce reports on the thrusters’ operating condition. The reports enable the ship operator to fine-tune maintenance practices aboard ship and im-prove thruster reliability.
Lube AnalysisMonitoring programs aboard ships often include lubricant analysis,
which can detect changing lubricant properties, such as grease harden-ing or softening and thermal degradation.
One suitcase-sized grease analysis kit, for ex-ample, contains the tools necessary to conduct grease consistency, oil bleeding and contami-nation tests. The tests are performed using only 0.5 grams of grease. They allow maintenance technicians to instantly assess the suitability of greases for a given application and optimize re-lube intervals. The tests can also help determine the shelf life of greases stored aboard ship.
In summary, any maintenance departments can realize substantial benefits from the lat-est generation of maintenance technologies, which range from heavy-duty mounting devic-es to hand-held monitoring instruments. The technologies are well designed for the rigors of industrial applications. They can be deployed to speed maintenance activities, help prevent
potential failures and improve the reliability and performance of rotat-ing machinery.
Figure 2: For alignments involving long, coupled shafts, laser-equipped alignment systems offer much higher accuracy than alignment methods
using straightedges. (Photo courtesy of SKF USA Inc.)
Paul Michalicka is the North American area sales manager for maintenance products, SKF USA Inc. In this capacity, Michalicka assists users of rotating equipment with maintenance expertise and consulting services, with an emphasis on tools and instruments that contribute to machine service life and reliability. www.skf.com

48 oct/nov12
• The average annual maintenance and opera-tions spending on centrifugal pumps is 50 per-cent greater than for any other type of rotating machine (FiveTwelve Group, August 2006).
• Centrifugal pumps in many plants consume more than 50 percent of total plant motor energy (Hydraulic Institute).
• Pumps consume more energy than any oth-er class of industrial equip-ment (U.S. Department of Energy, 2005).
• A Finnish Research Center study of centrifugal pump performance (“Expert Sys-tems for Diagnosis and Per-formance of Centrifugal Pumps,” 1996) found that the average pumping efficiency was less than 40 percent for 1,690 pumps reviewed across 20 different plants, including all market seg-ments. The study also revealed that 10 per-cent of the pumps were less than 10 percent efficient.A large cross-section of our customers oper-
ate between 500 and 2,000 pumps in many of their locations, as well as thousands of other pieces of complex rotating equipment (e.g.,
compressors, mixers, fans, blowers, conveyors, etc.), spending an average of $5.5 million an-nually on maintenance, operation and energy. While these machines have a one-time cost of a few thousand dollars each to purchase and install, the cost to operate them exceeds $10 thousand each per year. This includes main-taining, operating and providing energy for the life of the pump. Many of our customers are in a constant struggle to lower costs and improve output of their plants, and we believe that improving pump reliability is a very sound approach for accomplishing these goals.
The rewards for achieving pump reliability are great and the effort, on the surface, seems fairly simple. After all, most of the elements of reliability are just common sense. But Ralph Waldo Emerson expertly put this idea into per-
spective when he said:
“ C o m m o n sense is as rare as genius.”
The tough part is that no matter how well conceived or how well im-plemented, re-liability efforts
require people to act in very specific and con-sistent ways to sustain the effort. Furthermore, it takes tremendous leadership and discipline to initiate these efforts and keep them on course. Reliability improvement efforts also re-quire inclusion of all plant functions to be suc-cessful. We need to capitalize on our collective knowledge, experience and even our failures
to guide the efforts to improve bottom-line performance. For instance, include mainte-nance personnel and reliability engineers in new equipment designs and selections by bringing their knowledge and failure cause history to the table; have operators participate in performance specifications to make them as clear as possible; challenge purchasing to choose vendors and make final equipment se-lections based on best total cost of ownership as opposed to lowest purchase price; and con-sult stores personnel on existing stock of spare parts to minimize duplication and identify op-portunities to standardize. There are other in-clusions we can make, but you get the picture; make everyone in the business a part of your reliability efforts. Now let’s get to the 10 steps to pump reliability.
The top 10 steps you can take to achieve sus-tainable pump reliability are:
1. Proper Design and Equipment Selection.
2. Proper Installation and Commissioning.
3. Proper Flow Control.4. Proper Operation.5. Proper Maintenance.6. Stock the Right Parts.7. Monitor Efficiency.8. Track Lifecycle History.9. Establish a Pump Management Program.
10. Establish a Configuration Management Process.
Note: Steps 6 through 10 will be discussed in the December/January issue of Uptime magazine.
Tom Dabbs and Dan Pereira
Pump reliability is an old topic, but it is just as relevant today as it was the first time we heard it a few decades ago. There are some very good reasons to focus on improving pump reliability:
10 Steps to Pump Reliability
The rewards for achieving pump reliability are great and the effort, on the surface, seems fairly simple. After all, most of the elements of reliability are just common sense.
Part
1
Work Execution
Management
maintenancemanagement
Mm

49oct/nov12
1. Proper Design and Equipment Selection
Pump specifications should spell out all op-erating requirements and operating param-eters. Some considerations are: • Best efficiency point (BEP) of the selected
pump;• Flow;• Pressure;
• NPSHA;• Speed;• Voltage;• Fluid type;• Specific gravity and PH;• Metallurgy;• Inlet and outlet pipe sizes;• Operating temperature;• Viscosity;• Solids Present;• Chemical reactivity;• Vapor pressure;• Entrained air/gases;• Seal arrangement;• Bearing lubrication method;• Pipe size and configuration;• Physical location and environ-
ment, etc.A complete and accurate speci-
fication is the first step to estab-lishing a reliable pumping system.
Many engineers tend to specify oversized pumps and excessive horsepower drivers on the prem-ise that it is better to err on the side of having too much power for the application than too little. And if the flow of the system is too high coming out of the pump, it simply can be throttled in the discharge side. This approach, although very common, is a very
inefficient and very costly way to design a sys-tem. It increases energy costs for operating the pumping system, reduces the operating life of the equipment and will most likely increase the frequency of failure.
To understand why this is true, you have to understand the basics of how a pump works. Centrifugal pumps operate with a rotating impeller that imparts velocity energy to a liq-uid. The impeller accelerates the liquid and discharges it into the casing and, as the casing area increases, the velocity energy is converted to pressure. Higher velocity brings higher pres-sure.
Pumps are designed for specific flow ranges. When a pump is sized properly and is operat-ing optimally, or at its best efficiency point (BEP), liquid flow is constant and radial forces acting on the impeller are at a minimum. This allows the pump to experience the highest effi-ciencies and lowest vibration. If the pump runs off-BEP at an increased or reduced flow rate, an imbalance of pressure will occur inside the pump. This imbalance can cause shaft deflec-tion, excessive loads on bearings and mechani-cal seals, excessive vibration and heat, all of which significantly reduce the life of the pump and increase the likelihood of premature fail-
ure. Because the majority of pump operating conditions are dynamic and actual flow and pressure requirements fluctuate, it makes it ex-tremely important to size the pump to operate at or near its BEP.
Pumps operating away from BEP display a myriad of issues, none of which contribute to good reliability or efficiency. BEP occurs when the angle of the fluid entering the eye of the impeller is parallel to the impeller blade. Op-erating away from BEP changes the angle of the fluid to the inlet vane and increases the possibility of premature or catastrophic failure of the pump. By causing suction or discharge recirculation, or cavitations, this leads to ex-cessive vibration, increased shaft deflection, increased bearing loads and reduced seal life.
2. Proper Installation and Commissioning
When a pump is delivered to a site, it’s im-portant to take time to inspect it to ensure it matches the order information and has not been damaged. If the pump is stored for less than six months, you only need to store it in a clean, dry environment that is free from con-tamination and excessive heat and vibration to keep it in good condition. If the pump is stored
for more than six months, continue to follow these same guidelines and also begin to rotate the shaft by hand at least every three months to prevent brinelling of the bearing surfaces.
It is important to provide a rigid and flat concrete foundation that weighs two to three times as much as the pump. This will absorb any type of vibration and should pre-vent strain and distortion when you tighten the foundation bolts. There is much detail to preparing a proper foundation and the vendor’s installa-tion manual is a good reference for keeping things on track.
Centrifugal Pump Characteristics
BEP70%
BEP
Centrifugal Pump Characteristics
BEP
TDH
EFFICIENCY BEP
105%
Basic Hydraulics Cavitation
Vane
Bubble Collapse
Bubble Formation

50 oct/nov12
Another good practice is to never draw pip-ing into place by using force at the flanged con-nections of the pump. This can introduce signifi-cant strains on the unit and cause misalignment between the pump and driver. Pipe strain ad-versely affects the operation of the pump, which may result in physical injury and/or damage to the equipment.
Installation and commissioning represent a very small portion of the overall total cost of ownership (TCO). However, improper installa-tion and commissioning will result in problems that significantly reduce the reliability of the pump. These problems often do not surface for a period of time and can require significant time and cost to resolve (e.g., redesign, base plate or foundation replace-ment, piping modifica-tions, etc.). Often these issues are not resolved due to the time and cost required to solve them, thus resulting in reduced life and higher cost of ownership.
Here are some wise rules to follow during installation to avoid pre-mature failure:• Locate the pump as close to the liquid source
as possible.• Make sure there is adequate space around and
above the pump for safety, ventilation, inspec-tion, installation/removal and maintenance.
• Protect the unit from weather and water damage due to rain, flooding and freezing temperatures.
• Do not install and operate the equipment in closed systems unless the system is con-structed with properly-sized safety devices and control devices.
• Take into consideration the occurrence of un-wanted noise and vibration.
• Follow all safety, installation, alignment, start-up, shutdown and operating procedures out-lined in your vendor’s manual.
• Utilize API 686 Standards/Tolerances, or at a minimum the Hydraulic Institute’s standards/tolerances, where applicable.
• Ensure that the distance between the inlet flange of the pump and the closest elbow is at least five pipe diameters. This minimizes the risk of cavitation in the suction inlet of the pump due to turbulence.
• Ensure that elbows in general do not have sharp bends and that the suction piping is one or two sizes larger than the suction inlet of the pump.
• The suction piping must never have a smaller diameter than the suction inlet of the pump.
• Ensure that no part of the suction piping ex-tends below the suction flange of the pump, is adequately below the surface of the liquid source and is level or sloping downward from the liquid source.
• Net positive suction head available (NPSHA) must always exceed NPSH required (NPSHR).
• When checking rotation prior to start-up, dis-connect the pump from the driver to prevent the pump from operating in reverse rotation. Reverse rotation can result in the direct con-tact of metal parts, excessive heat generation and catastrophic failure.
3. Proper Flow Control
Flow control is a very important ele-ment for optimiz-ing the efficiency and lifecycle cost of a pumping system. Controlling flow by throttling a valve in the discharge line is a widely used ap-proach for control-ling the flow, but is generally very inef-ficient and costly in the long run. Pump-
ing fluid against a partially closed control valve consumes tremendous amounts of energy and can cause premature pump failure. This method of flow control modifies the point in which the system curve intersects the pump curve and, if it is significantly away from BEP, pump life will be diminished.
During the design phase, variable frequency drives (VFDs) should be evaluated for flow con-trol. VFDs cost more to purchase and install and aren’t feasible for every situation, but in many cases, smaller horse-power requirements and increased energy efficiency can offset the initial cost. The utiliza-tion of a VFD allows the pump to remain close to BEP over a range of flow by varying the speed of the driver. The VFD allows the pump curve to be adjusted along the system curve as opposed to the use of a control valve that modifies the system curve.
Another method of flow control is the use of a bypass line with a fixed speed driver. This meth-od allows the flow through the pump to remain constant, hopefully at BEP, while modulating the flow rates downstream and diverting some of the fluid back to the source. Under no circum-
stances should the pump flow be adjusted from the suction side of the pump. In doing so, the risk of pump damage far exceeds any possible benefit. Modifying the flow from the suction side of the pump will result in reduced pump life and unsafe conditions that could destroy the equipment and cause serious injury or death.
4. Proper OperationDuring operation of the pump, critical per-
formance elements like flow, pressure, tem-perature, vibration, current load and cleanliness should be continuously monitored to ensure the pumping system is operating efficiently and effectively.
As noted before, it is crucial that pumps are sized properly and operate at the optimum speed to meet the flow and head requirements while remaining at the BEP for the majority of run time. Additionally, it is extremely important to operate the pump properly to guarantee that the equipment will reach its useful design life and for the safety of plant personnel. Pump damage (bearing/seal) is cumulative. Regard-less of the level of damage, it remains with the components until the parts are ultimately re-placed. Multiple episodes of improper opera-tion will cause the pump to fail prematurely.
Some pump operation rules to follow are:• The suction valve is 100 percent open at all
times.• Discharge flow is adjusted to ensure that there
is adequate back pressure to eliminate water hammer or running out to maximum flow.
• Pump is primed and air vented prior to start up.• Seal flush systems are operational prior to
start up.• Lubrication is at proper level and meets speci-
fied quality standards.• Pump must be operated at a speed to main-
tain adequate flow through the pumping sys-tem. (Above minimum flow rate stated by the
manufacturer).• Pumps should not be operated for long periods of time at maximum flow rate.• Do not operate the pump without coupling guards cor-rectly installed.• Pumps should not be operated with the discharge valve com-
pletely closed for extended periods of time.• Do not allow the pump to rotate in reverse.
Failure to follow these rules may result in elevated temperatures, excessive vibration, potential flashing of liquid, cavitations and ex-cessive pressure build-up, which may lead to catastrophic or premature equipment failure, personnel injury, or death.
During the design phase, variable frequency drives (VFDs) should be evaluated for flow control. VFDs cost more to purchase and install and aren’t feasible for every situation, but in many cases, smaller horsepower requirements and increased energy efficiency can offset the initial cost.
As noted before, it is crucial that pumps are sized properly and operate at the optimum speed to meet the flow and head requirements while remaining at the BEP for the majority of run time.

51oct/nov12
5. Proper MaintenanceMaintenance is the second highest cost ele-
ment of TCO at 20 percent, aside from energy at 32 percent, so it is extremely important to establish and follow a rigorous maintenance program to keep pumps in good operating con-dition and maximize their useful life.
Maintaining pumps is fairly straightforward; you generally do the same things you do to any rotating equip-ment. In our experi-ence, the highest cause of pump failure is im-proper operation that causes seal failure and improper lubrication that causes premature bearing failure.
The first order of business is to establish a condition-monitoring (CM) program that in-cludes as many technologies that can be justi-fied. Conditions that should be considered that require some investment in technology are:• Flow;• Pressure;• Temperature;• Vibration;• Ultrasound;• Amp Draw.
Acceptable ranges should be established for each of these parameters with actual readings compared each time they are taken. Readings should be trended over time to identify any trends that require further analysis. Many com-puterized maintenance management systems are capable of having these conditions directly entered into the system electronically and will provide trend charts for timely analysis.
Other conditions that should be considered by more traditional time-based preventive maintenance (PM) activities are:• Lubrication (manufacturer’s specifications);• Seal water flow or packing integrity;• Cleanliness;• Proper air flow;• Foundation or base plate issues;• Piping system hangers and support integrity;• Inspect coupling guards;• Loose bolts.
Professional planning and scheduling tech-niques must be employed to ensure all condi-tion-monitoring and preventive maintenance activities are properly planned and scheduled. To ensure the right actions are performed at the right frequency and action is taken to resolve any issues resulting from the routines, plan-
ning and scheduling cannot be emphasized enough. After all, the issues that are resolved before they evolve into breakdowns are the returns from the CM/PM investment.
Another important element of a good main-tenance program is employing sound reliabil-ity engineering techniques aimed at eliminat-
ing failure. Stanley Nowlan and Howard Heap, the pioneers of reliability-centered maintenance (RCM), concluded that to improve the reliabil-ity of a machine, you had to understand how it could fail and provide a means to eliminate the fail-ure. Eventually, you would eliminate all the ways it could fail and end up with a more reliable ma-
chine. As it turns out, they were right. Manu-facturers of aircrafts and automobiles, and many others, have used these techniques very well to significantly improve reliability of their products.
If you have included these steps in your pump management strategy, you are well on your way to optimizing cost and plant output. This may seem like a lot of effort to keep pumping systems running reliably, but when you compare the effort to the cost of continuous inefficiency and repeat failures, it makes it all worthwhile. Remember, all that you learn about keeping pumping systems running effectively and efficiently can be di-rectly applied to all other assets, making this investment even more valuable. Please read the upcoming conclusion of this article, Ten Steps to Pump Reliability (Part 2), in the up-coming December/January issue of Uptime magazine.
The Revolution Begins!
Only$2,450!
The ALiSENSOR™ Level is here!The ALiSENSOR™ Level is the world’s first iPad Geometric Measurement System. Now, measurements like Straightness, Level, Base Flatness, and Squareness are even easier and more affordable than ever! All ALiSENSOR™ products also come with a 2 Year Warranty!
Call or visit Alignment Supplies, Inc. today to learn more about this revolutionary new system!
419.887.5890 / 800.997.4467 www.alignmentsupplies.com
The ALiSENSOR™ LEVEL is part of the Industrial MFi (Made for iPad) program, with advantages such as:
Win a FREE ALiSENSOR™ Level!Just fill out an entry form on our website!
All measurement Apps are downloaded for free from The App Store!
Works with your pre-existing iPad, iPhone, or iPod Touch!
R&D / Production costs are radically diminished, making the ALiSENSOR™ LEVEL affordable for ANY budget!
RIF™ (Report-In-Field) Technology: take a picture with your iPad, put it in the PDF report, and email the report directly from the iPad display unit!
Tom Dabbs, CMRP, is a Program Manager for Asset Management with ITT’s Plant Performance Services Group. He has an Electrical Engineering degree from Clemson University, with more than 35
years experience delivering behavior-based reliability solutions working with clients to reduce cost and improve business effectiveness. www.ittpps.com
Dan Pereira has worked for ITT - Goulds Pumps for 25 years. He began his career as an applications engineer and moved on to sales engineer with a focus on the chemical/petrochemical, pulp and paper,
engineer contractor and energy markets. Over the past 15 years, Dan has brought his expertise to the classroom, teaching general hydraulics, pump opera-tion, pump maintenance, and pump optimization for the petro chemical, pulp and paper, and energy industries.
Stanley Nowlan and Howard Heap, the pioneers of reliability-centered main-tenance (RCM), concluded that to improve the reliabil-ity of a machine, you had to understand how it could fail and provide a means to eliminate the failure.

52 oct/nov12
Jason Kopschinsky
The True Cost of Poor
Lubrication
In 2011, Des-Case Corporation commissioned a survey of almost 350 industry professionals on the topic of precision lubrication as it relates to overall equipment reliability. We asked them, “How im-portant is precision lubrication to overall equipment reliability?” We provided the respondents with several options for potential responses. The respondents were able to select from one of seven responses, ranging from “critically important,” “important but not critical,” “slightly important” and so on down to “not at
all important.”The results from this survey question weren’t
all that surprising considering who we were asking. And if I asked the question to any-
one reading this article, I’m sure the re-s po n s es I would get back would be similar to the results we received from the original respondents. Over 99 percent of respondents answered that precision lubrication was ei-ther “critically important” or “important but not critical” to the overall reliability of their equipment. (Figure 1)
We then asked a follow-up question: “At your plant, have you achieved a level of lubrication that you would consider close to best practice?” Remember, almost all respondents said they believe lubrication is either criti-cally important or important but not critical, but in this case, only 32 percent of them said they have a program that resembles best practice. And I’m sure if we did a little digging, we could still find room for improvement in those 32 percent. So the take away here is that most industry professionals believe lubrication is important to reliability, but very few have done anything about it. (Figure 2)
Figure 1Figure 2
Figure 3
lubrication
LuAsset Health
Management
The 27th International Maintenance Conference
Conference Speaker

53oct/nov12
Roadblocks to ImprovementsWhen we start to investigate why some plants just don’t make the
grade in precision lubrication, or any maintenance improvement pro-gram, you can really boil it down to three common roadblocks. (Figure 3)
1. Lack of Understanding2. “Firefighting”3. No Management Buy-inLack of knowledge or expertise to do anything is very common. This
is referred to in psychological terms as unconscious incompetence and is the first of four stages involved in the progression from incompetence to competence in a skill. Think of the first stage the same way you may have thought about your first experience driving a manual transmission vehicle. Learning how to effectively operate a manual transmission re-quires a lot of practice to be able to apply the correct inputs to clutch, break, accelerator, stick shift and steering wheel. At one point, you were
completely unaware of what a manual transmission was and how to op-erate one. Over time, with a little awareness, you were consciously, albeit consciously incompetent, in the use of manual transmissions. You still were challenged when operating one and understood there was a gap between the way you currently operate and the way the manual trans-mission should be operated. With more time and effort, you know how to operate the manual transmission, although it takes a significant amount of concentration in the stage referred to as consciously competent. Over time, the operation of the manual transmission becomes second nature. In this, the final stage of learning, you become unconsciously competent at doing the task. It becomes business as usual.
Simply put, people don’t know what they don’t know. Within the main-tenance community, there are several catalysts that will highlight a lack of understanding in lubrication and the subsequent need for change, one of them being catastrophic equipment failure. This type of issue al-ways brings lack of understanding to the forefront. The solution is always some kind of education, formal or informal, and partnering with some kind of outside support, be it a products company and consultant, your oil analysis lab or your lubricant supplier.
We have all faced the challenge of being too busy “firefighting” to make any headway on a lubrication program. We’re often paralyzed by the mounting issues in our current program to spend any time address-ing the root causes and working to eliminate them. Short of increased headcount in our maintenance department, outside support is often the best solution. Again, that support can come from numerous sources.
Perhaps the most challenging barrier is lack of management buy-in. Lack of management buy-in can be overcome with a financial business case analysis. Once we can see our way through these challenges, we need to sort it all out. We need to decide where to start. We obviously want to capitalize on the low hanging fruit and those items that are go-ing to give us the quickest return on any investment we make. But how do we do it?
What is Poor Lubrication?The pathway to success in lubrication is not much different than any
other improvement program within the plant. You need to quantify your current program. Whether your lubrication program is formal or informal, sophisticated or simple, identifying where you are in contrast to where you want to be is the first and most important step. This helps to identify the gaps. The biggest gaps, the gaps that are going to give you the great-est return on investment, are the ones you need to focus on.
Identifying the gaps allows you to design a program around the gaps you want to focus on first. After designing the program, it’s time to ex-ecute it and put it into practice. You’ll need to make sure everyone is edu-cated to the point where they can do their job effectively. Then, measur-ing successes and reevaluating gaps will help to continuously improve.
When we look to identify gaps in our lubrication program, we focus on 10 key areas:
1. Lubricant purchasing, selection and quality assurance2. Lubricant storage, handling and dispensing3. Lubricant application practices
4. Equipment maintainability and contamination control5. Oil sampling practices6. Oil analysis and basic inspections7. Lubrication PM optimization8. Training and education9. Lubrication scheduling, tracking and reporting metrics10. Leakage control, safe lubricant handling practices and environ-
mental complianceSome of these categories may be more important than others depend-
ing on the type of production facility and equipment within it. However, each area plays a role in our holistic approach to improving our lubrica-tion program. To know how to identify gaps, it’s important to know what poor lubrication actually is.
Many people hear “poor lubrication” and they immediate think this term refers to the quality of the lubricant itself, and it can. However, poor lubrication is really any aspect of a lubrication program not done with precision and includes:
1. Incorrect amount of lubricant; too much or too little lubricant.2. Wrong lubricant type; incorrect viscosity, base oil type, thickener (if
applicable) or additives.
Figure 3
Figure 4: The Stages of LearningTime
Effor
t

54 oct/nov12
3. Poor storage and handling; outside, not under cover, not climate controlled.
4. Ineffective dispensing or application; using methods and tools not considered best practice.
5. Inefficient contamination control; inconsistent or non-existent ap-proach.
6. Unskilled personnel; not trained or educated to what precision lu-brication is or why it’s important.
Where Improvement Programs FailA typical lubrication assessment process follows the same path as most
assessment exercises. A benchmark is completed in an attempt to capture the current culture surrounding lubrication. Then, a gap analysis may be done to identify the difference between the current practice and what would commonly be considered best practice in a specific area of lubrica-tion. Unfortunately for many assessments, this is where it ends. The client is left with a document that speaks to their issues, but offers little in the way of a path forward or a way to communicate the need for change to man-agement. Most lubrication improvement initiatives fail because the recom-mendations provided are too generic and do not look at lubrication holisti-cally. Without specific action items, a business case analysis, timelines and follow-through, improvements rarely get executed fully.
As an example, consider how many home improvement programs have failed in the past because specific action items didn’t exist. I con-sider myself a fairly handy person and decided that I could save some money by building a deck in my backyard myself without contracting it out. I consulted with a big box lumber retailer, designed my deck with their design software and they provided me with a bill of material for all the necessary hardware. A few days later, the material arrived on my driveway with no sign of an instruction guide or task list. Luckily I, like many others, was able to build my deck to the satisfaction of my “upper management,” but not without some challenging moments. However, I could have failed just as easily.
The Language of ManagementPerhaps the most challenging roadblock to launching a successful lu-
brication program, and perhaps the most important component, is illus-trating the financial benefits and gaining management buy-in. However, as the story goes, maintenance people like us have had a difficult time quantifying the benefits of precision lubrication and acquiring the fund-ing we need to build our programs.
Engineers and maintenance professionals tend to talk in highly techni-cal terms. We tend to use terms like ISO particle count, turbulent sam-pling zone, NLGI grade and filtration beta ratio. We often try to illustrate the benefits of lubrication program improvements with what we know to be technically true with little regard for the terms that are usually im-portant to executive management. Executive management speaks the language of dollars and cents, not ISO VG68, or NLGI 2. Our job as main-tenance professionals is to convert what we know about reliability and lubrication into language executive managers can understand.
Many studies have concluded, as has the following one, that, “While the cost of purchasing lubricants typically amounts to less than one per-cent of a plant’s maintenance budget, the downstream effect of poor lu-brication can amount to as much as 30 percent of a plant’s total mainte-nance costs.” I hear the beginning of this statement a lot and it’s probably true for many. Management often feels there’s little or no opportunity to improve their lubrication program because they spend relatively little on
lubricants. As this example states, that’s really not the case. The total cost of your lubrication program is the sum of not just the lubricant or the upfront costs, but the ongoing and downstream costs as well. The sum of all these costs can be significant.
What we really need to do is convert what we know into a cost benefit analysis where we take a critical and conservative look at the upfront and ongoing costs and attempt to quantify the potential financial impact.
In the time that I have been consulting on lubrication programs, I’ve found that most companies are losing between five percent and 15 per-cent of their annual maintenance budget to poor lubrication. I use a very comprehensive tool, along with specific case studies, to evaluate the cur-rent practice and tie it into an analysis like the one shown in Table 1. In this example, I was able to conclude that this company is losing more than $2.5 million every year due to poor lubrication from an annual main-tenance budget of $15 million. Of that $2.5 million about 20 percent of that can be immediately addressed. We’ll call this the low hanging fruit or the biggest bang for your buck. This cost benefit analysis (CBA) is based on discounted cash flow analysis to value the project using the concepts of the time value of money. Because we know that the value of a dollar is worth more today than at any point in the future and there is a cost of using this capital on this improvement program, your accounting team and executive management will require that all future cash flows are esti-mated and discounted to give their present values. What we end up with is the value of the potential return in today’s dollars. (Table 1)
It’s easy to see the return on investment is quite significant. After a $95 thousand initial investment to tackle the immediately-addressable lubri-cation losses, and after ongoing costs of about $37 thousand per year, the five-year net present value (NPV) is close to $1.3 million. This is a great investment and, in this case, we really are just scratching the surface.
There is so much more to lubrication programs than what is on the surface. If we can navigate our way around typical roadblocks with edu-cation and awareness, technical and project management support from subject matter experts, and the support of our management team, we stand a much better chance of making impactful and lasting changes that benefit the entire organization.
Jason Kopschinsky, CMRP, C.E.T., MCPM, joined Des-Case as the Technical Services Manager in April of 2011. Prior to joining Des-Case, Jason has spent over a decade coaching clients in asset reliability and lubrication management. Jason has published a va-riety of technical articles on condition monitoring, contamination control, lubrication management and program management, and has been invited to speak at numerous international symposia. www.descase.com
We have all faced the challenge of being too busy “firefighting” to make any headway on a lubrication
program. We’re often paralyzed by the mounting issues in our current program to spend any time addressing
the root causes and working to eliminate them.
Table 1

www.reliabilitysolutions.net
PRECISION MAINTENANCEEssential Craft Skills
ASSET CONDITION ASSESMENTEssential Predictive Technology Skills
EFFECTIVE ORGANIZATIONS
Forget the Boring Lectures ...Our Hands-On Reliability Training is
Returning Millions in Profits...
Systems, People, Methods
PROCESS EXCELLENCEEssential Asset Care

56 oct/nov12
There is a plethora of oil analysis training courses in the market to-day. However, any course of reputable quality will discuss strategies around setting alarms for wear debris. The primary strategies for
wear debris alarms include:• OEM recommended absolute values,
• Statistically derived,
• Rate of change.
Absolute ValuesThe beauty behind OEM recommended absolute values is that it gives
a starting point on wear alarms. This is especially useful when an end user is just getting started on the road to oil analysis. However, the key phrase here is “starting point.” It has been noted and proven in multiple studies
that two like machines running the same process, under the same load, can, and most likely do, have different levels of wear over similar time pe-riods. Here lies the problem with absolute wear alarms.
Let’s look at a case involving a process critical gearbox at an industrial location that utilized OEM recommended absolute alarm values. This par-ticular gearbox had historically been running 0ppm of iron during the regu-lar oil samples. During one particular sample, the iron value came back at 6ppm. While in many instances, 6ppm in an industrial gearbox is considered to be just noise, but in this particular instance, there was a major cause for alarm. The analyst in this case reviewed the iron data, was able to cross-correlate that data with other oil sample data such as PQ index (Figure 1) and particle count data (Figure 2), all which showed significant increases, called for additional testing and warned of an impending failure.
With alarms being a primary tool in today’s predictive maintenance programs, it is becoming increasingly important to fully understand the concepts around setting alarm levels.
With oil analysis, we are looking at three primary categories: machine health, lubricant health and system contamination. For the purpose of this article, we will focus on those alarms related to
machine health, with follow-up articles focusing on the remaining types of alarms.
Matt Spurlock and Jeff Keen
Understanding the Rate of Change Dangers with
Alarms
Figure 1: Iron and PQ in lock step trend Figure 2: Particle count data supporting Iron and PQ jump
Asset Health
Management
oil analysis
Oa
The 27th International Maintenance Conference
Conference
Speaker
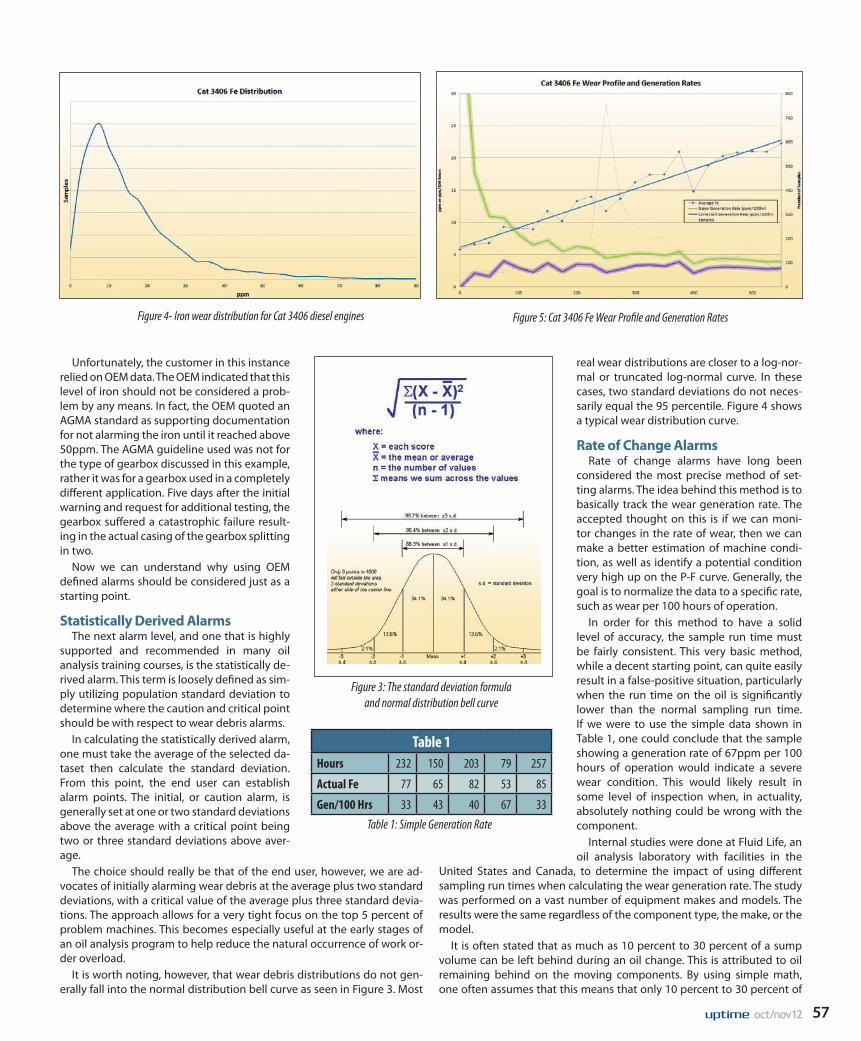
57oct/nov12
Unfortunately, the customer in this instance relied on OEM data. The OEM indicated that this level of iron should not be considered a prob-lem by any means. In fact, the OEM quoted an AGMA standard as supporting documentation for not alarming the iron until it reached above 50ppm. The AGMA guideline used was not for the type of gearbox discussed in this example, rather it was for a gearbox used in a completely different application. Five days after the initial warning and request for additional testing, the gearbox suffered a catastrophic failure result-ing in the actual casing of the gearbox splitting in two.
Now we can understand why using OEM defined alarms should be considered just as a starting point.
Statistically Derived AlarmsThe next alarm level, and one that is highly
supported and recommended in many oil analysis training courses, is the statistically de-rived alarm. This term is loosely defined as sim-ply utilizing population standard deviation to determine where the caution and critical point should be with respect to wear debris alarms.
In calculating the statistically derived alarm, one must take the average of the selected da-taset then calculate the standard deviation. From this point, the end user can establish alarm points. The initial, or caution alarm, is generally set at one or two standard deviations above the average with a critical point being two or three standard deviations above aver-age.
The choice should really be that of the end user, however, we are ad-vocates of initially alarming wear debris at the average plus two standard deviations, with a critical value of the average plus three standard devia-tions. The approach allows for a very tight focus on the top 5 percent of problem machines. This becomes especially useful at the early stages of an oil analysis program to help reduce the natural occurrence of work or-der overload.
It is worth noting, however, that wear debris distributions do not gen-erally fall into the normal distribution bell curve as seen in Figure 3. Most
real wear distributions are closer to a log-nor-mal or truncated log-normal curve. In these cases, two standard deviations do not neces-sarily equal the 95 percentile. Figure 4 shows a typical wear distribution curve.
Rate of Change AlarmsRate of change alarms have long been
considered the most precise method of set-ting alarms. The idea behind this method is to basically track the wear generation rate. The accepted thought on this is if we can moni-tor changes in the rate of wear, then we can make a better estimation of machine condi-tion, as well as identify a potential condition very high up on the P-F curve. Generally, the goal is to normalize the data to a specific rate, such as wear per 100 hours of operation.
In order for this method to have a solid level of accuracy, the sample run time must be fairly consistent. This very basic method, while a decent starting point, can quite easily result in a false-positive situation, particularly when the run time on the oil is significantly lower than the normal sampling run time. If we were to use the simple data shown in Table 1, one could conclude that the sample showing a generation rate of 67ppm per 100 hours of operation would indicate a severe wear condition. This would likely result in some level of inspection when, in actuality, absolutely nothing could be wrong with the component.
Internal studies were done at Fluid Life, an oil analysis laboratory with facilities in the
United States and Canada, to determine the impact of using different sampling run times when calculating the wear generation rate. The study was performed on a vast number of equipment makes and models. The results were the same regardless of the component type, the make, or the model.
It is often stated that as much as 10 percent to 30 percent of a sump volume can be left behind during an oil change. This is attributed to oil remaining behind on the moving components. By using simple math, one often assumes that this means that only 10 percent to 30 percent of
Figure 4- Iron wear distribution for Cat 3406 diesel engines Figure 5: Cat 3406 Fe Wear Profile and Generation Rates
Figure 3: The standard deviation formula and normal distribution bell curve
Table 1 Hours 232 150 203 79 257
Actual Fe 77 65 82 53 85
Gen/100 Hrs 33 43 40 67 33Table 1: Simple Generation Rate

58 oct/nov12
residual debris would be left behind as well. That is not the case. Accord-ing to a portion of the study, which included 3,772 samples, 49 percent of the iron was left behind after an oil change, on average. Looking at a completely different make and model of component with a total of 687 samples, the study showed 58 percent of wear debris remaining after an oil change, on average.
This tells us that we simply can’t assume the wear metals start at 0ppm. We also cannot assume that the majority of wear debris is removed during an oil change. In fact, if we do continue to utilize the “as preached” way of calculating generation rate, we are setting up for failure. The Fluid Life study indicates that when comparing the “naïve” rate to the actual wear rate, there is a 273 percent increased chance of calling a component in a state of failure when all may very well be normal.
As we refer to Figure 5, the Actual Fe line is the average Fe in ppm for all samples in each oil hour “bucket.” The oil hour buckets are grouped in 25 hour increments such that the “0” bucket includes all samples >= 0 hours up to and including those samples collected at 24 hours. The 25 hour bucket are those samples listed >=25 hours up to those samples collected at 49 hours, etc.
The naïve generation rate is the average Fe in each bucket divided by the bucket center value and then multiplied by 100 hours and is in ppm per 100 hours. (i.e., 0 bucket = 6.59/12.5*100).
The “corrected” is the average Fe in each bucket, with the estimated y intercept from the fitted line subtracted and then divided by the bucket start and multiplied by 100 hours.
Using this method allows one to calculate a better estimation of the generation rate using just the data for a single sample coupled with the
intercept knowledge. As can be seen in Figure 5, the naïve generation rate will show substantially higher ppm/hr readings if the oil hours are lower than normal, particularly if they are less than 100 hours. Also, it counterin-tuitively informs us that the generation rate steadily decreases as the oil is left in for longer amounts of time.
In ConclusionThe proper setting of wear debris alarms can have a make or break ef-
fect on the overall effectiveness of an oil analysis program. While the goal of predictive maintenance is to identify a potential failure high up on the P-F curve, without a full understanding of alarms, it is likely that one could create a false identification of failure. Once that is done, a site will experi-ence a similar effect as a missed opportunity and the credibility of the entire oil analysis program comes into question.
Perform reliable motor maintenance with the best name in motor testing
To learn more about static motor analysis equipment from SKF, call us at the SKF Condition Monitoring Center - Fort Collins, at 1-800-752-8272, or visit us online at http://www.bakerinst.com.
Decades of experience are forged into each and every electric motor analyzer we make, ensuring the rugged high quality and versatility you expect from your portable electric motor test equipment.
SKF electric motor analyzers, which include the all-new Baker DX and the Baker AWA-IV, and the EXP4000, deliver the widest range of motor testing capabilities of any brand. For quality assurance and condition monitoring of electric motors or generators your company depends upon, there’s a motor circuit analyzer from SKF that can deliver the information you need to keep your rotating equipment working properly – and help drive your company’s business success.
The Power of Knowledge Engineering
Jeff Keen is a Professional Computer Engineer. He serves as Vice President of Information Technology and Research and Develop-ment with Fluid Life. With 21 years of experience, Jeff designs and develops systems to manage and evaluate oil analysis results and related information.
Matt Spurlock is a Certified Lubrication Specialist and a Certified Maintenance & Reliability Professional. He serves as a Senior Reliability Specialist and Instructor with Fluid Life. With over 20 years in the field, Matt specializes in in-depth oil analysis data evaluation and lubrication program optimization for customers across all industries. www.fluidlife.com

This is a book written for the improvement Leader who is tasked with developing a business culture focused on continuous improvement.
Order Today! www.mro-zone.com | (239) 333-2500 or (888) 575-1245 ext. 3
This book is of vital importance to anyone concerned with productivity, quality, safety, and environmental integrity. Initially developed by the aviation industry, RCM is rapidly becoming fundamental to the practice of maintenance management.
In this book, world renowned author and maintenance expert Terry Wireman, focuses on developing a work management process that will support the maintenance strategy components and much more!
These are the Top 5 Topics you NEED to know about....
Work Management2
Equipment Reliability3
Manufacturing Process Reliability4 Business and
Management5
Gain an expert view of plant design, procurement, parts management, installation and maintenance, training, and implementation of a computerized maintenance management system.
by Terry Wireman
by John Moubray
by Ron Moore by Darrin J. Wikoff
by Winston P. Ledet, Winston J. Ledet & Sherri M. Abshire
People Skills1
Join James as he embarks on a journey of lasting Heroic Change in his struggles to create a safe place for employees to work while satisfying his superiors with improved performance as he begins his journey to the Precision Domain.
The CMRP* Examwill be offered atthe SMRP AnnualConference and
IMC-2012.
Visit theMRO - Zone
Book Store atthese two events.
Maintenance Professional Certifications Exam?
Maintenance Professional Body of Knowledge
Are you Preparing for the
$199All Five Books
thru October 31st
Special Exam Prep Offer!
$50Save Over
* CMRP is a trademark of the Society for Maintenance & Reliability Professionals (SMRP). SMRP does not endorse any book or other product/service. No part of this ad should be considered an endorsement by SMRP.

60 oct/nov12
A good example of this situation oc-curred on a refrigeration compression train. This two-case train consisted of
a horizontally split compressor containing seven impellers, with a rotor weight of 750 pounds. The steam turbine driver contained a three-stage rotor that weighed 800 pounds. This turbine was rated for 5,000 HP at 9,000 RPM. The machines were connected with a lubricated gear type coupling. Both machines contained five pad tilting pad bearings, with nominal diametrical clearances between 5 Mils and 7 Mils. The refrigeration train had a good operating history, with only occasional problems at the turbine exhaust end bear-ing. In order to ensure continued reliability of this train, a turbine bearing inspection was
scheduled for an upcoming turnaround.Bearing inspection of the turbine exhaust end bearing revealed the
pads and the shaft journal in excellent condition. The measured diametri-cal clearance of 6 Mils was within specifications. No other maintenance work was performed and the housing was reassembled using the same bearing as-sembly. Maintenance personnel were con-fident that the train was in excellent condi-tion and the previous issues on the turbine exhaust bearing were nonexistent.
Successful startup by operations oc-curred late one evening. The ramp up was smooth and the machine was lined out at a constant speed of 8,955 RPM. Overall shaft vibration amplitudes at each of the four radial bearings were acceptable and thrust positions for both rotors had returned to their previous operating positions. The only abnormality was a high temperature of 210 F at the turbine exhaust end bear-ing. This bearing historically operated be-tween 160 F and 170 F as measured by a thermocouple embedded in the bottom bearing pad.
Bearing temperature increased to 215 F during the warmth of the next day. At this point, concern began to develop about the longevity of this bearing. Vari-ous inspections and examinations were
performed with inconclusive results. In an effort to understand the shaft vibration, plant personnel employed a spectrum analyzer to produce FFT plots of the proximity probes. A typical set of spectrum plots across the coupling are shown in Figure 1.
FFT data from the Y-axis proximity probe at the turbine exhaust and the coupling end compressor bearing are displayed in Figure 1. Note that both spectrum plots reveal acceptable amplitudes at 1x rotational speed, plus a string of running speed harmonics (i.e., 2x, 3x, 4x, etc.). On the tur-bine exhaust, the amplitude of the second harmonic was twice as large as the fundamental 1x component. This vibration data was of concern to the plant personnel and two different opinions were soon openly debated.
Some people were convinced that the series of multiple harmonics were due to mechanical looseness of the turbine bearing. Others had the opinion that the vibratory behavior was due to misalignment across the gear coupling. One proposed solution was to monitor vibration as the compressor’s hold down bolts were loosened and the compressor was al-lowed to move into a state of satisfactory hot alignment. For the uniniti-ated, it must be recognized that this type of action is extraordinarily dan-gerous. There is massive energy contained in an 800-pound rotor rotating at 8,955 RPM. The danger of releasing that energy by unloosening the hold
down bolts is obvious and is not justifi-able. Fortunately, this activity was not implemented and it was agreed to just continue monitoring the machinery.
Both theories were downgraded following several days of operation. Each day, shaft vibration amplitudes remained constant and the turbine exhaust bearing temperature cycled between 210 F and 215 F. Clearly, if the turbine bearing was loose, the behav-ior would tend to degenerate with time and that did not occur. The misalign-ment theory was also discounted. Spe-cifically, if heat generation in a bearing was due to misalignment, it is logical to believe that the bearing would either fail or relieve some clearance due to the applied preloads. It is hard to be-lieve that any significant misalignment would appear as constant vibration and elevated temperature without any change. Furthermore, the maintenance work performed during the previous turnaround did not disturb the cou-pling alignment. At this time, it was
Nine Are For Cooling
Troubleshoot-ing machinery
problems are often hampered by inconclusive
or inaccurate data, combined with the human
influence of contradictory
opinions.
Figure 1: FFT of shaft proximity probes
Robert C. Eisenmann, Sr.
Drops
Asset Health
Management
vibration
ViB

61oct/nov12
necessary to examine the machinery behavior in more detail to resolve this problem.
Time domain presentation of the vibration signals are shown in Fig-ure 2. At both measurement planes, the time base signals are corrupted by a series of repetitive spikes. These spikes are generally indicative of shaft surface imperfections. There is a distinctively different pattern between the turbine signal and the compressor probe signal. However, both cases are representative of rough shaft surfaces below the respective probes. Comparison of the Y-axis data with the associated X-axis probes at each measurement location (not shown) reinforces the fact that the spikes are shaft surface scratches. Hence, the majority of the harmonic activity shown in Figure 1 is simply due to shaft surface imperfections.
Continued hot operation of the turbine bearing was an indisputable fact. Bearing housing measurements with a surface pyrometer confirmed that the housing was hotter than normal. Unfortunately, the approaching hot summer days would only aggravate this situation. It was hard for the plant personnel to justify an entire plant shutdown to investigate this hot bearing without any real inspection objectives. At this point, a set of cas-ing velocity measurements was acquired across the coupling. The resul-tant FFT plots are exhibited in Figure 3. This data shows that higher order
harmonics do not exist on the bearing housings. As with many turbines of this general size, the exhaust end bearing is a fairly simple assembly. There is normally a close relationship between the frequencies of vibration com-ponents measured on the shaft versus the casing. More specifically, if the turbine shaft was really subjected to a severe misalignment condition, a strong twice rotational speed component should be visible.
No real evidence appeared to support the previous theories of loose bearing or misalignment. Thus, the source of the hot turbine bearing re-mained unanswered. Like other machinery problems, it is mandatory to thoroughly examine the operating equipment. This approach includes “go out and look, touch, feel, smell and listen to the machinery.” In many cases, you do not know what you are looking for so the best advice is to look for any peculiarities. On this train, it was finally observed that the oil flowing through the bearing drain sight glass was minimal. This simple observation was previously overlooked by everyone. There is an old adage that states: “For every 10 drops of oil, only one drop is for lubrication and the remaining nine drops are for cooling.” On this bearing, there was evidently enough oil flow for lubrication, but not much left over for cooling.
Testing this hypothesis of restricted oil flow was accomplished by raising lube oil supply pressure from 20 psig to 25 psig. This change was carefully monitored to ensure there was no detrimental effects to the other machine train bearings. As the oil supply pressure was gradually in-creased, the bearing temperature dropped. At an oil pressure of 25 psig, the 215 F bearing temperature was reduced to 203 F. In addition, the oil flowing through the drain sight glass did perceivably increase.
In conclusion, the refrigeration train operated successfully through the hot summer in this manner and ran for another six months. At that time, the bearing was opened during a short plant outage. It was discov-ered that Permatex® was blocking the oil inlet to the turbine exhaust bear-ing. After this blockage was removed, subsequent turbine operating bear-ing temperatures returned back to normal levels between 160 F and 170 F.
Some Lessons To Be Learned:1. Don’t make quick judgments based on poor, inconclusive, or conflict-
ing data.2. On complex dynamic vibration data, don’t get locked into a single
form of data evaluation and presentation.3. Don’t get fooled by the data processing characteristics of any analyti-
cal instrument.4. Always consider overall vibration characteristics of the machinery,
including relative shaft vibration and position, plus absolute casing motion.
5. Always exam traditional machinery operational parameters, such as oil flow, valve positions, pressures, temperatures, seal parameters, etc.
6. Always look for a confluence of information and be cautious of di-verging indicators.
Robert C. Eisenmann, Sr., is President of Wilpat, Inc., providing technical training in machinery malfunctions and vibration analysis. He has dealt with process machinery throughout his 45-year career beginning with operations and maintenance experience at Shell Oil and Northern Petrochemical. He is a retired registered Professional Engineer in Illinois, Nevada and Texas. His initial undergraduate work
was at the University of Illinois, and he is a 1965 Mechanical Engineering graduate of the Illinois Institute of Technology. www.wilpat.biz Figure 3: FFT plots of casing velocity probes
Figure 2: Time domain plots of proximity probes
“For every 10 drops of oil, only one drop is for lubrication and the remaining nine drops are for cooling.”
This article was extracted from Robert Eisenmann’s book: Machinery Malfunction Diagnosis and Correction, pages 343 to 347. Original Publication Date: November 26, 1997. Author currently owns copyright.

62 oct/nov12
QHow would you describe the con-cept of hidden failure?
AA hidden failure is a failure that has already occurred and under normal
circumstances would go unnoticed by the operating person or crew. Under nor-mal circumstances, such a failure would not become evident by itself to the op-erator or operating crew until there was another failure and the original cause identified during root cause analysis.
QCan you cite an example of a hid-den failure?
AA boiler that NORMALLY operates at a pressure below 180 psi has a safety
valve that opens when pressure is above
200 psi. Unfortunately, the safety valve is stuck (failed state) and will not operate, but no one knows this since under nor-mal circumstances the boiler operates below that limit. Since under normal con-ditions the safety valve is not required to operate, there would be no evidence of such failure and nobody would know that it has occurred. Therefore, we call it a “hidden” failure -- it has happened and nobody is aware of it. It will only become evident if something else happens, for example excess pressure (which is NOT normal). We then face a multiple failure, which can be catastrophic. (In a worst case scenario, the boiler blows up, caus-ing fatalities.)
QWhat impact can hidden failures have on areas like safety and the
environment?Since protection devices are prone to
hidden failures, these failures can have a very high impact, often DRAMATIC con-sequences on safety (somebody could get hurt or killed), or damage to the en-vironment (an environment regulation would be violated).
Q Can a hidden failure have impact on production?
AYes! On top of safety and environ-ment issues, which obviously would
impact production, even if no safety or environmental risks are at stake, there
Uptime Magazine’s Steve Thomas (left) recently caught up with Henry Ellmann (right) to discuss his keynote address at IMC-2012 in Bonita Springs, Florida, December 4-7th.
QA&Reliability
Engineering for
Maintenance
failure modes effects analysis
FmEA
The 27th International Maintenance Conference
ConferenceKeynote Speakers

63oct/nov12
can be dramatic production impacts. This can be even more significant if any redundant equipment is in failed state as well. For example, suppose the standby water pump, which “protects” the service pump as a backup if it fails and only op-erates under those circumstances, is in a failed state as well. The failure of the redundant water pump would also be a hidden failure since on its own and un-der normal circumstances nobody would know it was in failed state. This only mat-ters if and when the primary service pump should fail (multiple failure). This type of event, solely caused by multiple failure, a consequence of a hidden fail-ure, would certainly impact production.
Q What is the difference between a Hidden Failure and a Potential
Failure?
AA Potential Failure is “a clear warn-ing” that a failure has started to oc-
cur. It allows us to PREDICT the failure since the failure mode has not yet gener-ated a functional failure. The equipment is still fulfilling its function, but there is a warning that something has started to fail. (Condition-based maintenance = prediction)
A Hidden Failure is a failure that has al-ready occurred and, as such, the affected equipment will not fulfill its function (the alarm will not sound, for example). Since it is hidden, nobody would know until another failure occurs, which by then may have catastrophic consequences (“multiple failure.”)
Q Can you explain why this potential source of a reliability problem has
gone largely unaddressed?
AWhile there is more and more aware-ness around this serious issue, as
around the importance of the whole re-liability approach, there is unfortunately still not enough “calling to conscience” of such very important matters. More awareness must be generated through training at all company levels. As a first step, CEOs should know and understand these problems. It is not enough for the technical staff to acquire better knowl-edge on these subjects if they are not understood and supported at the higher levels of the organization.
Q What can be done to raise the level of understanding about hidden
failures and their impact?
AAs said in my answer to the previous question, more knowledge and in-
formation transfer at all company levels is mandatory. I am convinced that until it is realized that certain basic concepts should be included into basic train-ing starting at kindergarten, concepts learned “the hard way” as adults and/or by costly “trial and error,” will too slowly evolve into visible improvement.
Q Currently, we conduct a great deal of asset inspection searching for
impending problems so they can be corrected in advance of a major failure. How will a better understanding of hid-den failure change our approach?
AIt should be understood that the correct handling of hidden failure in-
spection is conceptually DIFFERENT from failure prediction by condition monitor-ing. A different form of inspection task will become necessary. In RCM, this is
called the “failure finding task” for the hidden failures. By implementing failure finding tasks for hidden failures, using the correct methodology and correct frequency (FFI - Failure Finding Interval), a major and necessary enhancement of the reliability effort will be achieved. To get this done, awareness and a clear
understanding of the problem and its importance are mandatory in the first place. Further, this level of understand-ing must take place at all management and floor levels within the organization.
QCan prediction be economically built into asset design?
APrediction MUST be built into asset design! The new design concept
fed by reliability concepts will, in a not far future, seek for (and most often as-sure) “predictability” of ALL failures. If a failure MAY occur, then designing it in such a way that the unavoidable failure is predictable is the only way to avoid undesired downtime in the future. This is precisely the direction in which we must go if real CHANGE is sought. Of course, the effort must always be “economically sound.” The concept of lifelong cost-
ing into the asset management arena is fortunately being introduced by PAS-55 (soon to be ISO-55000 standard). This standard takes this concept explicitly into consideration. However, we must always remember: Whatever we do to ensure reliability must fulfill BOTH condi-tions -- “technically feasible” AND “worth doing!”
Q As industry becomes more auto-mated, will the prevalence of hid-
den failures increase and, if so, what can be done to address this problem?
AAs more and more automation is in-troduced, along with much higher
expectations for safety, the environ-ment, quality, productivity, proper re-source utilization, ROI, and equipment life beyond uptime and cost control, there will be more and more protective devices prone to HIDDEN FAILURES! This should NOT become a “problem” if there is full awareness and understanding of the issues involved, training for action and knowledgeably SOLVING the issues involved.
If a failure MAY occur, then designing it in such a way that the unavoidable failure is predictable is the only way to avoid undesired downtime in the future. This is precisely the direction in which we must go if real CHANGE is sought.
QA

64 oct/nov12
C entered on Excellence is a book that explains in detail how to help transform any busi-ness to yield better business results. The
book concentrates on the entire business process and is applicable to any manufacturing environ-ment. The initial chapters of the book introduce, outline and describe in detail the four Centers of Excellence (CoE). They are: 1. Business Center of Excellence; 2. Operations Center of Excellence; 3. Reliability Center of Excellence; and 4. Materials Center of Excellence.
The Business CoE’s fundamentals are defined in the following areas: Business Principles; Lead-ing Change Strategy; Financial Strategy; Organi-zational Structure; Roles, Responsibilities, Expec-tations; and Performance Management System. The Operations CoE’s fundamentals consist of these areas: Customer Care; Capacity Planning; Operator Care; Resource Planning; Loss Preven-tion; and Process Control. The Reliability CoE’s fundamentals outlined are these areas: Work Standardization & Control; Planning & Schedul-ing; Risk Management; Preventive Maintenance; Predictive Maintenance; Lifecycle Management; Schedule Management; and Work Order System Management. The Materials CoE’s fundamentals explained are these areas: Work Standardiza-tion; Warehousing & Storage; Quality Assurance; Housekeeping & 5S; Procurement Policies; Vendor
Selection & Management; Materials Management Systems; and Scientific Inventory Controls. Darrin explains in a clear, concise manner all the above fundamental topic areas. I believe this book serves as excellent educational documentation of these business processes for an inexperienced person in business, as well as a great review for the experienced business professional.
The reason to implement the Center of Excel-lence transformation process is to provide one’s business with a competitive edge. Darrin defines the competitive edge as “the line formed be-tween those internal business practices that are inferior to those of a competitor.”
Darrin shows us how the Center of Excellence process is deployed in five distinct phases. The first is the Strategic Phase, in which leadership develops the appropriate plans for deployment. The Communication Phase follows to develop communication plans and processes for deploy-
ment. In the Analysis and Design Phase, focused improvement teams (FIT) perform a gap analysis between current state and best practice state, and then design solutions to close these gaps. The fourth is the Pre-implementation Planning Phase, in which detailed plans are developed for deployment. The fifth and final phase is Results Delivery, commonly known as rollout or “go live.”
Managing change is integral to the entire Centered on Excellence improvement process. Darrin outlines how this change is interwoven in all phases of the deployment process. Finally, sustaining the Centered on Excellence process is a crucial step that involves performing audits for compliance in best practice applications and con-sistency.
In summary, Centered on Excellence, authored by Darrin J. Wikoff, is a concise, how-to book on applying leading business excellence practices. In my past role of leading a corporate improvement process for reliability and maintenance, Centered on Excellence would have been an excellent tool for me to use for educating people about the im-provement and change process. It is a great edu-cational read and an important book of reference for all business professionals to have in their library.
Centered On Excellence can be purchased at www.mro-zone.com
Book Review
Timothy Goshert,CMRP, has 33 years of experience working in the food pro-cessing industry. He has extensive expe-rience in plant operations manage-ment, project engineering, construction management, and maintenance and
reliability management. Tim joined the Allied Reliability Group in 2012. www.gpallied.com
Darrin Wikoff, CMRP, has more than 20 years of experience in maintenance and reliability engineering best practices and over 15 years of business leadership experience as both a consultant and small business owner. All programs developed or facilitated by Darrin in-
corporate the leading practices of Lean, Six Sigma and Total Productive Maintenance. www.gpallied.com
Centered on ExcellenceWritten by Darrin J. Wikoff • Reviewed by Timothy Goshert
It is a pleasure to have the opportunity to write a book review for
Uptime magazine on a recently published book by Reliabilityweb.com titled, Centered on Excellence. The author is Mr. Darrin J. Wikoff, a friend and
colleague of mine at Allied Reliability Group. Darrin’s educational and work experiences give him a diverse back-ground to write about the subject of
business excellence. I was eager to read his thoughts on this important topic.

Centered on Excellence


