Embed Size (px)
Citation preview

Reliability Trends of the Global Reliability Trends of the Global Forecast System Model Output Forecast System Model Output
Statistical Guidance in the Statistical Guidance in the Northeastern U.S.Northeastern U.S.
A Statistical Analysis with Operational Forecasting Applications
John M. GoffNational Weather ServiceBurlington, VT

How is Skill Measured in How is Skill Measured in Probabilistic Precipitation Probabilistic Precipitation
Forecasting (PoP)?Forecasting (PoP)?
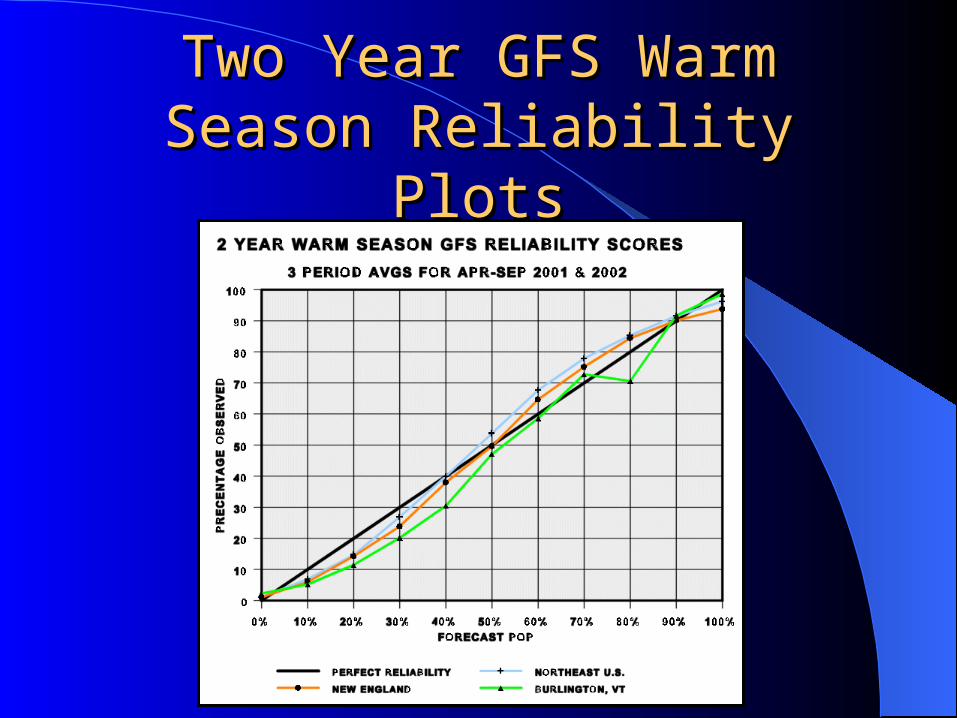
A commonly used method of gauging PoP forecasting skill is through the Brier Score (Brier 1950).
1
BS = 1/n (yk – ok)2
k =1

Measuring PoP Forecast Skill Measuring PoP Forecast Skill ContinuedContinued
The Brier Score is analogous to the Mean Squared Error of the PoP forecast and thus is a measure of accuracy.
Measuring PoP Forecast Skill Measuring PoP Forecast Skill ContinuedContinued
An equally valuable measure of PoP forecast skill is reliability.
Reliability is a measure of bias, and is a gage of how accurate probability values are assigned (AWS 1978).
When statistical forecasts have little to no bias they are said to be reliable.


Impetus for ResearchImpetus for Research
Noticeable positive (wet) bias noted in GFS reliability scores at Burlington, VT across lower PoP categories (i.e. 0 < PoP 40).
Occurrence appeared to occur at other northeast U.S. sites, especially during
the winter months.

Data Set Information Data Set Information
Three separate data subsets were examined
1) Northeastern U.S. (20 sites)
2) New England (6 sites)
3) Burlington, VT (1 site)

Data Set DomainData Set Domain

Data Treatment and Data Treatment and ProcessingProcessing
Data examined on three time scales andgathered from NWS verification website.
- Two year period from October 2000 to September 2002
- Two year combined cool season from October 2000(01) to March 2001(02)
- Two year combined warm season fromApril 2001(02) to September 2001(02)

Data Treatment and Data Treatment and ProcessingProcessing
GFS MOS PoP reliability scores calculated for the first three 12 hour forecast periods.
Three period average scores calculated and plotted for the time periods discussed.
- Low Pop (0 < PoP 40) and high PoP
(60 PoP < 100) trends are analyzed.

GFS Alphanumeric GuidanceGFS Alphanumeric Guidance
12 hour pop guidance

Two Year GFS Reliability Two Year GFS Reliability PlotsPlots

Two Year Data Set ResultsTwo Year Data Set Results
Data SetMean Low PoP
BiasMean High PoP
Bias
Northeast U.S. +5.0 % -5.0%
New England +8.6% -3.8%
Burlington, VT +9.2% -2.1%
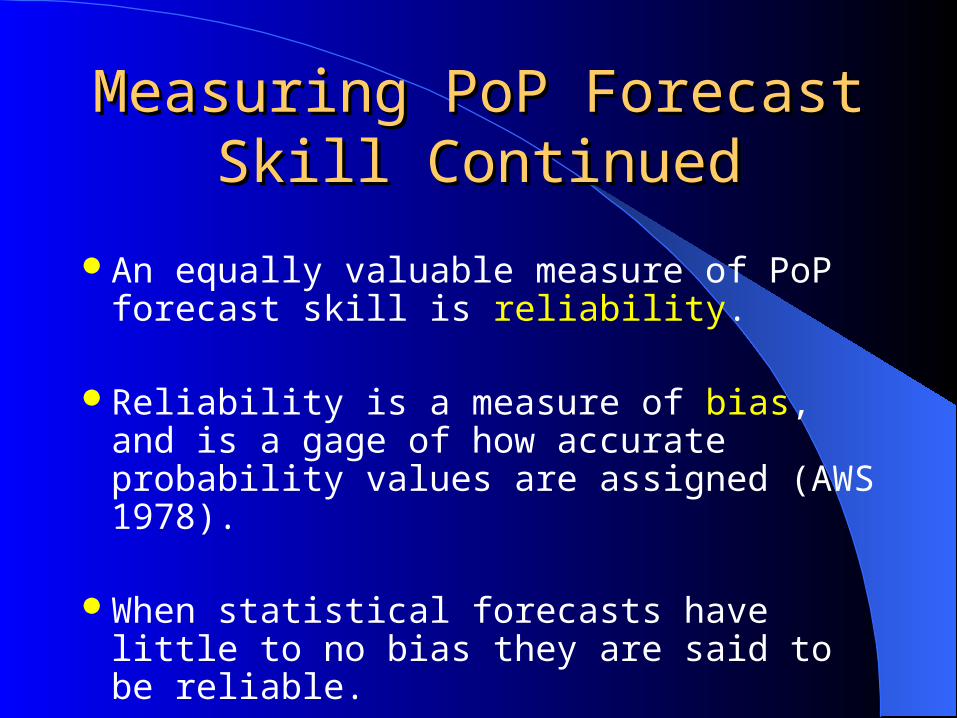
Two Year GFS Warm Season Two Year GFS Warm Season Reliability PlotsReliability Plots

Two Year Warm Season Data Two Year Warm Season Data Set ResultsSet Results
Data SetMean Low PoP
BiasMean High PoP
Bias
Northeast U.S. +2.9% -5.6%
New England +4.5% -3.6%
Burlington, VT +8.2% -3.8%

Two Year GFS Cool Season Two Year GFS Cool Season Reliability PlotsReliability Plots

Two Year Cool Season Data Two Year Cool Season Data Set ResultsSet Results
Data SetMean Low PoP
BiasMean High PoP
Bias
Northeast U.S. +7.6% -4.0%
New England +12.2% -3.4%
Burlington, VT 10.0% -1.9%

Possible Causes of Observed Possible Causes of Observed TrendsTrends
GFS model coarseness/resolution
GFS MOS PoP regional regression equations
Other error sources- ASOS site location
- Accuracy in precipitation measurement of the ASOS heated tipping bucket (esp. in winter).

GFS MOS PoP Warm Season GFS MOS PoP Warm Season Regression EquationsRegression Equations

GFS MOS PoP Cool Season GFS MOS PoP Cool Season Regression EquationsRegression Equations

Applicability of Results to Applicability of Results to Operational PoP ForecastingOperational PoP Forecasting
By slightly lowering GFS MOS PoP forecasts across lower PoP categories, bias may be reduced (esp. across interior northeast/New England during winter).
Discreet adjustment of GFS MOS PoP forecasts across higher PoP categories is not
recommended (limited number of events).

Applicability to PoP Applicability to PoP Forecasting ContinuedForecasting Continued
This seems to contradict traditional Brier Score theory that hedging PoP forecasts towards the middle probabilities offers a higher probability of success over the long run (Hughes 1980).

Potential Brier Score Points Won/Lost over GFS PoP Guidance for New England Sites
(Mean two year data set values for first three 12 hour forecast periods )
GFS guidance PoP 10 20 30 40
Forecast PoP lowered by (%)
5 10 10 10
Mean number of guidance PoP forecasts
per year per site317 270 204 155
Mean observed yearly freq. per site (%)
4.6 9.0 19.1 31.6
Average points won/lost per year
302/135 720/510 825/585 742/637

Potential Brier Score Points Won/Lost over GFS PoP Guidance for New England Sites
(Mean two year cool season data set values for first three 12 hour forecast periods)
GFS guidance PoP 10 20 30 40
GFS PoP lowered by (%)
5 10 10 10
Mean number of guidance PoP forecasts
per season per site143 130 105 80
Mean observed seasonal freq. per site
2.8 7.7 14.3 27.5
Average points won/lost per season
139/36 360/170 450/225 406/286

OverviewOverview
GFS MOS PoP shows consistent positive bias at lower PoP categories across the northeastern U.S.
Lower associated bias was observed across higher PoP categories.

Overview Contd.Overview Contd.
Possible causes of the observed trends include…
- Coarseness in model resolution- Design of the GFS MOS Pop regional
regression equations- ASOS site location and accuracy of
measurement techniques (esp. in winter)

Overview Contd.Overview Contd.
It is suggested that by lowering GFS PoP forecast values by 5 to 10 percent across lower PoP categories, overall bias may be reduced at many interior northeast and New England sites…especially in winter.

ConclusionsConclusions
Despite noted trends the study was of limited temporal and physical constraints.
Further research on these and/or other sites across the U.S. is needed to ascertain whether trends are inherent within the GFS MOS PoP scheme.
AcknowledgementsAcknowledgements
The author would like to thank Paul Sisson (SOO WFO BTV) for guidance and oversight.
Thanks is also given to Mark Antolik of MDL for guidance and expertise in the GFS MOS PoP scheme.


![Statistical Forecasting [Part 1]](https://img.pdfslide.us/doc/110x75/56812dd3550346895d9319d7/statistical-forecasting-part-1.jpg)