Embed Size (px)
Citation preview
Reliability of Objective Voice Measures of Normal
Speaking Voices
*Karen Leong, †Mary J. Hawkshaw, †Dimiter Dentchev, ‡ReenaGupta, §Deborah Lurie, and †,kRobert T. Sataloff,*Providence, Rhode Island, yxkPhiladelphia, Pennsylvania, and zLos Angeles, California
Summary: Objective. To determine the reliability of objective voice measures used commonly in clinical practice.
AccepFrom
yDepartmof MedicCaliforniPennsylvMedicineAddre
OtolarynPine StreJourna0892-1� 201http://d
Subjects. Eighteen healthy volunteers (nine males and nine females).Methods. Objective voice measures were performed on 18 healthy volunteers on 10 occasions under similar condi-tions over a 30-day period. Consistency of measures was analyzed to determine reliability.Results. Using currently accepted normative values, intraclass correlation coefficients were moderate (>0.6) for con-sistency over the 10 testing sessions for most acoustic measures that do not depend on intensity, measures of laryngealefficiency, and perturbation measures of fundamental frequency (F0) for both genders. For females, cepstral peak prom-inence (CPP) had moderate reliability, whereas for males, the smoothed CPP was reliable. Other than F0, none of theperturbation measures are reliable for females. However, jitter, relative average perturbation, and standard deviation ofF0 are reliable for males. Noise-to-harmonic ratios (NHRs) had the lowest consistency of all measures over the course ofthe 10 sessions.Conclusions. Clinicians should be cautious in their use of acoustic voice measures that depend on the intensity and intheir use of most perturbation measures. NHR was found to be the least reliable measure. Additionally, the reliability ofCPP measure varies by gender. Understanding the degree of within-person variability on some objective voice measuresand whether that variation is due to biological differences or measurement error will lead clinicians to consider the needfor a more standardized testing protocol. Additional research is needed to investigate what factors within the testingprotocol and/or changes to the measurement instruments may lead to more consistent test results.Key Words: Objective voice measures–Reliability of voice measures–Measures of normal speaking voices.
INTRODUCTION
Modern medicine requires evidence to substantiate diagnosesand outcomes of therapies. The health care field relies on instru-mentation that produces quantitative data quickly and can helpdocument the presence, absence, or severity of a condition. Cli-nicians must be able to trust the measures they use. Prior studiesand clinical experience suggest that the validity and reliabilityof objective voice measures have not been established rigor-ously, and they may not be as good as they are assumed to beby many clinicians who use them routinely. Protocols, testequipment, and testing environment have not been standard-ized; and it appears that standard measures may vary not onlyfrom laboratory to laboratory but also from test to test ina healthy subject in the same laboratory.1
Professionals interested in measuring voice have a variety ofmethods from which to choose. These record measures, such asfundamental frequency (F0), jitter, and shimmer, and so forth,have similar names but may be calculated using different strat-egies by various manufacturers. Prior authors have investigatedsome of these concerns. For example, a study looking at the
ted for publication July 10, 2012.the *Department of Surgery, Brown University, Providence, Rhode Island;ent of Otolaryngology – Head and Neck Surgery, Drexel University Collegeine, Philadelphia, Pennsylvania; zOsborne Head and Neck Institute, Los Angeles,a; xDepartment of Mathematics, St. Joseph’s University, Philadelphia,ania; and the kClinical Academic Specialties, Drexel University College of, Philadelphia, Pennsylvania.ss correspondence and reprint requests to Robert T. Sataloff, Department ofgology – Head and Neck Surgery, Drexel University College of Medicine, 1721et, Philadelphia, PA 19103. E-mail: [email protected] of Voice, Vol. 27, No. 2, pp. 170-176997/$36.003 The Voice Foundationx.doi.org/10.1016/j.jvoice.2012.07.005
reliability of the Kay Elemetrics Visi-Pitch (Kay ElemetricsCorp., Lincoln Park, NJ) for acoustic measures concludedthat measurements of F0 and jitter may vary depending onthe type of speech sample analyzed.2 Lee et al3 stressed the im-portance of controlling the conditions under which acousticmeasures are obtained; this study stressed particularly the im-portance of the subject maintaining a constant intensity andfrequency level across repeated tests to ensure similarities inmeasurement conditions. Other studies have looked into thevariability of fluctuation in the voice throughout the day4 anddifferences between genders.5 The only consistent measure be-tween studies appears to be the measure of F0. Because of itsreproducibility, Behrman6 found it to be statistically signifi-cantly more popular than intensity or spectral measures in thereported literature, but it is not a particularly revealing measureof subtle or complex aspects of voice function.It has been also found that the measurements of perturbation
analyzed from two commonly used instruments yielded differ-ent results, and the discrepancies differed between genders,with jitter and perturbation measurement being closer betweeninstrumentswith female subjects thanmale subjects.6 This studyalso showed that measures vary between trials in the same sub-ject. For example, on one type of machine, the Visi-Pitch, mea-surements were only reliable when repetitive measurements ofjitter were done over time. On the other instrument to whichthese values were compared, the Fourcin Laryngograph/Kay(KayPENTAX, Lincoln Park, NJ) Sonograph, jitter measure-ments were not as consistent, and the study concluded that thefirst five to seven measurements of a test session should be dis-carded because they show significantlymore variability than thesubsequent measurements. The Fourcin Laryngograph/Kay
Karen Leong, et al Reliability of Objective Voice Measures 171
Sonograph was not found to be a reliable instrument for shim-mer analysis or that the shimmer is too variable even in normalsubjects to be used as a valid measurement in the evaluation ofa patient’s vocal progress.7 Within the group of respondentswho used acoustic measurements, a little less than half usedshimmer on a regular basis. Few more than 50% of the totalused jitter.8 These findings suggest that the value of these mea-surements is uncertain. There is a need to understand more fullythe reliability of all measures used clinically because it appearsthat differencesmay occur not only among different laboratoriesusing different equipment but also within a laboratory for rea-sons thatmay not be explained by differences in the voices beingmeasured.
Technological advances in computers have allowed for thedetection of minute variations in an acoustic waveform. De-jonckere9 found that it is important to verify the period ofa sound signal correctly, due to the influence of artifacts suchas strong subharmonics, even in healthy speakers. A generallimitation is that the systems used for acoustic analysis cannotanalyze validly or reliably highly aperiodic acoustic signals.Perturbation measures become unreliable if the voice signalcontains intermittency, strong subharmonics, or modulations.Because perturbations less than about 5% have been found tobe reliable, a visual control of the period definition of the micro-phone signal or of the sonogram is always necessary; even inregular voices, a strong harmonic or subharmonic may accountfor erratic values.
An ideal acoustic measure should be able to quantify thevoice signal without relying on frequency or other variablesthat might affect the accuracy of the measure; it should be reli-able and reproducible. Cepstral peak prominence (CPP), devel-oped in 1994 by Hillenbrand et al,8 has been suggested aspossibly being one such measure. Calculated from the Fouriertransformation of the voice spectrum, the cepstrum is amplitudegraphed as a function of quefrency, which is the frequency ofeach of the component waves making up the signal. The pre-dominant peak in the cepstrum is the fundamental period ofthe spectrum, and the cepstral peak is the peak with the highestamplitude. When a linear regression is drawn to normalize forvariability in amplitude, the distance from the cepstral peakto this linear regression is called CPP. Preliminary studies inour laboratory have suggested that this methodology providesa more reliable voice measure than the traditional parameters.10
Clinicians cannot rely on the numerous manufacturers ofvoice measurement equipment to provide measures that arevalid and reliable. If we are to use such measures for clinicaland research purposes, we are obligated to assure that the mea-sures are accurate and that they are reasonably consistent fromtrial to trial in the same subject under the same circumstances.This study was designed to evaluate the reliability of voice mea-sures obtained in a clinical setting, using popular and readilyavailable instrumentation, that is to measure the within-person variation and determine whether it was less than thebetween-subject variation. We hypothesized that many of themeasures used generated commonly in clinical settings arenot reliable, varying so much from session to session even innormal subjects that they cannot be used for clinical purposes.
MATERIALS AND METHODS
Subjects
Eighteen participants with normal speaking voices were in-volved in this study: nine women and nine men aged 22–47years (mean age of men¼ 28 and mean age of women¼ 31years). All subjects were systemically healthy and free of vocalcomplaints and underwent head and neck examination includ-ing strobovideolaryngoscopy before inclusion in the study.Exclusion criteria included respiratory or voice disorders andprevious professional voice training. Two female subjectswere known smokers (less than three cigarettes per day). Ifa subject developed an upper respiratory tract infection, mea-surements would have been delayed until symptoms had fullyresolved, but this problem did not occur during the study.
Objective voice measures
Data collection occurred in a quiet room at the office of the se-nior author (R.T.S.). Room temperature was kept constant tominimize changes in humidity thatmight causemucosal drynessor ambient temperature changes that might alter subject’s com-fort or even cause shivering thatmight affect voice performance.Each subject underwent 10 test sessions over a period of about 1month. Each subject was asked initially to plan to undergo 12test sessions (three per week) over 4 weeks (12 sessions) to becertain of collecting 10 data sets for each subject.We anticipatedthat some sessions might be missed for illness (did not occur) orpersonal reasons such as examinations for subjects who werestudents (which did occur). To standardize conditions betweendays, sessions were scheduled at approximately the same timeof day (±2 hours) for each individual over a period of 1 month.
Acoustic measures from the Marvin Williams
passage and conversation
A Beyer Dynamic M88N(C) omnidirectional microphone (Be-yer Dynamic Inc., Farmingdale, NY) was placed 15 cm fromeach subject’s lips, and the subject was asked to say his or herfake name (assigned by the researchers to assist deidentificationand given to all subjects of the same gender), age, and date aswell as to read a sample fromMarvinWilliams passage. Acous-tic and electroglottographic signals were used. Data were re-corded and saved to a Dell Optiplex GX240 Pentium 4 1.8GHz computer (Dell Inc., Round Rock, TX) with a CreativeSound Blaster X-Fi soundcard (Creative Technology Ltd., Ju-rong East, Singapore). The variables measured from the MarvinWilliams passage recordings included frequency, intensity, andreading time. Data were analyzed using KayPENTAX equip-ment including the Real-Time Pitch, Model 5121 (KayPEN-TAX, Lincoln Park, NJ); Real-Time Sonogram, Model 5129(KayPENTAX); Multi-Dimensional Voice Program (MDVP),Model 5105 (KayPENTAX, Lincoln Park, NJ); Fourcin Lar-yngograph; and a sound level meter.
CPP measures
Using the first sentence of the Marvin Williams Passage, F0,CPP, and the smoothed cepstral peak prominence (CPPS)were computed using the Computerized Speech Lab Core Pro-gram (KayPENTAX, Lincoln Park, NJ).
Journal of Voice, Vol. 27, No. 2, 2013172
Perturbation measures
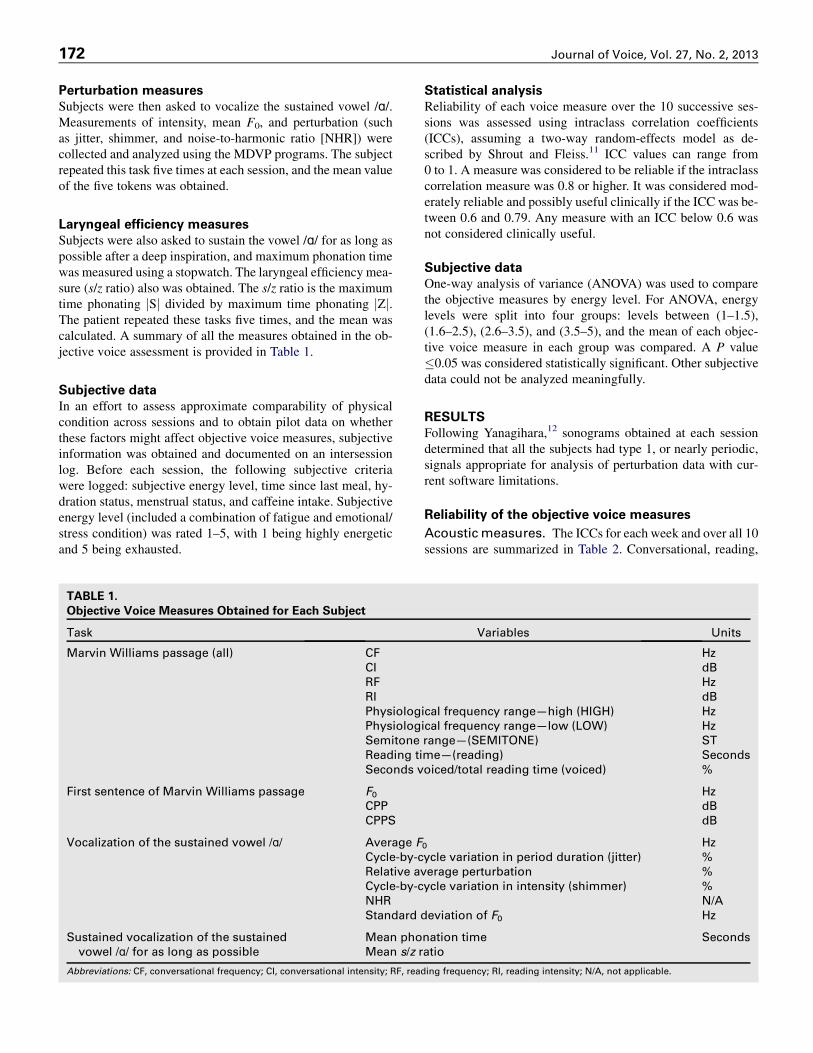
Subjects were then asked to vocalize the sustained vowel /ɑ/.Measurements of intensity, mean F0, and perturbation (suchas jitter, shimmer, and noise-to-harmonic ratio [NHR]) werecollected and analyzed using the MDVP programs. The subjectrepeated this task five times at each session, and the mean valueof the five tokens was obtained.
Laryngeal efficiency measures
Subjects were also asked to sustain the vowel /ɑ/ for as long aspossible after a deep inspiration, and maximum phonation timewas measured using a stopwatch. The laryngeal efficiency mea-sure (s/z ratio) also was obtained. The s/z ratio is the maximumtime phonating jSj divided by maximum time phonating jZj.The patient repeated these tasks five times, and the mean wascalculated. A summary of all the measures obtained in the ob-jective voice assessment is provided in Table 1.
Subjective data
In an effort to assess approximate comparability of physicalcondition across sessions and to obtain pilot data on whetherthese factors might affect objective voice measures, subjectiveinformation was obtained and documented on an intersessionlog. Before each session, the following subjective criteriawere logged: subjective energy level, time since last meal, hy-dration status, menstrual status, and caffeine intake. Subjectiveenergy level (included a combination of fatigue and emotional/stress condition) was rated 1–5, with 1 being highly energeticand 5 being exhausted.
TABLE 1.
Objective Voice Measures Obtained for Each Subject
Task
Marvin Williams passage (all) CF
CI
RF
RI
Physiolog
Physiolog
Semitone
Reading ti
Seconds v
First sentence of Marvin Williams passage F0CPP
CPPS
Vocalization of the sustained vowel /ɑ/ Average FCycle-by-c
Relative av
Cycle-by-c
NHR
Standard
Sustained vocalization of the sustained
vowel /ɑ/ for as long as possible
Mean pho
Mean s/z r
Abbreviations: CF, conversational frequency; CI, conversational intensity; RF, rea
Statistical analysis
Reliability of each voice measure over the 10 successive ses-sions was assessed using intraclass correlation coefficients(ICCs), assuming a two-way random-effects model as de-scribed by Shrout and Fleiss.11 ICC values can range from0 to 1. A measure was considered to be reliable if the intraclasscorrelation measure was 0.8 or higher. It was considered mod-erately reliable and possibly useful clinically if the ICC was be-tween 0.6 and 0.79. Any measure with an ICC below 0.6 wasnot considered clinically useful.
Subjective data
One-way analysis of variance (ANOVA) was used to comparethe objective measures by energy level. For ANOVA, energylevels were split into four groups: levels between (1–1.5),(1.6–2.5), (2.6–3.5), and (3.5–5), and the mean of each objec-tive voice measure in each group was compared. A P value�0.05 was considered statistically significant. Other subjectivedata could not be analyzed meaningfully.
RESULTS
Following Yanagihara,12 sonograms obtained at each sessiondetermined that all the subjects had type 1, or nearly periodic,signals appropriate for analysis of perturbation data with cur-rent software limitations.
Reliability of the objective voice measures
Acousticmeasures. The ICCs for each week and over all 10sessions are summarized in Table 2. Conversational, reading,
Variables Units
Hz
dB
Hz
dB
ical frequency range—high (HIGH) Hz
ical frequency range—low (LOW) Hz
range—(SEMITONE) ST
me—(reading) Seconds
oiced/total reading time (voiced) %
Hz
dB
dB
0 Hz
ycle variation in period duration (jitter) %
erage perturbation %
ycle variation in intensity (shimmer) %
N/A
deviation of F0 Hz
nation time Seconds
atio
ding frequency; RI, reading intensity; N/A, not applicable.
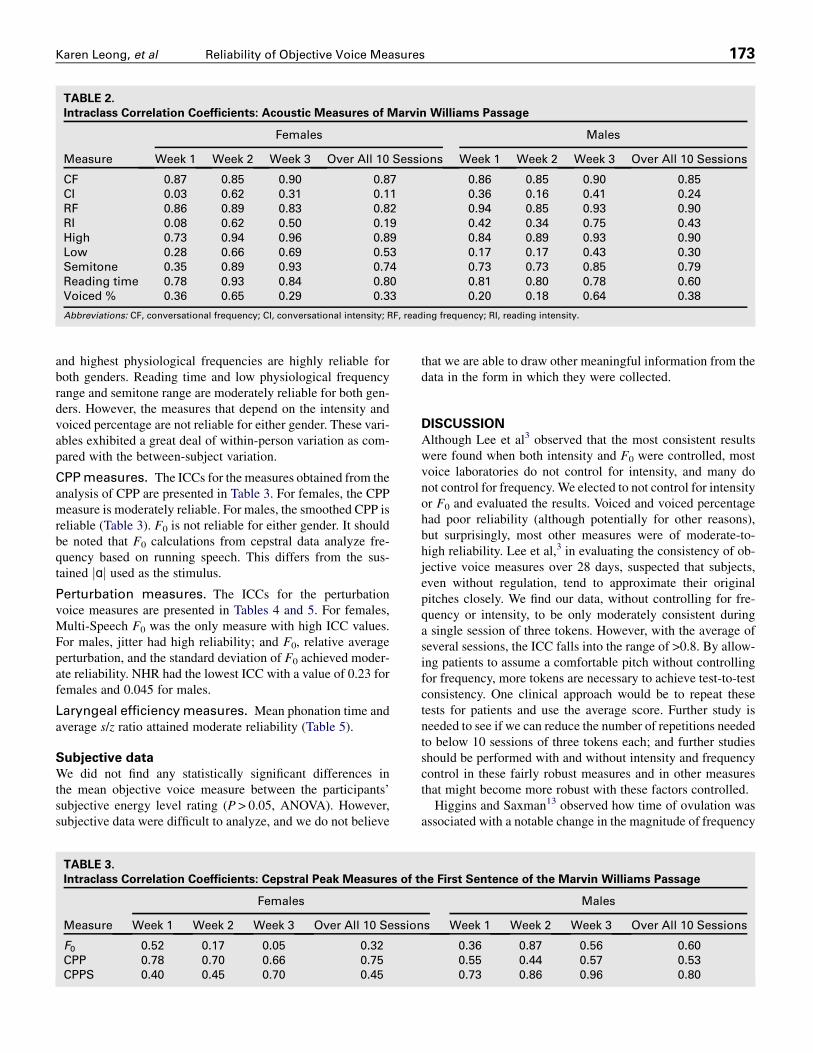
TABLE 2.
Intraclass Correlation Coefficients: Acoustic Measures of Marvin Williams Passage
Measure
Females Males
Week 1 Week 2 Week 3 Over All 10 Sessions Week 1 Week 2 Week 3 Over All 10 Sessions
CF 0.87 0.85 0.90 0.87 0.86 0.85 0.90 0.85
CI 0.03 0.62 0.31 0.11 0.36 0.16 0.41 0.24
RF 0.86 0.89 0.83 0.82 0.94 0.85 0.93 0.90
RI 0.08 0.62 0.50 0.19 0.42 0.34 0.75 0.43
High 0.73 0.94 0.96 0.89 0.84 0.89 0.93 0.90
Low 0.28 0.66 0.69 0.53 0.17 0.17 0.43 0.30
Semitone 0.35 0.89 0.93 0.74 0.73 0.73 0.85 0.79
Reading time 0.78 0.93 0.84 0.80 0.81 0.80 0.78 0.60
Voiced % 0.36 0.65 0.29 0.33 0.20 0.18 0.64 0.38
Abbreviations: CF, conversational frequency; CI, conversational intensity; RF, reading frequency; RI, reading intensity.
Karen Leong, et al Reliability of Objective Voice Measures 173
and highest physiological frequencies are highly reliable forboth genders. Reading time and low physiological frequencyrange and semitone range are moderately reliable for both gen-ders. However, the measures that depend on the intensity andvoiced percentage are not reliable for either gender. These vari-ables exhibited a great deal of within-person variation as com-pared with the between-subject variation.
CPPmeasures. The ICCs for the measures obtained from theanalysis of CPP are presented in Table 3. For females, the CPPmeasure is moderately reliable. For males, the smoothed CPP isreliable (Table 3). F0 is not reliable for either gender. It shouldbe noted that F0 calculations from cepstral data analyze fre-quency based on running speech. This differs from the sus-tained jɑj used as the stimulus.
Perturbation measures. The ICCs for the perturbationvoice measures are presented in Tables 4 and 5. For females,Multi-Speech F0 was the only measure with high ICC values.For males, jitter had high reliability; and F0, relative averageperturbation, and the standard deviation of F0 achieved moder-ate reliability. NHR had the lowest ICC with a value of 0.23 forfemales and 0.045 for males.
Laryngeal efficiencymeasures. Mean phonation time andaverage s/z ratio attained moderate reliability (Table 5).
Subjective data
We did not find any statistically significant differences inthe mean objective voice measure between the participants’subjective energy level rating (P > 0.05, ANOVA). However,subjective data were difficult to analyze, and we do not believe
TABLE 3.
Intraclass Correlation Coefficients: Cepstral Peak Measures of t
Measure
Females
Week 1 Week 2 Week 3 Over All 10 Session
F0 0.52 0.17 0.05 0.32
CPP 0.78 0.70 0.66 0.75
CPPS 0.40 0.45 0.70 0.45
that we are able to draw other meaningful information from thedata in the form in which they were collected.
DISCUSSION
Although Lee et al3 observed that the most consistent resultswere found when both intensity and F0 were controlled, mostvoice laboratories do not control for intensity, and many donot control for frequency. We elected to not control for intensityor F0 and evaluated the results. Voiced and voiced percentagehad poor reliability (although potentially for other reasons),but surprisingly, most other measures were of moderate-to-high reliability. Lee et al,3 in evaluating the consistency of ob-jective voice measures over 28 days, suspected that subjects,even without regulation, tend to approximate their originalpitches closely. We find our data, without controlling for fre-quency or intensity, to be only moderately consistent duringa single session of three tokens. However, with the average ofseveral sessions, the ICC falls into the range of >0.8. By allow-ing patients to assume a comfortable pitch without controllingfor frequency, more tokens are necessary to achieve test-to-testconsistency. One clinical approach would be to repeat thesetests for patients and use the average score. Further study isneeded to see if we can reduce the number of repetitions neededto below 10 sessions of three tokens each; and further studiesshould be performed with and without intensity and frequencycontrol in these fairly robust measures and in other measuresthat might become more robust with these factors controlled.
Higgins and Saxman13 observed how time of ovulation wasassociated with a notable change in the magnitude of frequency
he First Sentence of the Marvin Williams Passage
Males
s Week 1 Week 2 Week 3 Over All 10 Sessions
0.36 0.87 0.56 0.60
0.55 0.44 0.57 0.53
0.73 0.86 0.96 0.80
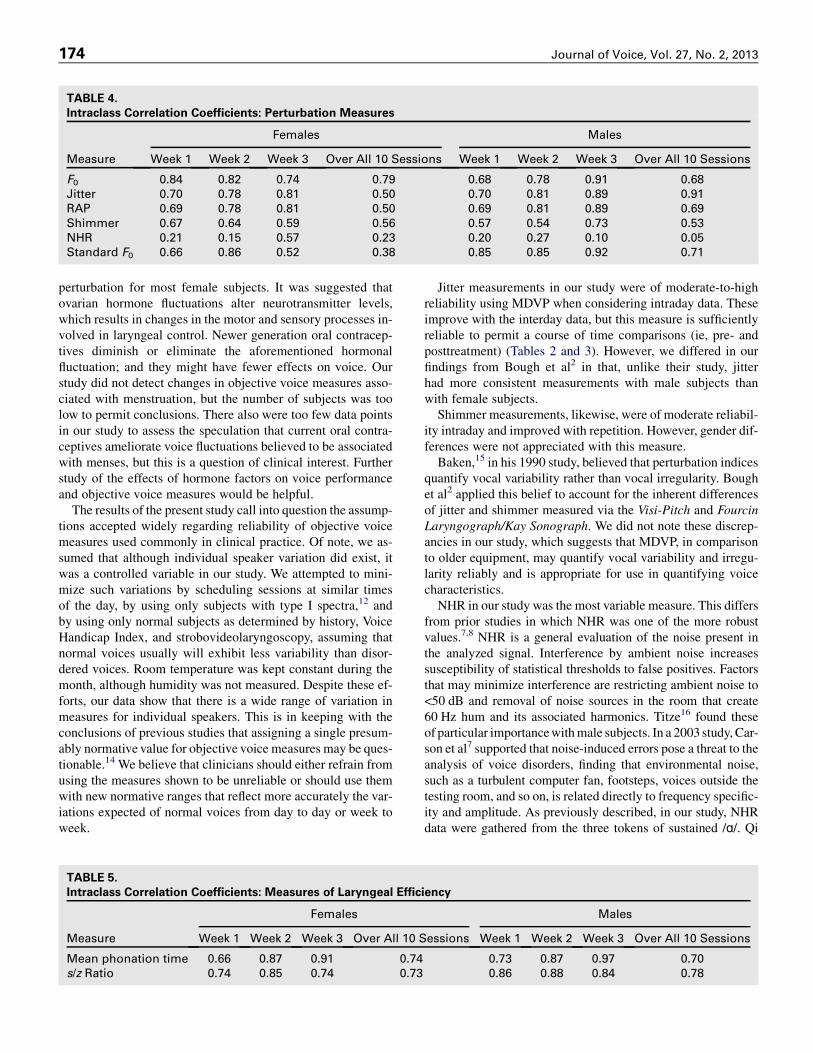
TABLE 4.
Intraclass Correlation Coefficients: Perturbation Measures
Measure
Females Males
Week 1 Week 2 Week 3 Over All 10 Sessions Week 1 Week 2 Week 3 Over All 10 Sessions
F0 0.84 0.82 0.74 0.79 0.68 0.78 0.91 0.68
Jitter 0.70 0.78 0.81 0.50 0.70 0.81 0.89 0.91
RAP 0.69 0.78 0.81 0.50 0.69 0.81 0.89 0.69
Shimmer 0.67 0.64 0.59 0.56 0.57 0.54 0.73 0.53
NHR 0.21 0.15 0.57 0.23 0.20 0.27 0.10 0.05
Standard F0 0.66 0.86 0.52 0.38 0.85 0.85 0.92 0.71
Journal of Voice, Vol. 27, No. 2, 2013174
perturbation for most female subjects. It was suggested thatovarian hormone fluctuations alter neurotransmitter levels,which results in changes in the motor and sensory processes in-volved in laryngeal control. Newer generation oral contracep-tives diminish or eliminate the aforementioned hormonalfluctuation; and they might have fewer effects on voice. Ourstudy did not detect changes in objective voice measures asso-ciated with menstruation, but the number of subjects was toolow to permit conclusions. There also were too few data pointsin our study to assess the speculation that current oral contra-ceptives ameliorate voice fluctuations believed to be associatedwith menses, but this is a question of clinical interest. Furtherstudy of the effects of hormone factors on voice performanceand objective voice measures would be helpful.
The results of the present study call into question the assump-tions accepted widely regarding reliability of objective voicemeasures used commonly in clinical practice. Of note, we as-sumed that although individual speaker variation did exist, itwas a controlled variable in our study. We attempted to mini-mize such variations by scheduling sessions at similar timesof the day, by using only subjects with type I spectra,12 andby using only normal subjects as determined by history, VoiceHandicap Index, and strobovideolaryngoscopy, assuming thatnormal voices usually will exhibit less variability than disor-dered voices. Room temperature was kept constant during themonth, although humidity was not measured. Despite these ef-forts, our data show that there is a wide range of variation inmeasures for individual speakers. This is in keeping with theconclusions of previous studies that assigning a single presum-ably normative value for objective voice measures may be ques-tionable.14 We believe that clinicians should either refrain fromusing the measures shown to be unreliable or should use themwith new normative ranges that reflect more accurately the var-iations expected of normal voices from day to day or week toweek.
TABLE 5.
Intraclass Correlation Coefficients: Measures of Laryngeal Effic
Measure
Females
Week 1 Week 2 Week 3 Over All 10 S
Mean phonation time 0.66 0.87 0.91 0.74
s/z Ratio 0.74 0.85 0.74 0.73
Jitter measurements in our study were of moderate-to-highreliability using MDVP when considering intraday data. Theseimprove with the interday data, but this measure is sufficientlyreliable to permit a course of time comparisons (ie, pre- andposttreatment) (Tables 2 and 3). However, we differed in ourfindings from Bough et al2 in that, unlike their study, jitterhad more consistent measurements with male subjects thanwith female subjects.Shimmer measurements, likewise, were of moderate reliabil-
ity intraday and improved with repetition. However, gender dif-ferences were not appreciated with this measure.Baken,15 in his 1990 study, believed that perturbation indices
quantify vocal variability rather than vocal irregularity. Boughet al2 applied this belief to account for the inherent differencesof jitter and shimmer measured via the Visi-Pitch and FourcinLaryngograph/Kay Sonograph. We did not note these discrep-ancies in our study, which suggests that MDVP, in comparisonto older equipment, may quantify vocal variability and irregu-larity reliably and is appropriate for use in quantifying voicecharacteristics.NHR in our study was the most variable measure. This differs
from prior studies in which NHR was one of the more robustvalues.7,8 NHR is a general evaluation of the noise present inthe analyzed signal. Interference by ambient noise increasessusceptibility of statistical thresholds to false positives. Factorsthat may minimize interference are restricting ambient noise to<50 dB and removal of noise sources in the room that create60 Hz hum and its associated harmonics. Titze16 found theseof particular importancewithmale subjects. In a 2003 study, Car-son et al7 supported that noise-induced errors pose a threat to theanalysis of voice disorders, finding that environmental noise,such as a turbulent computer fan, footsteps, voices outside thetesting room, and so on, is related directly to frequency specific-ity and amplitude. As previously described, in our study, NHRdata were gathered from the three tokens of sustained /ɑ/. Qi
iency
Males
essions Week 1 Week 2 Week 3 Over All 10 Sessions
0.73 0.87 0.97 0.70
0.86 0.88 0.84 0.78
Karen Leong, et al Reliability of Objective Voice Measures 175
et al17 questioned whether it was more valid to obtain estimatesof signal-to-noise ratio (SNR) from running speech than fromsustained vowels, especially in considering pathologic voices.While their study focused more on the estimation of SNR fromcontinuous utterances, it raises the question of whether ourmethods of assessing perturbation data should be reevaluated.
Because the software used to assess objective voice measuresis applied routinely to analyze pathologic voices, periodicity isthe exception, not the norm. In using normal speaking voices,we find the MDVP data to be, at best, only moderately reliablein evaluating frequency, jitter, and shimmer and unreliable inNHR, these representing the more commonly used measuresin voice laboratories (Table 2). Taking the most widely acceptedmeasure, F0, we applied the data points collected to calculatethe ICC for the CPP to evaluate the reliability of F0 regardlessof periodicity. We found CPP and CPPS to fall within the 0.5–0.8 range with a single session and >0.8 using the average of 10sessions, using normal voices with high periodicity (Table 4).This suggests that F0 in speaking voices, normal or pathologic,is only a moderately reliable measure for one session of threerepetitions of /ɑ/.
Clinical judgments about the previously mentioned resultswere based on the previously established normative values,and on the assumption that the degree of variability in normalvoices recording under consistent conditions should not resultin significant changes in voice measures from session to sessionand certainly not in changes between normal and abnormal invoices that are clinically unchanged. Based on those assump-tions, our data suggest that several commonly used measuresare not reliable. As an alternative to discarding those measuresfrom our voice assessment protocols, it seems reasonable toconsider redefining the normative values as ranges for thosemeasures. We plan additional research to suggested range ofvalues that, if used in place of the published normal values,would have rendered these measures reliable and to determinewhether using new normative values would be useful clinically.
Many conditions are believed to affect voice performance.Some have been studied, but many are difficult to measure. Forexample, singers and speakers commonly report altered voicequality and efficiency if they are fatigued, dehydrated, or pre-menstrual.18–26 Others report altered voice function if theyhave recently eaten a large meal, and this may be a particularlyprominent factor in patients with severe laryngopharyngealreflux. High caffeine intake is also reported by some people toaffect their voices, particularly if it aggravates reflux, leads todehydration, or produces tremor.27,28 Our data did not proveuseful in elucidating these factors possibly because of a designflaw in the way we coded the data. Further research isencouraged.
CONCLUSION
Our study undertook the task of assessing normal speakingvoice objective measures using KayPENTAX Multi-Speechsoftware in an effort to determine reliability of measures usedcommonly in voice laboratories. We strove for conditions thatwould be reproducible in any office setting with only basic
equipment and widely used software.We found, with the excep-tion of NHR, that most measures had moderate ICCs withina single session, which improved with repetition. Althoughwe did not control for frequency or intensity, our data remainedrobust. Contrary to previous studies, F0 was not the most stablemeasure, and calculation of CPP to eliminate the periodicityfactor did not improve our results.10 Clinicians should be cau-tious in their use of all voice measures including F0, especiallyif currently accepted normative values are used. NHR assessedwith MDVP was our least reliable measure, which was surpris-ing given the results of previous studies. Ambient noise and dis-tracting subharmonics may contribute to such findings, but wehave not been able to identify such problems in the laboratory.We emphasize that the variability that we have documented inthis study occurred in normal volunteers with no obvious differ-ences in voice from session to session. This population shouldyield the highest consistency and objective voice measure reli-ability, except possibly for a population of trained voice profes-sionals. We would certainly expect more variability in patientswith dysphonia, both because of intrinsic variability in the voi-ces themselves and technical difficulties in many of the voicemeasures due to inaccuracies in period estimation, greaternoise, aperiodicity, and other factors. We conclude that furtherstudies should be conducted to determine the optimal number ofsessions required to obtain reliable results and redefine norma-tive value ranges as needed before depending on the objectivevoice measures to characterize normal or pathologic voices orassess outcomes after treatment.
REFERENCES1. Fitch J. Consistency of fundamental frequency and perturbation in repeated
phonation of sustained vowel, reading, and connected speech. J Speech
Hear Disord. 1990;55:360–363.
2. Bough ID, Reinhardt J, Heuer J, Sataloff RT, Hills JR, Carter JR. Intrasub-
ject variability of objective voice measures. J Voice. 1996;10:166–174.
3. Lee L, Stemple JC, Kizer M. Consistency of acoustic and aerodynamic
measures of voice production over 28 days under various testing conditions.
J Voice. 1999;13:477–483.
4. Garrett K, Healey EC. An acoustic analysis of fluctuations in the voices of
normal adult speakers across three times of day. J Acoust Soc Am. 1987;82:
58–62.
5. Nittrouer S, McGowan R, Milenkovic P, Beehler D. Acoustic measure-
ments of men’s and woman’s voices: a study of context effects and covari-
ation. J Speech Hear Res. 1990;33:761–775.
6. Behrman A. Common practices of voice therapists in the evaluation of pa-
tients. J Voice. 2005;19:454–469.
7. Carson CP, Ingrisano DR, Eggleston KD. The effect of noise on computer-
aided measures of voice: a comparison of CSpeechSP and the Multi-
Dimensional Voice Program software using the CSL 4300B Module and
Multi-Speech for Windows. J Voice. 2003;17:12–20.
8. Hillenbrand J, Cleveland RA, Erickson RL. Acoustic correlates of breathy
vocal quality. J Speech Hear Res. 1994;37:769–778.
9. Dejonckere PH, Fresnel-Elbaz RM, Woisard E, Crevier V, Buchman L,
Millet B. Differential perceptual evaluation of pathological voice quality:
reliability and correlations with acoustic measurements. Rev Laryngol
Otol Rhinol. 1999;117:219–224.
10. Heman-Ackah YD, Heuer RJ, Michael DD, et al. Cepstral peak promi-
nence: a more reliable measure of dysphonia. Ann Otol Rhinol Laryngol.
2003;112:324–333.
11. Shrout PE, Fleiss JL. Intraclass correlations: uses in assessing rater reliabil-
ity. Pyschol Bull. 1979;86:420–428.
Journal of Voice, Vol. 27, No. 2, 2013176
12. Yanagihara N. Significance of harmonic changes and noise components in
hoarseness. J Speech Hear Res. 1967;10:531–541.
13. Higgins MB, Saxman JH. Variations in vocal frequency perturbation across
the menstrual cycle. J Voice. 1989;3:233–243.
14. Gould WJ, Korovin GS. G. Paul Moore Lecture. Laboratory advances for
voice measurements. J Voice. 1994;8:8–17.
15. Baken RJ. Irregularity of vocal period and amplitude: a first approach to the
fractal analysis of voice. J Voice. 1990;4:185–197.
16. Titze IR.Workshop on Acoustic Voice Analysis: Summary Statement. Den-
ver, CO: National Center for Voice and Speech; 1995. 1-36.
17. Qi Y, Hillman RE, Milstein C. The estimation of signal to noise ratio in con-
tinuous speech for disordered voices. JAcoust Soc Am. 1999;105:2532–2535.
18. Bagnall AD, Dorrian J, Fletcher A. Some vocal consequences of sleep dep-
rivation and the possibility of ‘‘fatigue proofing’’ the voice with Voicecraft
voice training. J Voice. 2011;25:447–461.
19. Vogel AP, Fletcher J, Maruff P. Acoustic analysis of the effects of sustained
wakefulness on speech. J Acoust Soc Am. 2010;128:3747–3756.
20. Boucher VJ, Ayad T. Physiological attributes of vocal fatigue and their
acoustic effects: a synthesis of findings for a criterion-based prevention
of acquired voice disorders. J Voice. 2010;24:324–336.
21. Fischer J, Semple S, Fickenscher G, Jurgens R, Kruse E, Heistermann M,
Amir O. Do women’s voices provide cues of the likelihood of ovulation?
The importance of sampling regimes. PLoS One. 2011;6:e24490.
22. Ryan M, Kenny DT. Perceived effects of the menstrual cycle on young fe-
male singers in the Western classical tradition. J Voice. 2009;23:99–108.
23. Van LierdeKM, Claeys S, De BodtM, Van Cauwenberge P. Response of the
female vocal quality and resonance in professional voice users taking oral
contraceptive pills: a multiparameter approach. Laryngoscope. 2006;116:
1894–1898.
24. Chernobelsky S. A study of menses-related changes to the larynx in singers
with voice abuse. Folia Phoniatr Logop. 2002;54:2–7.
25. Chae SW, Choi G, Kang HJ, Choi JO, Jin SM. Clinical analysis of voice
change as a parameter of premenstrual syndrome. J Voice. 2001;15:
278–283.
26. Abitbol J, Abitbol P, Abitbol B. Sex hormones and the female voice. J
Voice. 1999;13:424–446.
27. Erickson-Levendoski E, Sivasankar M. Investigating the effects of caffeine
on phonation. J Voice. 2011;25:e215–e219.
28. Akhtar S, Wood G, Rubin JS, O’Flynn PE, Ratcliffe P. Effect of caffeine on
the vocal folds: a pilot study. J Laryngol Otol. 1999;113:341–345.