Embed Size (px)
Citation preview
Computers and Structures 82 (2004) 1021–1031
www.elsevier.com/locate/compstruc
Reliability of material and geometrically non-linearreinforced and prestressed concrete structures
Fabio Biondini a,*, Franco Bontempi b, Dan M. Frangopol c,Pier Giorgio Malerba a
a Department of Structural Engineering, Technical University of Milan, Piazza L. da Vinci, 32, Milan 20133, Italyb Department of Structural and Geotechnical Engineering, University of Rome, ‘‘La Sapienza’’, Via Eudossiana, 18-00184 Rome, Italy
c Department of Civil, Environmental, and Architectural Engineering, University of Colorado, Boulder, CO 80309-0428, USA
Accepted 5 March 2004
Available online 9 April 2004
Abstract
A numerical approach to the reliability analysis of reinforced and prestressed concrete structures is presented. The
problem is formulated in terms of the probabilistic safety factor and the structural reliability is evaluated by Monte
Carlo simulation. The cumulative distribution of the safety factor associated with each limit state is derived and a
reliability index is evaluated. The proposed procedure is applied to reliability analysis of an existing prestressed concrete
arch bridge.
� 2004 Elsevier Ltd. All rights reserved.
Keywords: Concrete structures; Non-linear analysis; Structural reliability; Bridges; Simulation
1. Introduction
This paper considers a direct and systematic ap-
proach to the reliability analysis of reinforced and pre-
stressed concrete structures subjected to static loads [4].
The structural reliability is evaluated by Monte Carlo
simulation. Therefore, repeated non-linear analyses are
carried out giving outcomes from a set of basic variables
which define the structural problem (e.g. mechanical and
geometrical properties, dead and live loads, prestressing
forces, etc.). The results of the analysis associated to
each singular realization are then statistically examined
and used to evaluate the reliability index associated with
each considered limit state. The proposed procedure is
finally applied to the reliability assessment of an existing
arch bridge. The structure is modeled by using a com-
posite reinforced/prestressed concrete beam element,
* Corresponding author. Tel.: +39-02-2399-4394; fax: +39-
02-2399-4220.
E-mail address: [email protected] (F. Biondini).
0045-7949/$ - see front matter � 2004 Elsevier Ltd. All rights reserv
doi:10.1016/j.compstruc.2004.03.010
whose formulation accounts for the mechanical non-
linearity due to the constitutive properties of materials
(i.e. cracking, softening and crushing of concrete;
yielding, hardening and failure of steel; prestressing ac-
tion), as well as for the geometrical non-linearity due to
second order effects.
2. Probability of failure and reliability index
A structure is safe if the applied actions S are less
than its resistance R. The problem may also be formu-
lated in terms of the probabilistic safety factor H ¼ R=S.Let h be a particular outcome of the random variable H.
The probability of failure can be evaluated by the inte-
gration of the density probability function fHðhÞ withinthe failure domain D ¼ fhjh < 1g:
PF ¼ P ðH < 1Þ ¼ZDfHðhÞdh: ð1Þ
The above equation is often approximated as
PF ¼ Uð�bÞ; ð2Þ
ed.
1022 F. Biondini et al. / Computers and Structures 82 (2004) 1021–1031
where U is the standard normal cumulative probability
function and b ¼ �U�1ðPFÞ is the reliability index which
represents, in the space of the standard normal variables
(zero mean values and unit standard deviations), the
shortest distance from the origin to the surface which
defines the limit state.
3. Reliability assessment by simulation methods
In practice the density function fHðhÞ is not known
and at the most some information is available only
about a set of n basic random variables X ¼½X1 X2 � � � Xn �T which define the structural problem
(e.g. mechanical and geometrical properties, dead and
live loads, prestressing actions, etc.).
Moreover, in concrete design the limit states are
usually formulated in terms of functions of random
variables Y ¼ YðXÞ which describe the structural re-
sponse (e.g. stresses, strains, etc.), and such derivation is
generally only available in an implicit form. A numerical
approach is then required and the reliability analysis can
be performed by Monte Carlo simulation [6], where re-
peated analyses are carried out with random outcomes
of the basic variables X generated in accordance to their
marginal density functions fXiðxiÞ, i ¼ 1; . . . ; n. Based on
the sample obtained through the simulation process, the
density function fHðhÞ or the cumulative function FHðhÞcan be derived for each given limit state hðYÞ ¼ 0, and
the corresponding probability of failure PF ¼ FHð1Þ, aswell as the reliability index b ¼ �U�1½FHð1Þ�, can be
evaluated.
An analytical interpolation of the numerical results
can also be attempted, for example in terms of cumu-
lative function FHðhÞ. To this aim, a fairly regular and
non-decreasing function FHðhÞ with
limh!�1
FHðhÞ ¼ 0; limh!þ1
FHðhÞ ¼ 1 ð3Þ
can be chosen as described in Biondini et al. [1]:
FHðhÞ ¼1
21
"þ tanh
XKk¼0
ckhk
!#: ð4Þ
A good accuracy is usually achieved by assuming K ¼ 5
and the coefficients ck are identified through a least
square minimization.
4. Failure criteria for concrete structures
4.1. Serviceability limit states
Splitting cracks and considerable creep effects may
occur if the compression stresses rc in concrete are too
high. Besides, excessive stresses either in reinforcing steel
rs or in prestressing steel rp can lead to unacceptable
crack patterns. Excessive displacements s may also in-
volve loss of serviceability and then have to be limited
within assigned bounds s� and sþ. Based on these con-
siderations, the following constraints account for ade-
quate durability at the serviceability stage:
S1 : �rc 6 � acfck ; ð5aÞ
S2 : jrsj6 asfsyk; ð5bÞ
S3 : jrpj6 apfpyk ; ð5cÞ
S4 : s� 6 s6 sþ; ð5dÞ
where ac, as and ap are reduction factors of the charac-
teristic values fck , fsyk , and fpyk of the material strengths.
4.2. Ultimate limit states
When the strain in concrete ec, or in the reinforcing
steel es, or in the prestressing steel ep reaches a limit value
ecu, esu or epu, respectively, the failure of the corre-
sponding cross-section occurs. However, the failure of a
single cross-section does not necessarily lead to the
failure of the whole structure, since the latter is caused
by the loss of equilibrium arising when the reactions r
requested for the loads f can no longer be developed.
Therefore, the following ultimate conditions have to be
verified:
U1 : �ec 6 � ecu; ð6Þ
U2 : jesj6 esu; ð7Þ
U3 : jepjepu; ð8Þ
U4 : f6 r: ð9Þ
4.3. Probabilistic safety factors and limit load multipliers
Since these limit states refer to internal quantities of
the system, a check of the structural performance
through a non-linear analysis needs to be carried out at
the load level. To this aim, it is useful to assume
f ¼ gþHq, where g is a vector of dead loads and
prestressing actions, and q is a vector of live loads whose
intensity varies proportionally to a unique multiplier
HP 0. Using these vectors, the serviceability and ulti-
mate limit states previously defined can be directly de-
scribed in terms of the corresponding limit load
multipliers H, which assume the role of probabilistic
safety factors.
It is worth noting that non-linear analysis plays a
fundamental role in the evaluation of the limit load
multipliers. In fact, for reinforced and prestressed con-
F. Biondini et al. / Computers and Structures 82 (2004) 1021–1031 1023
crete structures the distribution of stresses and strains in
the materials (concrete, reinforcing and prestressing
steel), as well as the magnitude of the displacements and
the collapse loads, depend on non-linear phenomena as
cracking and crushing of the concrete matrix, yielding of
the reinforcement bars and/or of the prestressing cables,
second order geometrical effects, etc. As a consequence,
the investigated ultimate limit states cannot be investi-
gated in the linear field and, in most cases, such kind of
structures should be analyzed by taking material and,
possibly, geometrical non-linearity into account if real-
istic results under all load levels are needed.
Nowadays, non-linear analysis is a tool that can be
applied more easily than in the past. In many reports
and normative codes this aspect is recognized and it is
highlighted that non-linear analysis can give more
meaningful results than linear analysis. For these rea-
sons, a new trend in design is spreading, where the usual
procedure of non-linear verification of cross-sections on
the basis of the results of linear analyses tends to be
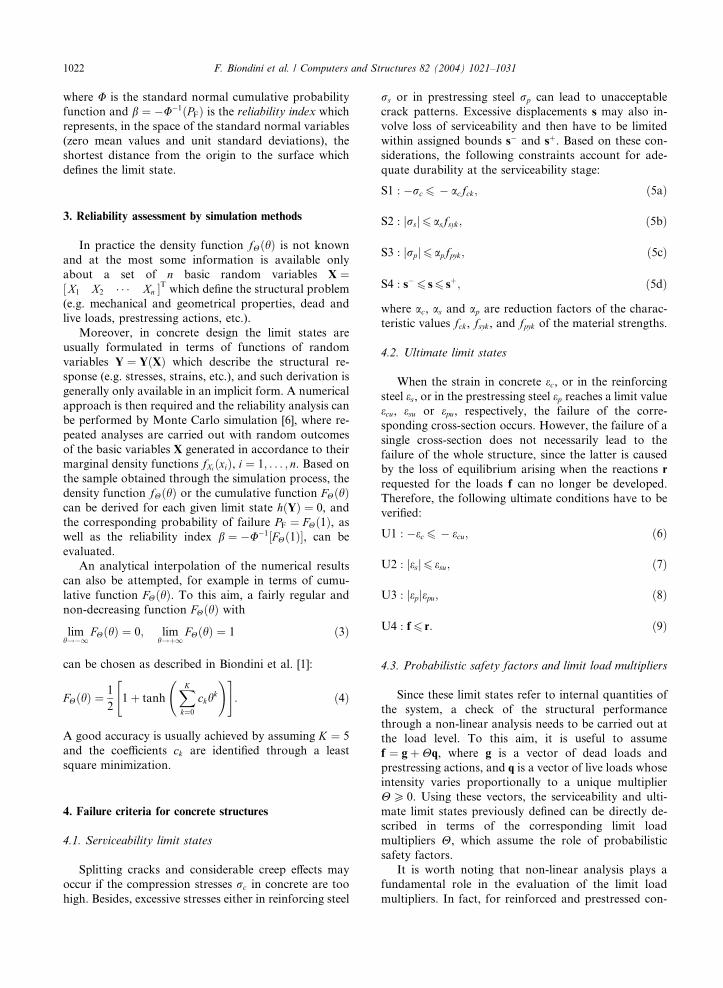
Fig. 1. View of the arch bridge over the Rio Avelengo, Bolzano,
Cemento––[7]).
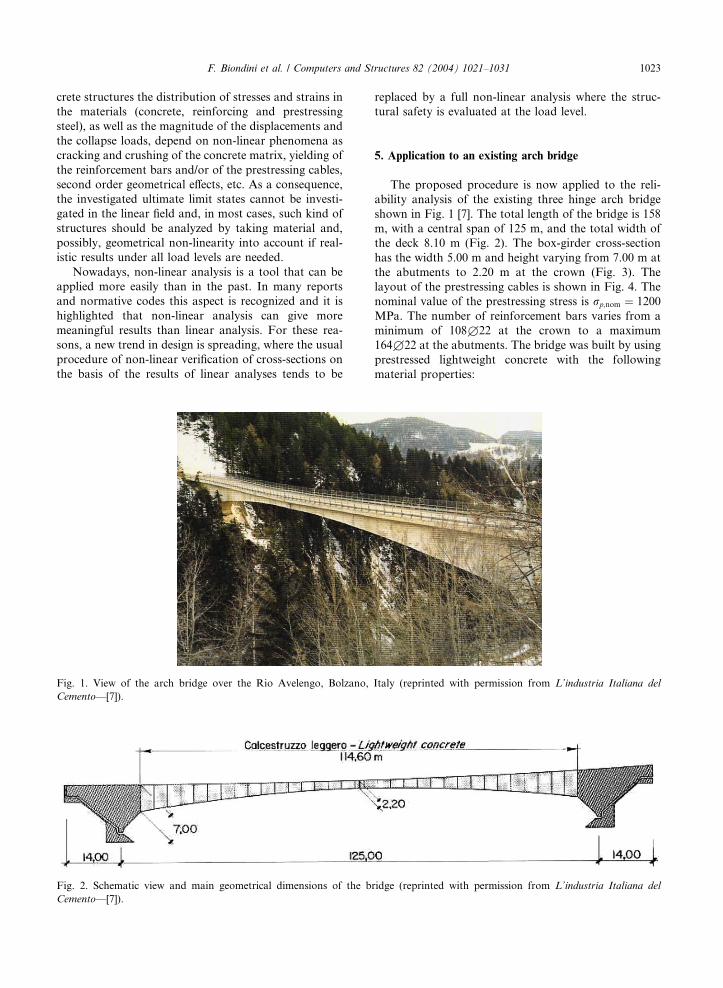
Fig. 2. Schematic view and main geometrical dimensions of the b
Cemento––[7]).
replaced by a full non-linear analysis where the struc-
tural safety is evaluated at the load level.
5. Application to an existing arch bridge
The proposed procedure is now applied to the reli-
ability analysis of the existing three hinge arch bridge
shown in Fig. 1 [7]. The total length of the bridge is 158
m, with a central span of 125 m, and the total width of
the deck 8.10 m (Fig. 2). The box-girder cross-section
has the width 5.00 m and height varying from 7.00 m at
the abutments to 2.20 m at the crown (Fig. 3). The
layout of the prestressing cables is shown in Fig. 4. The
nominal value of the prestressing stress is rp;nom ¼ 1200
MPa. The number of reinforcement bars varies from a
minimum of 108£22 at the crown to a maximum
164£22 at the abutments. The bridge was built by using
prestressed lightweight concrete with the following
material properties:
Italy (reprinted with permission from L’industria Italiana del
ridge (reprinted with permission from L’industria Italiana del
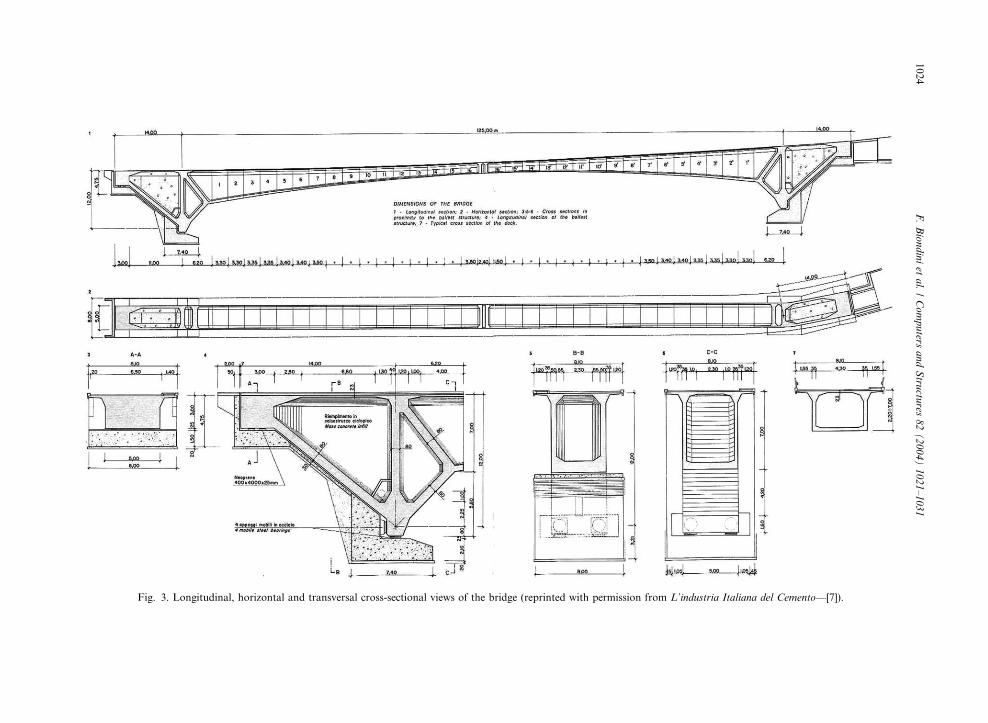
Fig. 3. Longitudinal, horizontal and transversal cross-sectional views of the bridge (reprinted with permission from L’industria Italiana del Cemento––[7]).
1024
F.Biondiniet
al./Computers
andStru
ctures
82(2004)1021–1031
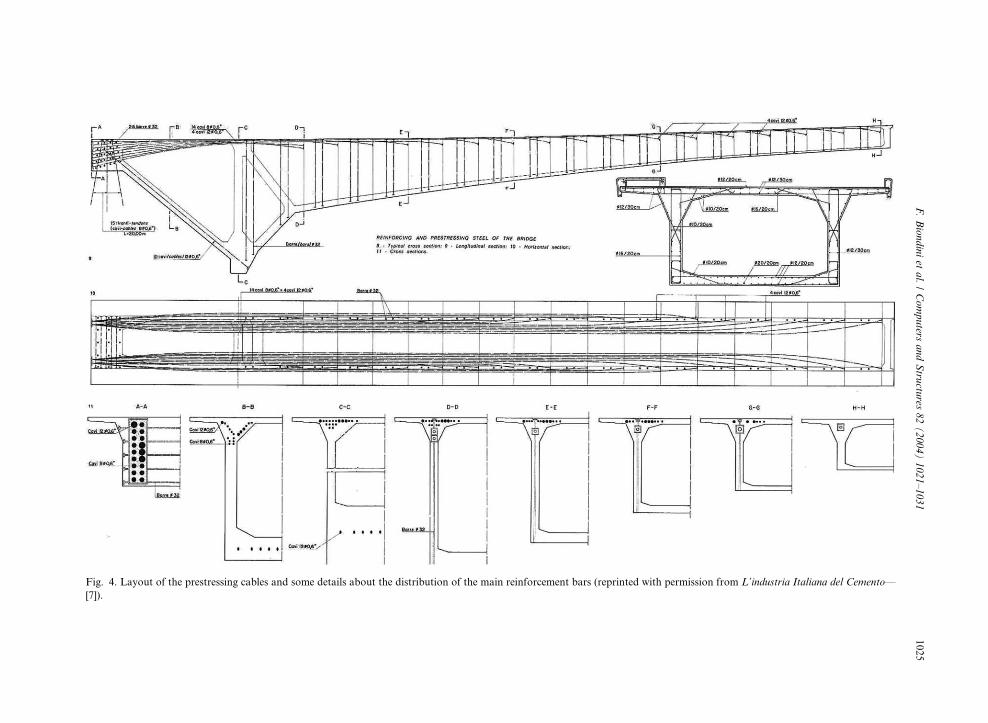
Fig. 4. Layout of the prestressing cables and some details about the distribution of the main reinforcement bars (reprinted with permission from L’industria Italiana del Cemento––
[7]).
F.Biondiniet
al./Computers
andStru
ctures
82(2004)1021–1031
1025
1026 F. Biondini et al. / Computers and Structures 82 (2004) 1021–1031
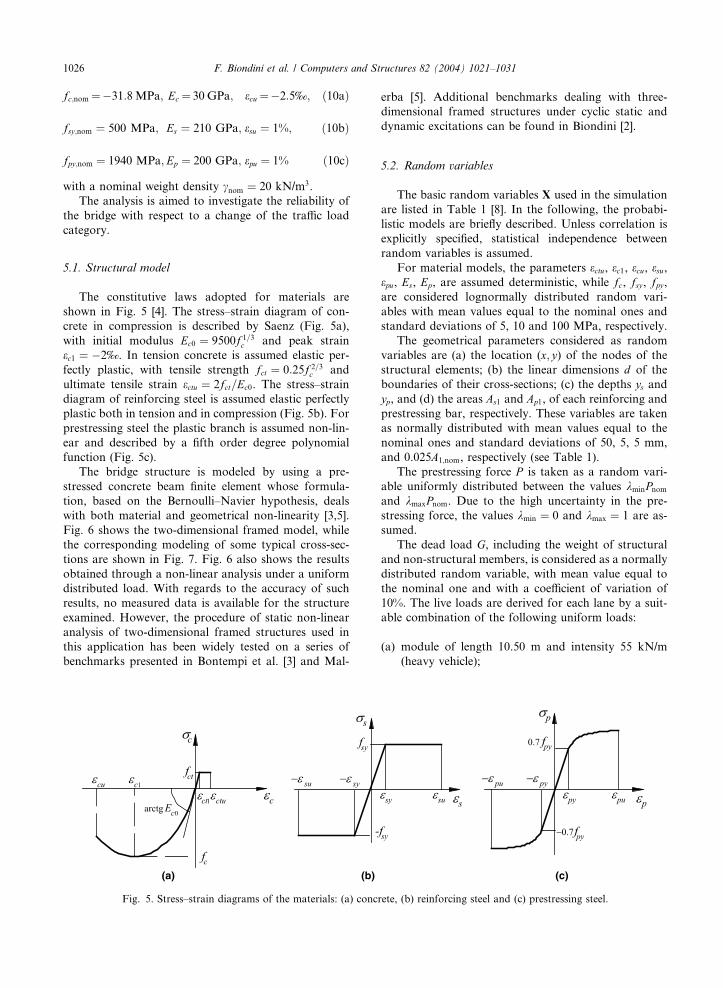
fc;nom ¼�31:8MPa; Ec ¼ 30 GPa; ecu ¼�2:5‰; ð10aÞ
fsy;nom ¼ 500 MPa; Es ¼ 210 GPa; esu ¼ 1%; ð10bÞ
fpy;nom ¼ 1940 MPa; Ep ¼ 200 GPa; epu ¼ 1% ð10cÞ
with a nominal weight density cnom ¼ 20 kN/m3.
The analysis is aimed to investigate the reliability of
the bridge with respect to a change of the traffic load
category.
5.1. Structural model
The constitutive laws adopted for materials are
shown in Fig. 5 [4]. The stress–strain diagram of con-
crete in compression is described by Saenz (Fig. 5a),
with initial modulus Ec0 ¼ 9500f 1=3c and peak strain
ec1 ¼ �2‰. In tension concrete is assumed elastic per-
fectly plastic, with tensile strength fct ¼ 0:25f 2=3c and
ultimate tensile strain ectu ¼ 2fct=Ec0. The stress–strain
diagram of reinforcing steel is assumed elastic perfectly
plastic both in tension and in compression (Fig. 5b). For
prestressing steel the plastic branch is assumed non-lin-
ear and described by a fifth order degree polynomial
function (Fig. 5c).
The bridge structure is modeled by using a pre-
stressed concrete beam finite element whose formula-
tion, based on the Bernoulli–Navier hypothesis, deals
with both material and geometrical non-linearity [3,5].
Fig. 6 shows the two-dimensional framed model, while
the corresponding modeling of some typical cross-sec-
tions are shown in Fig. 7. Fig. 6 also shows the results
obtained through a non-linear analysis under a uniform
distributed load. With regards to the accuracy of such
results, no measured data is available for the structure
examined. However, the procedure of static non-linear
analysis of two-dimensional framed structures used in
this application has been widely tested on a series of
benchmarks presented in Bontempi et al. [3] and Mal-
(a) (b)
Fig. 5. Stress–strain diagrams of the materials: (a) concr
erba [5]. Additional benchmarks dealing with three-
dimensional framed structures under cyclic static and
dynamic excitations can be found in Biondini [2].
5.2. Random variables
The basic random variables X used in the simulation
are listed in Table 1 [8]. In the following, the probabi-
listic models are briefly described. Unless correlation is
explicitly specified, statistical independence between
random variables is assumed.
For material models, the parameters ectu, ec1, ecu, esu,epu, Es, Ep, are assumed deterministic, while fc, fsy , fpy ,are considered lognormally distributed random vari-
ables with mean values equal to the nominal ones and
standard deviations of 5, 10 and 100 MPa, respectively.
The geometrical parameters considered as random
variables are (a) the location (x; y) of the nodes of the
structural elements; (b) the linear dimensions d of the
boundaries of their cross-sections; (c) the depths ys andyp, and (d) the areas As1 and Ap1, of each reinforcing and
prestressing bar, respectively. These variables are taken
as normally distributed with mean values equal to the
nominal ones and standard deviations of 50, 5, 5 mm,
and 0.025A1;nom, respectively (see Table 1).
The prestressing force P is taken as a random vari-
able uniformly distributed between the values kminPnomand kmaxPnom. Due to the high uncertainty in the pre-
stressing force, the values kmin ¼ 0 and kmax ¼ 1 are as-
sumed.
The dead load G, including the weight of structural
and non-structural members, is considered as a normally
distributed random variable, with mean value equal to
the nominal one and with a coefficient of variation of
10%. The live loads are derived for each lane by a suit-
able combination of the following uniform loads:
(a) module of length 10.50 m and intensity 55 kN/m
(heavy vehicle);
(c)
ete, (b) reinforcing steel and (c) prestressing steel.
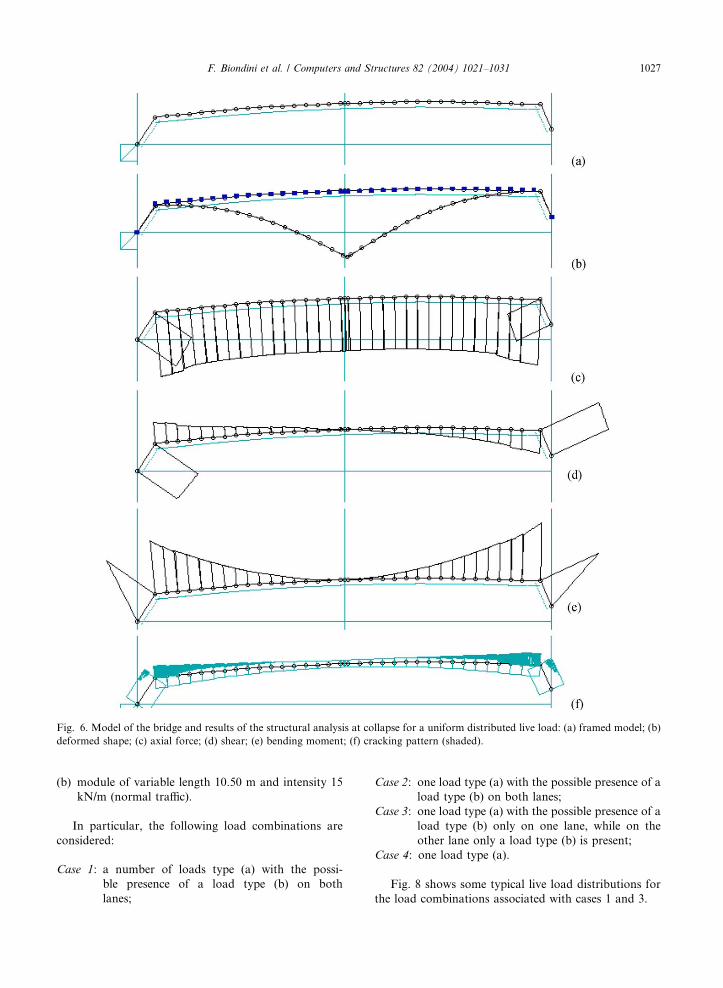
Fig. 6. Model of the bridge and results of the structural analysis at collapse for a uniform distributed live load: (a) framed model; (b)
deformed shape; (c) axial force; (d) shear; (e) bending moment; (f) cracking pattern (shaded).
F. Biondini et al. / Computers and Structures 82 (2004) 1021–1031 1027
(b) module of variable length 10.50 m and intensity 15
kN/m (normal traffic).
In particular, the following load combinations are
considered:
Case 1: a number of loads type (a) with the possi-
ble presence of a load type (b) on both
lanes;
Case 2: one load type (a) with the possible presence of a
load type (b) on both lanes;
Case 3: one load type (a) with the possible presence of a
load type (b) only on one lane, while on the
other lane only a load type (b) is present;
Case 4: one load type (a).
Fig. 8 shows some typical live load distributions for
the load combinations associated with cases 1 and 3.
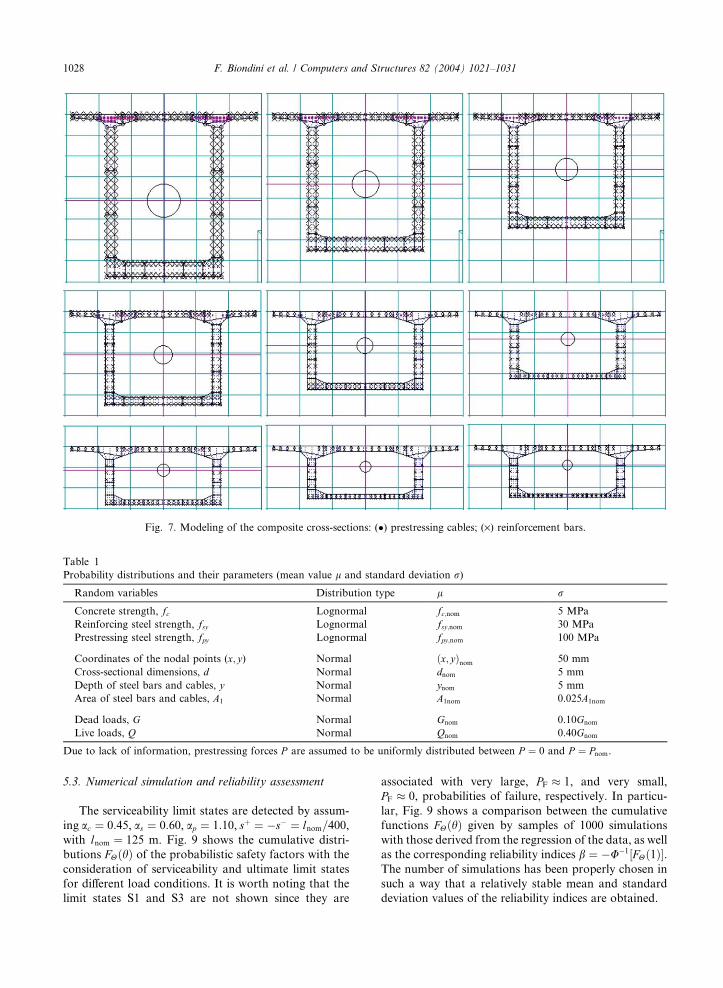
Fig. 7. Modeling of the composite cross-sections: (�) prestressing cables; (·) reinforcement bars.
Table 1
Probability distributions and their parameters (mean value l and standard deviation r)
Random variables Distribution type l r
Concrete strength, fc Lognormal fc;nom 5 MPa
Reinforcing steel strength, fsy Lognormal fsy;nom 30 MPa
Prestressing steel strength, fpy Lognormal fpy;nom 100 MPa
Coordinates of the nodal points (x; y) Normal ðx; yÞnom 50 mm
Cross-sectional dimensions, d Normal dnom 5 mm
Depth of steel bars and cables, y Normal ynom 5 mm
Area of steel bars and cables, A1 Normal A1nom 0.025A1nom
Dead loads, G Normal Gnom 0.10Gnom
Live loads, Q Normal Qnom 0.40Gnom
Due to lack of information, prestressing forces P are assumed to be uniformly distributed between P ¼ 0 and P ¼ Pnom.
1028 F. Biondini et al. / Computers and Structures 82 (2004) 1021–1031
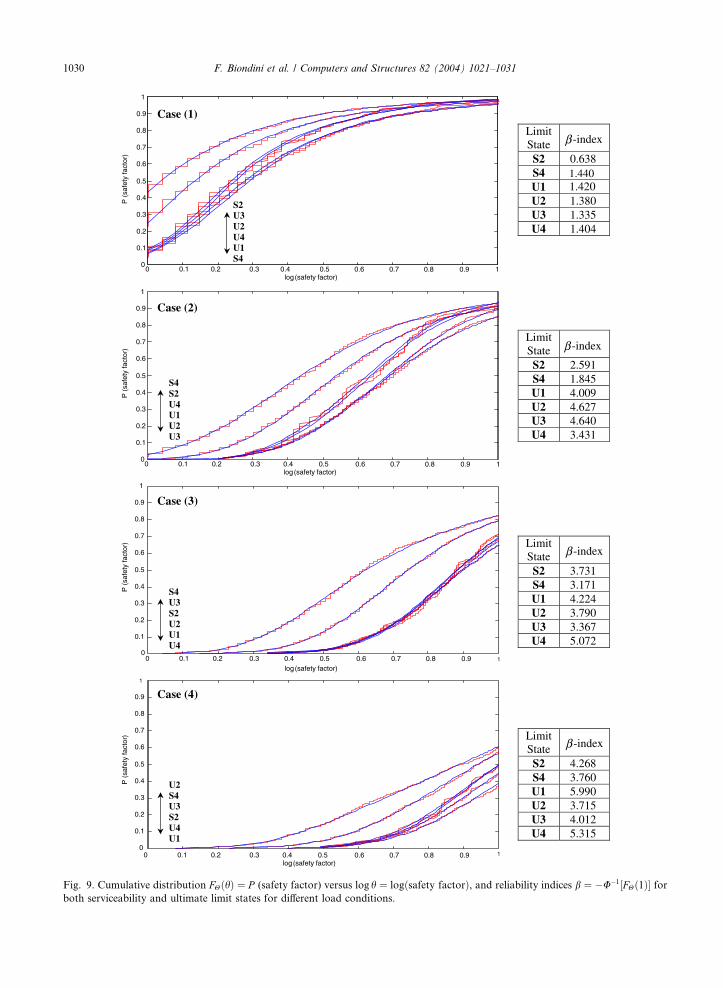
5.3. Numerical simulation and reliability assessment
The serviceability limit states are detected by assum-
ing ac ¼ 0:45, as ¼ 0:60, ap ¼ 1:10, sþ ¼ �s� ¼ lnom=400,with lnom ¼ 125 m. Fig. 9 shows the cumulative distri-
butions FHðhÞ of the probabilistic safety factors with the
consideration of serviceability and ultimate limit states
for different load conditions. It is worth noting that the
limit states S1 and S3 are not shown since they are
associated with very large, PF � 1, and very small,
PF � 0, probabilities of failure, respectively. In particu-
lar, Fig. 9 shows a comparison between the cumulative
functions FHðhÞ given by samples of 1000 simulations
with those derived from the regression of the data, as well
as the corresponding reliability indices b ¼ �U�1½FHð1Þ�.The number of simulations has been properly chosen in
such a way that a relatively stable mean and standard
deviation values of the reliability indices are obtained.
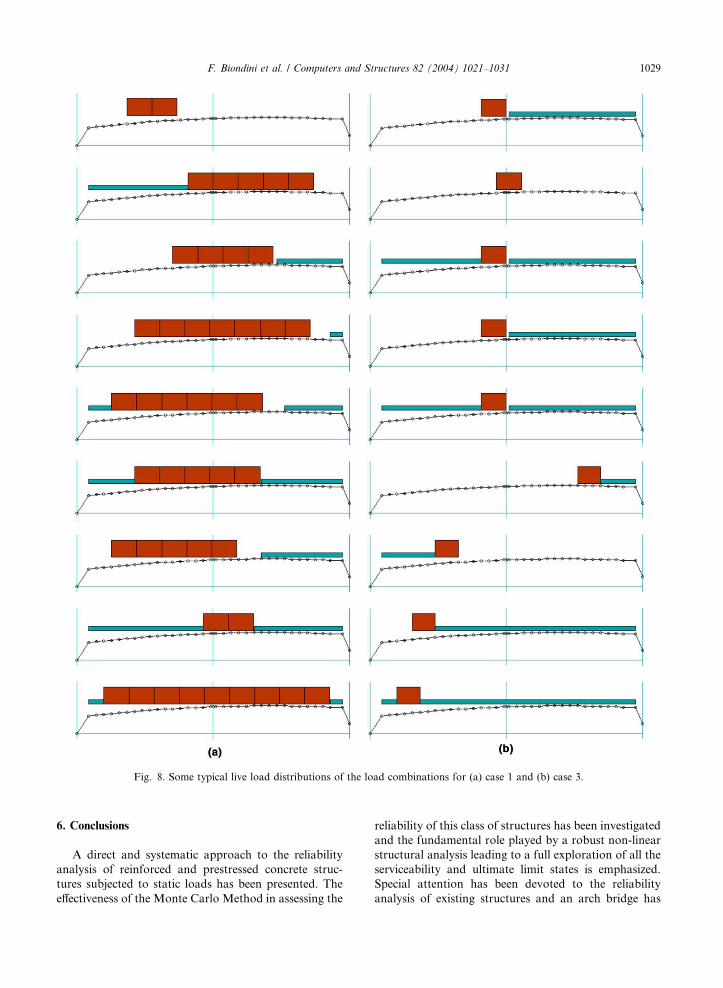
Fig. 8. Some typical live load distributions of the load combinations for (a) case 1 and (b) case 3.
F. Biondini et al. / Computers and Structures 82 (2004) 1021–1031 1029
6. Conclusions
A direct and systematic approach to the reliability
analysis of reinforced and prestressed concrete struc-
tures subjected to static loads has been presented. The
effectiveness of the Monte Carlo Method in assessing the
reliability of this class of structures has been investigated
and the fundamental role played by a robust non-linear
structural analysis leading to a full exploration of all the
serviceability and ultimate limit states is emphasized.
Special attention has been devoted to the reliability
analysis of existing structures and an arch bridge has
0 0.1 0.2 0.3 0.4 0.5 0.6 0.7 0.8 0.9 1log (safety factor)
0
0.1
0.2
0.3
0.4
0.5
0.6
0.7
0.8
0.9
1
P (
safe
ty fa
ctor
)Case (1)
P (
safe
ty fa
ctor
)Limit State S2 0.638S4 1.440U1 1.420U2 1.380U3 1.335U4 1.404
Limit State S2 2.591 S4 1.845 U1 4.009 U2 4.627 U3 4.640 U4 3.431
Limit State S2 3.731 S4 3.171 U1 4.224 U2 3.790 U3 3.367 U4 5.072
Limit State S2 4.268 S4 3.760 U1 5.990 U2 3.715 U3 4.012 U4 5.315
S2U3U2U4U1S4
Case (2)
S4S2U4U1U2U3
Case (3)
S4U3S2U2U1U4
P (
safe
ty fa
ctor
)P
(sa
fety
fact
or)
Case (4)
U2S4U3S2U4U1
0
0.1
0.2
0.3
0.4
0.5
0.6
0.7
0.8
0.9
1
0 0.1 0.2 0.3 0.4 0.5 0.6 0.7 0.8 0.9 1log (safety factor)
0.1
0
0.2
0.3
0.4
0.5
0.6
0.7
0.8
0.9
1
0
0.1
0.2
0.3
0.4
0.5
0.6
0.7
0.8
0.9
1
0 0.1 0.2 0.3 0.4 0.5 0.6 0.7 0.8 0.9 1
log (safety factor)
0 0.1 0.2 0.3 0.4 0.5 0.6 0.7 0.8 0.9 1
log (safety factor)
-indexβ
-indexβ
-indexβ
-indexβ
Fig. 9. Cumulative distribution FHðhÞ ¼ P (safety factor) versus log h ¼ logðsafety factorÞ, and reliability indices b ¼ �U�1½FHð1Þ� forboth serviceability and ultimate limit states for different load conditions.
1030 F. Biondini et al. / Computers and Structures 82 (2004) 1021–1031
F. Biondini et al. / Computers and Structures 82 (2004) 1021–1031 1031
been selected as structural prototype in order to verify
the effectiveness of the proposed approach. Such bridge
represents a real ‘‘case study’’ where reliability analysis
has been actually selected as the main tool for the
evaluation of the structural performance of an existing
structure under loads sensibly higher than the original
design loads (change of the traffic load category).
Acknowledgements
The study presented in this paper is supported by
research funds MIUR-COFIN2002 from the Depart-
ment of Structural Engineering, Technical University of
Milan, Italy, and the Department of Structural and
Geotechnical Engineering, University of Rome ‘‘La
Sapienza’’, Italy.
References
[1] Biondini F, Bontempi F, Malerba PG. Reliability analysis
of RC/PC structures by simulation of the nonlinear struc-
tural behaviour, vol. 19. Studi e Ricerche, Scuola di
Specializzazione in Costruzioni in Cemento Armato, Po-
litecnico di Milano; 1998. p. 23–58 [in Italian].
[2] Biondini F. Modeling and optimization of bridge structures
under seismic actions. PhD Thesis, Politecnico di Milano,
Milan, Italy; 2000 [in Italian].
[3] Bontempi F, Malerba PG, Romano L. A direct secant
formulation for the reinforced and prestressed concrete
frames analysis, vol. 16. Studi e Ricerche, Scuola di
Specializzazione in Costruzioni in Cemento Armato, Po-
litecnico di Milano; 1995. p. 351–86 [in Italian].
[4] Bontempi F, Biondini F, Malerba PG. Reliability analysis
of reinforced concrete structures based on a Monte Carlo
simulation. In: Proceedings of Fourth International Con-
ference on Stochastic Structural Dynamics (SSD’98),
August 6–8, Notre Dame, Indiana, USA; 1998.
[5] Malerba PG, editor. Limit and nonlinear analysis of
reinforced concrete structures. Udine: CISM; 1998 [in
Italian].
[6] Rubinstein RY. Simulation and the Monte Carlo method.
New York: Wiley; 1981.
[7] Segre E. A lightweight concrete bridge over the river Rio
Sinigo in Avelengo (Bolzano). L’industria Italiana del
Cemento 1983;12:759–72.
[8] Vismann U, Zilch K. Nonlinear analysis and safety evalu-
ation by finite element reliability method. CEB Bulletin
d’Information 1995;229:49–73.