Embed Size (px)
Citation preview
Reliability Engineering and System Safety 175 (2018) 283–305
Contents lists available at ScienceDirect
Reliability Engineering and System Safety
journal homepage: www.elsevier.com/locate/ress
A multi-hazard approach to assess severe weather-induced major power
outage risks in the U.S.
Sayanti Mukherjee a , ∗ , Roshanak Nateghi b , Makarand Hastak c
a Lyles School of Civil Engineering, Division of Construction Engineering and Management, and School of Industrial Engineering, 550 Stadium Mall Drive,
Purdue University, West Lafayette, IN 47907, USA b School of Industrial Engineering, and Division of Environmental and Ecological Engineering, 610 Purdue Mall, Purdue University, West Lafayette, IN 47907, USA c Lyles School of Civil Engineering and Division of Construction Engineering and Management, 550 Stadium Mall Drive, Purdue University, West Lafayette, IN 47907,
USA
a r t i c l e i n f o
Keywords:
Major power outages
Multi-hazard risk analytics
Extreme event risk
State-level risk analytics
Support vector machines
Random forest
Hybrid statistical learning model
a b s t r a c t
Severe weather-induced power outages affect millions of people and cost billions of dollars of economic losses
each year. The National Association of Regulatory Utility Commissioners have recently highlighted the impor-
tance of building electricity sector’s resilience, and thereby enhancing service-security and long-term economic
benefits. In this paper, we propose a multi-hazard approach to characterize the key predictors of severe weather-
induced sustained power outages. We developed a two-stage hybrid risk estimation model , leveraging algorithmic
data-mining techniques. We trained our risk models using publicly available information on historical major
power outages, socio-economic data, state-level climatological observations, electricity consumption patterns
and land-use data. Our results suggest that power outage risk is a function of various factors such as the type of
natural hazard, expanse of overhead T&D systems, the extent of state-level rural versus urban areas, and poten-
tially the levels of investments in operations/maintenance activities (e.g., tree-trimming, replacing old equipment,
etc.). The proposed framework can help state regulatory commissions make risk-informed resilience investment
decisions.
© 2018 Elsevier Ltd. All rights reserved.
1
o
c
t
m
e
d
s
n
v
s
s
e
f
i
c
c
e
S
s
c
h
d
T
t
d
r
a
w
a
y
t
c
S
p
R
a
h
R
A
0
. Introduction and background
The U.S. electric power infrastructure is a highly complex and ge-
graphically extended socio-technical system, with varying degrees of
onnectivity and redundancy. The reliability and resilience of the elec-
ric power infrastructure system is a major concern worldwide, since our
odern society is strongly dependent on adequate supply and delivery of
lectricity for its proper functioning. Due to the large-scale interdepen-
encies between the electric sector and all other critical infrastructure
ystems in the U.S., disruption in this sector can adversely affect our
ational security, socio-economic conditions, public health, and the en-
ironment. The current U.S. electric power infrastructure is aging, and
uffering from chronic under-investments. The existing capacity expan-
ion plans in the electricity sector are not keeping pace with the soci-
ty’s rising demand [1] . On the other hand, under climate change, the
requency and/or intensity of extreme weather and climate events are
ncreasing in many regions of the world [2–12] . Extreme weather and
limate events are among the primary causes of infrastructure damage
ausing large-scale cascading power outages, or shifts in the end-use
lectricity demands leading to supply inadequacy risks in the United
∗ Corresponding author.
E-mail address: [email protected] (S. Mukherjee).
ttps://doi.org/10.1016/j.ress.2018.03.015
eceived 28 June 2017; Received in revised form 25 February 2018; Accepted 7 March 2018
vailable online 8 March 2018
951-8320/© 2018 Elsevier Ltd. All rights reserved.
tates [12–19] . In fact, the weather and climate related outages have
ubstantially increased over the past two decades [20] . Extreme hydro-
limatological hazards such as storms, floods, wildfires, droughts, and
eatwaves are imminent risks that can result in cascading outages, either
ue to physical damage or deviated electricity demand [19,17,21,22] .
he extreme-weather induced impacts on the electric power infrastruc-
ure can be so severe that service restoration to ex-ante disaster con-
ition might take weeks, months or sometimes even years [23,24] . A
ecent report by Climate Central (2014) indicated that higher frequency
nd intensity of severe weather and climate events under climate change
ill likely increase large-scale power outage risks in the U.S., that can
ffect millions of people, and cost the economy billions of dollars each
ear [20] .
The large-scale blackouts, such as, (i) the Southwest Blackout in 2011
hat left 2.7 million people without power for around 12 h; (ii) the Dere-
ho in 2012 that impacted 4.2 million people across 11 states, and (iii)
uper storm Sandy in 2012 that impacted more than 8.5 million peo-
le across several northeastern states (e.g., MD, DE, NJ, NY, CT, MA,
I), particularly highlight the extent to which the urban communities
re vulnerable to electric power service interruptions [25,26] . Over the
S. Mukherjee et al. Reliability Engineering and System Safety 175 (2018) 283–305
p
o
[
c
(
s
v
s
e
f
i
h
p
n
r
a
c
o
o
i
s
a
b
t
v
w
t
H
s
a
a
m
r
e
t
t
p
a
m
r
t
a
w
w
t
p
a
t
Nomenclature
Abbreviations
BART Bayesian Additive Regression Trees
CPI Consumer Price Index
FERC Federal Energy Regulatory Commission
FRCC Florida Reliability Coordinating Council
GWHr Gigawatt-hour
NERC North American Electric Reliability Corporation
NOAA National Oceanic and Atmospheric Administration
NPCC Northeast Power Coordinating Council
PDP Partial Dependence Plot
RF Random Forest
SPP Southwest Power Pool, Inc.
SVM Support Vector Machines
TRE Texas Reliability Entity
U.S. United States
USD United States Dollar ($)
WECC Western Electricity Coordinating Council
eriod of 2003–2012, weather-related outages have cost the U.S. econ-
my an inflation-adjusted annual average of $20 billion to $55 billion
27] . The U.S. has experienced 219 billion-dollar severe weather and
limate disasters since 1980, total cost of which exceeded $1.5 trillion
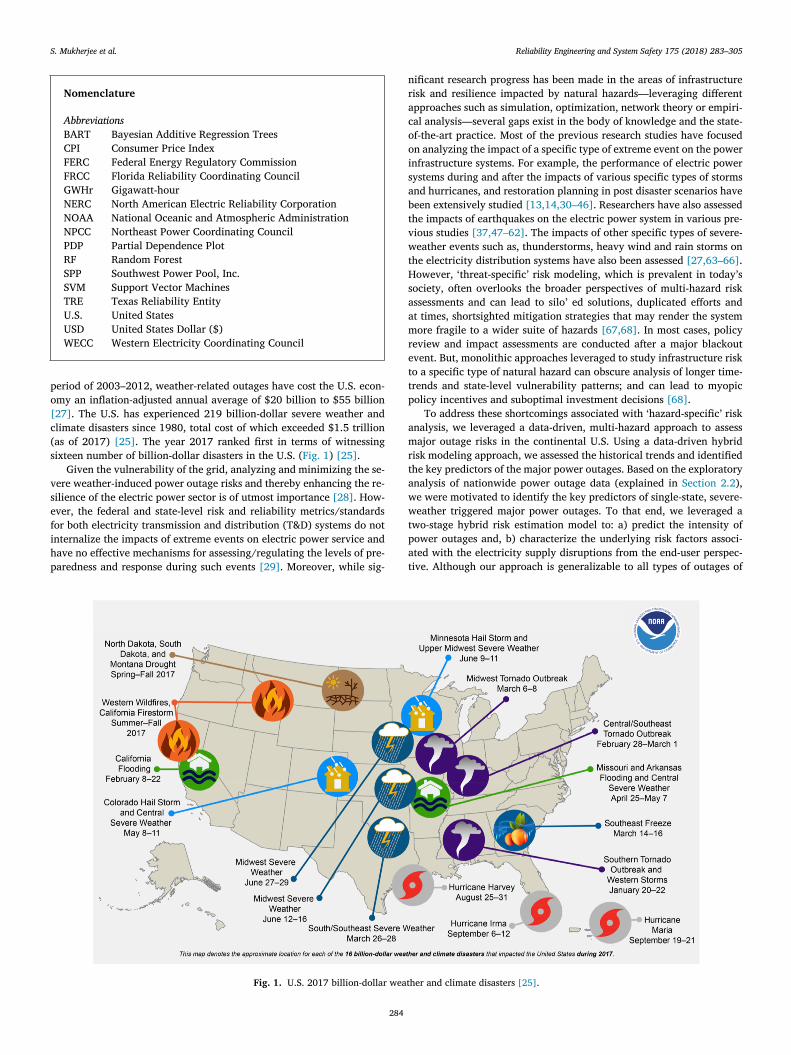
as of 2017) [25] . The year 2017 ranked first in terms of witnessing
ixteen number of billion-dollar disasters in the U.S. ( Fig. 1 ) [25] .
Given the vulnerability of the grid, analyzing and minimizing the se-
ere weather-induced power outage risks and thereby enhancing the re-
ilience of the electric power sector is of utmost importance [28] . How-
ver, the federal and state-level risk and reliability metrics/standards
or both electricity transmission and distribution (T&D) systems do not
nternalize the impacts of extreme events on electric power service and
ave no effective mechanisms for assessing/regulating the levels of pre-
aredness and response during such events [29] . Moreover, while sig-
Fig. 1. U.S. 2017 billion-dollar weat
284
ificant research progress has been made in the areas of infrastructure
isk and resilience impacted by natural hazards––leveraging different
pproaches such as simulation, optimization, network theory or empiri-
al analysis––several gaps exist in the body of knowledge and the state-
f-the-art practice. Most of the previous research studies have focused
n analyzing the impact of a specific type of extreme event on the power
nfrastructure systems. For example, the performance of electric power
ystems during and after the impacts of various specific types of storms
nd hurricanes, and restoration planning in post disaster scenarios have
een extensively studied [13,14,30–46] . Researchers have also assessed
he impacts of earthquakes on the electric power system in various pre-
ious studies [37,47–62] . The impacts of other specific types of severe-
eather events such as, thunderstorms, heavy wind and rain storms on
he electricity distribution systems have also been assessed [27,63–66] .
owever, ‘threat-specific’ risk modeling, which is prevalent in today’s
ociety, often overlooks the broader perspectives of multi-hazard risk
ssessments and can lead to silo’ ed solutions, duplicated efforts and
t times, shortsighted mitigation strategies that may render the system
ore fragile to a wider suite of hazards [67,68] . In most cases, policy
eview and impact assessments are conducted after a major blackout
vent. But, monolithic approaches leveraged to study infrastructure risk
o a specific type of natural hazard can obscure analysis of longer time-
rends and state-level vulnerability patterns; and can lead to myopic
olicy incentives and suboptimal investment decisions [68] .
To address these shortcomings associated with ‘hazard-specific’ risk
nalysis, we leveraged a data-driven, multi-hazard approach to assess
ajor outage risks in the continental U.S. Using a data-driven hybrid
isk modeling approach, we assessed the historical trends and identified
he key predictors of the major power outages. Based on the exploratory
nalysis of nationwide power outage data (explained in Section 2.2 ),
e were motivated to identify the key predictors of single-state, severe-
eather triggered major power outages. To that end, we leveraged a
wo-stage hybrid risk estimation model to: a) predict the intensity of
ower outages and, b) characterize the underlying risk factors associ-
ted with the electricity supply disruptions from the end-user perspec-
ive. Although our approach is generalizable to all types of outages of
her and climate disasters [25] .
S. Mukherjee et al. Reliability Engineering and System Safety 175 (2018) 283–305
Table 1
Variable types and sources for power outage risk analysis over the years of 2000–2016.
# Data types Data source
1 State-level population (yearly) U.S. Census Bureau
2 Climate regions (by state) National Oceanic and Administrative Administration (NOAA)
3 Type of the year (El Niño/La Niña) National Oceanic and Administrative Administration (NOAA)
4 Electricity consumption patterns U.S. Energy Information Administration (EIA 826)
5 Percentage customers served (yearly) U.S. Energy Information Administration (EIA 861)
6 Economic characteristics (yearly) Bureau of Economic Analysis (BEA)
7 Percentage of urban & rural areas (as of 2010) U.S. Census Bureau
8 Percentage of land & water mass (as of 2010) U.S. Census Bureau
9 State-level climate and weather data NOAA’s National Climatic Data Center (NCDC)
v
l
p
s
e
s
i
c
d
i
T
a
2
s
D
v
i
2
e
a
f
d
E
a
a
i
g
t
1
p
t
t
o
/
(
t
e
a
a
H
a
t
n
t
m
p
t
s
p
S
s
c
w
s
t
b
o
p
o
i
i
a
r
n
c
a
o
c
p
a
f
(
(
t
o
n
u
c
2
d
g
F
n
c
e
m
o
1 The data is published by the DOE’s Office of Electricity Delivery and Energy
Reliability [69]
arying severity levels, we restricted our scope to analyzing the extreme-
evel outages for brevity of this paper. Our analysis is based on historical
ower outage events during 2000–2015 that affected customers within a
ingle U.S. state. Our proposed data-driven, hybrid risk estimation mod-
ls were trained using the publicly available electric power outage data
ets available at the DOE [69] .
The structure of this article is as follows: Section 1 presents a brief
ntroduction and overview of the existing literature, highlighting the
urrent state-of-art knowledge and research gaps. It is followed by a
escription of the data sources, data filtering and preparation processes
n Section 2 . Sections 3 and 4 describe our methodologies and results.
he article is concluded in Section 5 by summarizing the key findings
nd delineating future research directions.
. Data description
In this section, the data used to develop the proposed multi-hazard,
tate-level, hybrid, power outage risk assessment model is described.
ata sources are discussed in Section 2.1 . Data processing and response
ariable normalization are summarized in Section 2.2 , and the final fully
ntegrated data set used for our analysis is presented in Section 2.3 .
.1. Data sources and filtering
The national repository of outage data from the Department of En-
rgy (DOE) serves as a valuable —and yet under-explored —resource for
ssessing power outage risks in the United States. The data is obtained
rom the OE 417 form-Schedule 1, “Electric emergency incidents and
isturbances ”, published by the DOE’s Office of Electricity Delivery and
nergy Reliability [69] . The data ranges from January 2000 to July 2016
nd the total number of observations recorded is 1860. The entities who
re required to file this report after any electricity disturbance incident
nclude electric utilities, balancing authorities, reliability coordinators,
enerating utilities, local utilities as well as computer, telecommunica-
ion and physical security offices. An initial report should be filed within
to 6 h of the incident (dependent on the event type) and the final re-
ort should be submitted within 72 h of the incident [70] . The different
ypes of information based on the reporting criteria as obtained from
he database are summarized as follows [70] : (i) alert status; (ii) cause
f the outage, i.e., the event type; (iii) date and time when the incident
disruption begins; (iv) date and time of restoration end (incident end);
v) estimated amount of demand involved (peak demand); and (iv) es-
imated amount of the total number of customers affected during the
ntire event (this might be higher than the peak number of customers
ffected in case of the rolling blackouts).
The quality and completeness of the data is checked, validated and
pproved by the Office of Electricity Delivery and Energy Reliability.
owever, due to inadequate reporting enforcements, many incidents
re underreported [71] . Due to changes in regulatory requirements over
ime, the number of recorded incidents might underestimate the actual
umber of incidents that happened during the period. For example, since
he North American Electric Reliability Corporation (NERC) instituted
285
andatory reliability reporting to the DOE in 2007, the number of re-
orted disturbance events witnessed a jump from 2007 [71] . Despite all
he shortcomings, the data obtained from the OE 417 —Schedule 1 form
erves as a valuable resource for understanding the electricity outage
atterns and the associated risks to the electricity sector in the United
tates. To further enhance data quality prior to the statistical analysis,
everal data-preprocessing, filtering and normalization processes were
onducted as discussed below.
Out of 1860 recorded disruptions in the dataset, 10 observations had
rong inputs of date or time (or both) for either or both of the “Event
tart time ” and/or “Restoration end time ”. Such observations were de-
ected as their outage duration were negative which was deemed infeasi-
le. Thus, those observations were removed from the dataset. The cause
f the 14th of August 2003 Northeast blackout was reported as “not ap-
licable ” by the respondent in the OE 417 form [70] . Later investigations
f the blackout (analysis conducted after 72 h of the incident happen-
ng, not fulfilling the criteria as mentioned in the OE 417 form [70] ),
dentified various factors such as inadequate system understanding, in-
dequate situational awareness, inadequate tree-trimming, inadequate
eliability coordinator (RC) diagnostic support, and most importantly,
on-malicious software program failure that led to rolling outages that
ascaded through the highly interconnected power grid system, causing
historic blackout [72] . Since the major cause was related to system
peration, we categorized this event as system operability disruption.
Besides power outage information, data was also collected on the
limate region of the locations where the event took place, state’s to-
ography and electricity consumption patterns from various publicly
vailable sources. The data sources (summarized in Table 1 ) include in-
ormation on: (i) state-level population, (ii) climate regions of the states,
iii) multi-year climatic oscillation indices (such as El Niño or La Niña),
iv) electricity consumption patterns in the state, (v) percentages of cus-
omers served by the utilities in the state, (vi) economic characteristics
f the state, (vii) state utility sector’s contribution to the state’s eco-
omic activity (measured by gross state product), (viii) percentages of
rban and rural areas, (ix) percentages of land and water mass, and (x)
limate and weather data [73] .
.2. Data visualization
We conducted an exploratory analysis of the electric power outage
ata —reported to the Department of Energy (DOE) as “electric emer-
ency incidents and disturbances ”—during the period of 2000–2016. 1
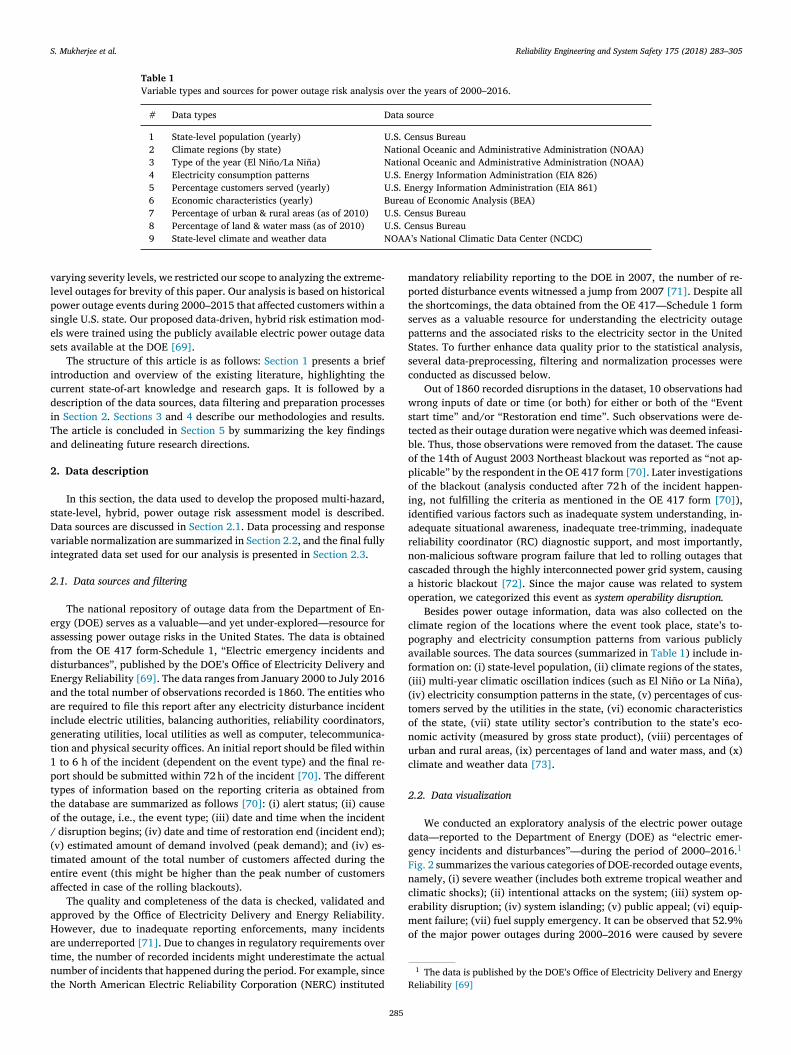
ig. 2 summarizes the various categories of DOE-recorded outage events,
amely, (i) severe weather (includes both extreme tropical weather and
limatic shocks); (ii) intentional attacks on the system; (iii) system op-
rability disruption; (iv) system islanding; (v) public appeal; (vi) equip-
ent failure; (vii) fuel supply emergency. It can be observed that 52.9%
f the major power outages during 2000–2016 were caused by severe
S. Mukherjee et al. Reliability Engineering and System Safety 175 (2018) 283–305
2.6%3.1%
4.0%
22.9%
4.2%
52.9%
10.3%
Fig. 2. Distribution of major power outages in the U.S. reported during 2000–2015.
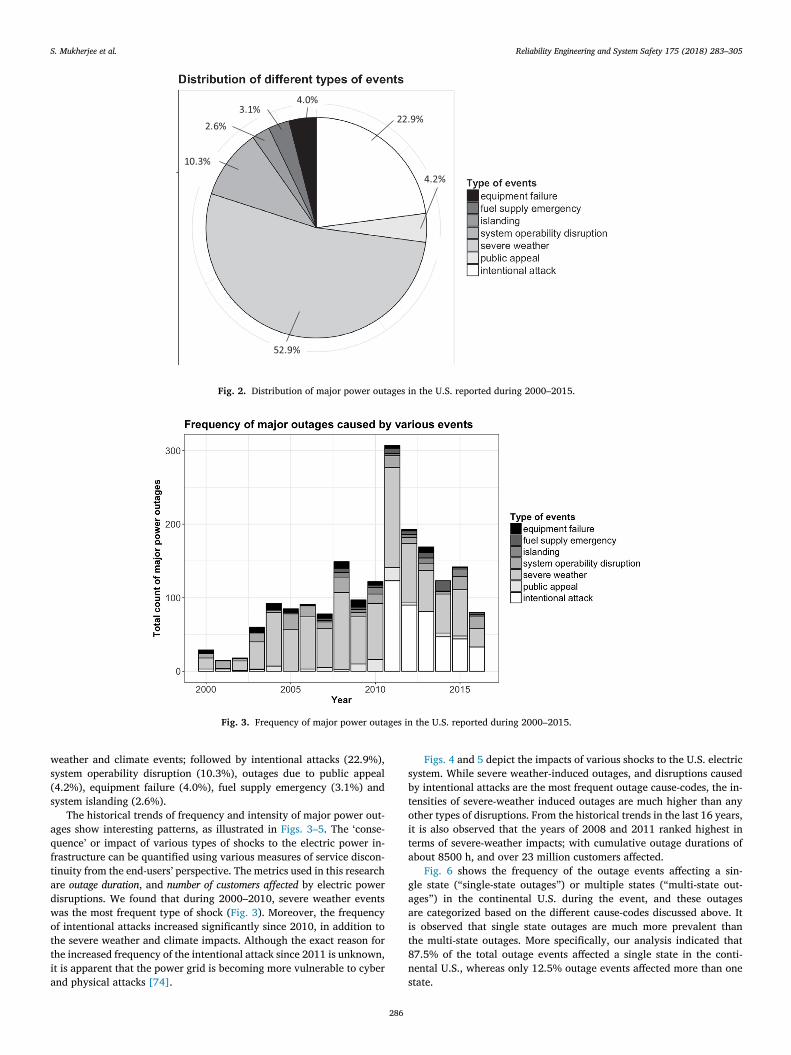
Fig. 3. Frequency of major power outages in the U.S. reported during 2000–2015.
w
s
(
s
a
q
f
t
a
d
w
o
t
t
i
a
s
b
t
o
i
t
a
g
a
a
i
t
8
n
s
eather and climate events; followed by intentional attacks (22.9%),
ystem operability disruption (10.3%), outages due to public appeal
4.2%), equipment failure (4.0%), fuel supply emergency (3.1%) and
ystem islanding (2.6%).
The historical trends of frequency and intensity of major power out-
ges show interesting patterns, as illustrated in Figs. 3–5 . The ‘conse-
uence’ or impact of various types of shocks to the electric power in-
rastructure can be quantified using various measures of service discon-
inuity from the end-users’ perspective. The metrics used in this research
re outage duration , and number of customers affected by electric power
isruptions. We found that during 2000–2010, severe weather events
as the most frequent type of shock ( Fig. 3 ). Moreover, the frequency
f intentional attacks increased significantly since 2010, in addition to
he severe weather and climate impacts. Although the exact reason for
he increased frequency of the intentional attack since 2011 is unknown,
t is apparent that the power grid is becoming more vulnerable to cyber
nd physical attacks [74] .
286
Figs. 4 and 5 depict the impacts of various shocks to the U.S. electric
ystem. While severe weather-induced outages, and disruptions caused
y intentional attacks are the most frequent outage cause-codes, the in-
ensities of severe-weather induced outages are much higher than any
ther types of disruptions. From the historical trends in the last 16 years,
t is also observed that the years of 2008 and 2011 ranked highest in
erms of severe-weather impacts; with cumulative outage durations of
bout 8500 h, and over 23 million customers affected.
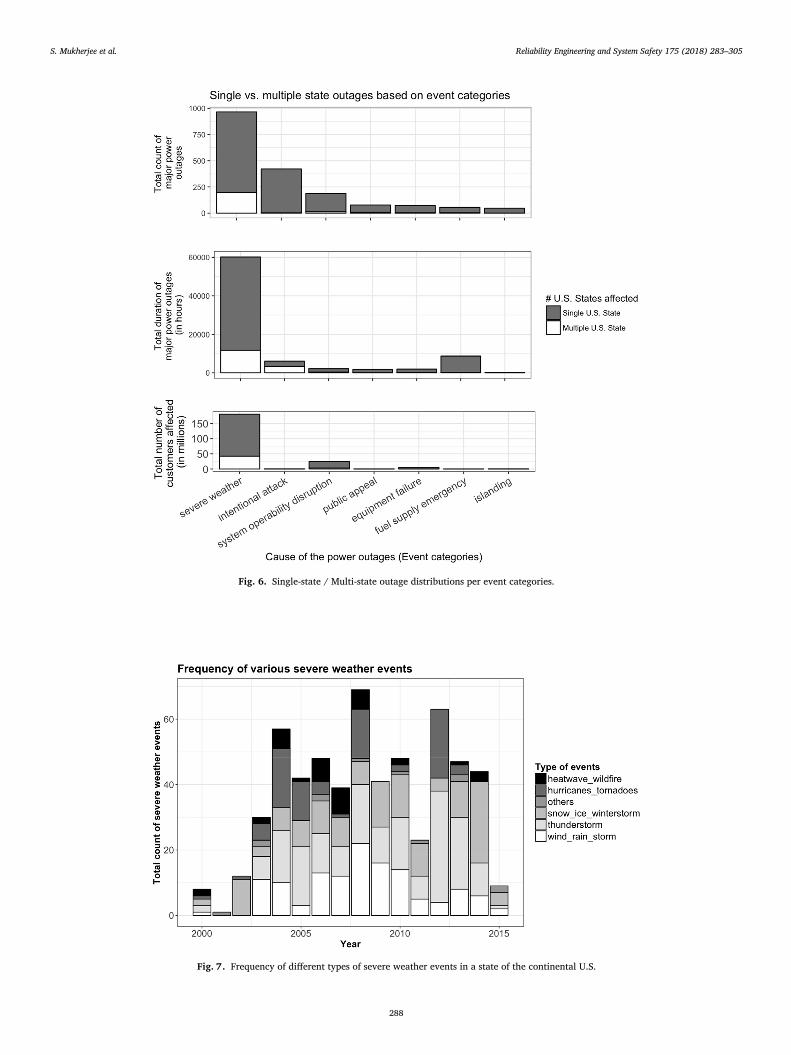
Fig. 6 shows the frequency of the outage events affecting a sin-
le state ( “single-state outages ”) or multiple states ( “multi-state out-
ges ”) in the continental U.S. during the event, and these outages
re categorized based on the different cause-codes discussed above. It
s observed that single state outages are much more prevalent than
he multi-state outages. More specifically, our analysis indicated that
7.5% of the total outage events affected a single state in the conti-
ental U.S., whereas only 12.5% outage events affected more than one
tate.

S. Mukherjee et al. Reliability Engineering and System Safety 175 (2018) 283–305
Fig. 4. Impact of major power outages in terms of prolonged outage durations.
Fig. 5. Impact of major power outages in terms of customer affected.
r
c
t
t
h
r
i
o
t
c
c
s
n
a
I
a
r
a
2
a
p
i
t
t
w
s
s
s
a
The different types of severe weather and climate events, as catego-
ized in this research, include: (i) Heatwaves and wildfires; (ii) hurri-
anes (including tropical storms) and tornadoes; (iii) snow, ice and win-
er storms; (iv) thunderstorms; and, (v) wind, rain and storms. While
ornados and hurricanes are meteorologically different phenomena, we
ave grouped them together because they both have extreme winds that
ender civil infrastructure vulnerable. While the lifecycle of tornados
s generally shorter than that of hurricanes, their strong winds could
utblow hurricane winds and both events could be equally destructive
o the electric power infrastructure systems. The “others ” category in-
ludes other extreme events such as earthquake, flooding, fog, and un-
ontrolled loss and public appeal to reduce the load in a severe weather
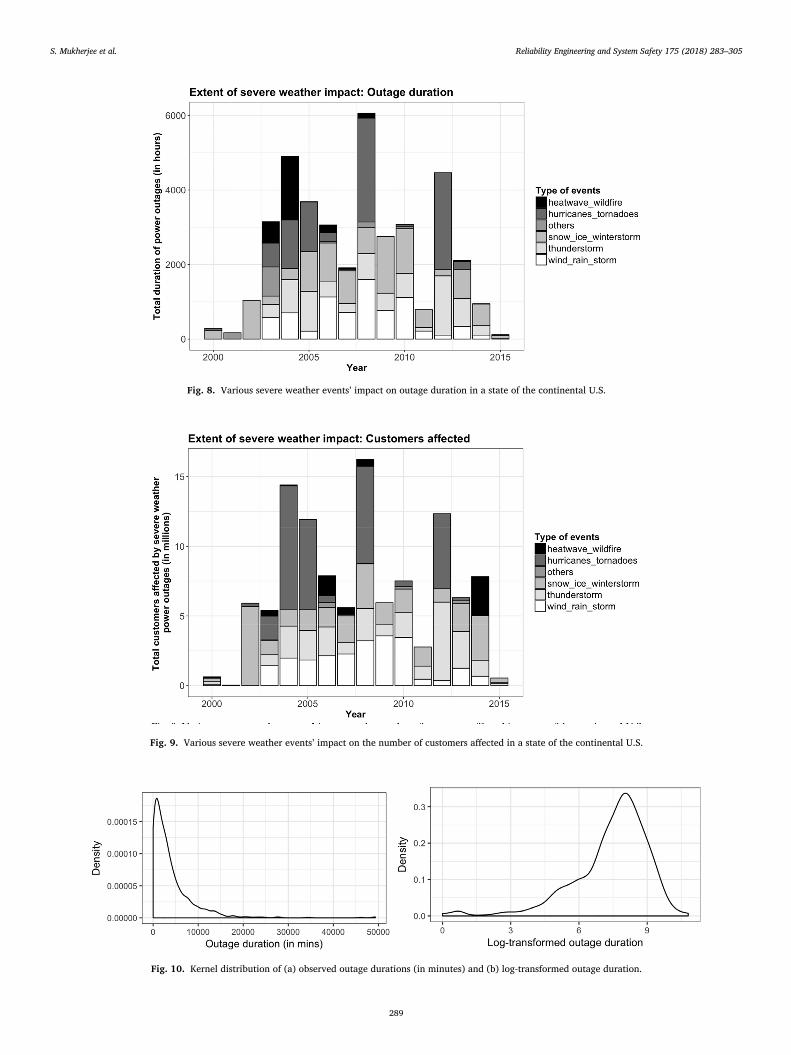
ituation. The frequency and intensity —in terms of outage duration and
umber of customers affected —in the face of various climatic shocks in
single state during 2000–2016 are depicted in Figs. 7–9 , respectively.
t can be observed from the distributions of the various severe weather
nd climate events that hurricanes / tornadoes, winter storms, wind /
h287
ain storms and thunderstorms are the most frequently occurring events,
nd their impacts vary across the years.
.3. Response variable normalization
Outage duration and the number of customers affected —identified
s “measures of outage intensity ”—are the response variables for our
roposed risk assessment. The total number of customers affected dur-
ng a disturbance was normalized using the state population as “cus-
omers affected per 100,000 population of the state ”. This normaliza-
ion procedure removed the size effect of the states. Separate models
ere developed for the above-mentioned outage metrics, using the same
et of predictor variables in both the cases. The distributions of the ob-
erved values of outage duration and the number of customers affected
how that the variables are heavy-tailed and right skewed ( Figs. 10 (a)
nd 11 (a), respectively). The observations in the extreme tails represent
igh-impact, low-probability events that severely impacted the electric
S. Mukherjee et al. Reliability Engineering and System Safety 175 (2018) 283–305
Fig. 6. Single-state / Multi-state outage distributions per event categories.
Fig. 7. Frequency of different types of severe weather events in a state of the continental U.S.
288
S. Mukherjee et al. Reliability Engineering and System Safety 175 (2018) 283–305
Fig. 8. Various severe weather events’ impact on outage duration in a state of the continental U.S.
Fig. 9. Various severe weather events’ impact on the number of customers affected in a state of the continental U.S.
Fig. 10. Kernel distribution of (a) observed outage durations (in minutes) and (b) log-transformed outage duration.
289

S. Mukherjee et al. Reliability Engineering and System Safety 175 (2018) 283–305
Fig. 11. Kernel distribution of (a) observed customers affected (per 100,000 population) and (b) log-transformed customers affected (per 100,000 population).
Table 2
Descriptive statistics (i.e., Mean, Median, Minimum (Min), Maximum (Max), Interquartile Range (IQR) and Standard Deviation (Std.Dev)) of
outage duration and customers affected in the historical power outage events occurred during 2000–2015.
Metrics to measure extent of power outages Extent of duration and customers affected from power outage events
occurred during 2000 —2015
Mean Median Min Max IQR Std. dev
Outage duration per event (minutes) 4042.0 2332.0 0 49,320.0 4440 5553.0
Log-transformed outage duration per event 7.4 7.8 0 10.8 2.0 1.7
Customers affected per 100,000 population 2750.0 1316.0 0 93,230.0 1764.8 6386.6
Log-transformed customers affected per 100,000 population 7.1 7.2 0 11.4 1.2 1.3
p
w
𝐿
v
a
a
l
f
2
(
U
p
h
i
p
T
o
3
s
t
t
t
o
v
f
(
o
m
o
f
R
t
m
s
c
3
d
t
l
fi
i
t
s
o
s
m
j
p
a
n
m
(
i
(
o
d
m
t
u
o
o
t
t
t
ower infrastructure. To reduce the skewness of the response variables,
e performed a log-transformation using the following equation:
𝑜𝑔 𝑡𝑟𝑎𝑛𝑠𝑓𝑜𝑟𝑚𝑒𝑑 𝑟𝑒𝑠𝑝𝑜𝑛𝑠𝑒 = log ( 𝑟𝑒𝑠𝑝𝑜𝑛𝑠𝑒 + 1 )
Figs. 10 (b) and 11 (b) show the normalized log-transformed response
ariables. Table 2 provides the descriptive statistics of the observed
nd log-transformed power outage durations and number of customers
ffected. The Pearson correlation coefficient between the normalized
og-transformed response variables —outage duration and customers af-
ected per 100,000 population in a state —is 0.2.
.4. Predictor variable selection and final dataset for analysis
The variables obtained from various publicly available data sources
as described in Table 1 ) were aggregated using year, month and the
.S. states as the nexus. Multicollinearity assessment was implemented
rior to model development. We selected one variable from each pair of
ighly correlated variables (Pearson correlation coefficient > 0.9). This
s because the presence of multicollinearity can mask the effect of the
redictor variables on the response, and may bias the inference [16] .
he list of final predictor variables is given in Table 3 . The description
f all the variables is provided in the Nomenclature section.
. Methodology
In this section, we delineate (i) the proposed approach to develop our
tate-level, multi-hazard, two-stage, hybrid, power outage risk estima-
ion models, and (ii) the theoretical underpinning of the methods used
o develop our models. Our rationale for proposing a hybrid support vec-
or machine–random forest (SVM–RF) predictive framework was based
n the hypothesis that the predictors of extreme outages (i.e., obser-
ations lying at the long tail of the outage distribution) would be dif-
erent from the predictors of the shorter, but more frequent outages
e.g., the 1st quantile of the outage distribution). Given our overarching
bjective of identifying the predictors of extreme outages, we imple-
ented a classification scheme to identify the points in the long tail
f the outage distribution before conducting the RF-based prediction
ramework. However, given the noisy nature of the data, training the
290
F prediction model to the entire data points in the third quantile of
he outage distribution may risk the generalization performance of the
odel and may lead to biased statistical inferences. Similar hybrid clas-
ification —regression frameworks have been leveraged before to model
limate-induced power outages in the U.S. [75] .
.1. Steps to develop the model
As mentioned earlier in the paper, the historical power outage
ata was collected, and merged with state-level climatic characteris-
ics, socio-economic information, electricity consumption patterns, and
and-use data. The collected data was then pre-processed (cleaned and
ltered) prior to the statistical analyses. Exploratory analysis of histor-
cal outage trends ( Fig. 6 ), led to confining the scope of our analysis of
he outage events that affected only a single state in the continental U.S.,
ince out of all the severe-weather induced outage events, only 12.5%
f the events were found to involve more than one state. Based on this
cope, the collected data was used to develop data-driven, hybrid risk
odels to estimate the intensity of power outages and to identify the ma-
or risk factors. The intensity of power outage is defined as the duration of
ower outage and / or number of customers affected (which were used
s response variables in our analysis). These response variables were
ormalized using the technique discussed in Section 2.3 .
The outage data was classified into three intervals: (a) Level I: nor-
al level or minor outages (all observations less than the 1st quartile);
b) Level II: moderate level (all observations in the interquartile range,
.e., between the 1st and 3rd quartiles); and, (c) Level III: extreme level
all observations above the 3rd quartile). The rationale for categorizing
utage intensity was primarily due to the heavy-tail distribution of the
ata. The outage intensities are power-law distributed, meaning that
inor outages are most frequent; and high impact disturbances (i.e.,
he extreme tail of outage data) are rarer [68] . The risk factors, and
nderlying failure mechanisms associated with each of the quartiles of
utage intensities could be substantially different. We, therefore, devel-
ped separate risk models for each of the outage levels. However, since
he high impact low probability (HILP) outages are most devastating (in
erms of societal losses), in this paper, we focused primarily on assessing
he risks associated with extreme outages (i.e. Level III outages).

S. Mukherjee et al. Reliability Engineering and System Safety 175 (2018) 283–305
Table 3
Final set of predictor variables used to develop the models.
# Information type Predictor variables
1 Climate and severe weather information (1) Climate_region (CR)
(2) Climate_category
(3) Severe_weather_category
2 Electricity consumption information (1) Total_electricity_consumption
(2) Electricity_price
(3) PCT_Residential_consumption
(4) PCT_Commercial_consumption
(5) PCT_Industrial_consumption
3 Customers served (yearly) (1) Total_customers
(2) PCT_Residential_customers
(3) PCT_Commercial_customers
(4) PCT_Industrial_customers
4 Economic characteristics (yearly) (1) PC_real_GDP_US
(2) PC_real_GSP_rel
(3) PC_real_GSPchange
(4) Utility_contribution_to_GSP
5 Population and areas in urban and rural regions, as of 2010 (1) PCT_Population_Urban
(2) PCT_Population_Urban_cluster
(3) Population_density_Urban
(4) Population_density_Urban_cluster
(5) Population_density_Rural
6 Land and water mass information, as of 2010 (1) PCT_Land_area_Urban
(2) PCT_Land_area_Urban_cluster
(3) PCT_Land_area_state.level
(4) PCT_Inland_water_area_state.level
v
b
s
a
r
e
p
a
n
3
a
v
t
v
c
a
b
o
a
i
f
3
u
t
t
a
s
i
h
i
l
a
f
l
o
s
n
t
n
o
t
v
t
c
p
s
[
m
a
3
[
t
m
a
𝑓
2 Low-bias high variance techniques refer to those that can capture the struc-
ture of the data really well (low bias), but are highly sensitive to outliers (high
variance) [93]
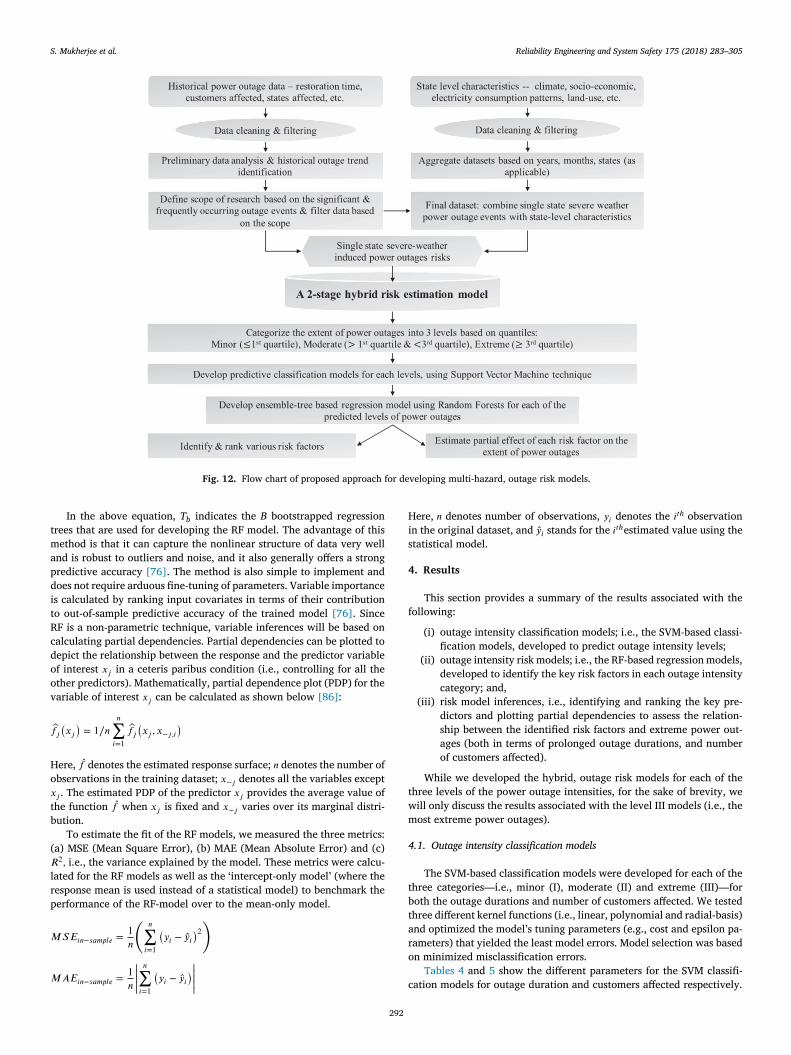
The flowchart in Fig. 12 summarizes our proposed approach for de-
eloping multi-hazard, outage risk models. We propose a two-stage, hy-
rid methodology to estimate outage risks as follows: (i) Develop a clas-
ification model —using support vector machines (SVM) —to predict out-
ge levels, and (ii) develop separate predictive risk models —using the
andom forest (RF) algorithm —for each class, in order to assess the influ-
nce of the key risk factors on outage intensities. The proposed two-stage
redictive algorithm is a robust classification-regression framework that
llows for assessing outage intensity risks due to various hazards in a
on-deterministic, and generalized fashion.
.2. Statistical learning techniques
Supervised learning technique, in essence, is a multivariate function
pproximation [76–78] . More specifically, the main objective of super-
ised learning is to estimate an unknown function 𝑓 that best predicts
he variable of interest 𝑌 (e.g., outage intensity), using a 𝑝 -dimensional
ector of relevant inputs 𝑋 (e.g., economic, climatic and geographic
haracteristics) such that: 𝑌 = 𝑓 ( 𝑥 ) + 𝑒 where e is irreducible error. The
lgorithm that can best approximate the unknown function is selected
ased on minimizing a loss function 𝐿 that measures the deviation of
bserved from the predicted values of 𝑌 . In this section, we provide
brief overview of the supervised learning techniques that were used
n this research, namely, support vector machines (SVM), and random
orest (RF).
.2.1. Support vector machines (SVM)
SVM is a sophisticated machine learning algorithm that is very pop-
lar in pattern recognition [77,79] . SVMs are remarkably robust in
he cases of sparse and noisy data with many outliers; and can be
rained with both simple and highly complex labeled data [79,80] . In
𝑝 -dimensional space, SVM uses an affine subspace of 𝑝 − 1 dimen-ion —termed as hyper-plane —to classify the feature space by maximiz-
ng the distance between the nearest training data of any class to the
yper-plane (boundary); the larger the margin, the lower the general-
291
zation error. This methodology can accommodate both linear and non-
inear boundaries between the classes. In case of non-linear data bound-
ry, they algorithm leverages a kernel approach to extend the non-linear
eature space to higher dimensions using specific kernel functions [76] .
The generalization performance of the SVM algorithm hinges on se-
ecting the optimal tuning parameters such as complexity cost (to avoid
verfitting), and the type of kernel function (e.g., polynomial, Gaus-
ian, radial, and exponential basis functions) to construct appropriate
on-linear boundaries between different class labels [81] . We selected
he optimal tuning parameters and the type of kernel function for the fi-
al SVM model using a bootstrapping method with resampling. Each
f the three separate SVM models developed using the kernel func-
ions —linear, polynomial and radial basis functions —was trained with
arious combinations of cost complexity parameters. For each of these
ypes of SVM models, we selected the cost complexity parameters. We
hose the final model with the least misclassification error. SVM is a
owerful classification technique and has been used in different fields
uch as text classification, gene selection for cancer classification, etc.
82–84] . To assess model performance, we used a confusion matrix to
easure how well the SVM classification models predict different out-
ge intensity levels.
.2.2. Random forest
RF is a non-parametric, tree-based, ensemble data mining algorithm
85] . Unlike the single regression trees that are low-bias high-variance
echniques, 2 RF overcomes the issue of high variance by leveraging
odel averaging as a variance reduction technique. The final estimate of
Random Forest method is the average of predictions across all trees:
𝐵 𝑟𝑓 ( 𝑥 ) =
1 𝐵
𝐵 ∑𝑏 =1
𝑇 𝑏 ( 𝑥 )
S. Mukherjee et al. Reliability Engineering and System Safety 175 (2018) 283–305
Fig. 12. Flow chart of proposed approach for developing multi-hazard, outage risk models.
t
m
a
p
d
i
t
R
c
d
o
o
v
𝑓
H
o
𝑥
t
b
(
𝑅
l
r
p
𝑀
𝑀
H
i
s
4
f
t
w
m
4
t
b
t
a
r
o
c
In the above equation, T b indicates the B bootstrapped regression
rees that are used for developing the RF model. The advantage of this
ethod is that it can capture the nonlinear structure of data very well
nd is robust to outliers and noise, and it also generally offers a strong
redictive accuracy [76] . The method is also simple to implement and
oes not require arduous fine-tuning of parameters. Variable importance
s calculated by ranking input covariates in terms of their contribution
o out-of-sample predictive accuracy of the trained model [76] . Since
F is a non-parametric technique, variable inferences will be based on
alculating partial dependencies. Partial dependencies can be plotted to
epict the relationship between the response and the predictor variable
f interest 𝑥 𝑗 in a ceteris paribus condition (i.e., controlling for all the
ther predictors). Mathematically, partial dependence plot (PDP) for the
ariable of interest 𝑥 𝑗 can be calculated as shown below [86] :
𝑗
(𝑥 𝑗 )= 1∕ 𝑛
𝑛 ∑𝑖 =1
𝑓 𝑗 (𝑥 𝑗 , 𝑥 − 𝑗,𝑖
)ere, 𝑓 denotes the estimated response surface; 𝑛 denotes the number of
bservations in the training dataset; 𝑥 − 𝑗 denotes all the variables except
𝑗 . The estimated PDP of the predictor 𝑥 𝑗 provides the average value of
he function 𝑓 when 𝑥 𝑗 is fixed and 𝑥 − 𝑗 varies over its marginal distri-
ution.
To estimate the fit of the RF models, we measured the three metrics:
a) MSE (Mean Square Error), (b) MAE (Mean Absolute Error) and (c)
2 , i.e., the variance explained by the model. These metrics were calcu-
ated for the RF models as well as the ‘intercept-only model’ (where the
esponse mean is used instead of a statistical model) to benchmark the
erformance of the RF-model over to the mean-only model.
𝑆 𝐸 𝑖𝑛 − 𝑠𝑎𝑚𝑝𝑙𝑒 =
1 𝑛
(
𝑛 ∑𝑖 =1
(𝑦 𝑖 − �� 𝑖
)2 )
𝐴 𝐸 𝑖𝑛 − 𝑠𝑎𝑚𝑝𝑙𝑒 =
1 𝑛
|||||𝑛 ∑𝑖 =1
(𝑦 𝑖 − �� 𝑖
)|||||
292ere, 𝑛 denotes number of observations, 𝑦 𝑖 denotes the 𝑖 𝑡ℎ observation
n the original dataset, and �� 𝑖 stands for the 𝑖 𝑡ℎ estimated value using the
tatistical model.
. Results
This section provides a summary of the results associated with the
ollowing:
(i) outage intensity classification models; i.e., the SVM-based classi-
fication models, developed to predict outage intensity levels;
(ii) outage intensity risk models; i.e., the RF-based regression models,
developed to identify the key risk factors in each outage intensity
category; and,
(iii) risk model inferences, i.e., identifying and ranking the key pre-
dictors and plotting partial dependencies to assess the relation-
ship between the identified risk factors and extreme power out-
ages (both in terms of prolonged outage durations, and number
of customers affected).
While we developed the hybrid, outage risk models for each of the
hree levels of the power outage intensities, for the sake of brevity, we
ill only discuss the results associated with the level III models (i.e., the
ost extreme power outages).
.1. Outage intensity classification models
The SVM-based classification models were developed for each of the
hree categories —i.e., minor (I), moderate (II) and extreme (III) —for
oth the outage durations and number of customers affected. We tested
hree different kernel functions (i.e., linear, polynomial and radial-basis)
nd optimized the model’s tuning parameters (e.g., cost and epsilon pa-
ameters) that yielded the least model errors. Model selection was based
n minimized misclassification errors.
Tables 4 and 5 show the different parameters for the SVM classifi-
ation models for outage duration and customers affected respectively.

S. Mukherjee et al. Reliability Engineering and System Safety 175 (2018) 283–305
Table 4
Selection of SVM-Classification model for predicting defined levels of outage duration.
Type of kernels Cost complexity parameters Confusion matrix
Linear Cost = 5
Polynomial Cost = 5, degree = 2
Radial Cost = 1, gamma = 6
Table 5
Selection of SVM-Classification model for predicting defined levels of customers af-
fected.
Type of Kernels Cost Complexity parameters Confusion matrix
Linear Cost = 0.01
Polynomial Cost = 0.01, degree = 2
Radial Cost = 1, gamma = 0.1
T
e
m
m
(
E
a
B
t
p
4
m
t
i
o
t
d
a
e
m
e
p
s
a
M
3 The ‘Null’ model uses the mean of the response variable instead of a statis-
tical model and is a common benchmark used in statistics to identify the power
of the statistical model in explaining the variance of the response.
he ‘cost complexity parameters’ refer to the optimum tuning param-
ters, which render the lowest misclassification error. The confusion
atrices summarize fit of the models. The columns in each confusion
atrix represent the actual number of observations in each category
i.e., Levels I, II or III), while the rows represent the predicted levels.
vidently, the model with the highest number of observations in the di-
gonal of the confusion matrix is the most accurate classification model.
ased on the results summarized in Tables 4 and 5 below, we selected
he SVM-classification models with radial kernel function since they out-
erformed all others in classifying the intensity of power outages.
.2. Outage-intensity risk models
We developed the two-stage, risk models by first training the RF-
odels with predicted outage levels, and then retraining the models af-
er removing the extreme outliers from the dataset. It was observed that
n all the instances the outliers were either misclassified cases or extreme
293
bservations. The outlier removal stage is primarily due to the noisy na-
ure of the data; and will likely be a redundant step if higher quality
ata from outage management systems (OMS) of utility companies are
vailable. Tables 6 and 7 show the performance of the RF-based risk
stimation models, in terms of: (i) Percentage variance explained by the
odel ( R 2 ), (ii) root mean square error (RMSE), and (iii) mean absolute
rror (MAE). As expected, removing the outliers improved the model
erformance. Moreover, it can be observed that the RF-based models
ignificantly outperform the mean-only (aka ‘null’ 3 ) models both before
nd after outlier removal.
The final RF-risk estimation model for the outage duration ( Table 6 ,
odel 2) captures 77.5% of the variance in the data, and offers an im-

S. Mukherjee et al. Reliability Engineering and System Safety 175 (2018) 283–305
Table 6
Extreme-level outage duration (OD) model: comparison of RF-Regression model vs. mean-only
model.
Model RF-models for OD Parameters R 2 RMSE MAE
1 RF ntrees a = 75 0.58 0.44 0.26
Null NA NA 0.67 0.46
% RF performance improvement over the Null model 35.3% 43.8%
2 RF (removing outliers) ntrees = 75 0.77 0.26 0.10
Null NA NA 0.55 0.42
% RF performance improvement over the Null model 52.5% 54.4%
a This parameter refers to the number of trees to grow . This should not be set to too small a
number, to ensure that every input row gets predicted at least a few times. In our research, we
selected the value of the 𝑛𝑡𝑟𝑒𝑒 that yielded the least out-of-sample mean square error ( 𝑚𝑠𝑒 ) while
growing the trees [16] .
Table 7
Extreme level customers affected model: Comparison of RF-Regression model vs. mean-only
model.
Model RF-models for CA Parameters R 2 RMSE MAE
1 RF ntrees = 81 0.63 0.66 0.42
Null NA NA 1.09 0.70
% RF performance improvement over the Null model 39.5% 39.9%
2 RF (removing outliers) ntrees = 81 0.71 0.33 0.25
Null NA NA 0.62 0.55
% RF performance improvement over the Null model 46.4% 53.8%
Pearson correlation coefficient: “Fitted & Observed demand” = 0.90
Fig. 13. Extreme level of outage duration RF Model: (a) QQ-plot (the red dashed lines in the QQ-plot represent 95% confidence intervals) and (b) Fitted values vs.
observed values. (For interpretation of the color code in this figure legend, the reader is referred to the web version of this article.)
p
o
g
b
t
t
a
r
o
d
R
v
s
t
a
l
t
c
t
4
p
a
r
o
o
t
p
t
s
roved performance of 52.5% (in terms of RMSE) and 54.4% (in terms
f MAE) as compared to the ‘Null’ model.
Similarly, for the customers affected model, the final RF-based re-
ression model captures 71.3% of the variance and reduces model error
y 46.4% (in terms of RMSE) and 53.8% (in terms of MAE), as compared
o the corresponding Null model.
Figs. 13 and 14 show diagnostics for the final outage risk estima-
ion models (for both outage duration, and the number of customers
ffected). Normal quantiles or QQ plot ( Fig. 13 (a)) for the outage du-
ation risk model show that the residuals fall along the 45-degree line
f the normal quantile plot and the data lies well within the 95% confi-
ence intervals (shown by the red dotted lines). This indicates that the
F model captures the variability in the data well. Moreover, the high
alue of Pearson correlation coefficient between the fitted and the ob-
erved values ( 𝜌 = 0 . 90 ) indicate that the outage duration risk model fitshe data well ( Fig. 13 (b)).
Similarly, the corresponding QQ-plot ( Fig. 14 (a)) of the customers
ffected RF model also show that the residuals fall along the 45-degree
294
ine of the normal quantile plot, indicating that the RF model in captures
he variability in the data well. The higher Pearson correlation coeffi-
ient between the fitted and the observed values ( 𝜌 = 0 . 86 ) indicate thathe selected RF model fits the data reasonably well ( Fig. 14 (b)).
.3. Identification and ranking of the risk factors associated with extreme
ower outages
The top five predictors for each of the three levels of outage durations
nd customers affected risk models are summarized in Tables 8 and 9 ,
espectively. For the sake of brevity as well as since extreme outages are
f more significance in terms of resilience enhancement, we will focus
ur discussion on the extreme outage level risks (Level-III).
In this section, we will discuss the ranking of various risk factors, and
he partial dependencies between the key risk factors and most extreme
ower outages. The ranking of the key predictors is primarily based on
he degree of the contribution of each of the covariates to the out-of-
ample performance of the risk models. It can be seen from Tables 8 and

S. Mukherjee et al. Reliability Engineering and System Safety 175 (2018) 283–305
Pearson correlation coefficient: “Fitted & Observed demand” = 0.86
Fig. 14. Extreme level of customers affected RF Model: (a) QQ-plot (the red dashed lines in the QQ-plot represent 95% confidence intervals) and (b) Fitted values
vs. observed values. (For interpretation of the color code in this figure legend, the reader is referred to the web version of this article.)
Table 8
Top five risk factors identified in each of the three levels of outage duration for outage duration (OD).
# Normal OD (Level I) Moderate OD (Level II) Extreme OD (Level III)
1 PCT_Commercial_consumption Climate_region (CR) Severe_weather_category
2 Electricity_price Total_electricity_consumption PCT_Land_area_state.level
3 PC_real_GSP_rel Total_customers Utility_contribution_to_GSP
4 PCT_Land_area_Urban Electricity_price Population_density_Rural
5 PCT_Industrial_customers PC_real_GSP_rel PCT_Commercial_consumption
Table 9
Top five risk factors identified in each of the three levels of customers affected for customers affected (CA).
# Normal CA (Level I) Moderate CA (Level II) Extreme CA (Level III)
1 Total_customers Total_electricity_consumption Total_customers
2 Electricity_price Utility_contribution_to_GSP Electricity_price
3 PCT_Residential_consumption Total_customers Total_electricity_consumption
4 PCT_Commercial_consumption PCT_Commercial_customers PC_real_GSP_rel
5 PCT_Residential_customers PCT_Industrial_consumption PCT_Land_area_state.level
9
o
o
a
p
e
s
p
n
d
d
s
c
r
a
t
c
a
9
y
t
a
p
t
U
4
e
t
i
r
o
w
4
t
i
f
o
h
t
t
h
F
w
c
that there is very little overlap between the key risk factors in each
utage intensity category, supporting our rationale for sub-categorizing
utage durations and number of customers affected into different levels.
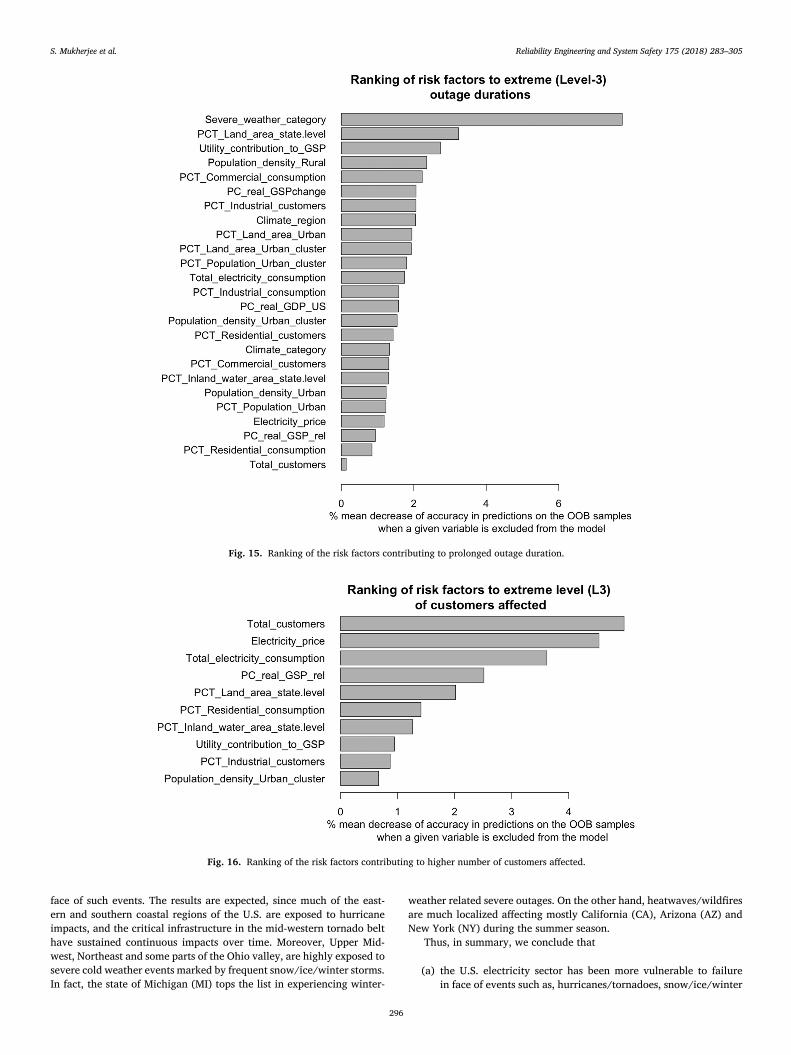
The ranking of the important risk factors influencing prolonged out-
ges or significant number of customers affected as results of the extreme
ower outages are given in Figs. 15 and 16 , respectively. As mentioned
arlier, the variable ranking is based on the mean decrease in out-of-
ample prediction accuracy [77] .
It can be seen from Figs. 15 and 16 that the top five risk factors for
rolonged outages are considerably different from that of the significant
umber of customers affected. We found that prolonged outages are pre-
ominantly influenced by the types of severe weather events, while the
ensity of customers (including residential, commercial and industrial)
erved by the utilities is a key predictor of the significant numbers of
ustomers affected.
The partial dependencies between the key risk factors and the du-
ation of prolonged outages and the number of customers affected
re explained in the following Sections 4.4 and 4.5 , respectively. In
he partial dependence plots (PDPs) as described before, the black
urve represents the average marginal effect of the predictor vari-
ble of interest on the response; and the red curves represent the
5% credible intervals . It must be noted that in these plots, the
-axes do not represent the actual range of response variables . Instead,
hey represent the average change in the value of the response variable
s the predictor variable of interest is perturbed (while all the other in-
uts are accounted for). The PDPs also indicate the climate regions (CR),
295
he North American Electric Reliability Corporations (NERC) and the
.S. states that show distinct and similar patterns in the outage trends.
.4. Risk factors contributing to higher probability of prolonged duration of
xtreme outages
The partial dependencies of the top five predictors associated with
he prolonged outage durations as experienced by the states of the U.S.
n the face of severe weather events, are described in this section. The
esponse variable here is the log-transformed value of the prolonged
utage duration as experienced by the U.S. states during of the severe
eather induced power outages.
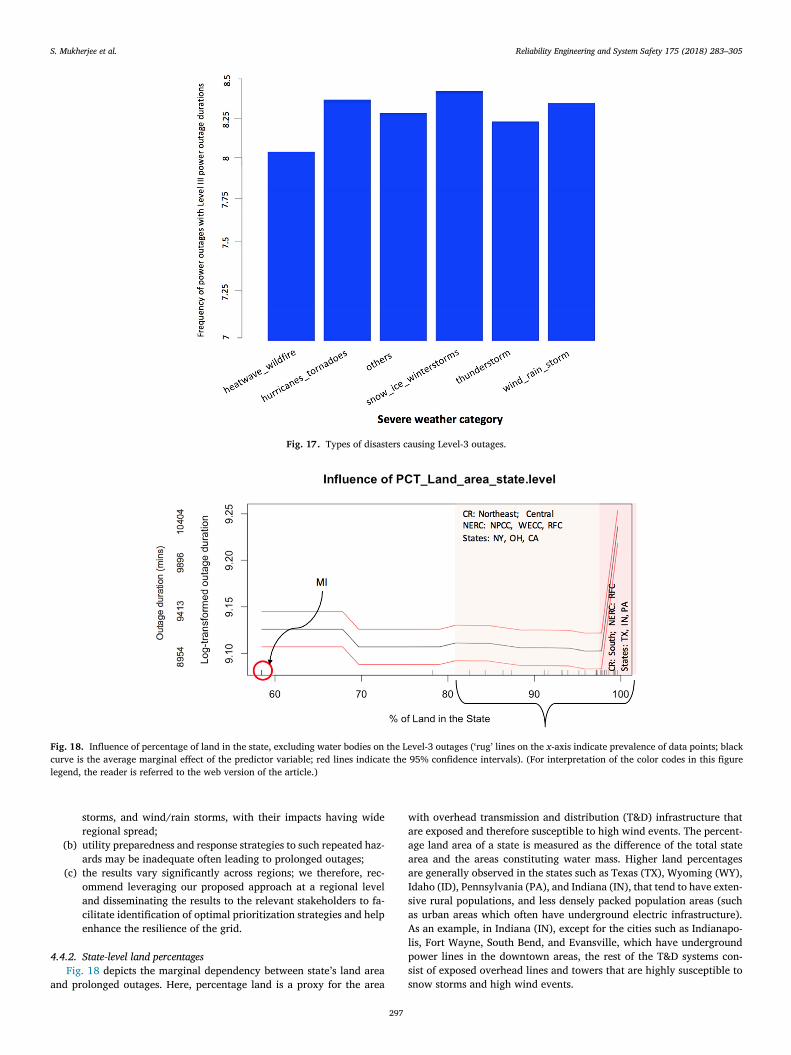
.4.1. Types of severe-weather events
The types of severe-weather events have significant implication for
he level of impacts on the electric power grid. The U.S. electric power
nfrastructure systems are robust to varying degrees in the face of dif-
erent types of hazard (primarily due to the specific design parameters
f the transmission and distribution infrastructure). Moreover, utilities
ave varying protocols for preparedness and response, depending on
he type of the hazard and the geographic location of the infrastruc-
ure. Higher frequency of prolonged outages under a particular type of
azard event indicates grid vulnerability to that specific type of event.
ig. 17 shows that hurricanes/tornadoes, snow/ice/winter storms and
ind/rain storms are the most frequently occurring disasters that have
aused sustained outages, indicating grid’s vulnerability to failure in
S. Mukherjee et al. Reliability Engineering and System Safety 175 (2018) 283–305
Fig. 15. Ranking of the risk factors contributing to prolonged outage duration.
Fig. 16. Ranking of the risk factors contributing to higher number of customers affected.
f
e
i
h
w
s
I
w
a
N
ace of such events. The results are expected, since much of the east-
rn and southern coastal regions of the U.S. are exposed to hurricane
mpacts, and the critical infrastructure in the mid-western tornado belt
ave sustained continuous impacts over time. Moreover, Upper Mid-
est, Northeast and some parts of the Ohio valley, are highly exposed to
evere cold weather events marked by frequent snow/ice/winter storms.
n fact, the state of Michigan (MI) tops the list in experiencing winter-
296
eather related severe outages. On the other hand, heatwaves/wildfires
re much localized affecting mostly California (CA), Arizona (AZ) and
ew York (NY) during the summer season.
Thus, in summary, we conclude that
(a) the U.S. electricity sector has been more vulnerable to failure
in face of events such as, hurricanes/tornadoes, snow/ice/winter
S. Mukherjee et al. Reliability Engineering and System Safety 175 (2018) 283–305
Fig. 17. Types of disasters causing Level-3 outages.
Fig. 18. Influence of percentage of land in the state, excluding water bodies on the Level-3 outages (‘rug’ lines on the x -axis indicate prevalence of data points; black
curve is the average marginal effect of the predictor variable; red lines indicate the 95% confidence intervals). (For interpretation of the color codes in this figure
legend, the reader is referred to the web version of the article.)
4
a
w
a
a
a
a
I
s
a
A
l
p
s
s
storms, and wind/rain storms, with their impacts having wide
regional spread;
(b) utility preparedness and response strategies to such repeated haz-
ards may be inadequate often leading to prolonged outages;
(c) the results vary significantly across regions; we therefore, rec-
ommend leveraging our proposed approach at a regional level
and disseminating the results to the relevant stakeholders to fa-
cilitate identification of optimal prioritization strategies and help
enhance the resilience of the grid.
.4.2. State-level land percentages
Fig. 18 depicts the marginal dependency between state’s land area
nd prolonged outages. Here, percentage land is a proxy for the area
297
ith overhead transmission and distribution (T&D) infrastructure that
re exposed and therefore susceptible to high wind events. The percent-
ge land area of a state is measured as the difference of the total state
rea and the areas constituting water mass. Higher land percentages
re generally observed in the states such as Texas (TX), Wyoming (WY),
daho (ID), Pennsylvania (PA), and Indiana (IN), that tend to have exten-
ive rural populations, and less densely packed population areas (such
s urban areas which often have underground electric infrastructure).
s an example, in Indiana (IN), except for the cities such as Indianapo-
is, Fort Wayne, South Bend, and Evansville, which have underground
ower lines in the downtown areas, the rest of the T&D systems con-
ist of exposed overhead lines and towers that are highly susceptible to
now storms and high wind events.

S. Mukherjee et al. Reliability Engineering and System Safety 175 (2018) 283–305
Fig. 19. Influence of % total state GSP as contributed by the utility sector on the Level-3 outages (rug lines on the x -axis indicate prevalence of data points; black
curve is the average marginal effect of the predictor variable; red lines indicate the 95% confidence intervals). (For interpretation of the color codes in this figure
legend, the reader is referred to the web version of the article.)
p
s
1
m
o
N
c
w
t
r
a
c
t
i
c
7
2
[
i
a
h
s
d
s
m
p
4
m
i
t
r
d
(
d
d
n
t
c
p
s
d
a
w
w
o
t
a
s
p
p
m
z
r
i
A
g
i
o
l
4 Low economically active zone: The states belonging to this zone have the
utility sectors contributing less than 2.1% of the total state GSP that indicates
all the values below the 3 rd quartile of the utility sector’s contribution 5 Moderate economically active zone: The states with utility sectors’ contri-
bution varying between 2.1% to 2.5% of the total state GSP 6 High economically active zone: The states with utility sectors’ contribution
above 2.5% of the total state GSP
Analyzing the data-rich region of Fig. 18 (as indicated by the
resence of denser data lines on the x -axis), we found that larger
tates with land percentages between 84.3%–97.2% (i.e., % 𝑜𝑓 𝑙𝑎𝑛𝑑 ≥
𝑠𝑡 𝑞𝑢𝑎𝑟𝑡𝑖𝑙𝑒 & % 𝑜𝑓 𝑙𝑎𝑛𝑑 ≤ 3 𝑟𝑑 𝑞𝑢𝑎𝑟𝑡𝑖𝑙𝑒 ), show negligible variation in
arginal effect. This indicates that states falling within this range
bserve similar levels of prolonged outage durations. States such as
ew York (NY), Ohio (OH), and California (CA) —that fall in this
ategory —frequently experience prolonged outages, primarily due to
ind/rain storms followed by snow/ice/winter-storms. Interestingly,
he rug-line in Fig. 18 which depicts the state with % 𝑜𝑓 𝑙𝑎𝑛𝑑 < 60% ,
epresents the state of Michigan (MI) that has experienced —on aver-
ge —longer sustained outages compared to all other states with per-
entage land area below the 3rd quantile, with thunderstorm and win-
er storms being the most frequently occurring disasters. This result is
n line with the recently published report by Climate Central which also
oncluded that Michigan (MI) ranked top of all the states in the U.S. with
1 major weather-related power outages during the period of 2003 and
012, affecting at least 800,000 customers each year during that period
20] .
The states with % 𝑜𝑓 𝑙𝑎𝑛𝑑 > 3 𝑟𝑑 𝑞𝑢𝑎𝑟𝑡𝑖𝑙𝑒 exhibit a steep increas-ng slope in the marginal effect of land percentage on prolonged out-
ge duration. In other words, more exposed overhead lines indicate
igher grid’s vulnerability to failures. We found that Texas (TX), Penn-
ylvania (PA) and Indiana (IN) experienced such prolonged outage
urations more frequently compared to the other states; and, that
now/ice/winter-storms followed by hurricanes/tornadoes were the
ost frequent events causing these extreme outages.
Thus, by the construct of our proxy predictor and its effect on the
rolonged outages, we summarize our findings as follows:
(a) Higher extents of overhead T&D systems are associated with
prolonged outages as they are more exposed to high-wind
and heavy-precipitation events such as hurricanes/tornadoes,
snow/ice/winter-storms or wind/rainstorms;
(b) Cascading outages are more prevalent in states with lower ur-
ban population and higher expanse of sparsely populated (rural)
areas.
.4.3. Utility sector’s contribution towards the state GSP
The utility sector’s contribution towards gross state product (GSP),
easured in terms of percentage of gross economic output of the state,
ndicates how economically active the state’s utility sector is compared
298
o the other economic sectors . The utility sectors’ economic activity is
eported to the Bureau of Economic Analysis (BEA) when (a) they pro-
uce more amounts of end products that is used for economic activities
e.g., generate more electricity) or (b) they invest more in capital expen-
itures such as building new infrastructure, expanding generation and
istribution capacities, etc. Higher percentages of utility sector’s eco-
omic contribution, therefore, helps identify states with (i) higher elec-
ricity generation —perhaps to serve their electricity-intensive industrial
ustomer base —and/or (ii) higher expenditure on capital investment
rojects in the electricity sector.
The marginal relationship between utility sector’s contribution to the
tate’s gross economic output and prolonged outages ( Fig. 19 ) shows a
istinct step-function change across three regions. However, on aver-
ge, we observe an increasing trend in the prolonged outage duration
ith increased of economic activity in the utility sector. We observe that
hen the utility sectors’ contribution towards the GSP is less than 2.1%
f the total state GSP 4 , the marginal effect of the prolonged outage dura-
ion shows a gradual increasing trend. New Jersey (NJ), New York (NY)
nd Michigan (MI) lying in this region get most frequently affected by
now/ice/winter-storms followed by hurricanes/tornadoes and have ex-
erienced sustained outage duration. The middle zone 5 shows a sharp
eak followed by a small dip in the outage duration after which, the
arginal effect of the predictor variable is almost constant in the third
one 6 . The sharp peak in the moderate economically active zone mostly
efers to the extreme outages caused by hurricanes/tornadoes affect-
ng the states, such as Texas (TX), Louisiana (LA), Arizona (AZ) and
rkansas (AR). It is to be noted that Texas (TX) appears in both the re-
ions of the “moderate economically active zone ” and the “high econom-
cally active zone ” because its utility sector’s contribution has changed
ver the period of the analysis.
Based on our conversations with a few energy professionals at pub-
ic utility commissions, we have several hypotheses for the positive as-

S. Mukherjee et al. Reliability Engineering and System Safety 175 (2018) 283–305
Fig. 20. Influence of population density in the rural areas on the Level-3 outages (rug lines on the x -axis indicate prevalence of data points; black curve is the average
marginal effect of the predictor variable; red lines indicate the 95% confidence intervals). (For interpretation of the color codes in this figure legend, the reader is
referred to the web version of the article.)
s
c
4
l
fi
i
s
r
u
t
[
u
(
U
l
t
i
d
t
s
s
[
s
1
e
o
t
i
i
c
t
p
t
i
m
s
t
t
W
m
(
Y
p
s
i
e
b
a
e
(
(
(
the rural areas.
ociation between outage durations and percent increase in economic
ontribution, as summarized below:
(a) The ‘economically active’ utilities invest more on capital-
intensive projects such as building new infrastructure, and may
cut investments for regular maintenance and operational activi-
ties such as tree-trimming or maintenance of the existing trans-
former and other critical equipment. Such investment decisions
could render the infrastructure vulnerable in the face of severe
weather events.
(b) The positive association could also be attributed to the fact that
despite the costs of infrastructure damage during severe-weather
impacts, the post-disaster reconstruction generally leads to a tem-
porary economic boom (for instance due to hiring labor for re-
construction, building new infrastructure, replacing the old in-
frastructure, etc.) [87,88] .
.4.4. Population density of the rural areas (persons per square mile)
The rural area refers to the census regions that encompass all popu-
ation, housing, and territory not included within an urban area , as de-
ned by the U.S. Census Bureau [75] . The urban area on the other hand
s defined by the U.S. Census Bureau as “densely settled core of cen-
us tracts and/or census blocks that meet minimum population density
equirements, along with adjacent territory containing non-residential
rban land uses as well as territory with low population density included
o link outlying densely settled territory with the densely settled core ”
75] . As of 2010, for a census area to be designated as urban area or
rban cluster, the following criteria has to be met: (a) Urbanized Areas
UAs) are designated as regions with 50,000 or more people; and (b)
rban Clusters (UCs) are designated as regions with at least 2500 and
ess than 50,000 people [75] .
Rural population density was found to be a more important predic-
or than urban population density (refer to the Variable Importance Plot
n Fig. 15 ). This variable serves as a proxy for the topology of power
istribution infrastructure in rural regions. Urban areas’ electricity dis-
ribution system design is mostly characterized by networked or meshed
ystems, while rural areas tend to be mostly based on radial distribution
ystems that tend to be more prone to failure during any disaster impact
89] . The partial dependence plot of the rural population density clearly
hows a step function, as observed from Fig. 20 .
The regions with population density of lower than the threshold of
0 persons per square mile where among the most heavily impacted,
xperiencing prolonged outage durations. A detailed analysis of these
299
bservations revealed that these observations included the severe win-
er storms in 2005 and 2007 in Kansas (KS), and the massive wildfire
n July 2004 in Arkansas (AR). In fact, the 2007 winter storm, mostly
n the form of freezing rains, caused phenomenal damage to the electri-
al infrastructure that was estimated at $136.2 million, rendering this
he costliest ice storm in Kansas history. It damaged around 2000 power
oles, 7900 spans of conductor and required re-fusing of 5,400 lines and
ransformers [90] . The 2005 power outage was also attributed to freez-
ng rain and deposition of slits of ice on the power lines. In this event,
any towns experienced widespread and prolonged multiple outages
ome of which even lasted for 1 1 2 to 2 weeks [90] .
However, in the region with rural population density above the
hreshold of 10 persons per square mile, the marginal effect implies
hat, on average , the sustained outage durations are similar across states.
hile, the average sustained outage duration is similar across all states,
ore densely populated rural areas experience longer outage duration
close to the top red line in Fig. 20 ). Texas (TX), New Jersey (NJ), New
ork (NY) are the top three states which frequently experienced such
rolonged outage durations, mostly in face of the severe weather events
uch as hurricanes/tornadoes followed by snow/ice/winter-storms. Res-
dential customers mostly dominate population density in the rural ar-
as and thus one of the major reasons for these higher outages might
e inadequate tree trimming in these regions. Tree trimming is costly,
nd its frequent implementation in sparsely populated rural areas is not
conomically justifiable.
In summary, we conclude from Fig. 20 that
a) In general, rural areas tend to receive less attention from the utility
companies in terms of hardening the electric infrastructure or in-
vesting in operation and maintenance (O&M) such as tree trimming,
rendering the electric infrastructure in those regions more vulnera-
ble to severe-weather impacts.
b) Prolonged outage durations in these regions also suggest that utilities
do not often prioritize those regions in the restoration efforts.
c) Moreover, in a post disaster situation, accessibility of the restoration
crews to the affected electric infrastructure facilities is also an issue.
In most of the instances, it has been observed that rural regions re-
ceive less priority in terms of disaster recovery efforts compared to
the urban areas; these areas often experience sustained periods of
road blockage and poor road conditions that hinders the timely ac-
cess of restoration crews to the affected facilities. This might also
lead to longer recovery periods and prolonged outage durations in

S. Mukherjee et al. Reliability Engineering and System Safety 175 (2018) 283–305
Fig. 21. Influence of % commercial electricity consumption on the Level-3 outages (rug lines on the x -axis indicate prevalence of data points; black curve is the
average marginal effect of the predictor variable; red lines indicate the 95% confidence intervals). (For interpretation of the color codes in this figure legend, the
reader is referred to the web version of the article.)
4
t
s
c
a
d
t
p
t
(
l
s
W
t
t
A
r
a
t
i
a
l
b
s
h
L
p
i
c
f
s
4
d
n
t
i
o
4
a
s
n
s
w
t
o
o
s
p
t
e
c
(
a
p
l
s
(
V
e
s
i
i
p
i
v
(
4
d
p
a
c
t
r
i
c
.4.5. Percentage of commercial electricity consumption in the state
Percentage commercial electricity consumption refers to the propor-
ion of total electricity consumption that is demanded by the commercial
ectors in the state for their continuous operation. The percent commer-
ial consumption can serve as a proxy for the extent of metropolitan
reas in the state. The rationale here is that higher commercial load in-
icates higher number of commercial activities in the state, which in
urn is correlated with higher proportions of metropolitan areas as com-
ared to the rural areas.
The marginal association between commercial electricity consump-
ion and prolonged outage duration shows two distinct patterns
Fig. 21 ): (i) A decreasing trend for states with commercial consumption
ess than the national average (36%); and, (ii) an increasing trend for
tates with commercial consumptions higher than the national average.
e hypothesize that in the states with higher proportions of metropoli-
an regions, the probability of severe-weather induced failures cascading
hrough the network maybe greater, due to higher load on the system.
nother reason for such prolonged outage durations might be due to
estricted tree trimming activities. Although, investing in tree trimming
ctivities in these areas may not be an issue, getting permission from
he local people could sometimes hinder the operation. This is because
n metropolitan areas, the communities are generally more concerned
bout aesthetics of the surrounding landscapes [91] . For instance, states
ike New York (NY), New Jersey (NJ) and Florida (FL) are characterized
y multiple important metropolitan areas with higher population den-
ities are vulnerable to such prolonged outage durations. On the other
and, states with less pockets of metropolitan areas, such as Texas (TX),
ouisiana (LA), Ohio (OH), Pennsylvania (PA) have also witnessed such
rolonged power outages, but the extent of power outages experienced
s comparatively lower than the other states mentioned. In both the
ases, hurricanes/tornadoes and snow/ice/winter-storms are the most
requently occurring natural disasters that have affected most of these
tates.
.5. Risk factors associated with higher number of customers affected
uring extreme event impacts
The partial dependencies between the top five predictors and the
umber of customers affected per 100,000 population in the states of
he U.S., during severe weather induced power outages, are described
n this section. The response variable here is the log-transformed value
f the number of customers affected per 100,000 population.
300
.5.1. Total customers served in the state
The vulnerability of a states —in terms of higher number of customers
ffected during disasters —is related to the total number of customers
erved in the state. This risk predictor in the model refers to the total
umber of customers that are served by the utility companies in the
tate, and not the total population of the state. This result is consistent
ith previous studies on the subject that identified the fraction of cus-
omers served by the utility as a key predictor of natural hazard-induced
utages [13,44,92] . The partial dependency between the total number
f customers served in the state and the number of customers affected
hows a distinct step-function ( Fig. 22 ). Interestingly, from an overall
erspective, the relationship shows a decreasing trend, i.e., we observe
hat less populated states appear to be most vulnerable in terms of losing
lectricity services. Less populated states tend to have lower number of
ities and metropolitan areas, higher proportion of residential customers
relative to the commercial and industrial customers), lower economic
ctivities (in terms of industrial and commercial production), and ex-
ansive rural areas. As discussed before, these regions tend to receive
ess priority from the utilities in terms of capital investments in expan-
ion and hardening or in expenditure for operations and maintenance
O&M) such as tree trimming.
As observed from Fig. 22 , Maine (ME), Nebraska (NE) and West
irginia (WV) are among the most vulnerable states that experi-
nced highest proportion of customers affected mostly impacted by
now/ice/winter-storms and hurricanes/tornadoes. However, the states
n the middle zone or the extreme zone are not necessarily resilient dur-
ng hazards, since they still have experienced sustained outages in the
ast. This relationship only shows a pattern in the marginal effect, which
ndicates that less populated states are more vulnerable to electricity ser-
ice failure than the moderately populated of highly, populated states
Fig. 22 ).
.5.2. Electricity price
Electricity price is typically set to reflect the cost of electricity pro-
uction and delivery. While electric utilities have financial liability to
rovide reliable services and implement timely restorations after a dis-
ster event, most of the cost usually must be recovered back from the
onsumers. The partial dependency between electricity price and cus-
omers affected shows a distinct step function (refer to Fig. 23 ): (a) the
egion below the threshold value of 13.5 cents/KWh (national average
n electricity price), where little variation is observed on the density of
ustomers affected for the range of electricity price values; and, (b) the
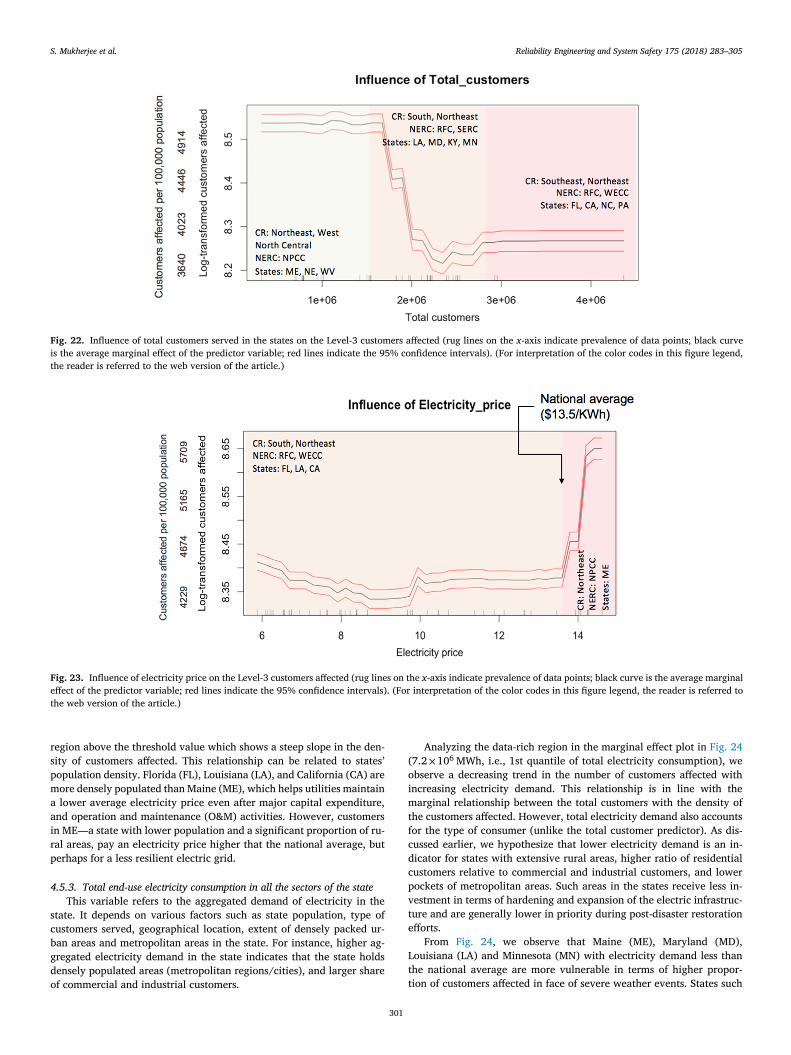
S. Mukherjee et al. Reliability Engineering and System Safety 175 (2018) 283–305
Fig. 22. Influence of total customers served in the states on the Level-3 customers affected (rug lines on the x -axis indicate prevalence of data points; black curve
is the average marginal effect of the predictor variable; red lines indicate the 95% confidence intervals). (For interpretation of the color codes in this figure legend,
the reader is referred to the web version of the article.)
Fig. 23. Influence of electricity price on the Level-3 customers affected (rug lines on the x -axis indicate prevalence of data points; black curve is the average marginal
effect of the predictor variable; red lines indicate the 95% confidence intervals). (For interpretation of the color codes in this figure legend, the reader is referred to
the web version of the article.)
r
s
p
m
a
a
i
r
p
4
s
c
b
g
d
o
(
o
i
m
t
f
c
d
c
p
v
t
e
L
t
t
egion above the threshold value which shows a steep slope in the den-
ity of customers affected. This relationship can be related to states’
opulation density. Florida (FL), Louisiana (LA), and California (CA) are
ore densely populated than Maine (ME), which helps utilities maintain
lower average electricity price even after major capital expenditure,
nd operation and maintenance (O&M) activities. However, customers
n ME —a state with lower population and a significant proportion of ru-
al areas, pay an electricity price higher that the national average, but
erhaps for a less resilient electric grid.
.5.3. Total end-use electricity consumption in all the sectors of the state
This variable refers to the aggregated demand of electricity in the
tate. It depends on various factors such as state population, type of
ustomers served, geographical location, extent of densely packed ur-
an areas and metropolitan areas in the state. For instance, higher ag-
regated electricity demand in the state indicates that the state holds
ensely populated areas (metropolitan regions/cities), and larger share
f commercial and industrial customers.
301
Analyzing the data-rich region in the marginal effect plot in Fig. 24
7.2 ×10 6 MWh, i.e., 1st quantile of total electricity consumption), webserve a decreasing trend in the number of customers affected with
ncreasing electricity demand. This relationship is in line with the
arginal relationship between the total customers with the density of
he customers affected. However, total electricity demand also accounts
or the type of consumer (unlike the total customer predictor). As dis-
ussed earlier, we hypothesize that lower electricity demand is an in-
icator for states with extensive rural areas, higher ratio of residential
ustomers relative to commercial and industrial customers, and lower
ockets of metropolitan areas. Such areas in the states receive less in-
estment in terms of hardening and expansion of the electric infrastruc-
ure and are generally lower in priority during post-disaster restoration
fforts.
From Fig. 24 , we observe that Maine (ME), Maryland (MD),
ouisiana (LA) and Minnesota (MN) with electricity demand less than
he national average are more vulnerable in terms of higher propor-
ion of customers affected in face of severe weather events. States such

S. Mukherjee et al. Reliability Engineering and System Safety 175 (2018) 283–305
Fig. 24. Influence of total electricity consumption on the Level-3 customers affected (rug lines on the x -axis indicate prevalence of data points; black curve is the
average marginal effect of the predictor variable; red lines indicate the 95% confidence intervals). (For interpretation of the color codes in this figure legend, the
reader is referred to the web version of the article.)
Fig. 25. Influence of per capita real GSP (relative to the U.S.) on the Level-3 customers affected (rug lines on the x -axis indicate prevalence of data points; black
curve is the average marginal effect of the predictor variable; red lines indicate the 95% confidence intervals). (For interpretation of the color codes in this figure
legend, the reader is referred to the web version of the article.)
a
w
s
t
S
t
p
4
c
t
f
s
r
s
e
G
e
o
b
(
f
n
c
f
4
t
o
t
s
o
g
o
s
t
t
i
s Florida (FL), California (CA), Kentucky (KY) and Pennsylvania (PA)
ith higher levels of electricity demand are also vulnerable to power
ervice disruptions, but are relatively less vulnerable in comparison
o Maine (ME), Maryland (MD), Louisiana (LA) and Minnesota (MN).
now/ice/winter-storms and hurricanes/tornadoes were found to be
he most frequently occurring severe-weather events causing extensive
ower outages in these regions.
.5.4. Relative per capita real GSP of the state as compared to the total per
apita real GDP of the U.S
This predictor is a proxy for the economic health of the state from
he perspective of total economic output production. It is measured as a
raction of the per capita gross domestic product of the state (GSP) mea-
ured in 2009 real dollars to that of the entire U.S. (GDP). The marginal
elationship between this predictor and the density of customers affected
hows a step function. The relationship indicates that the customers in
conomically ‘poor’ states (with their GSP less than 75% of the U.S.
DP) such as South Carolina (SC) and West Virginia (WV) have experi-
nced a prolonged power outages in the face of severe-weather power
utage events ( Fig. 25 ). On the other hand, the customers in states with
302
etter economic health, such as Maine (ME), Florida (FL) and Louisiana
LA), show similar patterns —in terms of the fraction of customers af-
ected —and have experienced less impact in comparison. However, it is
oteworthy that these states are still vulnerable to such outages. Hurri-
anes/tornadoes and snow/ice/ winter storms are found to be the most
requently occurring disaster events causing such outages.
.5.5. State-level land percentages
State-level land percentage was found to be the second key predic-
or of prolonged outage duration and the fifth most important predictor
f the density of customers affected. As discussed earlier, this predic-
or serves as a proxy for the extent of overhead electric infrastructure
ystems. Fig. 26 shows the marginal relationship between percentage
f land area in each state and the density of customers affected. The
raph indicates that there is not a significant variation in the density
f customers affected with increased land percentage. However, we ob-
erve that states with lower land percentage (less than 84.3%, i.e. below
he 1st quartile of the land percent values) are relatively less vulnerable
han states with higher land percentage. Lower land percentage could
ndicate higher proportion of densely packed urban areas that tend to
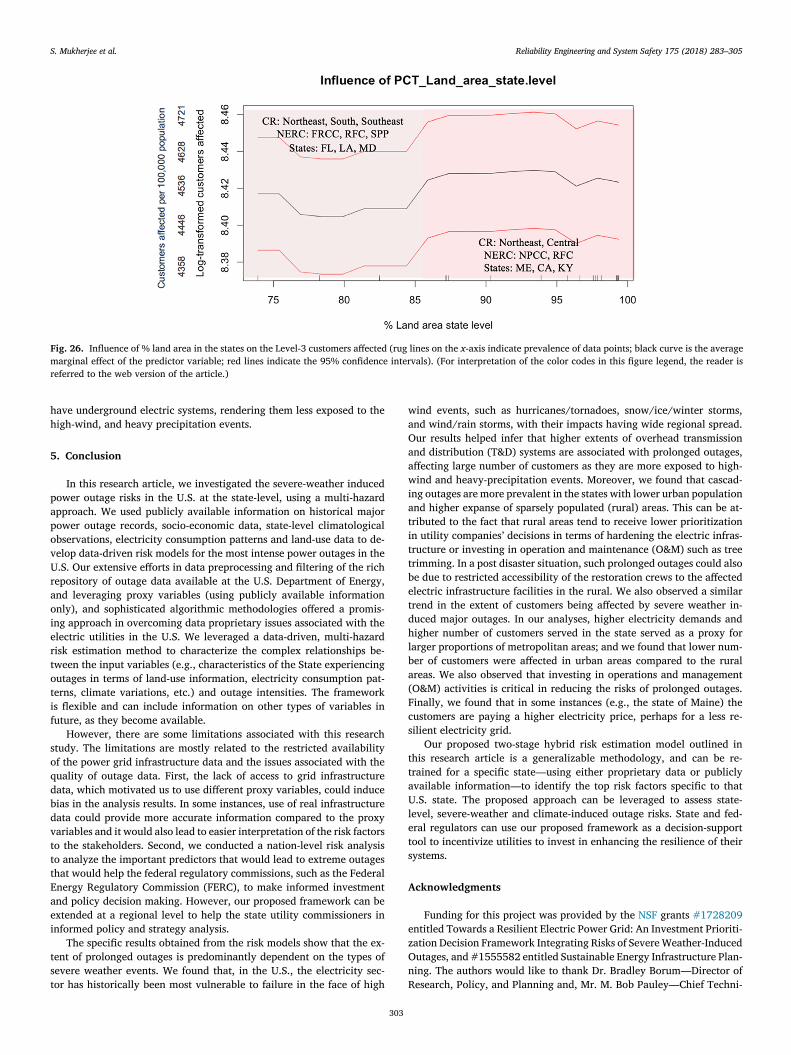
S. Mukherjee et al. Reliability Engineering and System Safety 175 (2018) 283–305
Fig. 26. Influence of % land area in the states on the Level-3 customers affected (rug lines on the x -axis indicate prevalence of data points; black curve is the average
marginal effect of the predictor variable; red lines indicate the 95% confidence intervals). (For interpretation of the color codes in this figure legend, the reader is
referred to the web version of the article.)
h
h
5
p
a
p
o
v
U
r
a
o
i
e
r
t
o
t
i
f
s
o
q
d
b
d
v
t
t
t
E
a
e
i
t
s
t
w
a
O
a
a
w
i
a
t
i
t
t
b
e
t
d
h
l
b
a
(
F
c
s
t
t
a
U
l
e
t
s
A
e
z
O
n
R
ave underground electric systems, rendering them less exposed to the
igh-wind, and heavy precipitation events.
. Conclusion
In this research article, we investigated the severe-weather induced
ower outage risks in the U.S. at the state-level, using a multi-hazard
pproach. We used publicly available information on historical major
ower outage records, socio-economic data, state-level climatological
bservations, electricity consumption patterns and land-use data to de-
elop data-driven risk models for the most intense power outages in the
.S. Our extensive efforts in data preprocessing and filtering of the rich
epository of outage data available at the U.S. Department of Energy,
nd leveraging proxy variables (using publicly available information
nly), and sophisticated algorithmic methodologies offered a promis-
ng approach in overcoming data proprietary issues associated with the
lectric utilities in the U.S. We leveraged a data-driven, multi-hazard
isk estimation method to characterize the complex relationships be-
ween the input variables (e.g., characteristics of the State experiencing
utages in terms of land-use information, electricity consumption pat-
erns, climate variations, etc.) and outage intensities. The framework
s flexible and can include information on other types of variables in
uture, as they become available.
However, there are some limitations associated with this research
tudy. The limitations are mostly related to the restricted availability
f the power grid infrastructure data and the issues associated with the
uality of outage data. First, the lack of access to grid infrastructure
ata, which motivated us to use different proxy variables, could induce
ias in the analysis results. In some instances, use of real infrastructure
ata could provide more accurate information compared to the proxy
ariables and it would also lead to easier interpretation of the risk factors
o the stakeholders. Second, we conducted a nation-level risk analysis
o analyze the important predictors that would lead to extreme outages
hat would help the federal regulatory commissions, such as the Federal
nergy Regulatory Commission (FERC), to make informed investment
nd policy decision making. However, our proposed framework can be
xtended at a regional level to help the state utility commissioners in
nformed policy and strategy analysis.
The specific results obtained from the risk models show that the ex-
ent of prolonged outages is predominantly dependent on the types of
evere weather events. We found that, in the U.S., the electricity sec-
or has historically been most vulnerable to failure in the face of high
303
ind events, such as hurricanes/tornadoes, snow/ice/winter storms,
nd wind/rain storms, with their impacts having wide regional spread.
ur results helped infer that higher extents of overhead transmission
nd distribution (T&D) systems are associated with prolonged outages,
ffecting large number of customers as they are more exposed to high-
ind and heavy-precipitation events. Moreover, we found that cascad-
ng outages are more prevalent in the states with lower urban population
nd higher expanse of sparsely populated (rural) areas. This can be at-
ributed to the fact that rural areas tend to receive lower prioritization
n utility companies’ decisions in terms of hardening the electric infras-
ructure or investing in operation and maintenance (O&M) such as tree
rimming. In a post disaster situation, such prolonged outages could also
e due to restricted accessibility of the restoration crews to the affected
lectric infrastructure facilities in the rural. We also observed a similar
rend in the extent of customers being affected by severe weather in-
uced major outages. In our analyses, higher electricity demands and
igher number of customers served in the state served as a proxy for
arger proportions of metropolitan areas; and we found that lower num-
er of customers were affected in urban areas compared to the rural
reas. We also observed that investing in operations and management
O&M) activities is critical in reducing the risks of prolonged outages.
inally, we found that in some instances (e.g., the state of Maine) the
ustomers are paying a higher electricity price, perhaps for a less re-
ilient electricity grid.
Our proposed two-stage hybrid risk estimation model outlined in
his research article is a generalizable methodology, and can be re-
rained for a specific state —using either proprietary data or publicly
vailable information —to identify the top risk factors specific to that
.S. state. The proposed approach can be leveraged to assess state-
evel, severe-weather and climate-induced outage risks. State and fed-
ral regulators can use our proposed framework as a decision-support
ool to incentivize utilities to invest in enhancing the resilience of their
ystems.
cknowledgments
Funding for this project was provided by the NSF grants #1728209
ntitled Towards a Resilient Electric Power Grid: An Investment Prioriti-
ation Decision Framework Integrating Risks of Severe Weather-Induced
utages, and #1555582 entitled Sustainable Energy Infrastructure Plan-
ing. The authors would like to thank Dr. Bradley Borum —Director of
esearch, Policy, and Planning and, Mr. M. Bob Pauley —Chief Techni-

S. Mukherjee et al. Reliability Engineering and System Safety 175 (2018) 283–305
c
C
b
D
a
t
t
R
al Advisor of Research, Policy, and Planning at the Indiana Regulatory
ommission (IURC) for their valuable insights, suggestions and feed-
ack on the research results. The authors would also like to thank Dr.
ouglas Gotham, Director of the State Utility Forecasting Group (SUFG)
t Purdue University for his valuable insights and for connecting the au-
hors with the Indiana Regulatory Commission that was invaluable for
his research.
eferences
[1] American Society of Civil Engineers, 2013. Report Card for America’s Infrastructure
http://2013.infrastructurereportcard.org/ [Accessed March 11.03.18].
[2] Knutson TR , McBride JL , Chan J , Emanuel K , Holland G , Landsea C , et al. Tropical
cyclones and climate change. Nat Geosci 2010;3:157–63 .
[3] Jagger TH , Elsner JB . Climatology models for extreme hurricane winds near the
United States. J Clim 2006;19:3220–36 .
[4] Emanuel K . Increasing destructiveness of tropical cyclones over the past 30 years.
Nature 2005;436:686–8 .
[5] Elsner JB , Kossin JP , Jagger TH . The increasing intensity of the strongest tropical
cyclones. Nature 2008;455:92–5 .
[6] Elsner JB , Jagger T , Niu X-F . Changes in the rates of North Atlantic major hurricane
activity during the 20th century. Geophys Res Lett 2000;27:1743–6 .
[7] Elsner JB , Jagger TH . A hierarchical Bayesian approach to seasonal hurricane mod-
eling. J Clim 2004;17:2813–27 .
[8] Elsner JB , Jagger TH . Prediction models for annual US hurricane counts. J Clim
2006;19:2935–52 .
[9] Elsner JB , Jagger TH . United States and Caribbean tropical cyclone activity related
to the solar cycle. Geophys Res Lett 2008;35(18):L18705 .
[10] Elsner JB , Jagger TH , Fogarty EA . Visibility network of United States hurricanes.
Geophys Res Lett 2009;36(16):L16702 .
[11] Mukherjee S , Hastak M . A novel methodological approach to estimate the impact
of natural hazard-induced disasters on country/region-level economic growth. Int J
Disaster Risk Sci 2017;9(1):1–12 .
[12] Mukherjee S . Towards a resilient grid: a risk-based decision analysis incorporating
the impacts of severe weather-induced power outages. Purdue University; 2017 .
[13] Staid A, Guikema SD, Nateghi R, Quiring SM, Gao MZ. Simulation of tropical cy-
clone impacts to the U.S. power system under climate change scenarios. Clim Change
2014;127:535–46. doi: 10.1007/s10584-014-1272-3 .
[14] Nateghi R , Guikema SD , Quiring SM . Forecasting hurricane-induced power outage
durations. Nat Hazards 2014;74:1795–811 .
[15] Nateghi R, Guikema S, Quiring SM. Power outage estimation for tropical cy-
clones: improved accuracy with simpler models. Risk Anal 2014;34:1069–78.
doi: 10.1111/risa.12131 .
[16] Mukherjee S, Nateghi R. Climate sensitivity of end-use electricity consumption in
the built environment: an application to the state of Florida, United States. Energy
2017;128:688–700. doi: 10.1016/j.energy.2017.04.034 .
[17] Nateghi R, Mukherjee S. A multi-paradigm framework to assess the impacts
of climate change on end-use energy demand. PLoS One 2017;12:e0188033.
https://doi.org/10.1371/journal.pone.0188033 .
[18] Lokhandwala M, Nateghi R. Leveraging advanced predictive analytics to as-
sess commercial cooling load in the U.S.. Sustain Prod Consum 2018;14:66–81.
https://doi.org/10.1016/j.spc.2018.01.001 .
[19] Mukherjee S, Nateghi R. Estimating climate-demand nexus to support long-term ad-
equacy planning in the energy sector. In: Proceedings of 2017 IEEE power & energy
society general meeting; 2018. p. 1–5. doi: 10.1109/PESGM.2017.8274648 .
[20] Climate Central. Blackout: extreme weather, climate change and power out-
ages. Princeton, NJ: 2014. < http://www.ourenergypolicy.org/wp-content/uploads/
2014/04/climate-central.pdf > [Accessed 11 01 2018].
[21] DOE. U.S. energy sector vulnerabilities to climate change and extreme weather.
2013. http://www.dtic.mil/dtic/tr/fulltext/u2/a583709.pdf .
[22] Lee, B., Preston, F., & Green, G., Preparing for high-impact, low-probability events:
lessons from eyjafjallajökull (A Chatham house report). London, UK: The Royal In-
stitute of International Affairs, Chatham House (ISBN: 186203253X), 2012
[23] North American Electric Reliability Corporation, severe impact resilience: con-
siderations and recommendations, severe impact resilience task force, May 9,
2012. http://www.nerc.com/comm/OC/SIRTF%20Related%20Files%20DL/SIRTF_
Final_May_9_2012-Board_Accepted.pdf [Accessed 11.03 2018].
[24] Rudnick H . Impact of natural disasters on electricity supply [Guest editorial]. IEEE
Power Energy Mag 2011;2:22–6 .
[25] NOAA. Billion-dollar weather and climate disasters: table of events 2017.
https://www.ncdc.noaa.gov/billions/ [Accessed 14.02.2018].
[26] Electric Choice, 9 of the worst power outages in United States history, April 12,
2016, https://www.electricchoice.com/blog/worst-power-outages-in-united-states-
history/ [Accessed 11.03 2018].
[27] Campbell, R.J., Weather-related power outages and electricsystem resiliency,
congressional research service, August 28, 2012, https://fas.org/sgp/crs/misc/
R42696.pdf [Accessed 11.03 2018].
[28] Mukherjee S, Hastak M. Public utility commissions to foster resilience invest-
ment in power grid infrastructure. Procedia - Soc Behav Sci 2016;218:5–12.
http://dx.doi.org/10.1016/j.sbspro.2016.04.005 .
[29] Nateghi R , Guikema SD , Wu YG , Bruss CB . Critical assessment of the foundations
of power transmission and distribution reliability metrics and standards. Risk Anal
2016;36:4–15 .
304
[30] Winkler J , Duenas-Osorio L , Stein R , Subramanian D . Performance assessment of
topologically diverse power systems subjected to hurricane events. Reliab Eng Syst
Saf 2010;95:323–36 .
[31] Francis RA , Falconi SM , Nateghi R , Guikema SD . Probabilistic life cycle analysis
model for evaluating electric power infrastructure risk mitigation investments. Clim
Change 2011;106:31–55 .
[32] Kwasinski A., Chapman P.L., Krein P.T., Weaver W. Hurricane Katrina: damage as-
sessment of power infrastructure for distribution, telecommunication, and backup.
Grainger Center for Electric Machinery and Electromechanics Technical Report
2006.
[33] Reed DA , Kapur KC , Christie RD . Methodology for assessing the resilience of net-
worked infrastructure. IEEE Syst J 2009;3:174–80 .
[34] Reed DA , Powell MD , Westerman JM . Energy infrastructure damage analysis for
hurricane Rita. Nat Hazards Rev 2010;11:102–9 .
[35] Kwasinski A . Lessons from field damage assessments about communication networks
power supply and infrastructure performance during natural disasters with a focus
on Hurricane Sandy. FCC Work. Netw. Resiliency 2013;2013:1–36 .
[36] Comfort LK , Haase TW . Communication, coherence, and collective action the impact
of hurricane Katrina on communications infrastructure. Public Work Manag Policy
2006;10:328–43 .
[37] Davidson R, Liu H, Sarpong I, Sparks P, Rosowsky D. Electric power distribu-
tion system performance in carolina hurricanes. Nat Hazards Rev 2003;4:36–45.
doi: 10.1061/(ASCE)1527-6988(2003)4:1(36) .
[38] Kwasinski A, Weaver WW, Chapman PL, Krein PT. Telecommunications power plant
damage assessment for hurricane katrina-site survey and follow-up results. IEEE Syst
J 2009;3:277–87. doi: 10.1109/JSYST.2009.2026783 .
[39] Arab A , Khodaei A , Khator SK , Ding K , Emesih VA , Han Z . Stochastic pre-hurricane
restoration planning for electric power systems infrastructure. IEEE Trans Smart Grid
2015;6:1046–54 .
[40] Nateghi R, Quiring SM, Guikema SD, Quiring SM, Nateghi R, Quiring SM,
et al. Comparison and validation of statistical methods for predicting power
outage durations in the event of hurricanes. Clim Change 2014;31:1897–906.
doi: 10.1111/j.1539-6924.2011.01618.x .
[41] Nateghi R , Guikema S , Quiring SM . Power outage estimation for tropical cyclones:
Improved accuracy with simpler models. Risk Anal 2014;34:1069–78 .
[42] Nateghi R , Quiring SM , Guikema SD . Estimating the impact of climate variability
on cumulative hurricane destructive potential through data mining. In: Hurricanes
Climate Change. Springer; 2010. p. 231–52 .
[43] Nateghi R , Guikema SD . A comparison of top-down statistical models with bot-
tom-up methods for power system reliability estimation in high wind events. Vul-
nerability, uncertainty, and risk: analysis, modeling, and management. ASCE; 2011.
p. 594–601 .
[44] Guikema SD , Nateghi R , Quiring SM , Staid A , Reilly AC , Gao M . Predicting hurricane
power outages to support storm response planning. IEEE Access 2014;2:1364–73 .
[45] Nateghi R, Guikema SD, Quiring SM. Comparison and validation of statistical meth-
ods for predicting power outage durations in the event of hurricanes. Risk Anal
2011;31:1897–906. doi: 10.1111/j.1539-6924.2011.01618.x .
[46] Nateghi R . Multi-dimensional infrastructure resilience modeling: an application to
hurricane-prone electric power distribution systems. IEEE Access 2018;6:13478–89 .
[47] Araneda JC , Rudnick H , Mocarquer S , Miquel P . Lessons from the 2010 Chilean
earthquake and its impact on electricity supply. In: Proceedings of International
conference on power system technology (POWERCON), 2010. IEEE; 2010. p. 1–7 .
[48] Rose A , Benavides J , Chang SE , Szczesniak P , Lim D . The regional economic impact
of an earthquake: direct and indirect effects of electricity lifeline disruptions. J Reg
Sci 1997;37:437–58 .
[49] Rose A , Guha G-S . Computable general equilibrium modeling of electric utility life-
line losses from earthquakes. In: Modeling spatial and economic impacts of disasters.
Springer; 2004. p. 119–41 .
[50] Shinozuka M , Chang SE . Evaluating the disaster resilience of power networks and
grids. In: Modeling spatial and economic impacts of disasters. Springer; 2004.
p. 289–310 .
[51] Adachi T , Ellingwood BR . Serviceability of earthquake-damaged water systems: ef-
fects of electrical power availability and power backup systems on system vulnera-
bility. Reliab Eng Syst Saf 2008;93:78–88 .
[52] Massie A , Watson NR . Impact of the Christchurch earthquakes on the electrical
power system infrastructure. Bull New Zeal Soc Earthq Eng 2011;44:425–30 .
[53] Xu N , Guikema SD , Davidson RA , Nozick LK , Ça ğnan Z , Vaziri K . Optimizing schedul-
ing of post ‐earthquake electric power restoration tasks. Earthq Eng Struct Dyn
2007;36:265–84 .
[54] Han S-R , Guikema SD , Quiring SM , Lee K-H , Rosowsky D , Davidson RA . Estimating
the spatial distribution of power outages during hurricanes in the Gulf coast region.
Reliab Eng Syst Saf 2009;94:199–210 .
[55] Liu H , Davidson RA , Apanasovich T V . Spatial generalized linear mixed models
of electric power outages due to hurricanes and ice storms. Reliab Eng Syst Saf
2008;93:897–912 .
[56] Liu H , Davidson RA , Apanasovich T V . Statistical forecasting of electric
power restoration times in hurricanes and ice storms. IEEE Trans Power Syst
2007;22:2270–9 .
[57] Ça ğnan Z , Davidson RA , Guikema SD . Post-earthquake restoration planning for Los
Angeles electric power. Earthq Spectra 2006;22:589–608 .
[58] Cagnan Z , Davidson RA . Discrete event simulation of the post-earthquake restoration
process for electric power systems. Int J Risk Assess Manag 2007;7:1138–56 .
[59] LaRocca S , Johansson J , Hassel H , Guikema S . Topological performance measures
as surrogates for physical flow models for risk and vulnerability analysis for electric
power systems. Risk Anal 2015;35:608–23 .

S. Mukherjee et al. Reliability Engineering and System Safety 175 (2018) 283–305
[
[
[
[
[
[
[
[
[
60] Johansson J , LaRocca S , Hassel H , Guikema S . Comparing topological performance
measures and physical flow models for vulnerability analysis of power systems. In:
International probabilistic safety assessment and management conference and the
annual European safety and reliability conference 2012 (PSAM11 ESREL 2012);
2012. p. 6863–72 .
61] LaRocca S , Guikema SD . Characterizing and predicting the robustness of power-law
networks. Reliab Eng Syst Saf 2015;133:157–66 .
62] Holmgren AJ. Using graph models to analyze the vulnerability of electric power
networks. Risk Anal 2006;26:955–69. doi: 10.1111/j.1539-6924.2006.00791.x .
63] Hodler TW . Residents’ preparedness and response to the Kalamazoo tornado. Disas-
ters 1982;6:44–9 .
64] Rocchetta R, Li YF, Zio E. Risk assessment and risk-cost optimization of distributed
power generation systems considering extreme weather conditions. Reliab Eng Syst
Saf 2015;136:47–61. http://doi.org/10.1016/j.ress.2014.11.013 .
65] Ward DM . The effect of weather on grid systems and the reliability of electricity
supply. Clim Change 2013;121:103–13 .
66] Rothstein B , Halbig G . Weather sensitivity of electricity supply and data services
of the German Met Office. In: Troccoli A, editor. Management of Weather and Cli-
mate Risk in the Energy Industry. NATO Science for Peace and Security Series C:
Environmental Security. Springer, Dordrecht; 2010. p. 253–66 .
67] Nateghi R , Reilly Allison . All-hazard approaches to infrastructure risk reduction: ef-
fective investments through pluralism. Safety and reliability–theory and applications
Bri š 2017. Marko Cepin, Radim Bris, editors, London: Taylor and Fransic Group. CRC
Press; 2017. 540 Pages (accepted for publication). doi:9781-1-138-62937-0 .
68] Hines P, Apt J, Talukdar S. Large blackouts in North America: his-
torical trends and policy implications. Energy Policy 2009;37:5249–59.
doi: 10.1016/j.enpol.2009.07.049 .
[69] DOE. Electric disturbance events (OE-417) annual summaries. Office of Electric-
ity Delivery and Energy Reliability 2016. < https://www.oe.netl.doe.gov/OE417_
annual_summary.aspx> [Accessed 16.09 16].
[70] DOE, Office of Electricity Delivery and Energy Reliability, Electric Disturbance
Events (OE-417), < https://www.oe.netl.doe.gov/oe417.aspx > [Accessed 11.03
18].
[71] Fisher E, Eto JH, LaCommare KH. Understanding bulk power reliability: the im-
portance of good data and a critical review of existing sources. In: Proceedings
of the Hawaii international conference on system sciences; 2012. p. 2159–68.
doi: 10.1109/HICSS.2012.611 .
[72] U.S.-Canada Power System Outage Task Force, Final report on the August 14,
2003 blackout in the United States and Canada: causes and recommendations,
2004, < https://www.energy.gov/sites/prod/files/oeprod/DocumentsandMedia/
BlackoutFinal-Web.pdf > [Accessed March 11], 2018.
[73] Mukherjee S., Nateghi R., Hastak M. Data on Severe Weather-Induced Major Power
Outages in the Continental U.S. Data Br 2018:(submitted).
[74] Krancer M. Did big energy just make us safer from terrorism or cyber at-
tacks on the U.S. electrical grid. APR 2016;20. https://www.forbes.com/sites/
michaelkrancer/2016/04/20/did-big-energy-just-make-us-safer-from-terrorism-or-
cyber-attacks-on-the-u-s-electrical-grid/#649586134de8 [Accessed 11.03 18] .
305
[75] Guikema SD , Quiring SM . Hybrid data mining-regression for infrastructure risk as-
sessment based on zero-inflated data. Reliab Eng Syst Saf 2012;99:178–82 .
[76] Hastie T , Tibshirani R , Friedman JH . The elements of statistical learning. Second.
Springer; 2008 .
[77] James G , Witten D , Hastie T , Tibshirani R . An introduction to statistical learning,
Vol. 112. New York: Springer; 2013 .
[78] Caruana R , Niculescu-Mizil A . An empirical comparison of supervised learning algo-
rithms. In: Proceedings of the international conference on machine learning. ACM;
2006. p. 161–8 .
[79] Fradkin D , Muchnik I . Support vector machines for classification. DIMACS Ser Dis-
cret Math Theor Comput Sci 2006;70:13–20 .
[80] Hsu C.-W., Chang C.-C., Lin C.-J. A practical guide to support vector classifica-
tion 2003, https://www.csie.ntu.edu.tw/ ∼cjlin/papers/guide/guide.pdf [Accessed12.03 18].
[81] Gunn SR . Support vector machines for classification and regression. ISIS Tech Rep
1998;14:85–6 .
[82] Furey TS , Cristianini N , Duffy N , Bednarski DW , Schummer M , Haussler D . Support
vector machine classification and validation of cancer tissue samples using microar-
ray expression data. Bioinformatics 2000;16:906–14 .
[83] Guyon I , Weston J , Barnhill S , Vapnik V . Gene selection for cancer classification
using support vector machines. Mach Learn 2002;46:389–422 .
[84] Tong S , Koller D . Support vector machine active learning with applications to text
classification. J Mach Learn Res 2001;2:45–66 .
[85] Breiman L. Random forests. Mach Learn 2001;45:5–32. doi: 10.1023/
A:1010933404324 .
[86] Kapelner A., Bleich J., bartmachine: machine learning with bayesian additive re-
gression trees, 2013, https://arxiv.org/pdf/1312.2171.pdf [Accessed 11.03 18].
[87] Kousky C., Informing climate adaptation: a review of the economic costs of nat-
ural disasters, their determinants, and risk reduction options (July 2, 2012).
Resources for the Future Discussion Paper No. 12-28, Available at SSRN:
https://ssrn.com/abstract = 2099769 or http://dx.doi.org/10.2139/ssrn.2099769 . [88] Kousky C . Informing climate adaptation: a review of the economic costs of natural
disasters. Energy Econ 2014;46:576–92 .
[89] WPPI Energy Radial, loop and networked systems. Fundam Electr 2013.
https://c03.apogee.net/contentplayer/?coursetype = foe&utilityid = wppi&id = 4481 (accessed September 6, 2017) .
[90] National Weather Service: NOAA, Worst Kansas Ice Storms, 2017, https://www.
weather.gov/ict/ks_worse_ice_storms [Accessed 11.03 18].
[91] IURC . Interview with the Indiana Utility Regulatory Commission (IURC). In: Pro-
ceedings of meeting held on April 5th, 2017; 2017 .
[92] Nateghi R, Guikema SD, Quiring SM. Forecasting hurricane-induced power outage
durations. Nat Hazards 2014;74:1795–811. doi: 10.1007/s11069-014-1270-9 .
[93] James G , Witten D , Hastie T , Tibshirani R . An introduction to statistical learn-
ing–with Applications in R. Springer; 2013 .